Abstract
The nationwide lockdown due to the COVID-19 pandemic in 2020 reduced industrial and human activities in China. In this study, we investigate atmospheric carbon monoxide (CO) concentration changes during the lockdown from observations at the surface and from two satellites (TROPOspheric Monitoring Instrument (TROPOMI) and Infrared Atmospheric Sounding Interferometer (IASI)). It is found that the average CO surface concentration in 2020 was close to that in 2019 before the lockdown, and became 18.7% lower as compared to 2019 during the lockdown. The spatial variation of the change in the CO surface concentration is high, with an 8–27% reduction observed for Beijing, Shanghai, Chengdu, Zhengzhou, and Guangzhou, and almost no change in Wuhan. The TROPOMI and IASI satellite observations show that the CO columns decreased by 2–13% during the lockdown in most regions in China. However in South China, there was an 8.8% increase in the CO columns observed by TROPOMI and a 36.7% increase observed by IASI, which is contrary to the 23% decrease in the surface CO concentration. The enhancement of the CO column in South China is strongly affected by the fire emissions transported from Southeast Asia. This study provides an insight into the impact of COVID-19 on CO concentrations both at the surface and in the columns in China, and it can be extended to evaluate other areas using the same approach.
1. Introduction
The COVID-19 worldwide pandemic has caused millions of deaths, reported by the World Health Organization (WHO) coronavirus disease dashboard. The first COVID-19 patient was detected in Wuhan, Hubei Province, China, in December 2019, and then the disease quickly spread to the whole country before the Chinese New Year 2020 [1]. To prevent the further spread of the outbreak, the Chinese government carried out a nationwide lockdown starting on 23 January 2020 in Wuhan and extending rapidly (in 6 days) to all other provinces [2]. The lockdown outside of Hubei province was eased at the beginning of March, while it continued to 25 March for Hubei province and to 8 April for Wuhan [3].
The strict measures related to COVID-19 had a large impact on economic activities, including energy production, industrial activities, and transportation [4,5]. As a result, the emissions of many atmospheric components were significantly reduced [6,7,8,9]. There was a 3.7% decrease in Chinese carbon dioxide (CO) emissions in the first half of 2020 related to the COVID-19 pandemic [10]. The reduction mainly occurred in January and February, and the CO emissions in March returned to the emission level of 2019 [11] as the lockdowns were gradually relaxed. Bauwens et al. reported an average 40% decrease in nitrogen dioxide (NO) column concentration from satellite measurements over Chinese cities due to measures against the coronavirus outbreak [12]. Based on NO surface observations, Feng et al. pointed out that nitrogen oxide (NO) emissions were reduced by 36% in China due to the COVID-19 lockdown measures [13].
CO is a pollutant that also plays an important role in atmospheric chemistry, e.g., the formation of tropospheric ozone. CO is predominantly removed by OH [14], and the lifetime of CO is relatively long (weeks to months) as compared to other air pollutants [15]. The main atmospheric CO sources are anthropogenic emissions and biomass burning [16], primarily when carbon fuels are not burned completely. According to the Emissions Database for Global Atmospheric Research (EDGAR) v5.0 [17], the anthropogenic CO emissions in China are dominated by residential cooking and heating, and combustion for manufacturing, the power industry, and road transportation.
Previous studies have been carried out to understand the reduction in CO surface concentration due to the COVID-19 lockdown in China on city and regional scales. There was an average 22.7% decrease in the CO surface concentration in Wuhan during the lockdown as compared to the period before lockdown [18]. Shi and Brasseur found that the CO surface concentration during the lockdown decreased from 1.2–1.5 to 0.7–1.0 mg/m before the lockdown in northern China [19]. However, there is a large seasonal variation in CO surface concentrations in eastern Asia, with a maximum in winter and a minimum in summer [20], which has not been taken into account in the these studies. The atmospheric compositions can also be observed by the satellite remote sensing technique using their absorption or emission spectra, which has been applied to understand the CO column changes due to the COVID-19 lockdown in China [21,22]. It is important to compare the CO concentration changes observed by the surface and satellite measurements. However, to our knowledge, few studies have been performed to investigate this. Here, we aim at looking into the changes in CO concentration due to the COVID-19 lockdown in China using both surface and satellite observations, and investigating whether CO reduction can be observed by both surface and satellite observations. The data and method are presented in Section 2. To reduce the impact from the seasonal variation of CO, the observations in 2020 are compared to similar observations in 2019. In Section 3, the changes in CO surface concentrations in China and the variations at six megacities are discussed. In addition, the column-averaged dry-air mole fraction of CO (XCO) observed from the TROPOspheric Monitoring Instrument (TROPOMI) onboard the Sentinel 5 Precursor (S5P) satellite and the CO column observed from the Infrared Atmospheric Sounding Interferometer (IASI) onboard the Meteorological Operational (Metop)-B satellite are analyzed and compared to the surface measurements. The discussions about the results as well as the limitations of this study are carried out in Section 4 and the conclusions are drawn in Section 5.
2. Materials and Methods
2.1. Data
Hourly CO surface observations are carried out at air pollution monitoring sites by the Ministry of Ecology and Environment of China (http://www.mee.gov.cn/, accessed on 10 March 2021). The CO concentration is reported in units of mg/m. In this study, we used the sites where observations were available in both 2019 and 2020: we found 1375 sites in China (Figure 1), including 12 sites at Beijing, 10 sites at Shanghai, 11 sites at Wuhan, 10 sites at Chengdu, 9 sites at Zhengzhou, and 12 sites at Guangzhou. Note that few sites were in western China, and most sites were located in highly polluted regions with large CO anthropogenic emissions.
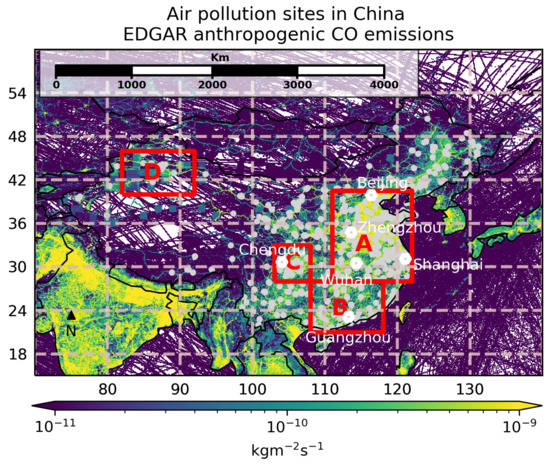
Figure 1.
The location of the air pollution sites (light gray dots), six megacities (white hexagons) and regions (red boxes), together with the CO anthropogenic emission annual mean in 2015 from the Emissions Database for Global Atmospheric Research (EDGAR) v5.0 inventory.
The offline level 2 CO product from the TROPOMI was used in this study, which was downloaded from https://scihub.copernicus.eu/ accessed on 10 March 2021. The XCO product was retrieved from the 2.3 m spectral range of the shortwave infrared solar radiance measurements under clear-sky conditions; it is sensitive to the tropospheric boundary layer [23]. The spatial resolution of the TROPOMI XCO observations was 7.2 × 7.2 km for the footprint at nadir before 6 August 2019 and changed to 7.2 × 5.6 km afterwards. The overpass time was about 13:00. The TROPOMI CO level 2 measurements were filtered out with the qa_value less than 0.5, which is recommended by the user guide (https://sentinel.esa.int/documents/247904/3541451/Sentinel-5P-Carbon-Monoxide-Level-2-Product-Readme-File, accessed on 10 March 2021). After that, the daily TROPOMI level 2 observations were binned to 0.05× 0.05 (latitude by longitude) grids as the level 3 data, and we studied the CO changes based on these level 3 daily products.
The IASI level 2 CO column dataset was processed using the Fast Optimal Retrievals on Layers for IASI (FORLI) software [24] by the Université Libre de Bruxelles, Laboratoire Atmosphères, Milieux, Observations Spatiales (ULB-LATMOS) before 14 May 2019 (v20140922) and by the European Organisation for the Exploitation of Meteorological Satellites (EUMETSAT) afterward (v6.5.0), which was downloaded from https://iasi.aeris-data.fr/cos_iasi_b_arch/ accessed on 10 March 2021. The field of view at nadir of the IASI instrument is about 12 km. The CO is retrieved from the thermal infrared spectra in the spectral range 4.58 to 4.69 m, so that IASI CO product is more sensitive to the mid- and upper-troposphere, and less sensitive to the lower-troposphere [25]. IASI provides both daytime and nighttime CO measurements (9:30 and 21:30). As the diurnal variation in CO at the mid- and upper-troposphere is much weaker than for the surface, we used both daytime and nighttime IASI CO observations to generate the 0.5× 0.5 daily product.
As fire emissions are an important source of CO, we used the Visible Infrared Imaging Radiometer Suite (VIIRS) 375 m data [26] onboard the Suomi National Polar-Orbiting Partnership (Suomi NPP) satellite to understand the fire impacts in 2019 and 2020. The VIIRS sensor has a swath width of 3060 km, which is able to provide complete coverage of the Earth everyday. There are 22 spectral channels, between 0.412 m and 12.01 m: 16 channels are moderate resolution bands (M-bands), which have a spatial resolution of 750 m at the nadir; 5 channels are imaging resolution bands (I-bands), which have a spatial resolution of 375 m at the nadir; 1 channel is a one day/night panchromatic band with a spatial resolution of 750 m [27]. The VIIRS fire data were download from https://firms.modaps.eosdis.nasa.gov/ accessed on 10 March 2021.
Apart from the measurements, four emission datasets were used to understand the CO anthropogenic and wildfire fluxes in China. The EDGAR v5.0 and the Regional Emission Inventory in Asia (REAS) v3.2 [28] were used to estimate the CO anthropogenic emissions in China. Note that both the EDGAR v5.0 and the REAS v3.2 only hold data up to 2015 for CO, and there is no information about the CO anthropogenic emissions in 2019 and 2020. The Global Fire Assimilation System (GFAS) [29] and the Fire Inventory from NCAR (FINN) [30] were used to understand the CO wildfire emissions. The GFAS and FINN data are up to date and available for both 2019 and 2020, as they use satellite measurements as the inputs. For both the anthropogenic and wildfire emissions, two datasets were compared to each other to assess the uncertainty.
2.2. Method
The surface and satellite CO data in 2020 were compared to similar observations in 2019 during four periods: the month before the Chinese New Year (BCNY; before lockdown), the month after the Chinese New Year (ACNY; lockdown), the month between 11 March and 10 April (3/11–4/10), and the month between 11 April and 10 May (4/11–5/10). To reduce the impact of the Spring Festival, the national holidays in 2019 (4 February to 10 February) and 2020 (24 January to 2 February) were not considered in our study. We considered that in 2019, BCNY was between 1 January and 3 February, and ACNY was between 11 February and 10 March, and that in 2020, BCNY was between 1 January and 23 January, and ACNY was between 3 February and 10 March. From 3/11–4/10, the lockdown was relaxed at most places in China except Hubei Province, and from 4/10–5/10, the lockdown was officially ended throughout the whole of China. The four periods in 2019 and 2020 are summarized in Figure 2.
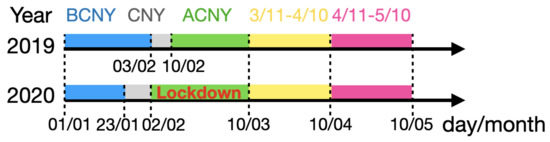
Figure 2.
The four periods (before the Chinese New Year (BCNY), after the Chinese New Year (ACNY), 3/11–4/10, and 4/11–5/10) in 2019 and 2020. Note that the Chinese New Year (CNY) national holiday was not considered in this study.
According to the European Centre for Medium-Range Weather Forecasts (ECMWF) ERA5 reanalysis data, the winds at 850 hPa above China during these four periods, especially for the first three periods, were similar in 2019 and 2020 (Figure S1). The layer at 850 hPa (about 1.5 km a.s.l.) is between the lower troposphere and the free atmosphere, as it is close to the Planetary Boundary Layer (PBL) height. On a small scale, such as in a city, the winds in 2019 and 2020 could be very different, but the winds in 2019 and 2020 were generally similar in both wind speed and wind direction on a large scale, such as for the whole of China. Therefore, it is indicated that the changes in CO concentration during the COVID-19 lockdown on the national scale had limited influence from meteorological conditions.
The relative difference in CO concentration at the surface observed by the air pollution sites or in the column observed by the satellite measurements during these periods between 2020 and 2019 was calculated as (). Then, the mean and standard deviation (std) of the differences were derived from all measurement locations (sites or grids) within a city, a region, or the whole of China:
where N is the total number of locations and i is the index of the location. To reduce the impact from outliers, we also used the median when comparing CO changes at the surface with those in the column.
3. Results and Discussions
3.1. CO Surface Concentration
The CO surface concentrations during the four periods in 2019, together with the relative differences between 2020 and 2019, are shown in Figure 2. The mean CO concentrations were 1.21, 1.00, 0.74, 0.71 mg/m during BCNY, ACNY, 3/11–4/10, and 4/11–5/10 in 2019, respectively. There was a large month-to-month variation, and the average CO concentration during ACNY was about 17% less than that during BCNY in 2019.
The mean and std of the relative difference between 2020 and 2019 at all sites are 1.1 ± 24.3%, −18.7 ± 22.2%, −6.2 ± 20.2%, and −4.8 ± 23.6% during BCNY, ACNY, 3/11–4/10, and 4/11–5/10, respectively (Table 1). The CO concentrations during BCNY in 2019 and 2020 were at the same level. The mean difference during ACNY indicates that there was an 18.7% reduction in CO surface concentration due to the COVID-19 lockdown. The reduction in CO surface concentration is also observed for 3/11–4/10 and 4/11–5/10, but the amplitudes become much weaker as compared to that during ACNY. The large std (20–24%) suggests that the spatial variability of CO surface concentration changes across China is high, as CO is affected by local as well as transported emissions from hundreds and thousands of kilometers away due to its lifetime of weeks to months.

Table 1.
The mean and standard deviation (std) of the relative change in CO surface concentrations.
As the change in CO surface concentration varied with location (Figure 3), we investigated in detail six megacities (Beijing, Shanghai, Wuhan, Chengdu, Zhengzhou, and Guangzhou). The hourly means and stds of CO surface concentrations in these cities during the four periods in 2019 and 2020, together with their relative changes between 2020 and 2019, are shown in Figure 4. The diurnal variations of CO surface concentrations in these cities are similar, with two peaks around 10:00 and 24:00 local hours. During BCNY, the phase and amplitude of the diurnal variations in 2020 were close to those in 2019. During ACNY, except in Wuhan, the peak-to-peak amplitudes of the diurnal variations became smaller in 2020 as compared to 2019 despite the large stds. Large reductions of the CO surface concentrations of 20–27% are observed during ACNY at Shanghai, Chengdu, Zhengzhou, and Guangzhou. Reductions by 6–25% in the CO surface concentration are also observed from 3/11–4/10 in these cities. A reduction during BCNY is also observed in Guangzhou, but it is less significant as compared to that during ACNY. However in Beijing, the reduction of the CO surface concentration during ACNY was only 8%, which is less than the observed 12% reduction during BCNY and 16% reduction from 3/11–4/10. The relatively low reduction in CO during ACNY in Beijing was affected by the meteorological background. Previous studies found that the wind speed was decreased by 20% and the PBL heights were generally lower during the lockdown period as compared to the climatology for Beijing, leading to higher surface concentrations of atmospheric pollutants [31,32].
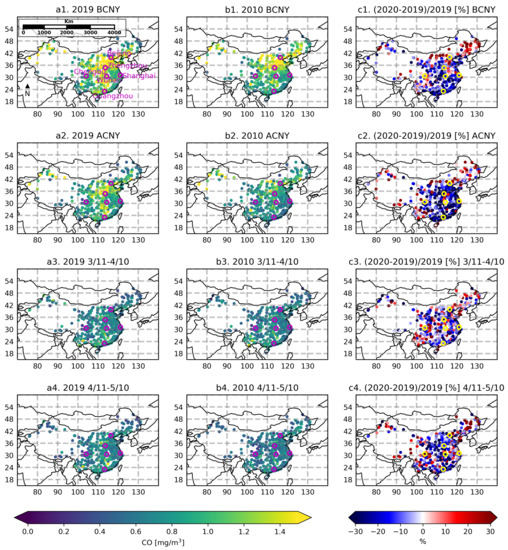
Figure 3.
The mean CO surface concentrations in units of mg/m observed at all sites in China during BCNY, ACNY, 3/11–4/10, and 4/11–5/10 in 2019 (first column) and 2020 (second column), together with their percentage differences between 2020 and 2019 ((2020–2019)/2019×100%) (third column). The six megacities are marked as the purple (a,b) and yellow (c) circles.
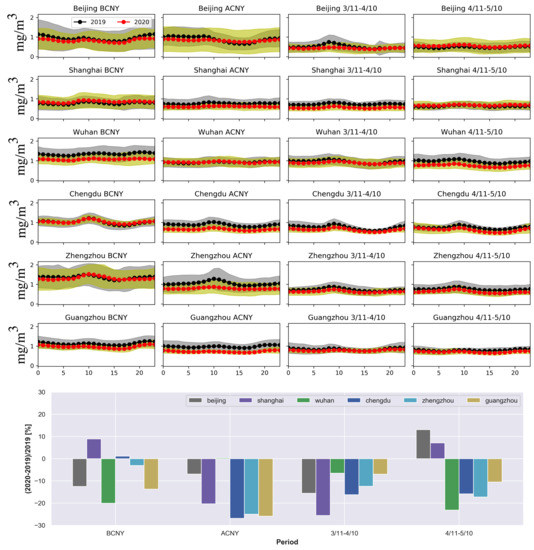
Figure 4.
Upper: the hourly means (solid line) and standard deviations (shadow) of CO surface concentrations observed in Beijing, Shanghai, Wuhan, Chengdu, Zhengzhou, and Guangzhou during BCNY (first column), ACNY (second column), 3/11–4/10 (third column), and 4/11–5/10 (last column) in 2019 and 2020. Lower: the relative changes in CO surface concentrations between 2020 and 2019 in these six megacities during BCNY, ACNY, 3/11–4/10, and 4/11–5/10.
The city of Wuhan shows a behavior that is different from the five other cities: the CO surface concentration in 2020 was even slightly larger than that in 2019 during ACNY but was about 20% less than that in 2019 during BCNY. As the city was hit heavily by the virus, the most strict measures were carried out in Wuhan. More than a 50% reduction in atmospheric NO concentrations was observed from both satellite measurements of column abundances [12] and surface in-situ observations [18] during the lockdown period. Apart from anthropogenic emissions, biomass burning is also an important CO source [33]. The VIIRS satellite observed many fires (burning or combustion at places giving out bright light, heat, and smoke) in Wuhan and in the northern area of Wuhan during BCNY, and the fires were almost extinguished during ACNY in 2019. In contrast to 2019, there was almost no fire observed during BCNY, but more fires existed during ACNY in 2020 (Figure S2). First, we looked at the CO wildfire emissions from the GFAS during BCNY and ACNY in 2019 and 2020. Consistent with VIIRS fire measurements, the CO wildfire emissions during BCNY in 2019 were higher than those in 2020, and the CO wildfire emissions during ACNY in 2019 were lower than those in 2020. However, the CO wildfire emissions were much lower as compared to the CO anthropogenic emissions from the EDGAR v5.0 and the REAS v3.2 around Wuhan (Figure S3). There were two things to be addressed there: (1) to assess the uncertainty of the CO wildfire emission, we compared the GFAS with the FINN. It was found that the difference between GFAS and FINN CO wildfire emissions around Wuhan was within 20%; (2) the anthropogenic CO emission from EDGAR v5.0 or REAS v3.2 was only available for 2015, and it was decreasing during the last decade in China with an annual change of about 3–4% [34]. Even though we took the 4%/year decrease in the CO anthropogenic emissions into account, the contributions from the CO wildfire emissions were still less than 1.0% of the CO anthropogenic emissions during ACNY and BCNY in 2019 and 2020 within the 1.0× 1.0 box around Wuhan. In summary, the change in CO surface concentration in Wuhan cannot be explained by the local wildfire emissions (biomass burning). Second, we looked at the concentrations of other air pollutants (NO, SO, PM, PM) in 2019 and 2020 in Wuhan (Figure S4). The averaged NO, SO, PM, PM concentrations during BCNY in 2020 were 17%, 9%, 34%, and 31% less than those in 2019. The decreases of those four air pollutants are consistent with the 20% decrease in CO during BCNY in 2020 as compared to 2019. The averaged NO, PM, PM concentrations in Wuhan during ACNY in 2020 were 51%, 43% and 42% less than those in 2019. However, SO and CO increased slightly during ACNY in 2020 as compared to 2019. The similar behavior of CO and SO suggests that these two gases come from common sources, e.g., the burning of fossil fuels by power plants and other industrial facilities. Finally, we looked at the VIIRS and MODIS fire observations inside Wuhan, where more fires were observed above a large coke factory (Wuhan Pingmei Wugang Joint Coking Company) during ACNY in 2020 as compared to 2019 (Figure S5). According to the sources of SO, CO, and NO in Asia [35], it is inferred that the CO and SO emissions from industry (such as the coke factory) during ACNY in 2020 were larger than the reduced emissions from road transportation.
3.2. CO Column Observed from Satellites
The TROPOMI XCO and IASI CO column measurements in 2019, together with the relative differences between 2020 and 2019 during the four periods, are shown in Figure 5. In general, the TROPOMI and IASI measurements have a similar spatial distribution in China. The means and stds of XCO observed by TROPOMI in 2019 in China are 110.1 ± 24.1, 109.7 ± 24.9, 113.3 ± 26.9, and 112.9 ± 22.8 ppb during the BCNY, ACNY, 3/11–4/10, and 4/11–5/10 periods, respectively. There is almost no change in the mean XCO in China during these four periods, which is different from the large month-to-month variation of CO surface concentration. The means and stds of CO columns observed by IASI in 2019 in China are 1.83 ± 0.47 × 10, 1.98 ± 0.50 × 10, 2.18 ± 0.54 × 10 and 2.25 ± 0.53 × 10 molecules/cm during BCNY, ACNY, 3/11–4/10, and 4/11–5/10 periods, respectively. The month-to-month change of the CO column is opposite to that observed at the surface.
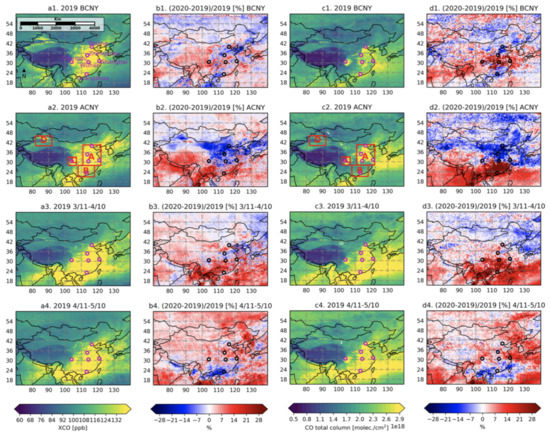
Figure 5.
The TROPOspheric Monitoring Instrument (TROPOMI) satellite XCO observations in units of ppb (a1–a4) and the Infrared Atmospheric Sounding Interferometer (IASI) CO column observations in unit of molec./cm (c1–c4) over China during BCNY, ACNY, 3/11–4/10, and 4/11–5/10 in 2019, together with the relative differences between 2020 and 2019 ((2020–2019)/2019 × 100%) (TROPOMI: b1–b4, IASI: d1–d4). The six megacities are marked as the purple and black circles. The four regions are marked in (a2,c2).
As satellite measurements are contaminated by cloud, the variability in them is relatively high. To reduce random uncertainty, the satellite measurements (both TROPOMI and IASI) were averaged on regional scales, and we focused on the CO changes in four regions with high values (Figure 5a2,c2; Figure 1): North, East, and Central China (A); South China (B), Sichuan basin (C), and Urumqi region (D). The quantitative estimates of the CO changes are shown in Figure 6 and Table 2. The medians of the XCO relative changes during ACNY in 2020 relative to 2019 observed by the TROPOMI satellite are −10.5%, 8.8%, −1.9%, and −4.6% in regions A, B, C, and D, respectively. The medians of the CO column relative changes during ACNY in 2020 relative to 2019 observed by the IASI satellite are −13.3%, 36.7%, −1.8%, and −3.6% in regions A, B, C, and D, respectively. The largest reduction in CO concentration was found by both satellites in Region A during ACNY in 2020, with a minimum in the region between Zhengzhou and Beijing. The reductions in the CO column during ACNY were also significant in Regions C and D, especially when we compare the CO changes during ACNY to the changes during BCNY, 3/11–4/10, and 4/11–5/10. However, there was an 8.8% increase in XCO observed by TROPOMI and a 36.7% increase in CO columns observed by IASI for Region B, which was related to the fires in Southeast Asia, and will be discussed later. To compare the satellite with the surface observations, the relative changes in CO surface concentrations for the same regions are also shown in Figure 6. The medians of the relative changes in CO surface concentrations during ACNY in 2020 as compared to that in 2019 are −25.1%, −23.1%, −15.8%, and −18.2%, for Regions A, B, C, and D, respectively. At these regions, the CO surface concentrations decreased dramatically during the lockdown and then increased afterward, with Region A being the most prominent.
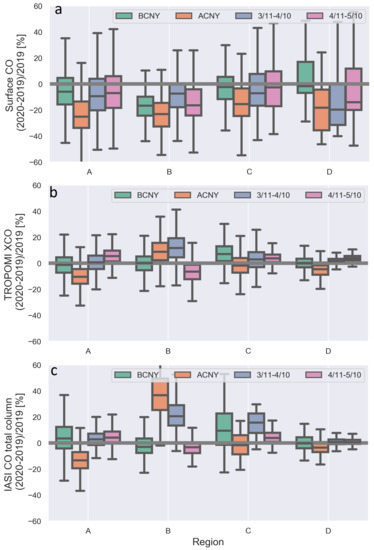
Figure 6.
Box plots of the CO changes from the surface (a), TROPOMI (b), and IASI observations (c) during 4 periods in 2020 against those in 2019. Each box plot shows the values of relative difference for the maximum (top of solid line), 75th percentile (top of box), median (line through middle of box), 25th percentile (bottom of box) and minimum (bottom of solid line) of the distribution.
Table 2.
The median of the relative changes in CO surface concentration observed by surface measurements, and in CO columns observed by TROPOMI and IASI satellite measurements during four periods in each region.
The surface and satellite observations both showed reductions during ACNY in Regions A, C, and D, but the reduction in CO columns was less significant as compared to the reduction in the CO surface concentrations. The satellites observe the column CO abundance. The CO partial columns in the PBL only account for 20–40% of the total columns in these regions according to the Copernicus Atmosphere Monitoring Service (CAMS) operational model [36]. Assuming that there is no change in CO partial columns above the PBL, the magnitude of the CO total column reduction is expected to be 2.5–5 times less than that at the surface. In this case, the relative changes in CO during ACNY in 2020 observed by the satellite and surface observations are generally in good agreement for Regions A, C, and D.
A large disagreement between the satellite and surface observations was found in Region B, where the CO surface concentrations were significantly reduced (>20%) during the lockdown in 2020, while the TROPOMI and IASI observations show that the CO during ACNY and 3/11–4/10 in 2020 was much larger than that in 2019. As the weather conditions between January and March (cool and dry) are favorable for burning, there are vast numbers of fires that emerge across the countryside in Southeast Asia (Myanmar, Laos, Thailand, and Cambodia). The VIIRS satellite detected more fires in Southeast Asia during ACNY and 3/11–4/10 in 2020 as compared to 2019 (Figure 7). The CO columns in Southeast Asia observed by TROPOMI and IASI during ACNY and 3/11–4/10 in 2020 were also increased as compared to 2019 (Figure 5). The CO wildfire emissions from GFAS in March 2019 and March 2020 in Southeast Asia (blue box in Figure 7) were 1.75 × 10 and 9.88 × 10 kg/m/s, respectively. Both the absolute values and the variation of CO wildfire emissions in Southeast Asia are comparable to the CO anthropogenic emission annual means in 2015 in Region B of 1.05 × 10 kg/m/s from REAS v3.2 and of 7.13 × 10 kg/m/s from EDGAR v5.0. As CO has a lifetime of about weeks to months, CO observed in Region B could be transported from the surrounding areas. The 3-day backward trajectories of 2m-height air at local noon for each day during ACNY and 3/11–4/10 in 2020 were simulated by the Hybrid Single-Particle Lagrangian Integrated Trajectory (HYSPLIT) model driven by the National Centers for Environmental/Prediction Global Data Assimilation System (NCEP/GDAS) meteorological data with a 1.0× 1.0 (latitude by longitude) spatial resolution. Note that we only plotted the backward trajectories at the center of Region B, as the wind is generally harmonized in this region. The backward trajectories from 2 m height at the center of Region B suggest that the CO surface concentration in this region has little influence from the fire in Southeast Asia. The 3-day backward trajectories from a 2 km height at the center of Region B show that the fire emission in Southeast Asia can be transported to South China, which is consistent with the winds at 750 hPa from the ERA5 reanalysis data. As a result, the CO column in Region B is strongly affected by the fire in Southeast Asia, and more fires in 2020 led to a CO enhancement in the free troposphere in South China during the lockdown observed by the satellite. The CO increase during ACNY and 3/11–4/10 in 2020 observed by IASI was even larger than that observed by TROPOMI, as the IASI retrieval is more sensitive to the mid- and upper-troposphere.
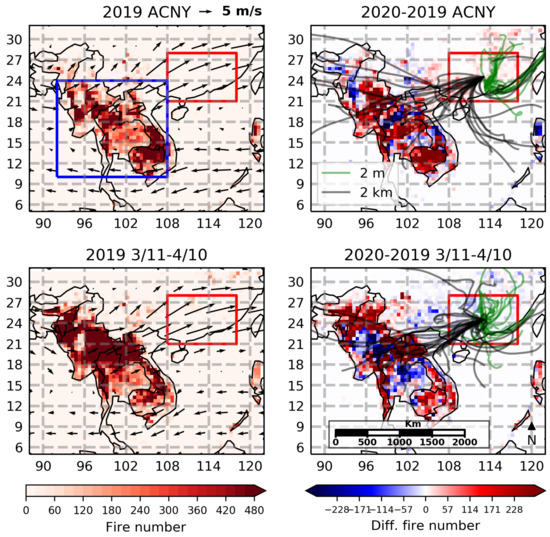
Figure 7.
The number of fires observed by the Visible Infrared Imaging Radiometer Suite (VIIRS) satellite in 0.5× 0.5 (latitude by longitude) grids over Southeast Asia (blue box) together with the wind at the 750 hPa from the ERA5 reanalysis data during ACNY and 3/11–4/10 in 2019 (left) and the difference in the number of fires between 2020 and 2019 (right). The green and black lines in the right panels are 3-day backward trajectories at 12:00 (local time) from 2 m and 2 km heights at the center of Region B (red box) for each day during ACNY and 3/11–4/10 2020 simulated by the Hybrid Single-Particle Lagrangian Integrated Trajectory (HYSPLIT) model.
4. Discussions
In this study, we investigated CO changes based on both CO surface measurements and satellite column measurements. CO reduction was observed by both surface and satellite observations during the COVID-19 lockdown at most places in China. We have highlighted the importance of seasonal variations of CO surface concentration, which must be taken into account when looking at the CO changes during the COVID-19 lockdown, but have not been done in several previous studies [18,19]. In addition, we found that the specific changes in the industrial emissions at the city scale are important to the changes in CO surface concentration at Wuhan, which are suggested by the simultaneous SO measurements and VIIRS/MODIS fire measurements. However, the limitation of this study is that the impact of the industrial emission on the CO change was only discussed qualitatively, because up-to-date CO anthropogenic emissions for the year 2020 are not currently available. A further study could focus on the application of the inverse modeling approach with the surface CO measurements as the inputs to optimize each anthropogenic component.
Different from the CO surface concentration, the changes in CO columns during the COVID-19 lockdown in China observed by TROPOMI satellite measurements using the difference between 2019 and 2020 in this study are similar to the results using only 2020 measurements before and after the lockdown [21], because the XCO means from TROPOMI were almost the same during these four periods. However, the month-to-month variation in CO columns observed by IASI cannot be ignored. In order to reduce the uncertainty, the satellite measurements were only discussed with the median values during each period on the regional scale. The changes in the CO columns observed by satellites are generally consistent with those at the surface in most regions in China under the assumption that the CO concentration above the PBL is not greatly changed. The assumption works well for NO [12], as it has a short lifetime of several hours in the atmosphere. However, due to the relatively long lifetime of CO, the assumption does not work for CO in Region B, where the CO concentration above the PBL was strongly affected by the fire emissions transported from Southeast Asia. We addressed the fact that the CO changes in the free atmosphere are important when comparing the surface and satellite measurements.
5. Conclusions
Surface observations have shown that CO concentrations were at the same level during BCNY in 2019 and 2020, and there was a mean reduction of 18.7% during ACNY in 2020 as compared to 2019, from 1375 sites in China due to the COVID-19 lockdown. Reductions in CO surface concentration were also observed from 3/11–4/10 and 4/11–5/10 in 2020, but they were smaller than the reduction during ACNY. As the spatial variability of CO surface concentration changes across China is high, we investigated the CO changes at six megacities specifically. Large reductions in CO concentration between 20% and 27% during ACNY in 2020 were found in Shanghai, Chengdu, Zhengzhou, and Guangzhou. The CO surface reduction during ACNY in Beijing was only 8%, which may be explained by the exceptional meteorological conditions in that period in 2020. The most strict measures related to COVID-19 were carried out at Wuhan, but there was no decrease in the CO surface concentration observed during the lockdown in 2020 as compared to 2019. By looking at other air pollutants in Wuhan, we found that NO, PM and PM were significantly reduced (>40%) during ACNY in 2020 as compared to 2019, and SO and CO were both slightly increased. The similar behavior of CO and SO suggests that they came from common sources, e.g., the burning of fossil fuels by industrial facilities. The TROPOMI and IASI CO column observations captured the reduction in CO columns (by 2 to 13%) during ACNY in Regions A, C, and D, but the reductions in CO columns were less significant than the reductions in the surface CO concentrations. However, the TROPOMI and IASI observations show that there were 8.8% and 36.7% CO column enhancements during ACNY in 2020 in Region B, which is contrary to the significant reduction (>20%) observed in CO surface concentrations.
Supplementary Materials
The following are available online at https://www.mdpi.com/2072-4292/13/6/1129/s1, Figure S1: the wind above China during four periods in 2019 and 2020. Figure S2: VIIRS fire map around Wuhan during BCNY and ACNY in 2019 and 2020. Figure S3: GFAS CO wildfire emissions around Wuhan during BCNY and ACNY in 2019 and 2020, together with the CO anthropogenic emissions from EDGAR v5.0 and REAS v3.2 around Wuhan in 2015. Figure S4: The time series of CO, SO, NO, PM and PM in Wuhan. Figure S5: VIIRS fire map inside Wuhan during BCNY and ACNY in 2019 and 2020.
Author Contributions
Conceptualization, M.Z. and M.D.M.; methodology, M.Z. and J.J.; writing—original draft preparation, M.Z. and J.J.; writing—review and editing, J.J., B.L., B.D., M.K.S., and M.D.M.; visualization, M.Z. All authors have read and agreed to the published version of the manuscript.
Funding
This research was funded by S5P-MPC (No. 4000117151/16/I-LG) and CAMS84.
Data Availability Statement
The TROPOMI CO data are publicly available at ESA Copernicus Open Access Hub https://scihub.copernicus.eu/. The IASI satellite data are publicly available at https://iasi.aeris-data.fr/cos_iasi_b_arch/. The surface CO measurements are publicly available at https://quotsoft.net/air/. The VIIRS fire observations are publicly available at https://firms.modaps.eosdis.nasa.gov/.
Acknowledgments
The authors would like to thank the Ministry of Ecology and Environment of China for providing the CO surface observations, ESA for making the TROPOMI satellite data publicly available, ULB-LATMOS and EUMETSAT for providing the IASI data, and NASA for providing the VIIRS fire products.
Conflicts of Interest
The authors declare no conflict of interest.
References
- Wu, Z.; McGoogan, J. Characteristics of and Important Lessons From the Coronavirus Disease 2019 (COVID-19) Outbreak in China. JAMA 2020, 323, 1239–1242. [Google Scholar] [CrossRef] [PubMed]
- Tian, H.; Liu, Y.; Li, Y.; Wu, C.H.; Chen, B.; Kraemer, M.U.G.; Li, B.; Cai, J.; Xu, B.; Yang, Q.; et al. An investigation of transmission control measures during the first 50 days of the COVID-19 epidemic in China. Science 2020, 368, 638–642. [Google Scholar] [CrossRef] [PubMed]
- Zhou, T.; Nguyen, T.v.T.; Zhong, J.; Liu, J. A COVID-19 descriptive study of life after lockdown in Wuhan, China. R. Soc. Open Sci. 2020, 7, 200705. [Google Scholar] [CrossRef] [PubMed]
- Ali, G.; Abbas, S.; Qamer, F.M.; Wong, M.S.; Rasul, G.; Irteza, S.M.; Shahzad, N. Environmental impacts of shifts in energy, emissions, and urban heat island during the COVID-19 lockdown across Pakistan. J. Clean. Prod. 2021, 291, 125806. [Google Scholar] [CrossRef]
- Sharifi, A.; Khavarian-Garmsir, A.R. The COVID-19 pandemic: Impacts on cities and major lessons for urban planning, design, and management. Sci. Total Environ. 2020, 749, 142391. [Google Scholar] [CrossRef] [PubMed]
- Petetin, H.; Bowdalo, D.; Soret, A.; Guevara, M.; Jorba, O.; Serradell, K.; Pérez García-Pando, C. Meteorology-normalized impact of the COVID-19 lockdown upon NO2 pollution in Spain. Atmos. Chem. Phys. 2020, 20, 11119–11141. [Google Scholar] [CrossRef]
- Alqasemi, A.S.; Hereher, M.E.; Kaplan, G.; Al-Quraishi, A.M.F.; Saibi, H. Impact of COVID-19 lockdown upon the air quality and surface urban heat island intensity over the United Arab Emirates. Sci. Total Environ. 2021, 767, 144330. [Google Scholar] [CrossRef]
- Rahman, M.S.; Azad, M.A.K.; Hasanuzzaman, M.; Salam, R.; Islam, A.R.M.T.; Rahman, M.M.; Hoque, M.M.M. How air quality and COVID-19 transmission change under different lockdown scenarios? A case from Dhaka city, Bangladesh. Sci. Total Environ. 2021, 762, 143161. [Google Scholar] [CrossRef]
- Bekbulat, B.; Apte, J.S.; Millet, D.B.; Robinson, A.L.; Wells, K.C.; Presto, A.A.; Marshall, J.D. Changes in criteria air pollution levels in the US before, during, and after Covid-19 stay-at-home orders: Evidence from regulatory monitors. Sci. Total Environ. 2021, 769, 144693. [Google Scholar] [CrossRef]
- Liu, Z.; Ciais, P.; Deng, Z.; Lei, R.; Davis, S.J.; Feng, S.; Zheng, B.; Cui, D.; Dou, X.; Zhu, B.; et al. Near-real-time monitoring of global CO2 emissions reveals the effects of the COVID-19 pandemic. Nat. Commun. 2020, 11, 5172. [Google Scholar] [CrossRef]
- Zheng, B.; Geng, G.; Ciais, P.; Davis, S.J.; Martin, R.V.; Meng, J.; Wu, N.; Chevallier, F.; Broquet, G.; Boersma, F.; et al. Satellite-based estimates of decline and rebound in China’s CO2 emissions during COVID-19 pandemic. Sci. Adv. 2020, 6. [Google Scholar] [CrossRef]
- Bauwens, M.; Compernolle, S.; Stavrakou, T.; Müller, J.F.; van Gent, J.; Eskes, H.; Levelt, P.F.; van der, A.R.; Veefkind, J.P.; Vlietinck, J.; et al. Impact of Coronavirus Outbreak on NO2 Pollution Assessed Using TROPOMI and OMI Observations. Geophys. Res. Lett. 2020, 47, e2020GL087978. [Google Scholar] [CrossRef]
- Feng, S.; Jiang, F.; Wang, H.; Wang, H.; Ju, W.; Shen, Y.; Zheng, Y.; Wu, Z.; Ding, A. NOx Emission Changes Over China During the COVID-19 Epidemic Inferred From Surface NO2 Observations. Geophys. Res. Lett. 2020, 47, e2020GL090080. [Google Scholar] [CrossRef]
- Aschi, M.; Largo, A. Reactivity of gaseous protonated ozone: A computational investigation on the carbon monoxide oxidation reaction. Int. J. Mass Spectrom. 2003, 228, 613–627. [Google Scholar] [CrossRef]
- Novelli, P.C.; Masarie, K.A.; Lang, P.M. Distributions and recent changes of carbon monoxide in the lower troposphere. J. Geophys. Res. Atmos. 1998, 103, 19015–19033. [Google Scholar] [CrossRef]
- Granier, C.; Bessagnet, B.; Bond, T.; D’Angiola, A.; Denier van der Gon, H.; Frost, G.J.; Heil, A.; Kaiser, J.W.; Kinne, S.; Klimont, Z.; et al. Evolution of anthropogenic and biomass burning emissions of air pollutants at global and regional scales during the 1980–2010 period. Clim. Change 2011, 109, 163. [Google Scholar] [CrossRef]
- Crippa, M.; Solazzo, E.; Huang, G.; Guizzardi, D.; Koffi, E.; Muntean, M.; Schieberle, C.; Friedrich, R.; Janssens-Maenhout, G. High resolution temporal profiles in the Emissions Database for Global Atmospheric Research. Sci. Data 2020, 7, 121. [Google Scholar] [CrossRef] [PubMed]
- Lian, X.; Huang, J.; Huang, R.; Liu, C.; Wang, L.; Zhang, T. Impact of city lockdown on the air quality of COVID-19-hit of Wuhan city. Sci. Total Environ. 2020, 742, 140556. [Google Scholar] [CrossRef]
- Shi, X.; Brasseur, G.P. The Response in Air Quality to the Reduction of Chinese Economic Activities During the COVID-19 Outbreak. Geophys. Res. Lett. 2020, 47, e2020GL088070. [Google Scholar] [CrossRef] [PubMed]
- Verma, R.L.; Kondo, Y.; Oshima, N.; Matsui, H.; Kita, K.; Sahu, L.K.; Kato, S.; Kajii, Y.; Takami, A.; Miyakawa, T. Seasonal variations of the transport of black carbon and carbon monoxide from the Asian continent to the western Pacific in the boundary layer. J. Geophys. Res. Atmos. 2011, 116. [Google Scholar] [CrossRef]
- Fan, C.; Li, Y.; Guang, J.; Li, Z.; Elnashar, A.; Allam, M.; de Leeuw, G. The Impact of the Control Measures during the COVID-19 Outbreak on Air Pollution in China. Remote Sens. 2020, 12, 1613. [Google Scholar] [CrossRef]
- Miyazaki, K.; Bowman, K.; Sekiya, T.; Jiang, Z.; Chen, X.; Eskes, H.; Ru, M.; Zhang, Y.; Shindell, D. Air Quality Response in China Linked to the 2019 Novel Coronavirus (COVID-19) Lockdown. Geophys. Res. Lett. 2020, 47, e2020GL089252. [Google Scholar] [CrossRef] [PubMed]
- Landgraf, J.; aan de Brugh, J.; Scheepmaker, R.; Borsdorff, T.; Hu, H.; Houweling, S.; Butz, A.; Aben, I.; Hasekamp, O. Carbon monoxide total column retrievals from TROPOMI shortwave infrared measurements. Atmos. Meas. Tech. 2016, 9, 4955–4975. [Google Scholar] [CrossRef]
- Hurtmans, D.; Coheur, P.F.; Wespes, C.; Clarisse, L.; Scharf, O.; Clerbaux, C.; Hadji-Lazaro, J.; George, M.; Turquety, S. FORLI radiative transfer and retrieval code for IASI. J. Quant. Spectrosc. Radiat. Transf. 2012, 113, 1391–1408. [Google Scholar] [CrossRef]
- Kerzenmacher, T.; Dils, B.; Kumps, N.; Blumenstock, T.; Clerbaux, C.; Coheur, P.F.; Demoulin, P.; García, O.; George, M.; Griffith, D.W.T.; et al. Validation of IASI FORLI carbon monoxide retrievals using FTIR data from NDACC. Atmos. Meas. Tech. 2012, 5, 2751–2761. [Google Scholar] [CrossRef]
- Schroeder, W.; Oliva, P.; Giglio, L.; Csiszar, I.A. The New VIIRS 375m active fire detection data product: Algorithm description and initial assessment. Remote Sens. Environ. 2014, 143, 85–96. [Google Scholar] [CrossRef]
- Cao, C.; De Luccia, F.J.; Xiong, X.; Wolfe, R.; Weng, F. Early On-Orbit Performance of the Visible Infrared Imaging Radiometer Suite Onboard the Suomi National Polar-Orbiting Partnership (S-NPP) Satellite. IEEE Trans. Geosci. Remote. Sens. 2014, 52, 1142–1156. [Google Scholar] [CrossRef]
- Kurokawa, J.; Ohara, T. Long-term historical trends in air pollutant emissions in Asia: Regional Emission inventory in ASia (REAS) version 3. Atmos. Chem. Phys. 2020, 20, 12761–12793. [Google Scholar] [CrossRef]
- Kaiser, J.W.; Heil, A.; Andreae, M.O.; Benedetti, A.; Chubarova, N.; Jones, L.; Morcrette, J.J.; Razinger, M.; Schultz, M.G.; Suttie, M.; et al. Biomass burning emissions estimated with a global fire assimilation system based on observed fire radiative power. Biogeosciences 2012, 9, 527–554. [Google Scholar] [CrossRef]
- Wiedinmyer, C.; Akagi, S.K.; Yokelson, R.J.; Emmons, L.K.; Al-Saadi, J.A.; Orlando, J.J.; Soja, A.J. The Fire INventory from NCAR (FINN): A high resolution global model to estimate the emissions from open burning. Geosci. Model Dev. 2011, 4, 625–641. [Google Scholar] [CrossRef]
- Huang, X.; Ding, A.; Gao, J.; Zheng, B.; Zhou, D.; Qi, X.; Tang, R.; Wang, J.; Ren, C.; Nie, W.; et al. Enhanced secondary pollution offset reduction of primary emissions during COVID-19 lockdown in China. Natl. Sci. Rev. 2020. [Google Scholar] [CrossRef]
- Le, T.; Wang, Y.; Liu, L.; Yang, J.; Yung, Y.L.; Li, G.; Seinfeld, J.H. Unexpected air pollution with marked emission reductions during the COVID-19 outbreak in China. Science 2020, 369, 702–706. [Google Scholar] [CrossRef] [PubMed]
- Van der Werf, G.R.; Randerson, J.T.; Giglio, L.; Collatz, G.J.; Kasibhatla, P.S.; Arellano, A.F., Jr. Interannual variability in global biomass burning emissions from 1997 to 2004. Atmos. Chem. Phys. 2006, 6, 3423–3441. [Google Scholar] [CrossRef]
- Zheng, B.; Chevallier, F.; Ciais, P.; Yin, Y.; Deeter, M.N.; Worden, H.M.; Wang, Y.; Zhang, Q.; He, K. Rapid decline in carbon monoxide emissions and export from East Asia between years 2005 and 2016. Environ. Res. Lett. 2018, 13, 044007. [Google Scholar] [CrossRef]
- Li, M.; Zhang, Q.; Kurokawa, J.I.; Woo, J.H.; He, K.; Lu, Z.; Ohara, T.; Song, Y.; Streets, D.G.; Carmichael, G.R.; et al. MIX: A mosaic Asian anthropogenic emission inventory under the international collaboration framework of the MICS-Asia and HTAP. Atmos. Chem. Phys. 2017, 17, 935–963. [Google Scholar] [CrossRef]
- Inness, A.; Blechschmidt, A.M.; Bouarar, I.; Chabrillat, S.; Crepulja, M.; Engelen, R.J.; Eskes, H.; Flemming, J.; Gaudel, A.; Hendrick, F.; et al. Data assimilation of satellite-retrieved ozone, carbon monoxide and nitrogen dioxide with ECMWF’s Composition-IFS. Atmos. Chem. Phys. 2015, 15, 5275–5303. [Google Scholar] [CrossRef]


Publisher’s Note: MDPI stays neutral with regard to jurisdictional claims in published maps and institutional affiliations. |
© 2021 by the authors. Licensee MDPI, Basel, Switzerland. This article is an open access article distributed under the terms and conditions of the Creative Commons Attribution (CC BY) license (http://creativecommons.org/licenses/by/4.0/).