Abstract
Dense time series of stripmap RADARSAT-2 data acquired in the Multilook Fine mode were used for detecting and mapping the extent of selective logging operations in the tropical forest area in the northern part of the Republic of the Congo. Due to limited radiometric sensitivity to forest biomass variation at C-band, basic multitemporal change detection approach was supplemented by spatial texture analysis to separate disturbed forest from intact. The developed technique primarily uses multi-temporal aggregation of orthorectified synthetic aperture radar (SAR) imagery that are acquired before and after the logging operations. The actual change analysis is based on textural features of the log-ratio image calculated using two SAR temporal composites compiled of SAR scenes acquired before and after the logging operations. Multitemporal aggregation and filtering of SAR scenes decreased speckle and made the extracted textural features more prominent. The overall detection accuracy was around 80%, with some underestimation of the area of forest disturbance compared to reference based on optical data. The user’s accuracy for disturbed forest varied from 76.7% to 94.9% depending on the accuracy assessment approach. We conclude that change detection utilizing RADARSAT-2 time series represents a useful instrument to locate areas of selective logging in tropical forests.
1. Introduction
Timely assessment and monitoring of the state of the forests forms basis for definition and implementation of preventive and corrective measures for sustainable forest management, preservation of forests and their restoration after disturbances. While more than fifty definitions of forest degradation have been formulated [1], the majority of them seem to be either too broadly defined for practical use or concentrate on specific aspects of reduction in productivity, biomass or biodiversity [2]. Here, we concentrate on a specific type of artificial, human-induced forest disturbance—selective logging—and potential for its mapping using satellite remote sensing data.
In the framework of this study, the selective logging was done in concession areas where sustainable forestry is practiced. Selective logging follows certain recognizable patterns. Typically, a road network is constructed first. Within a brief period, areas near the roads are logged. A widespread practice is to cut a limited number of marketable tree species [3], followed by transporting logs off site. Thus, areas of ground damage typically exhibit gaps, logging trails and roads. Selective logging does not necessarily cause forest degradation but it can strongly affect the forest ecosystem [3,4,5]. Timely monitoring of logging activities improves potential for measuring forest degradation and contributes to sustainable forest management practices.
In contrast to deforestation, readily observed from medium to high resolution optical and SAR (synthetic aperture radar) satellite data [6,7,8], selective logging results in a spatially diffuse thinning of large trees [9], which requires relatively high spatial resolution for reliable detection. In several previous studies [3,10,11,12,13,14], mostly medium and high resolution optical satellite data were used, with methodologies ranging from visual interpretation of satellite imagery to automated tracking of the progress of logging roads. Accurate delineation of disturbed areas was complicated by atmospheric conditions in the tropical forest, fast regrowth of vegetation after selective logging, the small-structured logging patterns, different logging practices, and limited or missing field reference data [15].
When use of optical satellite data is compromised due to near-permanent cloud coverage, possible solution is to use SAR sensors, relying on longer and denser time series. Radar based monitoring offers flexibility in forest monitoring applications, when results are requested in a fixed (e.g., yearly) schedule. In this context, methodologies earlier developed for SAR based change detection and SAR time series classification in thematic mapping are relevant [16,17,18,19,20,21]. However, until today there were only few attempts to use spaceborne SAR data to detect forest disturbance [22,23,24,25,26,27], though the need for monitoring forest degradation and disturbance in addition to forest clearcutting has been widely recognized [14]. Two major problems that complicate the detection are presence of speckle and lack of backscatter sensitivity to biomass beyond the saturation level [28]. Presence of speckle requires multilooking and filtering, while the problem of radar signal saturation can be partly solved by using SAR with longer wavelength. Also combining different frequency bands [29], use of auxiliary forest masks and multitemporal SAR analysis [30,31,32] were found useful in addressing these problems. However, long and dense series of L-band SAR data are not available presently. Very high resolution SAR and InSAR data that was reported successful in this context are not widely available, and need further research before becoming operational [22,33]. On the other hand, C-band radar data acquired by several spaceborne sensors, historically Envisat ASAR, presently RADARSAT-2 and Sentinel-1, represent attractive source of information for timely assessment of forest cover due to global coverage and frequent revisit. Multitemporal C-band SAR data were extensively used for evaluating and monitoring growing stock volume of both boreal and tropical forests, as well as in thematic mapping purposes [25,34]. Due to relatively low contrast between forested and non-forested areas at C-band—compared with, for example, the L-band—forest masks and relatively long time-series were typically needed. Present consensus is that further research is required on methods exploiting dense time series of C-band SAR measurements, including multitemporal approaches, to achieve performance similar to L-band SAR data [7]. Here, we address part of this problem by incorporating the spatial context in the multitemporal change detection procedure utilizing C-band SAR image time series.
Here, we capitalize on our earlier work [24,25], with a goal to develop and validate an automatic method for detecting forest disturbance due to selective logging from time series of RADARSAT-2 data. Our focus is on spatiotemporal assessment and interpretation, as opposed to direct interpretation of backscattered signal intensity or its change. We rely on one of advanced imaging modes of RADARSAT-2 data with improved resolution, Multi-look Fine (ML3F) mode. To our best knowledge, this is the first consistent study in the literature reporting automated approach employing RADARSAT-2 time series approach for detecting selective logging in African tropical forests.
The paper is organized as follows. We describe our study site, acquired RADARSAT-2 dataset and developed methodology in Section 2. Suggested SAR based method is demonstrated, discussed and validated against change mapping from optical satellite data in Section 3, while potential challenges and opportunities are concluded in Section 4.
2. Data and Methods
2.1. Study Site
The study site was in the northern part of the Republic of the Congo with center coordinates 00.47′ N, 16.03′ E (shown in Figure 1). The 50 km by 50 km study area approximately equaled the size of a RADARSAT-2 scene in the Fine Beam mode. The site was mostly covered with tropical natural forest which has partly undergone selective logging management. In the northern part of the scene, the forest was logged earlier. In the center, active logging was ongoing. The southern part was represented mostly by intact forest, though road construction had already started there as well. The logging operations were gradually progressing from north to south along with construction of a road network or shortly after its construction. The distance between the logging roads was on the order of 2 km. Drainage systems of two rivers were surrounding the core study area. The elevation varied from 350 m to 400 m.
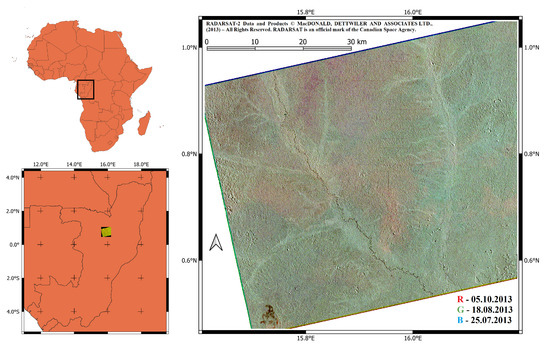
Figure 1.
Study site location in the northern part of the Republic of the Congo. RGB composite represents three orthorectified RADARSAT-2 scenes acquired 5 October, 18 August, 25 July, 2013.
2.2. SAR Data
In total, 13 RADARSAT-2 scenes were used in the study, covering the observation period from November 2012 till December 2013. All the data were acquired in the Multi-look Fine (MF3W) mode, HH-polarization. Single-pol imaging mode was chosen to maximise the swath coverage and range resolution, as added value of polarimetry at C-band is limited over tropical forests [7]. The images are described in detail in Table 1.

Table 1.
The list of RADARSAT-2 scenes acquired over the study area.
The Shuttle Radar Topography Mission (SRTM) DEM was used in the orthorectification process. For the MF3W data, original single-look complex products had a pixel spacing of 2.7 m in slant range and 3.0 m in azimuth. Multilooking with factor of 4 × 3 (rg × az) was performed before the orthorectification, in the power domain. Radiometric normalization with respect to the projected area of the scattering element was performed to eliminate the topography-induced radiometric variation [35]. VTT in-house software was used for orthorectification and terrain flattening of the SAR images [36]. This way, a time series of co-registered “gamma-naught” backscatter images were formed, with a pixel size of 12.5 m by 12.5 m.
2.3. Reference Data and Accuracy Assessment Approach
In order to ascertain objective and conservative evaluation of detected forest disturbances, the accuracy assessment was done in two different ways.
Reference data were obtained by combining automated and visual interpretation of Landsat 7 and Landsat 8 optical satellite imagery in the study area. This is similar to validation approach in [15] by comparing the extent of selective logging delineated using visual interpretation of optical image against SAR based map in a wall-to-wall manner.
Accuracy assessment uses a confusion matrix calculated using sampled pixels or plots, as described further. We report the following measures of accuracy: precision, also known as producer’s accuracy (PA), recall, also known as user’s accuracy (UA), and overall accuracy. The formulas are as follows.
For each forest class (intact or disturbed) c, we calculate producer’s accuracy (precision):
and user’s accuracy (recall):
where represents true positive, false positive, and false negative pixels for the class c.
Also, we calculate overall pixel accuracy:
where is the number of pixels having a ground truth label i and being classified/predicted as j, is the total number of pixels labelled with i, and L is the number of classes. All these metrics can take values from 0 to 1 or expressed in percentages.
2.3.1. Accuracy Assessment Using Autochange Reference Map
A reference disturbance map was produced based on the change analysis between two reference optical images acquired in spring and autumn of 2013. The first image was acquired with the Enhanced Thematic Mapper+ instrument of Landsat 7 on 17 May 2013. It corresponded to the time shortly before primary logging operations were performed in the study area. The second image was taken with the Operational Land Imager instrument on 1 November 2013. The Scan Line Corrector anomally did practically not affect the study area. The second image corresponded to the time when major operations were progressed and concluded in the northern part of the study site. Also, new roads for future logging operations were constructed.
The change detection was done independently from the SAR image interpretation using VTT in-house software Autochange followed by visual interpretation of the Autochange results. The algorithm is based on two stage clustering of input images and is robust against interimage variation not related to real changes [37]. The input images do not have to represent the same wavelength bands or have to be from the same imaging instrument. Autochange provides land cover information from the earlier image, four change types and the change magnitude, allowing definition of a set of thresholds to detect and describe types of changes based on user requirements.
For the May image, the red, near infrared, SWIR (1.5 m) and panchromatic bands were used and for the November image the selected bands were the green, red, near infrared and panchromatic bands, respectively. The resolution in the multi-spectral bands was 30 m whereas the panchromatic band resolution was 15 m. The radiometric quality of the May image was poorer than with the November image due to the haze and weaker radiometric resolution of the sensor. Therefore, longer wavelength bands were favored and only one visible band was selected to the change analysis. Clouds, haze and some apparent surface moisture changes caused that the Autochange output was not directly applicable for the change mapping but an additional visual interpretation was required to provide the reference map. The southernmost tip of the new logging road was detected as a strong change by Autochange but considered as non-forest in the May image due to its high intensity. It was consequently not included as a change due to forest removal in the Autochange result that combined the output layers of the program.
Both original images and the resulting change layer are shown in Figure 2.
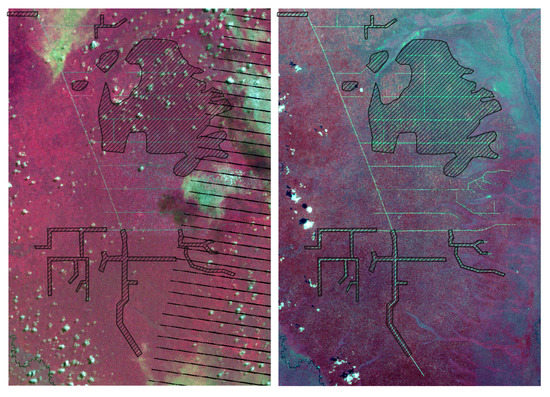
Figure 2.
Pan-sharpened color infrared composites of reference Landsat images acquired on 17 May 2013 (before the logging) and 1 November 2013 (after the logging). Green band is shown in Blue, red band in Green, and NIR band in Red color. The panchromatic band is the intensity channel. Detected change using visual interpretation of the Autochange-output is shown using hatch pattern.
2.3.2. Accuracy Assessment Using Visually Interpreted Plots
This approach used circular sample plots that were visually interpreted from the Landsat data. A simple random sample of 100 plots was selected for two test areas each (predominantly disturbed and non-disturbed) shown in Figure 3. The overall number of plots for interpretation was 200. The radius of an evaluation plot was 30 m. Pan-sharpened versions with 15 m pixel size of natural color, color infrared and short wave infrared composites were used in the evaluation. The proportion of intact forest, cut forest, shrub and grass, and bare soil (dirt roads) was visually evaluated within each plot by an expert who was not familiar with the SAR image analysis result.
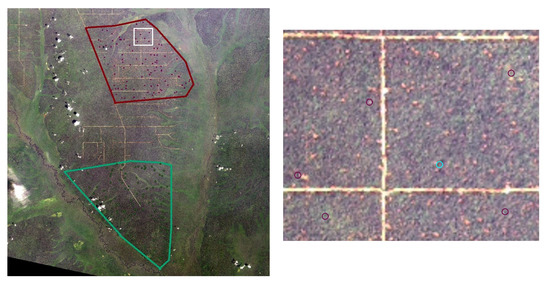
Figure 3.
Core of the study site on natural color composite of a Landsat-8 image of 1 November 2013. (right) Areas for the accuracy assessment are shown with red and green lines. Area size 45 km by 56 km. (left) Plots on the natural color composite of the logged test site (zoomed area highlighted in white). Active plot for evaluation is shown in cyan.
Cut forest and bare soil were considered as logged and all other classes unlogged. This is similar to the definition applied in [15] where forest degradation was defined as an area affected by forest canopy disturbance in terms of gaps, logging roads and logging trails, and where no distinction was made between man-made and natural gaps.
In the computation of the results of the visual evaluation a plot was assigned disturbed if any proportion of the plot was considered cut. The reason for this decision was that the selective logging partly showed a clear opening at Landsat resolution but it was assumed that in many cases the crown cover was only slightly affected due to logging and in reality logging intensity was higher than what was visible on the Landsat image. In the intact area, all plots were assigned to uncut class in the visual interpretation.
This approach in the accuracy assessment with plots can be considered more conservative than cross-validation with Autochange (Section 2.3.1) or than the approaches applied in several earlier studies on tropical forest selective logging and change detection, for instance [15,26,27,38].
2.4. Method Development
The sensitivity of C-band SAR to variation of above ground biomass is relatively weak and a typical saturation limit of 50–100 t/ha is reached very quickly in tropical forests. Considering this, other factors rather than just the level of backscatter or its change should be used, taking into consideration possible changes in scattering mechanisms. Selective logging inherently assumes presence of forested regions with partly removed trees near roads (see simplified representation in Figure 2). However, the separate investigation of original SAR scenes did not reveal a clear dependence between backscatter levels and logging. One original orthorectified SAR scene acquired on 18 August 2013, is shown in Figure 4 as a typical example.
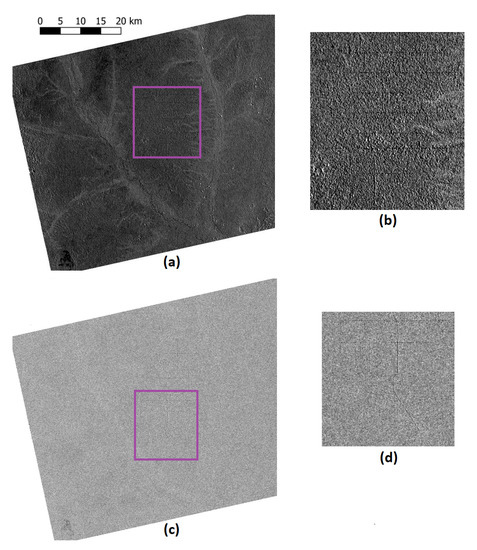
Figure 4.
Screening selective logging with original SAR scenes: (a) orthorectified scene acquired on 18 August 2013; (b) its enlarged fragment. Screening selective logging with bi-temporal log-ratio images: (c) log-ratio image between orthorectified scenes acquired on 27 November 2012 and 22 November 2013; (d) its enlarged fragment. RADARSAT-2 Data and Products © MacDONALD, DETTWILER AND ASSOCIATES LTD., (2013)—All Rights Reserved. RADARSAT is an official mark of the Canadian Space Agency.
A possible approach towards detecting selective logging activities could be based on change detection between the current SAR scene and some reference SAR scene. Such a reference SAR scene can be chosen either at the start of the monitoring period, or bi-temporal image ratios between consecutive acquisitions can be analyzed. However, attempts to apply this kind of traditional approach did not reveal dependence on selective logging activities, but rather general land cover dependence or seasonal and weather artifacts. Different combinations of scenes were tested, with a temporal baseline ranging from 4 to 12 months. An example of log-ratio image between scenes acquired on 27 November 2012 and 22 November 2013 is shown in Figure 4. Further attempts to capture meaningful variations of radar backscatter using change detection techniques (primarily visual and textural analysis of different bi-temporal intensity ratio and log-ratio images) were not successful either. Observed backscatter change signatures could be mostly attributed to changes in moisture with respect to different land cover classes and seasonal and weather phenomena.
Finally, an approach to perform multitemporal filtering to decrease speckle and to aggregate SAR images acquired before and after the logging event was formulated and tested. The aggregation of SAR images was followed by calculation of log-ratio image and analyzing its spatial textural characteristics. To detect the specific time when selective logging was performed, temporal evolution of constructed roads was investigated based on both original data-takes and bi-temporal log-ratio images where newly constructed roads are well visible.
In more detail, the logic of the proposed mapping approach follows next simple steps:
- Find newly constructed roads to help choose SAR images covering areas of logging operations;
- Aggregate SAR scenes before and after the logging event;
- Calculate the log-ratio image between aggregated composites;
- Perform detection of selectively logged areas by linear contrast stretching followed by texture extraction and segmentation;
- Conduct morphological post-processing of detected areas
The flowchart of the mapping algorithm is shown in Figure 5.
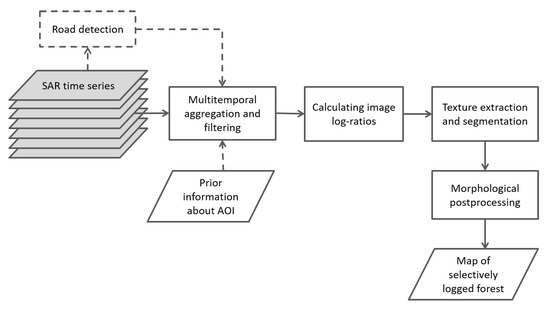
Figure 5.
General flowchart of the proposed approach for mapping extent of forest disturbance due to selective logging.
The first step of the algorithm can be skipped if there is prior knowledge about the region of interest (forest concession area in this study) and the timing of logging operations. Otherwise, it is useful to automatically locate such places of potential disturbance, as newly constructed roads are often visible from ortho-rectified SAR imagery without additional processing. Also, as selective logging can be performed only in forested areas, an additional forest mask could be useful in order to limit areas where processing is done. An alternative is independent segmentation of separate SAR scenes where land cover dependence was well visible. However, in this study it did not appear necessary, as practically no relevant changes were observed in non-forested areas.
The approach suggested here was motivated by visual investigation of log-ratio products after multitemporal aggregation. The physical background of the method can be explained by considering the backscatter components shown (schematically) in Figure 6. In case of intact forest, most of the C-band backscatter comes as direct backscatter from the small branches of trees. When selective logging removes some of the trees, direct backscatter from the ground, and to some extent the double-bounce scattering mechanism become significant in some pixels. This somewhat changes the backscatter magnitude of those pixels, often increasing it. On the other hand, some pixels become radar shadows with strong decrease of the backscatter intensity of those pixels. As a result, the average backscatter if computed over several pixels may stay approximately at the same level as in the intact forest. When pixels are averaged in the multitemporal stack in time domain (and not spatially), the speckle level is reduced without decreasing spatial resolution, and spatially-neighbouring “enhanced” and “reduced” pixels create texture in the image. This texture is detected by a spatial texture operator when applied to the log-ratio image of the after and before logging averaged SAR composites.
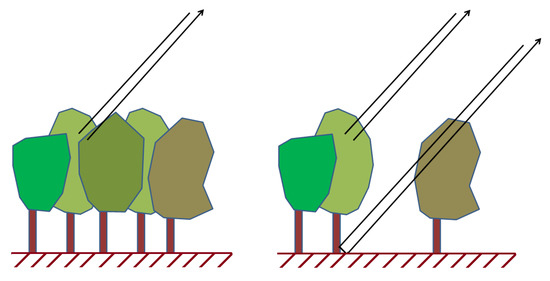
Figure 6.
The change in scattering mechanisms in connection with selective logging: (left) Intact forest; (right) Forest after selective logging. Second and higher order scattering interactions are ignored in this representation.
This kind of texture detection approach can be expected to work when the resolution of the SAR sensor—after a suitable level of speckle reduction—corresponds to the dimension of a typical group of trees or the gap made during the selective logging. Even if the resolution cell is slightly bigger than the tree or gap, the effect can be expected to be visible to some extent.
Multitemporal aggregation of SAR scenes was implemented using multitemporal SAR filtering approach [30]. As the filtering is performed both in spatial and time domains this approach bears close analogies with work described in [31]. The filter takes a simple form
where are image pixel coordinates, denotes spatial averaging of k-th input image , whereas M is the number of images and is the output image. Hence, in addition to the pixel-to-pixel summation in Equation (1), the calculation can involve spatial averaging and/or filtering. In our case, spatial domain filtering includes multilooking performed during ortho-rectification followed by, e.g., additional boxcar filtering before calculating a temporal log-ratio image.
Log-ratio transform of SAR image intensities (or differencing of corresponding log-images) is the basic approach to change detection [38,39,40], whereas expressing the difference between backscatter levels in dBs seems natural. This is the reason it was used in this study. This however does not disqualify other possible ratio-operators that can be used for change detection [41,42].
For texture extraction and segmentation of the log-ratio image, we applied a variation coefficient filter (standard deviation divided by the mean) followed by thresholding binarization to achieve a computationally effective solution. The filter was implemented as a sliding window of predefined size (neighborhood) to calculate the local standard deviation of an image. Visual analysis of road-network expansion and prior knowledge about the area where logging operations were performed allowed to skip Step 1 of the proposed forest disturbance mapping approach. However, line detection is trivial as roads are readily visible in SAR log-ratio images or even original SAR scenes, and, for example, Hough-transform can be used to extract linear segments as in our earlier studies [23,24].
An important aspect of this approach is selecting an optimal window size to extract a relevant textural feature from log-ratio image. Here we are interested in capturing the spatial radiometric signature of selectively logged forest, which implies that the window size should be relatively big to include both separate trees and gaps within the forest. On the other hand, precise delineation of affected area is desired, which requires relatively small windows to accurately locate the boundaries between different textured regions. This issue is further investigated in Section 3.
3. Experimental Results and Discussion
Methodology described in Section 2 was tested with the two aggregated data sets that represented situations before and after the construction of the road networks. The MF3W mode time series includes 8 scenes that were acquired before the selective logging operations and 5 scenes after the operations.
3.1. General Performance Evaluation
Figure 7 illustrates the search of optimal size of window for performing textural feature extraction. Increasing the size of the processing window to more than 375 m seemed not to provide additional gain in suppressing false alarms in the service area, but resulted in decreased spatial resolution and loss of segmentation border sensitivity. However, windows of smaller size demonstrated unacceptably high levels of false alarms when using the chosen texture extraction method (coefficient of variation). An alternative solution, in order to increase the sensitivity of the analysis and still preserve higher spatial resolution, may be potentially found in using alternative segmentation methods. The agreement with the reference data was high, and the overall accuracy of the detection layer shown as the rightmost in Figure 7 achieved 83.2% with the Autochange based map used as a reference. Figure 8 illustrates the performance of developed methodology, visually confirming a good agreement with information provided by inspection of Landsat 8 imagery.
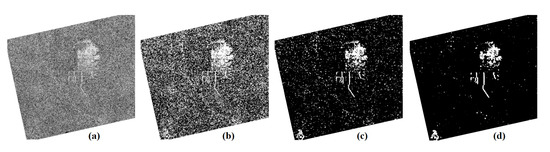
Figure 7.
Selection of feature window size for textural feature extraction: (a) 62.5 m; (b) 112.5 m; (c) 187.5 m; (d) 262.5 m. The processed area size corresponds to Figure 1.
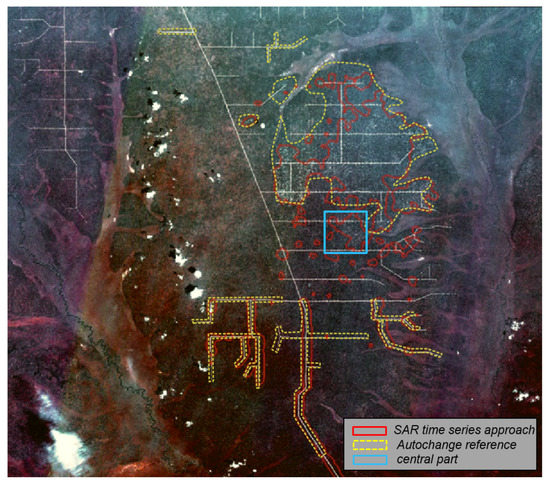
Figure 8.
Landsat 8 image (natural color composite) with the border mask of logged forest detected using SAR time series approach and Autochange reference area. Central part of the study site is marked where logging intensified prior to the optical “before-logging” datatake.
An apparent disagreement in the central area can be partly explained by presence of cloud in the optical image acquired in May. Disagreement in the central area is explained by intensification of logging visible already in May optical image (and likely occurred shortly before this). Thus Autochange based result doesn’t show this region as change-area. Radar-based approach shows this disagreement area as change-area, due to accumulated time series including several scenes acquired also before May. This seems to be an apparent disadvantage of accumulation approach, as change-phenomenon gets smoothed in longer image time series.
When comparing the RADARSAT-2 based map of selectively logged forest with the Autochange reference map, the overall accuracy was around 80%. Confusion matrix calculated using stratified random sample of 1000 pixels is shown in Table 2. Excluding the central area from the calculation of the confusion matrix increases the overall logging-detection accuracy to as high as 83.2%, with particularly high user’s accuracy of 98% for disturbed forest. This means all disturbance areas detected by suggested radar change detection approach were accurate, even though some underestimation of disturbed area was observed.
Table 2.
Confusion matrices in cross-validation of forest disturbance map produced from RADARSAT-2 time series against Autochange reference map.
Further inspection of the RADARSAT-2 data with the produced maps revealed sensitivity to the look direction when detecting linear objects like buildings or roads, which is common with SAR data in general. This phenomenon can be well followed in Figure 8, where roads in or close to the orbit direction of the SAR sensor are detected but roads in the orthogonal direction have partly remained undetected. This may not be a major limitation to the suggested approach because in larger logging operations roads are constructed in several directions. The mapping results obtained suggest that this kind of C-band SAR change detection approach is capable of detecting newly constructed roads in at least one of these directions. Moreover, the roads are also well visible from the original SAR intensity images, and are well visible also using medium resolution optical images.
Results of accuracy assessment using visually interpreted plots are gathered in Table 3. In the intact area, all plots were assigned to uncut class in the visual interpretation whereas four of them were detected as disturbed in the SAR based prediction. The confusion was caused exclusively by these four plots located in the vicinity of newly constructed road (at the distance of less than half of the SAR texture estimation window). In the predominantly disturbed area, the overall agreement between the RADARSAT-2 based map and plot evaluation was 64%. Combined data yields 80% overall accuracy, with particularly low producer’s accuracy for disturbed-forest plots. The result suggests a bias towards underestimation of disturbance with the radar approach.
Table 3.
Confusion matrices for two regions in validation of forest disturbance map produced from RADARSAT-2 time series against visually interpreted plots.
However, the visual interpretation of plots did not take into account the size of SAR texture estimation window (much larger than the plot radius). Further evaluation reveals that several plots interpreted as intact forest from optical data can be reassessed as disturbed if the larger neighbourhood were used, improving disturbed forest user’s accuracy for the radar based approach. Part of disturbance underestimation by radar can be explained by sensitivity to look direction, as discussed above. Similar observation was done in recent study [27]. A possible solution would be to combine ascending and descending image acquisition geometries to reduce this sensitivity and make sure less disturbance remains undetected. Also, if a gap within the forest canopy existed before the logging operations, the plot could still be interpreted as disturbed in the visual assessment based on a single image, even though no additional change/disturbance happened at the plot area. In this respect, automated change detection with Autochange approach followed by visual interpretation of changed areas, can be considered useful.
Results of assessment with visually interpreted plots can be considered more conservative than cross-validation with Autochange or earlier reported studies on forest disturbance [15,26,27,38]. Those studies considered much larger neighborhoods applying more liberal approach in assigning the reference data as changed and assessment of the performance was done at area-based level rather than on plot level. In some cases, only general level of agreement or proportions of forest classes in radar derived and reference optical image were reported.
In this study, we did not screen out any SAR scenes. Generally, with this kind of approach, it seems appropriate to collect as many SAR images both before and after the logging operations as possible. Possible limiting factors for such image accumulation are actual changes of scattering mechanisms (e.g., forest regrowth), strong seasonal or meteorological changes (rainy and dry images) and, naturally, availability of frequent observations of monitored areas. Aggregating more images can also create uncertainty regarding the timing of logging over larger areas, as the logging operations progress continuously over large areas. This was particularly the case with the central area of our study site, where logging operations started before mid-May, and the reference Autochange-result showed May-to-November change, while radar-based approach included scenes where the area in question was not yet logged. Thus, the change detection should be localized both spatially and in temporal domain for the purposes of near-real-time forest disturbance monitoring.
3.2. Comparison with Other Studies and Outlook
Observed experimental results are encouraging further investigations and are generally in line with other reported studies in different forest biomes. Heathcoat et al. recently compared approaches for detecting selectively logged forest and well summarised that only time series approaches are suitable to reliably detect forest removal and degradation [26]. Suitable approaches can be based either on using thematic (supervised or unsupervised) approaches to image time series analysis, or alternatively, change detection. Two studies that are somewhat similar to our approach here can be found in the literature, aside from our own work on the subject [24,25]. In the first study, a potential to monitor small sub-hectare changes in Brazilian Amazon was reported, using ratio of stacked scenes acquired before and after selective logging [43]. Averaging over a small kernel followed by user-defined threshold was applied to extract change, in contrast to variational filter suggested in our methodology. This approach, highlighting the temporal change, was used for mapping forest removal activities also in boreal forest [44]. Some overestimation of the logging extent of the radar-based approach [43] compared to visual interpretation of RADARSAT-2 scenes and reference data was noted also stressing the need to develop semi-automated approaches and improve the detection performance particularly in connection with the overestimation of disturbed areas. Further, recent study by Hoekman et al. [27] used textural features for detecting disturbance in Borneo using Sentinel-1 imagery. There, so-called averaged contrast is computed over a certain fixed area (e.g., 10 × 10 pixels corresponding to 100 m × 100 m area). This contrast parameter is defined as a sum of the absolute backscatter change. This in fact translates to averaging the modulus of change within a predefined neighbourhood, while in this and earlier studies [24,25] we rely on the local standard deviation of backscatter change. Regarding forest selective logging, a high spatiotemporal consistency was noted, however more validation is apparently needed.
Here, unlike Sentinel-1 studies where VV- and VH- polarisations are used, we analyze the RADARSAT-2 data acquired using HH-polarisation with somewhat higher spatial resolution. The difference is also in scattering mechanisms reflected in polarisations of C-band sensors, with HH-pol including also double bounce mechanism that can help in identifying logged areas more effectively. Volume scattering is expected to contribute less in detecting subtle changes in forest volume (related to selective logging), and surface scattering would require logged trails to be relatively large and incidence angle more steep. Also, spatial resolution is expected to play an important role. This calls for further investigation if similar type of approach as used in this study (applying variational filter to capture texture in log-ratio image) is effectively applicable for monitoring selective logging of tropical forests with Sentinel-1 time series. One important question is whether more frequent revisits (12 days repeat pass of Sentinel-1 versus 24 days for RADARSAT-2) could compensate for difference in resolution. The difference in scattering mechanisms would still remain. This would ideally require a benchmarking study with both types of data to enable meaningful comparison and trade-off analysis. Also, potential of C-band InSAR for detecting relevant changes should be investigated, particularly with Sentinel-1 [45], keeping in mind somewhat higher penetration capability of InSAR coherence compared to SAR backscatter [46,47].
4. Conclusions
Time series of C-band SAR data are to our understanding feasible in detecting the areas that are affected by selective logging. The change detection approach using C-band satellite SAR data can be used to define a stratified sample for the accurate evaluation of disturbed area and removed forest biomass. Also, the potential of developed and demonstrated SAR time series based methodology to directly and semi-automatically evaluate the disturbed forest areas looks promising. Further research with more accurate reference data and different image segmentation strategies might be needed in order to fully support this claim.
The developed methodology for mapping selectively logged areas was demonstrated with Multi-look Fine data of RADARSAT-2. It should be applicable with other C-band sensors of comparable resolution, provided a high number of scenes is collected both before and after the logging event. Ascending and descending acquisition geometries are recommended to be used to circumvent omission error in disturbed forest detection due to sensitivity to look direction.
Author Contributions
Conceptualization, Y.R., F.M.S., and O.A.; methodology, O.A. and Y.R.; validation, T.H., Y.R.; formal analysis, O.A., Y.R.; investigation O.A., Y.R., J.P.; data curation, F.M.S., Y.R., T.H.; writing–original draft preparation, O.A., Y.R.; writing–review and editing, O.A., Y.R., T.H.; supervision, T.H., Y.R., J.P. All authors have read and agreed to the published version of the manuscript.
Funding
The work was performed primarily during GSE Forest Monitoring: REDD extension project funded by European Space Agency. O.A. was also supported by MULTICO project funded by Business Finland, grant agreement 6501/31/2019. All authors were also supported by their institutions. The costs of open access publishing are covered by VTT.
Data Availability Statement
The final maps presented in this study are available upon reasonable request from the corresponding author. The RADARSAT-2 data are not publicly available due to license conditions.
Acknowledgments
RADARSAT-2 data were provided by ESA in the framework of project C1P3810. Authors would like to thank anonymous reviewers for their useful suggestions and comments.
Conflicts of Interest
The authors declare no conflict of interest.
Abbreviations
The following abbreviations are used in this manuscript:
| AGB | Above ground biomass |
| AOI | Area of Interest |
| ALOS | Advanced Land Observing Satellite |
| DEM | Digital Elevation Model |
| ETM | Enhanced Thematic Mapper |
| GFOI | Global Forest Observation Initiative |
| InSAR | Interferometric Synthetic Aperture Radar |
| MF3W | Multilook Fine mode |
| PALSAR | Phase Add-on L-band Synthetic Aperture Radar |
| RADARSAT | Radar Satellite |
| SAR | Synthetic Aperture Radar |
| SLC | Single Look Complex |
| SRTM | Shuttle Radar Topography Mission |
| SWIR | Short Wave Infrared |
References
- Lund, H.G. What is a Degraded Forest? White paper on forest degradation definitions prepared for FAO; Forest Information Services: Gainesville, FL, USA, 2007. [Google Scholar]
- Simula, M. Towards Defining Forest Degradation: Comparative Analysis of Existing Definitions; Forest Resources Assessment Working Paper, No. 154; FAO: Rome, Italy, 2009; 57p. [Google Scholar]
- Asner, G.P.; Knapp, D.E.; Broadbent, E.N.; Oliveira, P.J.C.; Keller, M.; Silva, J.N. Selective logging in the Brazilian Amazon. Science 2005, 310, 480–482. [Google Scholar] [CrossRef] [PubMed]
- Nepstad, D.; Veríssimo, A.; Alencar, A.; Nobre, C.; Lima, E.; Lefebvre, P.; Schlesinger, P.; Potter, C.; Moutinho, P.; Mendoza, E.; et al. Large-scale impoverishment of amazonian forests by logging and fire. Nature 1999, 398, 505–508. [Google Scholar] [CrossRef]
- Huang, M.; Asner, G.P. Long-term carbon loss and recovery following selective logging in Amazon forests. Glob. Biogeochem. Cycles 2010, 24. [Google Scholar] [CrossRef]
- Hame, T.; Kilpi, J.; Ahola, H.A.; Rauste, Y.; Antropov, O.; Rautiainen, M.; Sirro, L.; Bounpone, S. Improved mapping of tropical forests with optical and SAR imagery, Part I: Forest cover and accuracy assessment using multi-resolution data. IEEE J. Sel. Top. Appl. Earth Obs. Remote Sens. 2013, 6, 74–91. [Google Scholar] [CrossRef]
- GFOI. Integrating Remote-Sensing and Ground-Based Observations for Estimation of Emissions and Removals of Greenhouse Gases in Forests: Methods and Guidance from the Global Forest Observations Initiative; Group on Earth Observations: Geneva, Switzerland, 2014. [Google Scholar]
- Reiche, J.; Lucas, R.; Mitchell, A.; Verbesselt, J.; Hoekman, D.; Haarpaintner, J.; Kellndorfer, J.; Rosenqvist, A.; Lehmann, E.; Woodcock, C.; et al. Combining satellite data for better tropical forest monitoring. Nat. Clim. Chang. 2016, 6, 120–122. [Google Scholar] [CrossRef]
- Souza, C.M.; Roberts, D.A.; Cochrane, M.A. Combining spectral and spatial information to map canopy damage from selective logging and forest fires. Remote Sens. Environ. 2005, 98, 329–343. [Google Scholar] [CrossRef]
- Matricardi, E.A.; Skole, D.L.; Pedlowski, M.A.; Chomentowski, W.; Fernandes, L.C. Assessment of tropical forest degradation by selective logging and fire using Landsat imagery. Remote Sens. Environ. 2010, 114, 1117–1129. [Google Scholar] [CrossRef]
- Zhu, Z.; Woodcock, C.E.; Olofsson, P. Continuous monitoring of forest disturbance using all available Landsat imagery. Remote Sens. Environ. 2012, 122, 75–91. [Google Scholar] [CrossRef]
- Stone, T.A.; Lefebvre, P. Using multi-temporal satellite data to evaluate selective logging in Para, Brazil. Int. J. Remote Sens. 1998, 19, 2517–2526. [Google Scholar] [CrossRef]
- de Wasseige, C.; Defourny, P. Remote sensing of selective logging impact for tropical forest management. For. Ecol. Manag. 2004, 188, 161–173. [Google Scholar] [CrossRef]
- Joshi, N.; Mitchard, E.T.; Woo, N.; Torres, J.; Moll-Rocek, J.; Ehammer, A.; Collins, M.; Jepsen, M.R.; Fensholt, R. Mapping dynamics of deforestation and forest degradation in tropical forests using radar satellite data. Environ. Res. Lett. 2015, 10, 034014. [Google Scholar] [CrossRef]
- Hirschmugl, M.; Steinegger, M.; Gallaun, H.; Schardt, M. Mapping forest degradation due to selective logging by means of time series analysis: Case studies in Central Africa. Remote Sens. 2014, 6, 756–775. [Google Scholar] [CrossRef]
- Cremer, F.; Urbazaev, M.; Cortés, J.; Truckenbrodt, J.; Schmullius, C.; Thiel, C. Potential of recurrence metrics from Sentinel-1 time series for deforestation mapping. IEEE J. Sel. Top. Appl. Earth Obs. Remote Sens. 2020, 13, 5233–5240. [Google Scholar] [CrossRef]
- Bouvet, A.; Mermoz, S.; Ballère, M.; Koleck, T.; Le Toan, T. Use of the SAR shadowing effect for deforestation detection with Sentinel-1 time series. Remote Sens. 2018, 10, 1250. [Google Scholar] [CrossRef]
- Tomppo, E.; Antropov, O.; Praks, J. Boreal forest snow damage mapping using multi-temporal Sentinel-1 data. Remote Sens. 2019, 11, 384. [Google Scholar] [CrossRef]
- Thiele, A.; Boldt, M.; Hinz, S. Automated detection of storm damage in forest areas by analyzing TerraSAR-X data. In Proceedings of the 2012 IEEE International Geoscience and Remote Sensing Symposium, Munich, Germany, 22–27 July 2012; pp. 1672–1675. [Google Scholar]
- Rüetschi, M.; Small, D.; Waser, L.T. Rapid detection of windthrows using Sentinel-1 C-Band SAR data. Remote Sens. 2019, 11, 115. [Google Scholar] [CrossRef]
- Hansen, J.N.; Mitchard, E.T.A.; King, S. Assessing forest/non-forest separability using Sentinel-1 C-Band synthetic aperture radar. Remote Sens. 2020, 12, 1899. [Google Scholar] [CrossRef]
- Deutscher, J.; Perko, R.; Gutjahr, K.; Hirschmugl, M.; Schardt, M. Mapping tropical rainforest canopy disturbances in 3D by COSMO-SkyMed spotlight InSAR-stereo data to detect areas of forest degradation. Remote Sens. 2013, 5, 648–663. [Google Scholar] [CrossRef]
- Rauste, Y.; Antropov, O.; Hame, T.; Ramminger, G.; Gomez, S.; Seifert, F.M. Mapping selective logging in tropical forest with space-borne SAR data. In ESA Special Publication, Proceedings of the ESA Living Planet Symposium, Edinburgh, UK, 9–13 September 2013; ESA: Paris, France, 2013; Volume 722, p. 168. [Google Scholar]
- Antropov, O.; Rauste, Y.; Seifert, F.M.; Häme, T. Selective logging of tropical forests observed using L- and C-band SAR satellite data. In Proceedings of the 2015 IEEE International Geoscience and Remote Sensing Symposium (IGARSS), Milan, Italy, 26–31 July 2015; pp. 3870–3873. [Google Scholar]
- Antropov, O.; Rauste, Y.; Väänänen, A.; Mutanen, T.; Häme, T. Mapping forest disturbance using long time series of Sentinel-1 data: Case studies over boreal and tropical forests. In Proceedings of the 2016 IEEE International Geoscience and Remote Sensing Symposium (IGARSS), Beijing, China, 10–15 July 2016; pp. 3906–3909. [Google Scholar]
- Hethcoat, M.; Carreiras, J.; Edwards, D.; Bryant, R.; Quegan, S. Detecting tropical selective logging with SAR data requires a time series approach. bioRxiv 2020. [Google Scholar] [CrossRef]
- Hoekman, D.; Kooij, B.; Quiñones, M.; Vellekoop, S.; Carolita, I.; Budhiman, S.; Arief, R.; Roswintiarti, O. Wide-area near-real-time monitoring of tropical forest degradation and deforestation using Sentinel-1. Remote Sens. 2020, 12, 3263. [Google Scholar] [CrossRef]
- Imhoff, M.L. Radar backscatter and biomass saturation: Ramifications for global biomass inventory. IEEE Trans. Geosci. Remote Sens. 1995, 33, 511–518. [Google Scholar] [CrossRef]
- Englhart, S.; Keuck, V.; Siegert, F. Aboveground biomass retrieval in tropical forests —The potential of combined X- and L-band SAR data use. Remote Sens. Environ. 2011, 115, 1260–1271. [Google Scholar] [CrossRef]
- Quegan, S.; Le Toan, T.; Yu, J.J.; Ribbes, F.; Floury, N. Multitemporal ERS SAR analysis applied to forest mapping. IEEE Trans. Geosci. Remote Sens. 2000, 38, 741–753. [Google Scholar] [CrossRef]
- Quegan, S.; Yu, J.J. Filtering of multichannel SAR images. IEEE Trans. Geosci. Remote Sens. 2001, 39, 2373–2379. [Google Scholar] [CrossRef]
- Antropov, O.; Rauste, Y.; Häme, T.; Praks, J. Polarimetric ALOS PALSAR time series in mapping biomass of boreal forests. Remote Sens. 2017, 9, 999. [Google Scholar] [CrossRef]
- De Grandi, E.C.; Mitchard, E.; Woodhouse, I.H.; De Grandi, G.D. Spatial wavelet statistics of SAR backscatter for characterizing degraded forest: A case study from Cameroon. IEEE J. Sel. Top. Appl. Earth Obs. Remote Sens. 2015, 8, 3572–3584. [Google Scholar] [CrossRef]
- Thiel, C.; Cartus, O.; Eckardt, R.; Richter, N.; Thiel, C.; Schmullius, C. Analysis of multi-temporal land observation at C-band. In Proceedings of the 2009 IEEE International Geoscience and Remote Sensing Symposium, Cape Town, South Africa, 12–17 July 2009; Volume 3, pp. III-318–III-321. [Google Scholar]
- Small, D. Flattening gamma: Radiometric terrain correction for SAR imagery. IEEE Trans. Geosci. Remote Sens. 2011, 49, 3081–3093. [Google Scholar] [CrossRef]
- Rauste, Y.; Lönnqvist, A.; Molinier, M.; Henry, J.B.; Häme, T. Ortho-rectification and terrain correction of polarimetric SAR data applied in the ALOS/PALSAR context. In Proceedings of the IEEE International Geoscience & Remote Sensing Symposium, IGARSS 2007, Barcelona, Spain, 23–28 July 2007; pp. 1618–1621. [Google Scholar]
- Häme, T.; Sirro, L.; Kilpi, J.; Seitsonen, L.; Andersson, K.; Melkas, T. A hierarchical clustering method for land cover change detection and identification. Remote Sens. 2020, 12, 1751. [Google Scholar] [CrossRef]
- Grover, K.; Quegan, S.; da Costa Freitas, C. Quantitative estimation of tropical forest cover by SAR. IEEE Trans. Geosci. Remote Sens. 1999, 37, 479–490. [Google Scholar] [CrossRef]
- Dekker, R.J. Speckle filtering in satellite SAR change detection imagery. Int. J. Remote Sens. 1998, 19, 1133–1146. [Google Scholar] [CrossRef]
- Bovolo, F.; Bruzzone, L. A detail-preserving scale-driven approach to change detection in multitemporal SAR images. IEEE Trans. Geosci. Remote Sens. 2005, 43, 2963–2972. [Google Scholar] [CrossRef]
- Oliver, C.; Quegan, S. Understanding Synthetic Aperture Radar Images; EngineeringPro Collection; SciTech Publ.: Raleigh, NC, USA, 2004. [Google Scholar]
- Zhuang, H.; Tan, Z.; Deng, K.; Fan, H. It is a misunderstanding that log ratio outperforms ratio in change detection of SAR images. Eur. J. Remote Sens. 2019, 52, 484–492. [Google Scholar] [CrossRef]
- Kooij, M. Forest logging alerts from RADARSAT-2 data. In Proceedings of the SENGEF—XI Seminário de Atualização em Sensoriamento Remoto e Sistemas de Informações Geográficas Aplicados à Engenharia Florestal, Curitiba, Brazil, 14–16 October 2014. [Google Scholar]
- Staples, G.; Green, G.; Chen, J.; Gravelle, S.; Goodenough, D. Detection and validation of forest distubances using RADARSAT-2 data. In Proceedings of the 2017 IEEE International Geoscience and Remote Sensing Symposium (IGARSS), Fort Worth, TX, USA, 23–28 July 2017; pp. 5798–5801. [Google Scholar]
- Jacob, A.W.; Vicente-Guijalba, F.; Lopez-Martinez, C.; Lopez-Sanchez, J.M.; Litzinger, M.; Kristen, H.; Mestre-Quereda, A.; Ziółkowski, D.; Lavalle, M.; Notarnicola, C.; et al. Sentinel-1 InSAR coherence for land cover mapping: A comparison of multiple feature-based classifiers. IEEE J. Sel. Top. Appl. Earth Obs. Remote Sens. 2020, 13, 535–552. [Google Scholar] [CrossRef]
- Treuhaft, R.N.; Siqueira, P.R. Vertical structure of vegetated land surfaces from interferometric and polarimetric radar. Radio Sci. 2000, 35, 141–177. [Google Scholar] [CrossRef]
- Olesk, A.; Praks, J.; Antropov, O.; Zalite, K.; Arumäe, T.; Voormansik, K. Interferometric SAR coherence models for characterization of hemiboreal forests using TanDEM-X data. Remote Sens. 2016, 8, 700. [Google Scholar] [CrossRef]


Publisher’s Note: MDPI stays neutral with regard to jurisdictional claims in published maps and institutional affiliations. |
© 2021 by the authors. Licensee MDPI, Basel, Switzerland. This article is an open access article distributed under the terms and conditions of the Creative Commons Attribution (CC BY) license (http://creativecommons.org/licenses/by/4.0/).