Abstract
Rapid and accurate extraction of shoreline is of great significance for the use and management of sea area. Remote sensing has a strong ability to obtain data and has obvious advantages in shoreline survey. Compared with visible-light remote sensing, synthetic aperture radar (SAR) has the characteristics of all-weather and all-day working. It has been well-applied in shoreline extraction. However, due to the influence of natural conditions there is a problem of weak boundary in extracting shoreline from SAR images. In addition, the complex micro topography near the shoreline makes it difficult for traditional visual interpretation and image edge detection methods based on edge information to obtain a continuous and complete shoreline in SAR images. In order to solve these problems, this paper proposes a method to detect the land–sea boundary based on a geometric active contour model. In this method, a new symbolic pressure function is used to improve the geometric active-contour model, and the global regional smooth information is used as the convergence condition of curve evolution. Then, the influence of different initial contours on the number and time of iterations is studied. The experimental results show that this method has the advantages of fewer iteration times, good stability and high accuracy.
1. Introduction
The coastal zone is rich in biological, mineral, energy, land and other natural resources. Shoreline is the boundary between sea and land, and is also the outpost of national defense. Accurate and rapid determination of the location, direction and outline of shoreline plays an important role in coastal environmental protection and marine resource management. The traditional field survey methods are labor-intensive, inefficient, long-term, and the data obtained are not easy to be counted. Remote sensing has a strong ability to obtain data and has obvious advantages in shoreline survey [1]. Visible remote sensing is often used in shoreline extraction due to its imaging characteristics in line with human visual characteristics. However, it is limited by illumination and climate conditions. Compared with visible-light remote sensing, synthetic aperture radar (SAR) has the characteristics of all-weather and all-day operation [2]. It can image a large area and record the information of shoreline changes under bad weather conditions. SAR has been well-applied in shoreline extraction [3,4,5,6]. However, sometimes the contrast between ocean and land is not strong and the boundary is not always clear, which makes the shoreline extraction of SAR images a challenging problem.
So far, there are two main methods to detect shoreline from SAR images: visual interpretation and automatic interpretation. Usually, the digital manual tracking method is adopted to mark the boundary between ocean and land according to the trend, texture, shape and other interpretation marks of shoreline characteristics in SAR images, as well as the differences between tidal flats and water bodies near the coastal zone. This process is visual interpretation. However, because visual interpretation needs image interpretation, the reader must have rich visual interpretation experience and master all kinds of geoscience knowledge, which requires greater labor. Moreover, this interpretation method is time-consuming in human and material resources, and to a certain extent, it is difficult to ensure the quality of the interpretation image. Based on this, the current research on SAR-image shoreline extraction mainly focuses on the automatic interpretation.
Based on the characteristics of land and water boundary, extracting shoreline from SAR images is actually an image-segmentation process. The most classical image-segmentation methods are edge-differential operators (such as Sobel operator, Canny operator and Roberts operator). Although these edge-differential operators are simple and fast they are sensitive to noise, and the edge location is not accurate enough, so they lack universal applicability. In order to detect the complete and continuous shoreline from SAR images, many researchers have done a lot of active exploration and also put forward some effective extraction methods.
The geometric active contour (GAC) model [7] was developed on the basis of the active-contour model (ACM). ACM was a major breakthrough in the field of extracting image boundary and has very practical research value [8]. In recent years, with the extensive and in-depth study of ACM, the GAC model has wide use in the world, involving more and more fields. The GAC model also shows strong practicability in the field of SAR-image boundary extraction. However, due to problems of SAR images such as fuzzy boundary, low contrast, high gray level and easy interference by noise, the method of the GAC model can still encounter some problems such as weak boundary, the number of iterations and iteration times being easily affected by the initial contour of the image, and influence of image preprocessing on the shoreline extraction from SAR images.
In order to solve the problem of weak boundary in SAR-image shoreline extraction, this paper proposes a method of sea–land boundary detection based on a geometric active-contour model. This method improves the GAC model through combining the global regional smooth information as the convergence condition of curve evolution, which is helpful to solve the problem of weak shoreline boundary. New symbolic pressure function combined with regional information is proposed as the boundary stop condition of the GAC model, and the shoreline is accurately extracted. In this paper, the influence of different initial contours of a SAR image on the iterations of shoreline detection is studied. It shows that the larger the initial contour selection of the image, the fewer number of iterations and the shorter the iteration times. Experiments show that the proposed method cannot only effectively detect the shoreline in SAR images, but also reduce the number of iterations and shorten the iteration times compared with other related shoreline extraction methods, and the detection accuracy is further improved.
The paper is structured as follows. The background and related work, which includes the main methods for shoreline extraction of SAR images, are presented in Section 2. The materials and methods, which include the study area, traditional geometric active contour model, the improvement of geometric active contour model and the method of shoreline extraction in this paper, are described in Section 3. In Section 4, the results are presented. The influence of the selection of a SAR-image initial contour is verified in Section 5. The results and the future research directions are discussed in Section 6. Finally, the conclusions are summarized in Section 7.
2. Background and Related Work
At present, many scholars have carried out research on SAR-image shoreline-extraction technology and achieved many meaningful research results. There are two main methods for shoreline detection of remote sensing image, which are based on edge detection and region segmentation. The main methods include boundary tracking algorithm, Markovian segmentation method, active contour model method, level set algorithm and so on.
The boundary tracking algorithm [9,10] first analyzes the normal distribution of ocean and land pixels in the image, and then sets a threshold value according to the mean value and standard deviation to distinguish the ocean and land in the image to obtain the binary image. Then, the boundary-tracking algorithm is set to send out from a certain shoreline point to plot the boundary contour of ocean and land. The algorithm is intuitive, simple and easy to operate, and can get continuous shoreline. However, the shoreline obtained by this algorithm depends on the separation of land and ocean in the image, that is, smoothing, filtering and threshold selection, so it has great limitations and is generally applied in the case of low-accuracy requirements. In order to solve the problem of edge discontinuity and false edge, a ridge-tracking technique for edge extraction from noisy data was proposed in [11,12].
Markovian segmentation method uses the concept of the Markovian random field and simulated annealing method to extract shoreline [13]. First, the resolution of the image is reduced and the influence of speckle noise is reduced. The minimum value of energy function is solved by a simulated annealing method. The pixels in the image are classified (sea, land, low wave zone, beach). The right angle gradient operator is defined to obtain an approximate rough boundary. Then, the image resolution is restored and the above steps are applied to the high-resolution image. Finally, the shoreline is obtained. However, the method of Markovian random field and simulated annealing still has errors in the classification of pixels in the image, and the amount of calculation is relatively large [14].
ACM is also called the snakes algorithm, which is a kind of algorithm based on human visual characteristics [8]. The algorithm first gives an initial contour in the region of interest in the image and then minimizes an energy function to drive the contour line to move in the image. After several iterations, the contour line is constantly changed, and finally the boundaries of the objects in the image are approached. The active contour method can get the outline of each object in the image. However, because of the poor stability of the active contour method and high requirement for the position of initial contour, it can only be applied to the detection of simple images.
The level-set algorithm [15,16] follows the characteristics of the active-contour method. In this kind of algorithm, it is also necessary to give the initial contour line, and the requirement of the initial contour position is lower than that of the active-contour method. The level-set algorithm has strong topology adaptability, and contour curves can be merged or separated automatically without additional treatment. Given a simple initial contour, the boundary of the object in the image can be obtained. Moreover, the two-dimensional curves are embedded into the three-dimensional surfaces, so that the numerical solution in this method is stable and there is a unique solution. However, due to the iterative algorithm of 3D surface, it leads to a large number of calculations and high complexity.
The GAC model is based on the level-set method and curve-evolution theory [17]. The basic idea of the GAC model for extracting shoreline from SAR images is: (1) Using continuous curve to describe image edge and combining with image information to define energy functional. (2) Then using the Euler Lagrange method to get the curve-evolution equation corresponding to the energy functional. (3) Finally using level set to simulate the evolution process of initial curve along the direction of the fastest energy decline to obtain the optimal boundary-contour curve. The GAC model can be classified as edge-based, region-based and hybrid models.
Above all, the shoreline obtained by the boundary-tracking algorithm depends on the separation of land and ocean in the image, which has great limitations. ACM can obtain continuous shoreline, but it is sensitive to the initial contour and cannot handle the boundary topology adaptively; it is usually used in combination with other methods, such as clustering algorithms [18] and wavelet-edge detection [19]. According to different energy function, ACM can be divided into region-based ACMs and edge-based ACMs (EL-ACMs). Region-based ACMs cannot simulate the heterogeneity of coastal zones with a single probability distribution, especially in high-resolution images [20]. EL-ACMs construct edge indicators based on edge information or gradient, which allows contours to evolve rapidly in homogeneous regions and stop at real boundaries [21]. They have been also used for shoreline extraction from SAR images [18]. The level-set algorithm follows the characteristics of the active-contour method and also needs to give the initial contour line, but the requirement for the position of the initial contour is lower than that of the active-contour method. The existing SAR-image shoreline-detection technology mostly uses the method based on the active-contour model or level set for iterative calculation, which has high computational complexity, and detection accuracy is greatly affected by the initial contour, window size and other factors [8,16,22]. The method of the GAC model to extract the shoreline of a SAR image will still encounter some problems, such as weak boundary, and number of iterations and iteration times, which are easily affected by the initial contour of the SAR image.
Shoreline extraction methods based on multipolarization SAR have also been proposed [14,23]. In [23], radar frequency was shown to have great influence on the method of SAR-based shoreline extraction.
In addition, the classical fuzzy C-means (FCM) method was also applied to shoreline detection, and the Wavelet decomposition algorithm was combined to better suppress the inherent speckle noise of SAR images [24]. In [25], a nonparametric fuzzy approach was proposed for shoreline extraction from Sentinel-1A. In [26], a shoreline extraction method based on spatial pattern analysis was proposed, which includes image decomposition, smoothing, segmentation and shoreline compensation. A learning process that involves spatial patterns was presented in the image-decomposition step. A nonlocal means filter was used to smooth the outline images, and then the graphic cutting technology was applied to segment the images into sea and land areas. The positioning accuracy was determined using the snakes algorithm. In [27], J-Net Dynamic which is an experimental algorithm was applied on a high-resolution Sentinel-1 SAR image for the first time.
Relevanting works, a new diffusion-based method for the delineation of shorelines from space-borne polarimetric SAR imagery, was presented in [28]. The over-segmentation problem is solved by combining neighboring segments with similar radar brightness. In [29], shoreline rotation has been analyzed to provide a better understanding of the morphodynamic processes of natural embayed beaches. In [30], a shoreline monitoring system based on satellite SAR imagery was studied. In this system, a shoreline-extraction technique was developed based on the edge-detection technique, and a simple polynomial function was introduced to represent the shoreline location at arbitrary water level. In [31], a semiautomatic coastline-extracting approach was proposed based on fuzzy connectivity concepts. And an automatic procedure was proposed for the evaluation of results.
Although the above results have improved the performance of shoreline extraction to a certain extent, there are still many problems to be further studied. Generally speaking, the boundary tracking algorithm, Markovian segmentation method and active-contour method are seldom used independently due to their detection effect. For SAR-image shoreline extraction, it is necessary to analyze the extraction effect, antinoise ability and complexity.
3. Materials and Methods
3.1. Study Area
We used the SAR image observed by RADARSAT-2, a Canadian radar satellite series. Compared with the RADARSAT-1 satellite, the RADARSAT-2 satellite has a more powerful imaging function and has become one of the most advanced commercial SAR satellites in the world. First, the RADARSAT-2 satellite can switch between left view and right view according to the command, and all wave velocities can be viewed left or right, which shortens the revisit times and increases the ability to obtain stereo images. Second, RADARSAT-2 retains all imaging modes of RADARSAT-1 and adds spot light mode, hyperfine mode, four polarization (fine, standard) mode and multiview fine mode, giving users more flexibility in imaging-mode selection. Third, the RADARSAT-1 satellite only provides HH polarization mode, while the RADARSAT-2 satellite can provide VV, HH, HV, VH and other polarization modes. The coasts of interest are shown in Figure 1. The study area is near the South China Sea.
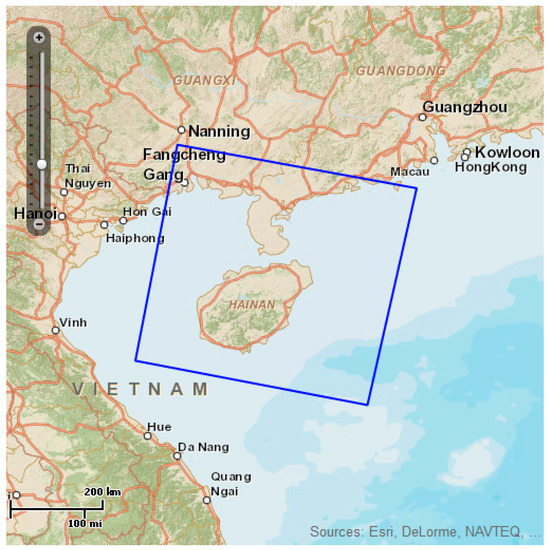
Figure 1.
Administrative division map of the study area.
3.2. Theoretical Background
3.2.1. Traditional Geometric Active Contour Model
The geometric active contour model was developed on the basis of the active-contour model. Compared with the active-contour model, the geometric active contour model has the advantages of natural handling of topological structure changes, insensitivity to initial conditions and simple numerical implementation. These characteristics have attracted more and more attention, and this model is widely used in computer vision and image processing.
Based on the definition of energy functional, the GAC model can fall into boundary model and region model categories. The geodesic active-contour model was the most typical boundary model proposed in 1997 [32]. This model can solve the problems of the sensitivity of the snakes model to initial conditions and the inability to deal with topological changes automatically. The geodesic active-contour model is a special case of the snakes model, and its energy functional E is:
where C is the parametric plane curve, I is the known image, and g is the edge stopping function (ESF):
where G is a Gaussian function with variance .
The value of g tends to 0 where the image gradient is large, and tends to 1 where the image gradient is small. The curve evolves to the position where g tends to 0, which can effectively extract the target boundary. The geometric active-contour model based on the level-set method can automatically deal with the topological changes of curves in the evolution process, and a similar boundary model has been proposed in [33]. The curve evolution termination conditions of the above boundary models all depend on the edge-detection operator based on image gradient. In fact, for low-contrast targets, the edge detection operator does not converge to 0, and then the evolution curve can cross the boundary. Moreover, the edge-detection operator is sensitive to noise, which makes the evolution curve of the boundary model easy to fall into local extremum, resulting in redundant contour.
Compared with the boundary model, the region model defines the energy functional by using the global region information inside and outside the active contour, and does not use the edge-detection operator based on image gradient, which is more conducive to SAR-image shoreline detection. Based on this, this paper uses the region-based geometric active-contour model to detect the shoreline of SAR images. Assuming that the image is composed of two homogeneous regions, I is the original image to be segmented, C is the closed contour, and the energy functional is defined as follows [34]:
where t1 and t2 are constants greater than zero and are used to control the weight of the internal and external energy of the curve, and c1 and c2 are the average gray values of the image inside and outside the contour-division area, respectively.
It can be seen that the model combines the global information of the image, and its energy function is independent of the gradient of the image, so it is suitable for the edge extraction of the image with smooth boundary and discontinuous boundary. But it is not suitable for the image whose gray level of target and background is not obvious. In addition, although the initial position of the evolution curve has little effect on the result of edge detection, the evolution speed still depends on the initial position of the evolution curve, and the level-set function must be periodically reinitialized, which increases the time and computational complexity of edge detection to a certain extent.
3.2.2. Improvement of Geometric Active Contour model
The signed pressure function (SPF) is often used as the edge-stopping function in the region-based geometric active-contour model [35]:
where I is the original image to be segmented, and c1 and c2 are the average gray values of the image inside and outside the contour division area, respectively.
Because c1 and c2 are the average gray values of the image inside and outside the contour division area, the SPF function will not be able to segment the weak boundary when the contrast of the image is not high. For solving this problem, we replace (c1 + c2)/2 in Equation (4) with a weighted function f LBF in the local binary fitting (LBF) model [36], and a new SPF function for the image area can be given by:
The weighted function is with parameter .
Then the corresponding evolution equation of the level-set function region-based can be written as:
where is the spherical force controlling the contraction and expansion of the curve, and is the level set function.
In this paper, the evolution process of the geometric active-contour model shown in Figure 2 includes the following steps:
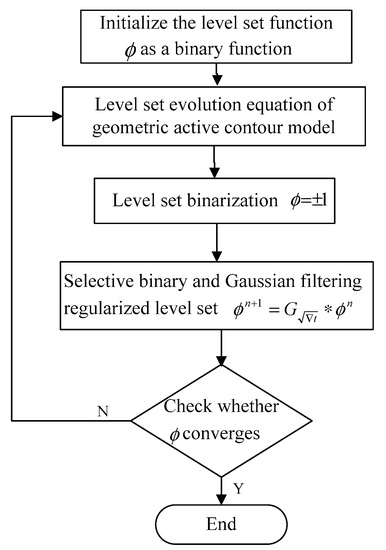
Figure 2.
Evolution process of geometric active-contour model.
Step 1: Initialize the level-set function as a binary function;
where k is a constant greater than zero, is a subset of the image domain , and is the boundary of the region .
Step 2: The simplest level-set evolution equation is calculated by combining f LBF and SPFLBF;
Step 3: If , set as ; otherwise, set as ;
Step 4: Selective binary and Gaussian filtering regularized level set (SBGFRLS) method [35,36] is used;
where and are the values of obtained by the nth and (n + 1)th iterations respectively, and is the Gaussian kernel function with variance .
Step 5: Check whether converges. If not, return to step 2.
The geometric active-contour model proved in this paper combines the global regional smooth information as the convergence condition of curve evolution, which can effectively solve the influence of speckle noise on the segmentation of the land–sea boundary line in SAR images. The improvement of the symbolic pressure function can solve the problem of weak shoreline boundary. In addition, the SBGFRLS method can obtain faster convergence speed in the process of level-set evolution. In this paper, we use simple grid sampling points to obtain the initial positioning of the shoreline boundary as the initial contour of curve evolution, which can not only reduce the iterative time of the algorithm, but also reduce the possibility of boundary leakage caused by fuzzy boundary to a certain extent, so as to obtain more accurate detection results.
3.3. Method
3.3.1. Acquisition of Initial Contour
In order to reduce the evolution time of the geometric active-contour model, several small disks are used as the initial contour of shoreline, as shown in Figure 3. First, a numerical matrix is used to convolute the preprocessed target image. In the convolution processed SAR image, the grid sampling points are generated by the grid-sampling point function [37]. A disk with a radius of 9 pixels is created in the grid, and the image is inflated by the method of image expansion to achieve the effect of strengthening the shoreline edge.
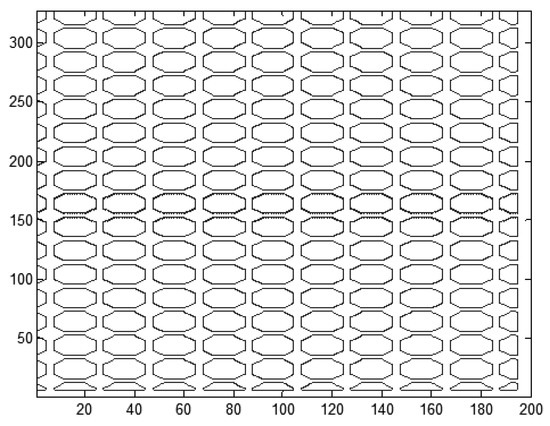
Figure 3.
Initial contour.
3.3.2. Accurate Extraction of Shoreline
The accurate extraction process of shoreline is as follows:
Step 1: The SAR image is read and preprocessed;
Step 2: The SAR image is convoluted to generate grid sampling points and then several small disks are drawn as the initial contour of the shoreline;
Step 3: The initial contour of shoreline obtained in step 2 is used as the input of the geometric active-contour model. The improved symbolic pressure function is used as the boundary stop condition of the geometric active-contour model. The binary level-set function is quickly initialized by a Gaussian filter, and the shoreline is vectorized. Finally, a continuous shoreline is obtained.
Figure 4 is the flow chart of this method.
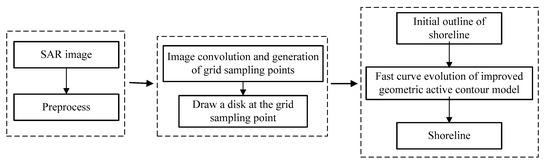
Figure 4.
Extraction process of shoreline.
4. Results
In this section, the method is compared with the improved Canny operator method [38], boundary-tracking algorithm [9] and a traditional geometric active-contour model method [7]. At the same time, we label the shoreline manually and define it as follows: Error pixel is the sum of missed pixel and false detection pixel; correct pixel is the difference between detection result and false detection pixel; error rate is the ratio of wrong pixel number to manually labeled pixel number; accuracy is the ratio of correct pixel number to manually labeled pixel number. An ideal detection method must have a high accuracy and a low error rate. Figure 5a shows the original stripmap, select single-polarimetric, HH collected SAR image around the South China Sea area. The spatial resolution is 6.8 × 7.0 m; the number of looks is 1. The acquisition mode is fine.
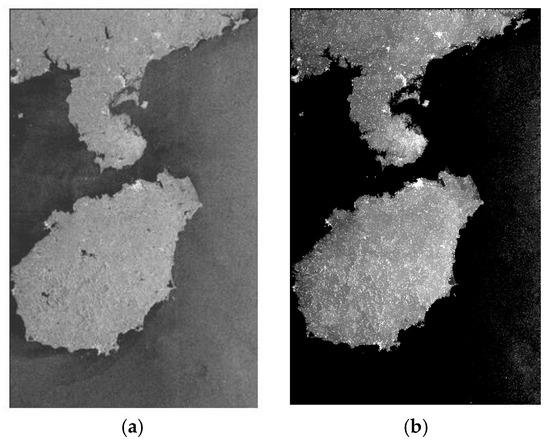
Figure 5.
Synthetic aperture radar (SAR) image: (a) Original SAR image; (b) SAR image after gray transformation.
The gray contrast of the original SAR image used in this paper is low. In order to achieve better shoreline extraction, the gray-level transformation method of piecewise linear transformation is used to adjust the image contrast, and the result is shown in Figure 5b.
In Figure 6, the shoreline is less affected by the external natural conditions, and the clarity is relatively high. The improved Canny operator method can detect continuous edge points, but there are many false detection pixels, resulting in a high error rate. The boundary-tracking algorithm and the traditional geometric-active contour model method have many false detection pixels and missing pixels, which lead to a high error rate. The method in this paper has higher accuracy and a lower error rate, and the extraction results are better. See Table 1 for details.
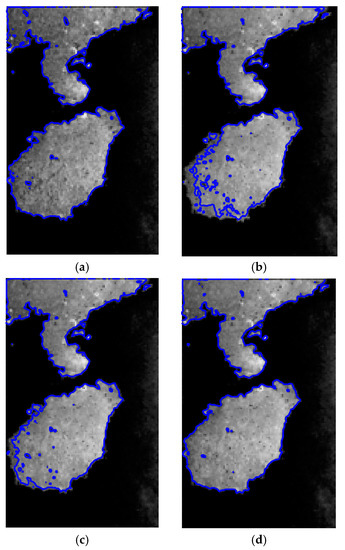
Figure 6.
Shoreline extraction results: (a) Improved Canny operator method; (b) Boundary-tracking algorithm; (c) Traditional geometric active-contour modeling method; (d) Proposed method.

Table 1.
Algorithm extraction performance results.
It can be seen from Table 2 that the improved Canny method has 1693 iterations, and the operation time is 363.15 s. The boundary-tracking method has 1389 iterations, with the operation time of 289.63 s, and the traditional GAC model method has 1212 iterations, and the operation time is 267.98 s. However, due to the use of small disks as the initial contour of shoreline, the proposed method has 164 iterations and the operation time is 25.92 s.
Table 2.
Comparison of extraction efficiency of algorithm.
In order to further intuitively observe the detection effect, Figure 7 shows the local enlarged results of shoreline extraction in Figure 6. From the visual point of view, it can be clearly seen that the shoreline extracted by the improved Canny operator method, boundary-tracking algorithm and traditional GAC model method has a large extraction error, while the shoreline extracted from the SAR image by the proposed method is more ideal.
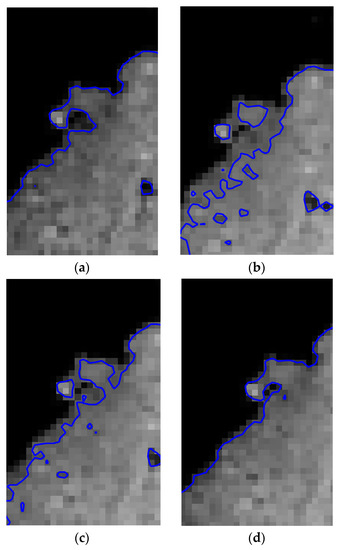
Figure 7.
Local shoreline extraction results: (a) Improved Canny operator method; (b) Boundary-tracking algorithm; (c) Traditional geometric active-contour modeling method; (d) Proposed method.
5. Validation
In order to further verify the influence of the selection of the SAR image initial contour on the iteration number and operation times, this section selects small initial contour, large initial contour and global image as the initial contour of the image, and sets the maximum iteration number to 6000 times. The specific extraction results are shown in Figure 8, Figure 9 and Figure 10, in which Figure 8 is the extraction-effect diagram of small initial contour, Figure 9 is the extraction-effect diagram of large initial contour, and Figure 10 is the detection result of global image as initial contour. Among the three extraction result graphs, (a) is the initial contour of the target image, (b) is the position of the initial contour in the target image, (c) is the effect map of extracting the shoreline, and (d) is the binary map of the extraction results of shoreline.
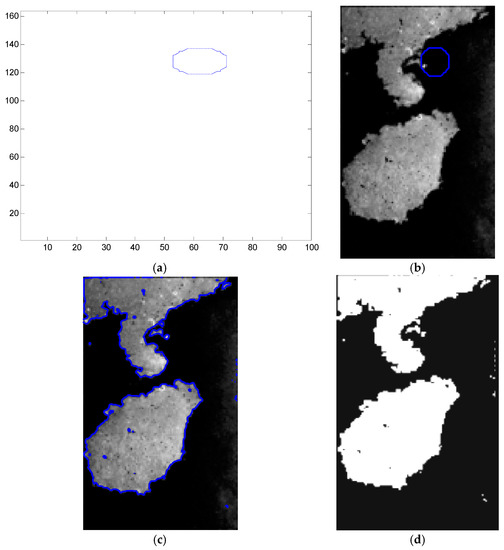
Figure 8.
Small initial contour extraction results: (a) Small initial contour of target image; (b) The position of initial contour in target image; (c) Shoreline extraction result; (d) Binary map of the extraction results of shoreline.
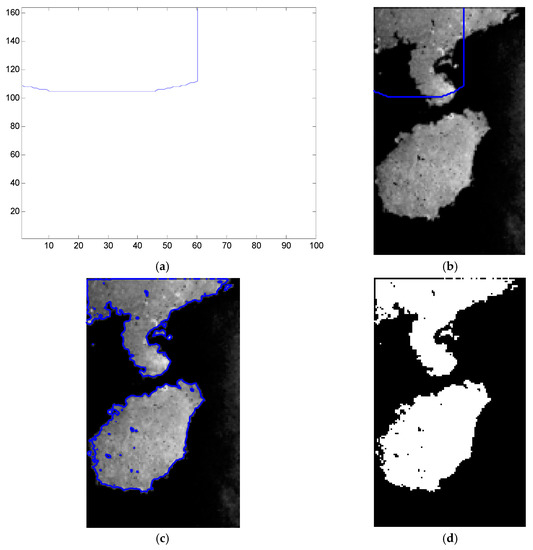
Figure 9.
Large initial contour extraction results: (a) Large initial contour of target image; (b) The position of large initial contour in target image; (c) Shoreline extraction result; (d) Binary map of the extraction results of shoreline.
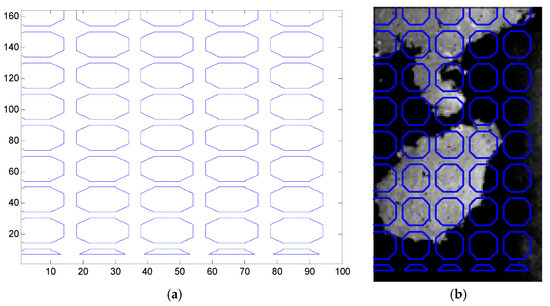
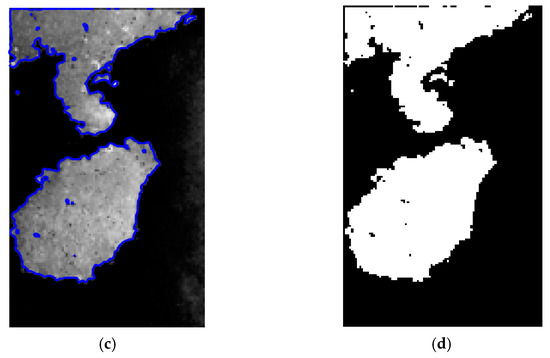
Figure 10.
Extraction results of global image as initial contour: (a) Global initial contour of target image; (b) The position of global initial contour in target image; (c) Shoreline extraction result; (d) Binary map of the extraction results of shoreline.
The details are shown in Table 3. When a small initial contour is selected, the iteration has not been completed when the iteration reaches 6000 times, but the set maximum number of iterations has been reached, so the extraction automatically stops. It is further verified that the size of the initial contour of the SAR image affects the iteration number and operation time of the model: the larger the initial contour, the fewer the iteration number and the shorter the operation time. Moreover, the initial contour combined with the global information of the image has the fewest number of iterations and the shortest operation time.
Table 3.
Comparison of different initial contour extraction results.
In order to further remove the redundant blocks from the shoreline, this paper uses the method of block tracking. The results are shown in Figure 11 and Figure 12, in which Figure 11 is the comparison chart before and after the block-tracking processing, and Figure 12 is the partially enlarged comparison map before and after the block-tracking processing.
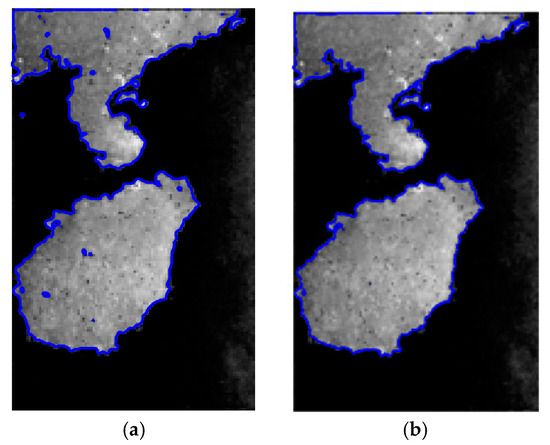
Figure 11.
Comparison of whole block tracking: (a) Before block tracking (b) After block tracking.
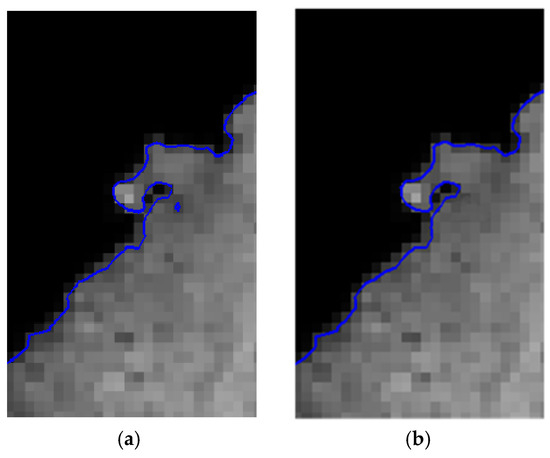
Figure 12.
Comparison of partial block tracking: (a) Before block tracking (b) After block tracking.
In order to further verify the proposed method, one more stripmap, select single-polarimetric, HH collected SAR image is used in the experiment. The administrative division map and the original SAR image are shown in Figure 13. The spatial resolution is 25.3 × 24.7 m; the number of looks is 1. The acquisition mode is standard. The extraction result is shown in Figure 14. The traditional geometric active-contour modeling method has 532 iterations, and the operation time is 49.06 s. The proposed method has 219 iterations, with the operation time of 38.81 s. It shows that the proposed method can reduce the number of iterations and shorten the iteration time.
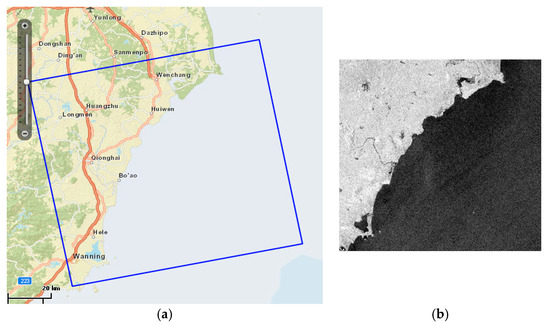
Figure 13.
SAR image: (a) The administrative division map (b) The original SAR image.
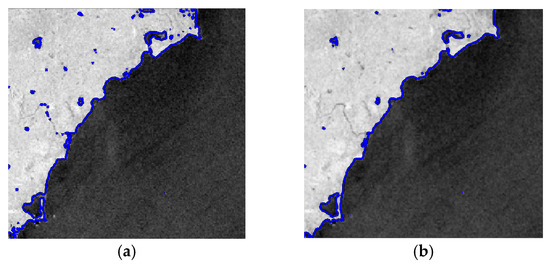
Figure 14.
Shoreline extraction results: (a) Traditional geometric active-contour modeling method; (b) Proposed method.
Figure 15 shows the local enlarged results of shoreline extraction. It can be seen that the shoreline extracted by the proposed method is more continuous and accurate, which proves the proposed method can effectively solve the weak boundary problem.
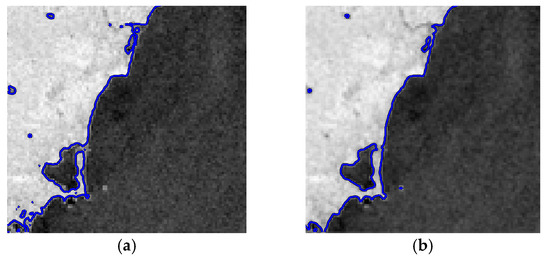
Figure 15.
Local shoreline extraction results: (a) Traditional geometric active contour modeling method; (b) Proposed method.
6. Discussion
In order to extract shoreline from a SAR image effectively, an improved GAC model was proposed. Although the application of the GAC model in SAR-image shoreline extraction was studied in this paper, much content and many technologies related to this subject can be further studied and explored. The later research can be carried out from the following aspects:
- Although this paper solves the problem of shoreline extraction from SAR images, there is no theoretical basis for the setting of model parameters. As future studies, further research could be conducted to automatically set the parameters.
- In this paper, the GAC model was improved by combining the global region smooth information as the convergence condition of curve evolution. In order to further reduce the iteration times and time, it is necessary to determine the initial contour of shoreline accurately and find a way to eliminate the redundant points in the detected shoreline.
- The energy functional design of the model also needs a set of theories as a guide.
7. Conclusions
According to the characteristics of the automatic navigation process of satellite remote-sensing images, an image edge-extraction algorithm based on the geometric active-contour model was proposed to detect the land—sea boundary in a SAR image. First, the SAR image was convoluted and the grid sampling points were generated. Then, several small disks were drawn in the grid sampling points as the initial contour of the shoreline, which realized the coarse positioning of the shoreline-, and provided conditions for the reduction of the iteration times of the subsequent level-set evolution. Then, the improved symbolic pressure function combined with regional information was used as the boundary stop condition of the geometric active-contour model, and the shoreline was extracted accurately. The experimental results showed that this method reduces the number of iterations and the execution time, and increases the accuracy.
Author Contributions
Conceptualization, W.Z.; methodology, S.S.; validation, X.W., writing—original draft preparation, X.W.; writing—review and editing, X.W.; funding acquisition, C.X. All authors have read and agreed to the published version of the manuscript.
Funding
This research was funded by the National Nature Science Foundation of China (NSFC) under Grant 61901195 and supported by Zhenjiang smart ocean information perception and transmission laboratory project GX2017004.
Institutional Review Board Statement
Not applicable.
Informed Consent Statement
Not applicable.
Data Availability Statement
At https://www.mdpi.com/ethics (accessed on 30 January 2021).
Acknowledgments
The authors declare that there is no conflict of interest regarding the publication of this paper. This work was supported by the project of National Natural Science Foundation of China and the Zhenjiang smart ocean information perception and transmission laboratory project. The above funding did not lead to any conflict of interest regarding the publication of this manuscript.
Conflicts of Interest
The authors declare no conflict of interest. The funders had no role in the design of the study; in the collection, analyses, or interpretation of data; in the writing of the manuscript, or in the decision to publish the results.
Abbreviations
The following abbreviations are used in this manuscript:
| SAR | synthetic aperture radar |
| ACM | active contour model |
| GAC | geometric active contour |
| ESF | edge stopping function |
| SPF | signed pressure function |
| LBF | local binary fitting |
| SBGFRLS | selective binary and Gaussian filtering regularized level set |
References
- Buono, A.; Nunziata, F.; Mascolo, L.; Migliaccio, M. A multipolarization analysis of coastline extraction using X-Band COSMO-SkyMed SAR data. IEEE J. Sel. Top. Appl. Earth Obs. Remote Sens. 2014, 7, 2811–2820. [Google Scholar] [CrossRef]
- Al Fugura, A.; Billa, L.; Pradhan, B. Semi-automated procedures for shoreline extraction using single RADARSAT-1 SAR image. Estuar. Coast. Shelf Sci. 2011, 95, 395–400. [Google Scholar] [CrossRef]
- Nunziata, F.; Buono, A.; Migliaccio, M.; Benassai, G. Dual-Polarimetric C- and X-Band SAR Data for Coastline Extraction. IEEE J. Sel. Top. Appl. Earth Obs. Remote Sens. 2016, 9, 4921–4928. [Google Scholar] [CrossRef]
- Ferrentino, E.; Nunziata, F.; Migliaccio, M. Full-polarimetric SAR measurements for coastline extraction and coastal area classification. Int. J. Remote Sens. 2017, 38, 7405–7421. [Google Scholar] [CrossRef]
- Nunziata, F.; Migliaccio, M.; Li, X.; Ding, X. Coastline extraction using dual-polarimetric COSMO-SkyMed PingPong mode SAR data. IEEE Geosci. Remote Sens. Lett. 2014, 11, 104–108. [Google Scholar] [CrossRef]
- Schmitt, M.; Baier, G.; Zhu, X.X. Potential of nonlocally filtered pursuit monostatic TanDEM-X data for coastline detection. ISPRS J. Photogramm. Remote Sens. 2019, 148, 130–141. [Google Scholar] [CrossRef]
- Shen, Q.; Wang, C.Y.; Zhao, B. Automatic waterline extraction in VHR imagery using geometric active contour model. J. Fudan Univ. (Nat. Sci.) 2012, 51, 77–82. [Google Scholar]
- Michael, K.; Andrew, W.; Demetri, T. Snake: Active Contour Models. In Proceedings of the First International Conference on Computer Vision, London, UK, 8–11 June 1987; pp. 259–269. [Google Scholar]
- Lee, J.-S.; Jurkevich, I. Coastline detection and Tracing in SAr images. IEEE Trans. Geosci. Remote. Sens. 1990, 28, 662–668. [Google Scholar] [CrossRef]
- Baselice, F.; Ferraioli, G. Unsupervised coastal line extraction from SAR images. IEEE Geosci. Remote. Sens. Lett. 2013, 10, 1350–1354. [Google Scholar] [CrossRef]
- Chu, C.; Siao, J.S.; Wang, L.C.; Deng, W.S. Estimation of 2D jump location curve and 3D jump location surface in nonpar-ametric regression. Stat. Comput. 2012, 22, 17–31. [Google Scholar] [CrossRef]
- Wang, D.; Liu, X. Coastline Extraction from SAR Images Using Robust Ridge Tracing. Mar. Geod. 2019, 42, 286–315. [Google Scholar] [CrossRef]
- Descombes, X.; Moctezuma, M.; Maître, H.; Rudant, J.-P. Coastline detection by a Markovian segmentation on SAR images. Signal Process. 1996, 55, 123–132. [Google Scholar] [CrossRef]
- She, X.; Qiu, X.; Lei, B. Accurate sea–land segmentation using ratio of average constrained graph cut for polarimetric synthetic aperture radar data. J. Appl. Remote Sens. 2017, 11, 26023. [Google Scholar] [CrossRef][Green Version]
- Margarida, S.; Sandra, H. Separation between water and land in SAR Images using Region-Based level sets. IEEE Geosci. Remote Sens. Lett. 2009, 6, 471–475. [Google Scholar]
- Liu, C.; Yang, J.; Yin, J.J.; An, W. Coastline detection in SAR images using a hierarchical level set segmentation. IEEE J. Sel. Top. Appl. Earth Obs. Remote Sens. 2016, 9, 4908–4920. [Google Scholar] [CrossRef]
- Maciel, L.D.S.; Gomide, F.; Ballini, R. A differential evolution algorithm for yield curve estimation. Math. Comput. Simul. 2016, 129, 10–30. [Google Scholar] [CrossRef]
- Modava, M.; Akbarizadeh, G. Coastline extraction from SAR images using spatial fuzzy clustering and the active contour method. Int. J. Remote Sens. 2017, 38, 355–370. [Google Scholar] [CrossRef]
- Niedermeier, A.; Romaneessen, E.; Lehner, S. Detection of coastlines in SAR images using wavelet methods. IEEE Trans. Geosci. Remote. Sens. 2000, 38, 2270–2281. [Google Scholar] [CrossRef]
- Liu, C.; Xiao, Y.; Yang, J. A Coastline Detection Method in Polarimetric SAR Images Mixing the Region-Based and Edge-Based Active Contour Models. IEEE Trans. Geosci. Remote Sens. 2017, 55, 3735–3747. [Google Scholar] [CrossRef]
- Tirandaz, Z.; Akbarizadeh, G. A two-phase algorithm based on kurtosis Curvelet energy and unsupervised spectral regres-sion for segmentation of SAR images. IEEE J. Sel. Top. Appl. Earth Obs. Remote Sens. 2016, 9, 1244–1264. [Google Scholar] [CrossRef]
- Modava, M.; Akbarizadeh, G.; Soroosh, M. Integration of spectral histogram and level set for coastline detection in SAR im-ages. IEEE Trans. Aerosp. Electron. Syst. 2018, 55, 810–819. [Google Scholar] [CrossRef]
- Kim, D.-J.; Moon, W.M.; Park, S.-E.; Kim, J.-E.; Lee, H.-S. Dependence of Waterline Mapping on Radar Frequency Used for SAR Images in Intertidal Areas. IEEE Geosci. Remote. Sens. Lett. 2007, 4, 269–273. [Google Scholar] [CrossRef]
- An, M.; Sun, Q.; Hu, J.; Tang, Y.; Zhu, Z. Coastline Detection with Gaofen-3 SAR Images Using an Improved FCM Method. Sensors 2018, 18, 1898. [Google Scholar] [CrossRef]
- Demir, N.; Bayram, B.; Şeker, D.Z.; Oy, S.; Erdem, F. A nonparametric fuzzy shoreline extraction approach from Sentinel-1A by integration of RASAT pan-sharpened imagery. Geo-Mar. Lett. 2019, 39, 401–415. [Google Scholar] [CrossRef]
- Fuse, T.; Ohkura, T. Development of Shoreline Extraction Method Based on Spatial Pattern Analysis of Satellite SAR Images. Remote Sens. 2018, 10, 1361. [Google Scholar] [CrossRef]
- Zollini, S.; Alicandro, M.; Cuevas-Gonzalez, M.; Baiocchi, V.; Dominici, D.; Buscema, M. Shoreline Extraction Based on an Active Connection Matrix (ACM) Image Enhancement Strategy. J. Mar. Sci. Eng. 2019, 8, 9. [Google Scholar] [CrossRef]
- Yu, Y.; Acton, S.T. Automated delineation of coastline from polarimetric SAR imagery. Int. J. Remote Sens. 2004, 25, 3423–3438. [Google Scholar] [CrossRef]
- Di Luccio, D.; Benassai, G.; Di Paola, G.; Mucerino, L.; Buono, A.; Rosskopf, C.M.; Nunziata, F.; Migliaccio, M.; Urciuoli, A.; Montella, R. Shoreline Rotation Analysis of Embayed Beaches by Means of In Situ and Remote Surveys. Sustainability 2019, 11, 725. [Google Scholar] [CrossRef]
- Tajima, Y.; Wu, L.; Fuse, T.; Shimozono, T.; Sato, S. Study on shoreline monitoring system based on satellite SAR imagery. Coast. Eng. J. 2019, 61, 401–421. [Google Scholar] [CrossRef]
- Dellepiane, S.; De Laurentiis, R.; Giordano, F. Coastline extraction from SAR images and a method for the evaluation of the coastline precision. Pattern Recognit. Lett. 2004, 25, 1461–1470. [Google Scholar] [CrossRef]
- Caselles, V.; Kimmel, R.; Sapiro, G. Geodesic active contours. Proc. IEEE Int. Conf. Comput. Vis. 2002, 22, 61–79. [Google Scholar] [CrossRef]
- Malladi, R.; Sethian, J.; Vemuri, B. Shape modeling with front propagation: A level set approach. IEEE Trans. Pattern Anal. Mach. Intell. 1995, 17, 158–175. [Google Scholar] [CrossRef]
- Chan, T.F.; Vese, L.A. Active contours without edges. IEEE Trans. Image Process. 2001, 10, 266–277. [Google Scholar] [CrossRef]
- Zhang, K.; Zhang, L.; Song, H.; Zhou, W. Active contours with selective local or global segmentation: A new formulation and level set method. Image Vis. Comput. 2010, 28, 668–676. [Google Scholar] [CrossRef]
- Yang, Y.; Li, C.; Kao, C.-Y.; Osher, S. Split Bregman Method for Minimization of Region-Scalable Fitting Energy for Image Segmentation. Min. Data Financ. Appl. 2010, 2008, 117–128. [Google Scholar] [CrossRef]
- Chan, T.F.; Sandergby, V. Active contours without edges for vector-valued images. J. Vis. Commun. Image Represent. 2000, 11, 130–141. [Google Scholar] [CrossRef]
- Huo, Y.-K.; Wei, G.; Zhang, Y.-D.; Wu, L.-N. An Adaptive Threshold for the Canny Operator of Edge Detection. In Proceedings of the 2010 International Conference on Image Analysis and Signal Processing, Zhejiang, China, 9–11 April 2010; pp. 371–374. [Google Scholar]


Publisher’s Note: MDPI stays neutral with regard to jurisdictional claims in published maps and institutional affiliations. |
© 2021 by the authors. Licensee MDPI, Basel, Switzerland. This article is an open access article distributed under the terms and conditions of the Creative Commons Attribution (CC BY) license (http://creativecommons.org/licenses/by/4.0/).