Article

Mapping Complete Three-Dimensional Ice Velocities by Integrating Multi-Baseline and Multi-Aperture InSAR Measurements: A Case Study of the Grove Mountains Area, East Antarctic

1
School of Geosciences and Info-Physics, Central South University, Changsha 410083, China
2
Key Laboratory of Metallogenic Prediction of Nonferrous Metals and Geological Environment Monitoring, Central South University, Changsha 410083, China
3
College of Resources and Environmental Science, Hunan Normal University, Changsha 410081, China
*
Author to whom correspondence should be addressed.
Remote Sens. 2021, 13(4), 643; https://doi.org/10.3390/rs13040643
Submission received: 14 January 2021 / Revised: 5 February 2021 / Accepted: 8 February 2021 / Published: 10 February 2021

Abstract

:
The Antarctic is one of the most sensitive areas to climate change, and ice velocity is a fundamental parameter for quantitatively assessing the glacier mass balance. Interferometric synthetic aperture radar (InSAR), a powerful tool for monitoring surface deformation with the advantages of having high precision and wide coverage, has been widely used in determining ice velocity in the Antarctic. However, the mapping of complete three-dimensional (3D) ice velocities is greatly limited by the imaging geometries and digital elevation model (DEM)-induced errors. In this study, we propose the integration of multibaseline and multiaperture InSAR measurements from the ENVISAT ASAR datasets to derive complete 3D ice velocities in the Grove Mountains area of the Antarctic. The results show that the estimated complete 3D ice velocities are in good agreement with MEaSUREs and GPS observations. Compared with the conventional 2D and quasi-3D ice velocities, the complete 3D ice velocities can effectively eliminate the effects of DEM errors and elevation changes and are also capable of retrieving the thickness change of the ice, which provides important information on the origin of mass transition.

Graphical Abstract

1. Introduction

Since more than 98% of the area of the Antarctic is covered by heavy ice and snow, it is one of the most sensitive areas to the effects of climate change, and ice velocity is the fundamental parameter for assessing the glacier mass balance. Over the past few decades, the spaceborne interferometric synthetic aperture radar (InSAR) has played an important role in measuring ice velocity due to its wide coverage and high precision. Goldstein et al. [1] first estimated the flow velocity of the Rutford Ice Stream in the Antarctic. The ice flow velocity over the entire Antarctic has been measured by multiple satellite SAR datasets [2,3]. Estimations of mass balance [4,5], grounding line change [6,7], and tide modeling [8] have been achieved with synthetic aperture radar (SAR) data. SAR-related techniques have been widely used in studies about the Antarctic, and their reliability has been proved through comparison with conventional geodetic measurements [9].
It is acknowledged that the ice velocity measured by InSAR is the linear combination of the east, north, and vertical deformation components [10,11,12]. Hence, various methods have been developed to estimate three-dimensional (3D) ice velocities. Gray [13] used more than three independent differential InSAR (DInSAR) observations to derive 3D ice velocities in the Henrietta Nesmith Glacier in the Arctic. However, more than three independent DInSAR measurements with significant differences in imaging geometries can only be obtained in a few areas (e.g., high-latitude areas). Integrating two independent InSAR/SAR measurements along ascending and descending line-of-sight (LOS) or azimuth directions is a common method with which to derive 2D ice velocities in the polar area [3,14,15]. This method relaxes the requirement of the SAR observation number by ignoring vertical deformation [16]. It is obvious that this assumption decreases the precision of 2D ice velocities when the vertical deformation component cannot be neglected. Another option is to estimate the quasi-3D ice velocities using two independent observations under the surface parallel flow (SPF) constraint [17], which has been widely used in mapping ice velocities [2,18,19]. This method assumes that ice movement is driven by gravity and is parallel to the topography. A high-precision digital elevation model (DEM) is required to constrain the equation, which is, however, difficult to achieve for most rough mountain areas in Antarctic.
It can be noted that low-precision DEM is one of the factors that limits the estimation of 3D measurements with InSAR in the Antarctic [20]. SRTM DEM only covers mid- and low-latitude areas [21]. RampDEM is also not ideal for high-precision ice velocity estimation due to its low resolution and accuracy [20]. Without accurate DEM data, DInSAR measurements will contain some portion of topographic residual signals, particularly for interferograms with long baselines (e.g., ASAR or PALSAR). More importantly, DEM errors will be introduced into the coefficient matrix of a model constrained by the SPF assumption, leading to imprecise 3D deformation estimation, especially when two LOS observations from different tracks are used to estimate the quasi-3D deformation based on SPF. The effect can be more serious in north deformation due to the lower sensitivity of LOS observation in the north direction [10]. TanDEM-X 90m DEM or ASTER GDEM could be solutions to remove the topographic phase [22]. However, the different resolutions between InSAR measurements and external DEM can also induce DEM errors. A recently published REMA elevation model could provide the accurate DEM required [23], but its application is greatly limited by the void in mountainous areas. Besides this, the fast-moving ice flow also contributes residual signals in DInSAR observations due to the change in elevation. Therefore, it is necessary to use a method to reduce DEM errors based on observations.
The baseline-combination method is a method that is capable of eliminating the effect of an inaccurate DEM on the estimation of ice velocities [24], and the phase error can be reduced by combining appropriate baselines [20,25]. Multiaperture InSAR (MAI) is a technique that combines forward- and backward-looking InSAR observations to derive accurate azimuth deformation [26]. Compared to the offset tracking method, MAI can estimate more precise azimuth deformation by utilizing phase measurements [27]. Besides this, since the topographic phase is equal in forward- and backward-looking observations, the topographic residuals can be eliminated after combining forward- and backward-looking observations [28]. In this study, we estimated the complete 3D ice velocities that are not prone to DEM impact for the Grove Mountains area by integrating available multibaseline and multiaperture InSAR measurements acquired on ascending and descending orbits. In the integration, a recently proposed method, termed strain model and variance component estimation (SM-VCE) [29,30], was introduced to provide the accurate weights of multisource InSAR measurements.
This paper is organized as follows. In Section 2, we introduce the study area and datasets we used in this paper. We then provide a brief review of the baseline-combination method and the details of integrating the method in Section 3. In Section 4, the 3D ice velocities associated with the Grove Mountains area are estimated and also compared with MEaSUREs [2] and GPS measurements. The reliability and the ice thickening/thinning of the Grove Mountains area are then discussed in Section 5, followed by the conclusion in Section 6.

2. Study Area and Datasets

The East Antarctic ice sheet is the largest continental ice mass on Earth and will cause a rise of ~53 m in the global sea level if it melts [31]. The present study area was located in the Grove Mountains area in Princess Elizabeth Land, East Antarctic (as shown in Figure 1a). The Grove Mountains area has elevations ranging from ~1800 to ~2100 m a.s.l. which decrease from southeast to northwest. The eastern flank of the Lambert–Amery ice shelf graben (the Lambert–Amery System (LAS)) is close to the Grove Mountains area, and the ice from the Antarctic inland flows through the Grove Mountains area to the LAS along the northwest direction. Furthermore, the Grove Mountains area is also a special area in the East Antarctic that involves 64 isolated nunataks (as shown in Figure 1b). These nunataks slow down the ice flow from inland to the LAS and change its motion. Therefore, compared to most inland areas, the topography in the study area is more complex, which induces significant DEM errors in ice velocity measurements. Besides this, due to the existence of the isolated nunataks, the slow ice stream and rugged topography leave meteorites in the Grove Mountains area. Accurate 3D ice velocities could provide important information for searching for meteorites.
In order to obtain more than three independent InSAR measurements to estimate the 3D ice velocities, we exploited the MAI azimuth measurements in addition to the DInSAR LOS measurements. Considering that the azimuth resolution, effective Doppler bandwidth, and pulse repetition frequency of SAR data are key factors for retrieving accurate MAI results [32], the ENVISAT ASAR datasets acquired in July and August 2009 were employed in this study. As shown in Figure 1b, the kernel area of the Grove Mountains area is covered by both ascending and descending tracks of the ENVISAT ASAR datasets. The acquisition time difference between the ascending and descending track is only one day, which can be ignored in the combination processing of heterogeneous datasets. DEM-induced errors can affect 3D ice velocities due to the rough topography in the Grove Mountains area; the baseline-combination method was thus utilized to eliminate the effect. Therefore, the interferograms from other combinations were selected in both the ascending and descending tracks. In order to be consistent with the assumption of constant ice velocities in the baseline-combination method [20], we used four pairs of interferograms with temporal separations of four years and two years in the ascending and descending tracks, respectively (as shown in Table 1). Although the temporal baselines were quite large, the ice velocities were constant for the SAR data obtained in the same season [20].

3. Integration of Multibaseline and Multiaperture InSAR Measurements: SM-VCE Approach

In order to suppress the DEM-induced errors in mapping the complete 3D ice velocities in the Grove Mountains area, the recently proposed SM-VCE (strain model and variance component estimation) approach was employed and developed by integrating the baseline-combination method. In the following, the SM-VCE approach is introduced following a brief description of the mathematical background of the baseline-combination method and multiaperture InSAR measurements.

3.1. Brief Description of the Baseline-Combination Method and Multiaperture InSAR

Atmospheric delay, ramp errors, and topographic residuals are the main errors in the DInSAR observations. In the Antarctic, atmospheric delay can be basically ignored due to the extremely dry conditions. The ramp errors can be removed through polynomial fitting processing. However, due to the inaccurate DEM, topographic residuals are the main factors limiting ice velocity measurements, particularly in rugged mountainous areas. The baseline-combination method was employed to reduce the DEM-introduced errors, and the workflow is shown in Figure 2. The method needs at least four scenes of SAR images, and two interferograms can be derived after co-registration, resampling, and interference processing. In order to obtain the deformation phase, an external DEM was used to remove the topographic phase, and then the deformation phase could be estimated after unwrapping processing. Assuming the theoretical height of the topography as h and the height of the DEM as h , the induced topography errors can be written as ( h     h ) . The initial ice velocity v L O S , i can be written as:
v L O S , i t i = d L O S , i + B , i R i sin θ i h h + ϕ n o i s e , i
where t i and d L O S , i are the time span and deformation along the line-of-sight (LOS) between primary and secondary images of the ith baseline, respectively. B , i , R i , θ i and θ n o i s e , i are the length of the perpendicular baseline, slant range, incidental angle, and decorrelation noise of the ith baseline, respectively. Assuming K i = B , i R I sin ( θ i ) , we combine the ice velocities from the interferograms with different lengths of baseline as follows:
κ 2 v L O S , 1 κ 1 v L O S , 2 = κ 2 d L O S , 1 + κ 2 κ 1 h h κ 1 d L O S , 2 κ 2 κ 1 h h = κ 2 d L O S , 1 κ 1 d L O S , 2
When the velocities from different baselines are equal (i.e., v L O S , 1   v L O S , 2   v L O S ), Equation (2) can also be written as:
κ 2 v L O S , 1 κ 1 v L O S , 2 = κ 2 κ 1 v L O S
Therefore, the accurate ice velocities along the LOS can be expressed as:
ν L O S = κ 2 d L O S , 1 κ 1 d L O S , 2 κ 2 κ 1
It can be noted that the estimated ice velocity is not affected by the DEM-induced errors. The baseline-combination method reduces the effect of DEM errors and is similar to reconstructing interferograms with a “smaller spatial baseline”. Even though the DEM can be changed between two pairs of interferograms, the smaller spatial baseline can decrease the impact of the ice velocity. It should be noted that the interferograms must come from close dates or the same season to ensure that the velocities are almost equal. For more details about the error analysis of the baseline-combination method, readers can refer to [20].
Multiaperture InSAR is a method to estimate azimuth deformation through a precise phase signal [27,33]. This method splits full-aperture SAR data into forward- and backward-looking SAR observations with the spectral diversity (SD) method, and two interferograms from forward- and backward-looking observations can be acquired after the SD process [26,34]. Azimuth deformation can then be derived from the phase difference between forward- and backward-looking interferograms [34,35]. Since the topographic signal between forward- and backward-looking interferograms is equal, it can be eliminated after differential processing. Ionospheric phase, decorrelation noise, and perpendicular baseline bias-induced errors are the main impact factors in the MAI phase. A directional filter can be used to remove the ionospheric phase [36]; the decorrelation noise should be suppressed with a filter before combining forward- and backward-looking interferograms [27]; and an improved method proposed by Hyung-Sup can be used to remove perpendicular baseline bias-induced errors [28]. After removing the main errors, the ice velocity derived from the MAI phase can be written as:
v a z i = d e cos α i 3 π / 2 + d n sin α i 3 π / 2
where d e and d n are the ice velocities along the east and north directions, respectively. α i is the azimuth angle of the satellite.

3.2. SM-VCE Approach

Complete 3D ice velocities can be derived through integrating the baseline-combination DInSAR observations as well as the MAI observations acquired on ascending and descending tracks. We assume the 3D ice velocities X ^ p as X ^ p = d ^ p e d ^ p n d ^ p u T , where d ^ p e , d ^ p n , and d ^ p u are the estimated ice velocities along the east, north, and vertical directions in point p , respectively. The relationship between the 3D ice velocities, the multibaseline, and the multiaperture InSAR observation vector L p = d L O S , p A S , 1 d L O S , p A S , 2 κ 1 A S κ 2 A S d A Z I , p A S d L O S , p D S , 1 d L O S , p D S , 2 κ 1 D S κ 2 D S d A Z I , p D S T can be represented as [10,37]:
L p = B g e o , p X ^ p
where B g e o , p is the transform matrix consisting of geometric parameters, which can be expressed by:
B g e o , p = α p A S , 1 α p A S , 2 κ 1 A S κ 2 A S b p A S , 1 b p A S , 2 κ 1 A S κ 2 A S c p A S , 1 c p A S , 2 κ 1 A S κ 2 A S d p A S , 2 e p A S , 2 0 α p D S , 1 α p D S , 2 κ 1 D S κ 2 D S b p D S , 1 b p D S , 2 κ 1 D S κ 2 D S c p D S , 1 c p D S , 2 κ 1 D S κ 2 D S d p D S , 2 e p D S , 2 0   and a p A S / D S , i = sin θ p A S / D S , i sin α p A S / D S , i 3 π 2 , b p A S / D S , i = s i n θ p A S / D S , i c o s α p A S / D S , i 3 π 2 c p A S / D S , i = cos θ p A S / D S , i , d p A S / D S , i = c o s α p A S / D S , i 3 π 2 e p A S / D S , i = sin α p A S / D S , i 3 π 2
where θ p A S / D S , i and α p A S / D S , i are the incidence angle and heading angle (clockwise from the north) of the ith pair of interferograms in ascending/descending tracks with respect to point p , respectively.
It should be noted that the measurements from the multibaseline and multiaperture InSAR contain different levels of noise, which means that accurate weights should be determined for heterogeneous observations. Previous studies have suggested that variance component estimation (VCE) can be applied for determining the weights of the measurements [37]. However, the performance of VCE depends on the number of statistical samples, which cannot be satisfied by Equation (6). The strain model and variance component estimation method uses the adjacent pixels to increase the number of statistical samples, which can be used for precise variance component estimation [29]. The SM-VCE methods consider that a portion of the Earth’s surface is a homogeneous strain field, and the relationship between the deformations of the target point p and the adjacent point o can be modeled as [29]:
d p = B S M , p d o e d o n d o u ξ 11 ξ 12 ξ 13 ξ 22 ξ 23 ξ 33 ω 1 ω 2 ω 3 T
where the last nine parameters are the strain model parameters and B S M , p is the strain matrix, which can be expressed as:
B S M , p = 1 0 0 d x p d y p d z p 0 0 0 0 d z p d y p 0 1 0 0 d x p 0 d y p d z p 0 d z p 0 d x p 0 0 1 0 0 d x p 0 d y p d z p d y p d x p 0 ,
where d x p , d y p and d z p are the deformation gradient vectors from point o to point p along the east, north, and vertical directions, respectively. It is reasonable to assume that the ice flow satisfies the strain model, since gravity is the dominant drive in the ice flow. Therefore, by combining Equations (6), (8), and (9), a system can be constructed as follows:
L S M , p = B g e o , p B S M , p X ^ S M , p ,
where X ^ S M , p is the parameter that includes the 3D ice velocities and nine strain model parameters and L S M , p is the observation vector of point p and the adjacent points. We assume that there are n points close to p , and L S M , p can be expressed as:
L S M , p = [ d L O S , p A S d A Z I , p A S d L O S , p D S d A Z I , p D S d L O S , p + n A S d A Z I , p + n A S d L O S , p + n D S d A Z I , p + n D S ] T .
Similar to [29,30], we determine the value of n by obtaining a tradeoff between the accuracies of the 3D deformation estimations and the burden of the computation from a series of simulated experiments with a window size ranging from 3 × 3 to 25 × 25. In this study, n = 225 was employed in the experiments.
A standard VCE process can then be applied to estimate the weight parameters by providing the obviously increased statistical samples [37]. It is acknowledged that the coherence values can only reflect high-frequency noise (e.g., decorrelation noise) and that the existence of low-frequency noise (e.g., the residual ionospheric phase and ramp errors) would deteriorate the coherence weighting strategy. Therefore, the coherence value was not employed for weight difference measurements in this study. Besides this, the estimation of coherence value is highly dependent on many factors; hence, it is difficult to estimate the coherence value accurately. We assume the weight parameters derived by the SM-VCE method as P S M , combining the transform matrix and strain model matrix as B   =   B g e o , p B S M , p . The 3D ice velocities can be estimated with the standard weighted least square (WLS) solution:
X ^ S M , p = B T P B 1 B T P L S M . p
In order to validate the presented method, a test with synthetic datasets was carried out (see Section S1 in the Supplementary Material). It can be observed that the precise 3D deformations could be retrieved (as shown in Supplementary Materials Figure S1 and Table S1). The topographic residuals and the decorrelation noises were both well-suppressed.
It should be noted that deformation jumps appear frequently in the ice area, such as the transition region between the ice and rock, for which the SM-VCE method would fail to estimate the reliable 3D deformations due to the incorporation of inhomogeneous points within the neighborhood of the target point. The most straightforward solution is to discard the points on the other side of the jump boundary based on the ice boundary information, which can be derived from a database or manually sketched. This solution is simple, but the ice boundary information is not always available. Recently, a strain model-based adaptive neighborhood determining (SMAD) method has been developed to select homogeneous points in the fault rupture region. The basic idea of the SMAD method is that the deformation measurements within the neighborhood are correlated based on the strain model, and therefore the mutual relationship within the measurements can be used to eliminate the inhomogeneous points, especially in the deformation jump area; the 3D ice velocities were derived with this method. More details about the SMAD method can be found in [38]. Furthermore, the SM used here, incorporating the points in the neighborhood, partly acted as a spatial filter, which can not only decrease the noise but also the measurement resolution. However, the SM is more than a filter, since it considers that both the spatial correlation of the 3D deformations and the ground strain vector (i.e., in Equation (8)) constrain the estimation [39]. Besides this, having more observation equations established based on the SM makes it possible for the VCE algorithm to be used to accurately estimate the weight parameters of different kinds of measurements, hence leading to the higher accuracy of the 3D deformations.

3.3. Sensitivity Analysis

Integrating multibaseline and multiaperture InSAR measurements with the SM-VCE method makes it possible to derive complete 3D ice velocities. The accuracy of the results depends on various factors. Therefore, we discuss the impact factors and provide an approach to assess the applicability before applying this method to measure the 3D ice velocities. Position dilution of precision (PDOP), which is a concept used to evaluate the positioning in Global Navigation Satellite System (GNSS), has been introduced to assess the performance of mapping 3D deformation with InSAR measurements as follows [40]:
P D O P = Q 11 + Q 22 + Q 33 and   B g e o T B g e o 1 = Q 11 Q 12 Q 13 Q 21 Q 22 Q 23 Q 31 Q 32 Q 33
where the transform matrix B g e o can be derived from Equation (7). We calculated the PDOP with different observation configurations from the parameters described in Table 1; the PDOP of combining all the available observations was 2.73, the PDOP of combining one DInSAR (from the ascending track) and two MAI observations (one from the ascending track and the other from the descending track) was 3.17, and that of combining two DInSAR observations (one from the ascending track and the other from the descending track) and one MAI observation (from the ascending track) was 28.29. Although combining all measurements could obtain the best 3D results, we found that the combination of two MAI measurements and a DInSAR measurement could derive better results than that of two DInSAR measurements and an MAI measurement. Therefore, MAI observation has a greater impact on 3D ice velocities than baseline-combination observation due to the larger azimuth angle in the polar area.
The accuracy of the MAI observation is more sensitive to decorrelated noise than the DInSAR measurements, and the theory accuracy of MAI can be expressed by the effective look number and the total coherence Y M A I [32]. By integrating the theory accuracy of the baseline-combination method σ L O S [20], the theory accuracy of the 3D ice velocity can be derived (see Appendix A) and expressed as:
σ D 2 = Γ Σ Γ T
where:
Γ = sin θ i , j d s sin α i , j d s 3 π 2 κ 1 s i n θ i , j d s c o s α i , j d s 3 π 2 κ 1 cos θ i , j d s κ 1 sin θ i , j a s sin α i , j a s 3 π 2 κ 2 s i n θ i , j a s c o s α i , j a s 3 π 2 κ 2 cos θ i , j a s κ 2 cos α i , j a s 3 π 2 sin α i , j a s 3 π 2 0 cos α i , j d s 3 π 2 sin α i , j d s 3 π 2 0
and
Σ = d i a g ( σ L O S 2 ( l 4 π n 1 γ M A I A 2 N L γ M A I A ) 2 ( l 4 π n 1 γ M A I D 2 N L γ M A I D ) 2 )
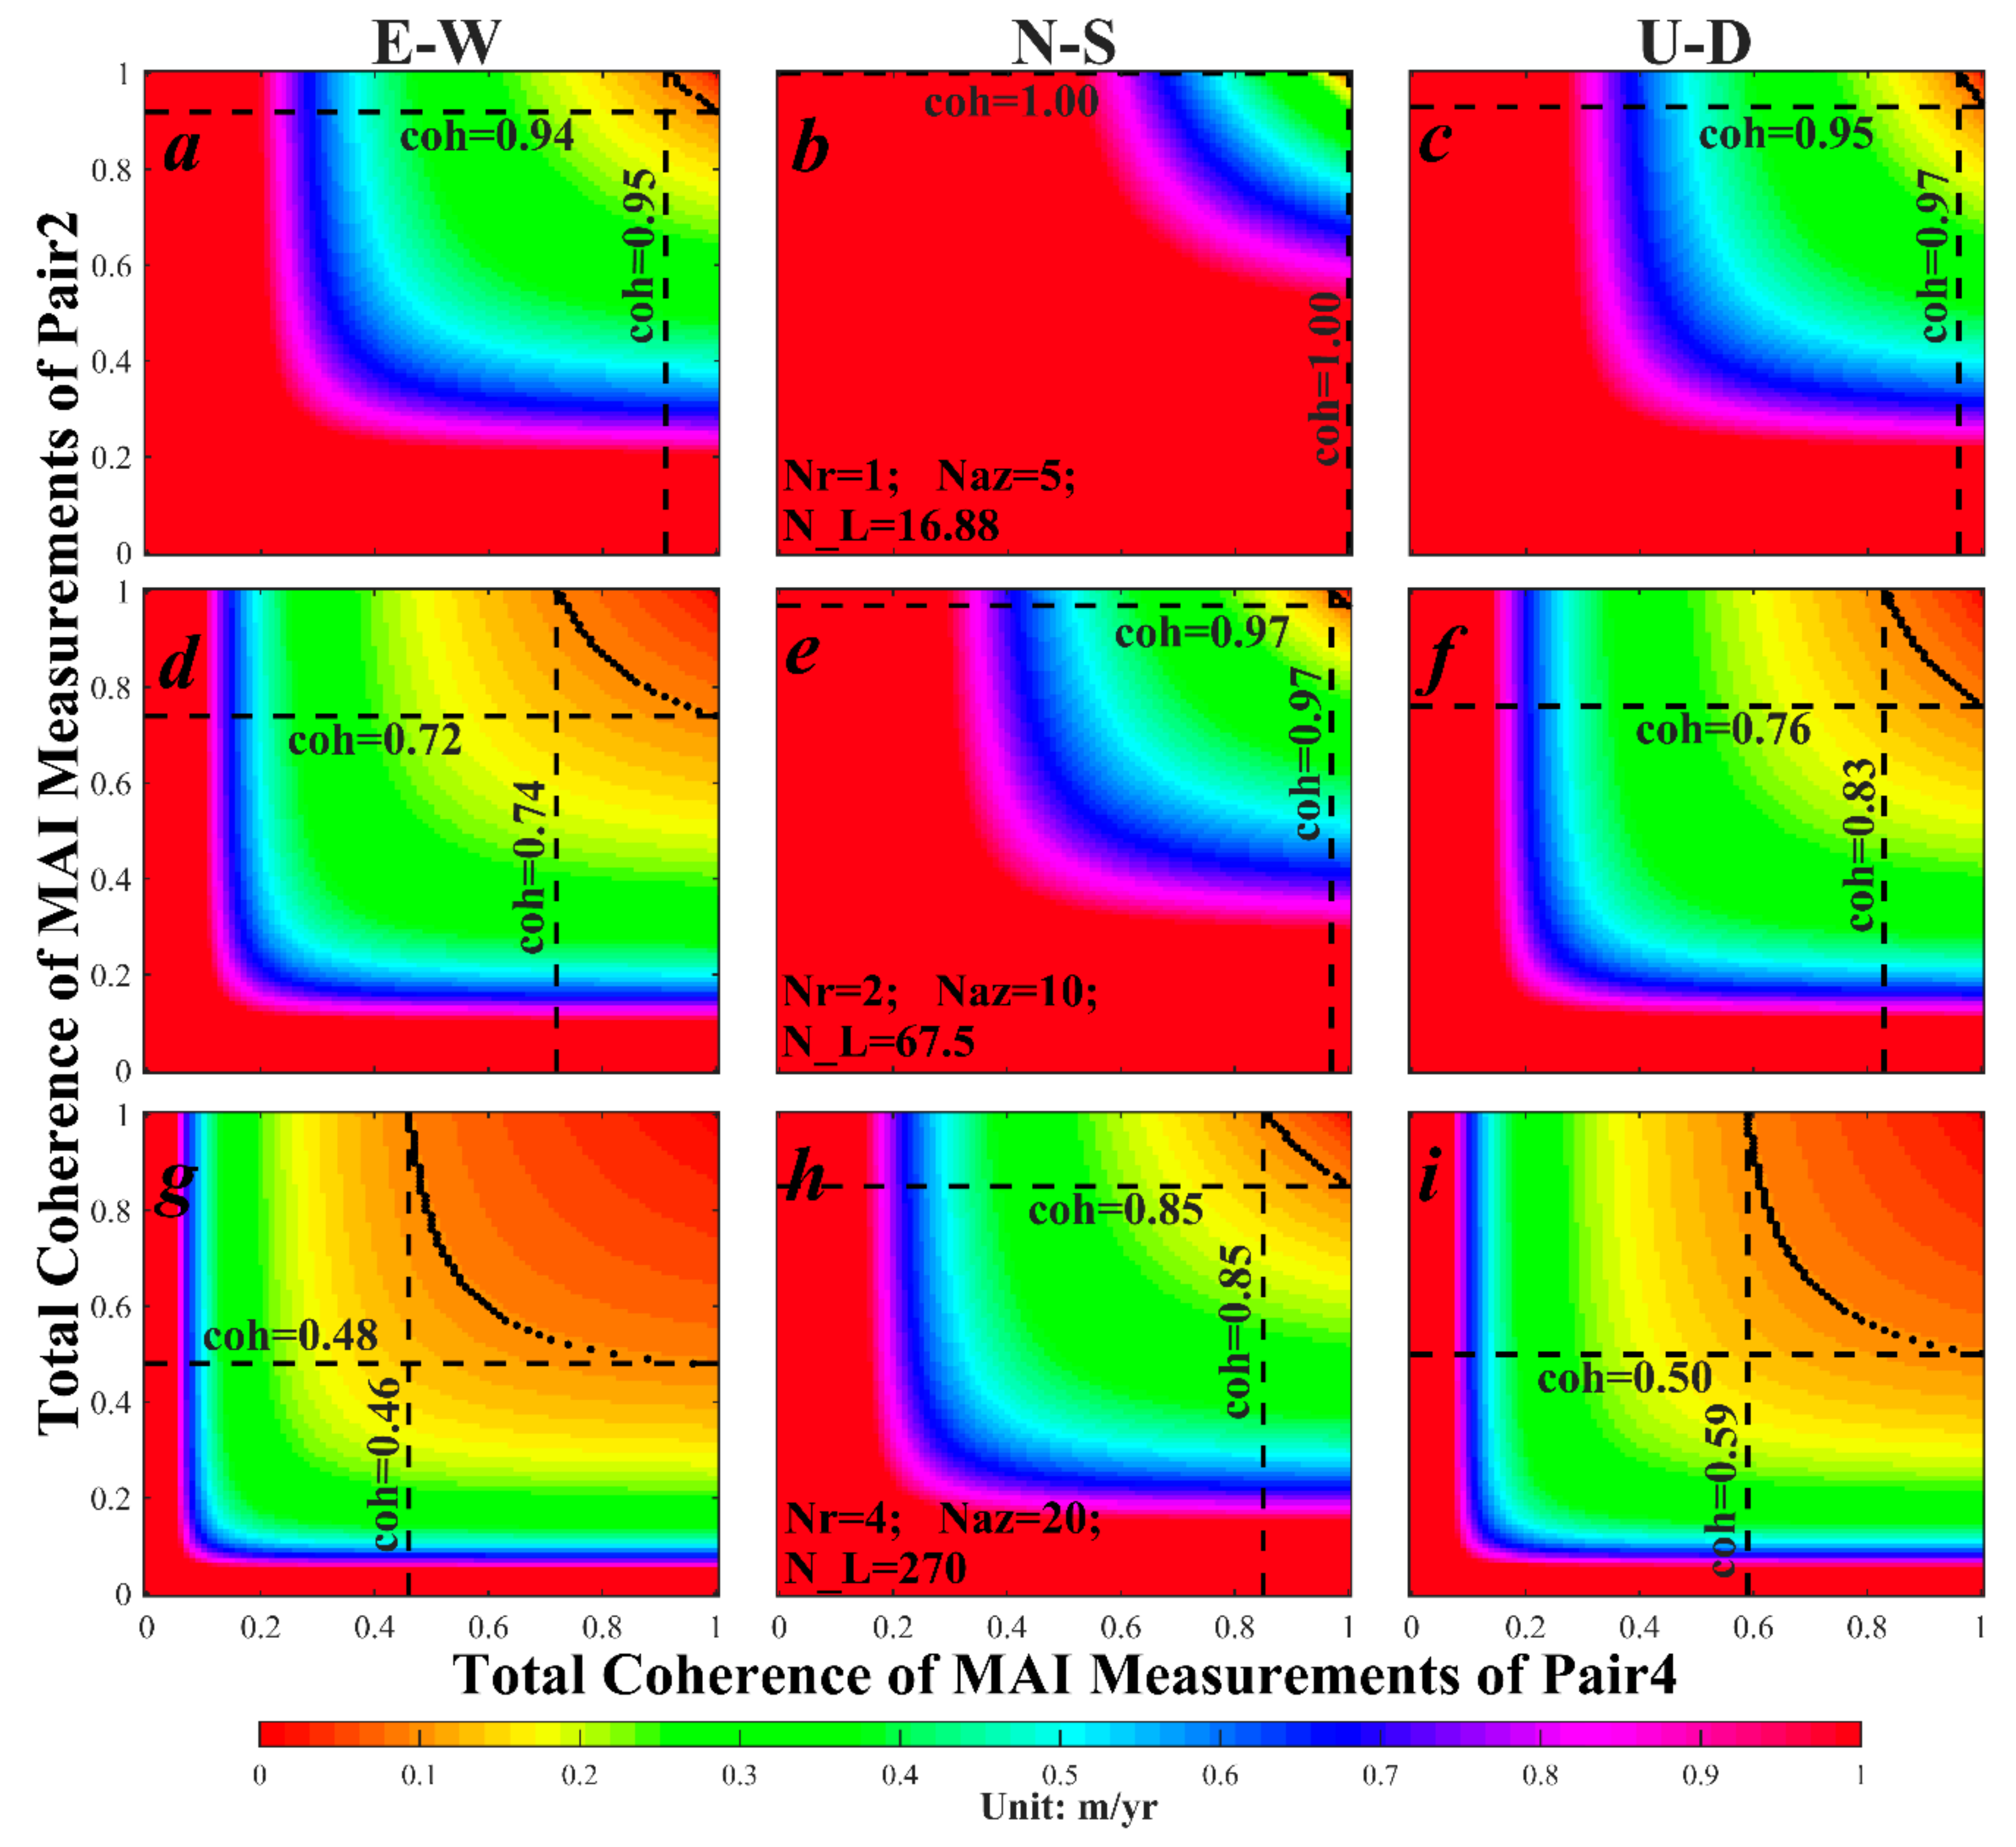
A sensitive analysis of our datasets was then carried out with Equations (14)–(16). We used the system parameters provided in the header files of the ASAR datasets and the length of the baseline provided in Table 1. The root mean squared errors (RMSEs) of 3D deformations with different MAI coherences under the different look numbers were calculated (Figure 3). The coherence value was employed for weighting in this section to theoretically analyze the accuracy of the 3D deformations, which was reasonable since the other factors (e.g., the residual ionospheric phase and ramp errors) could be completely excluded from the coherence.
It can be seen that the theory accuracies along the east and vertical directions were better than those along the north direction. Under the look number of 1 × 5 (i.e., the effective look number was 16.88), it was difficult to obtain the ideal 3D ice velocities (Figure 3a–c). The coherence needs to be more than 0.97 to obtain the deformation with a theory accuracy better than 0.1 m/yr along the east and vertical directions. Moreover, it was almost impossible to derive an ideal accuracy with the effective look number of 16.88 in the north direction (Figure 3b). After raising the look numbers to 2 × 10 (i.e., the effective look number was 67.5), we could measure the deformation with a lower coherence along the east and vertical directions (Figure 3d–f). However, a high coherence was still required for measuring a precise result in the north direction. An obvious improvement could be achieved after raising the look numbers to 4 × 20 (i.e., the effective look number was 270). With a coherence of more than 0.85, a theory accuracy better than 0.1 m/yr could be achieved in the north direction. The threshold coherence was also reduced to ~0.5 to obtain a deformation with a theory accuracy better than 0.1 m/yr along the east and vertical directions. Therefore, the large look numbers were necessary for measuring accurate 3D ice velocities with MAI measurements. Besides this, observations of short temporal baselines are suggested in this method to obtain a high coherence.

4. Complete 3D Ice Velocities in the Grove Mountains Area

The method described in Section 3 was applied in the Grove Mountains area with the multibaseline ENVISAT ASAR datasets. As shown in Table 1, four pairs of interferograms were used to estimate the 3D ice velocities, and the coverage is shown in Figure 1b. The datasets from the same track were firstly used to derive the LOS ice movement with the baseline-combination method (as shown in Figure 4a,b) and were selected from the same season to make the assumption of the baseline-combination method reasonable [20]. Then, split-beam processing was carried out to derive MAI measurements from different track datasets in 2009 (as shown in Figure 4c, d44). Precise orbit determination from the Delft Institute for Earth-Oriented Space Research (DEOS) was applied to correct the orbit phase. A 90-m TanDEM-X DEM dataset was used to remove the primary topographic phase for the unwrapping process, and the minimum cost flow (MCF) method was then used for phase unwrapping. Mountainous regions with ice in between are, in general, hard to unwrap. To minimize the effect of unwrapping errors, the shear margins of the ice stream, low-coherence zone, and small isolated pixels were all masked before phase unwrapping. Due to the stable coherence in the Grove Mountains area, most of the areas were continuous. However, if an area had too many low-coherence pixels, a speckle tracking-based unwrapping method was adopted [41]. In order to calibrate the absolute phase, we selected a small region (5 × 5 pixels) on the west side of Mount Harding (as shown in Figure 1b, the red point) to calculate its average phase as the reference due to its relative stability and high coherence in the nunataks [20,42]. Similarly, we also selected several points in the Grove Mountainous area as the control points to calibrate the ramp errors which had a high coherence and were located in the nunataks. Based on the previous sensitivity analysis, the interferograms were processed with 4 looks in range and 20 looks in azimuth to suppress the decorrelation noise in the DInSAR and MAI measurements [32]. To improve the signal-to-noise ratio, a weighted power spectrum filter was applied [43]. In addition, polynomial fitting and a directional filter were used to eliminate the residual flat earth phase [28] and ionospheric phase [36], respectively. Finally, the multibaseline and multiaperture InSAR measurements were provided for the SM-VCE method to obtain the 3D ice velocities.
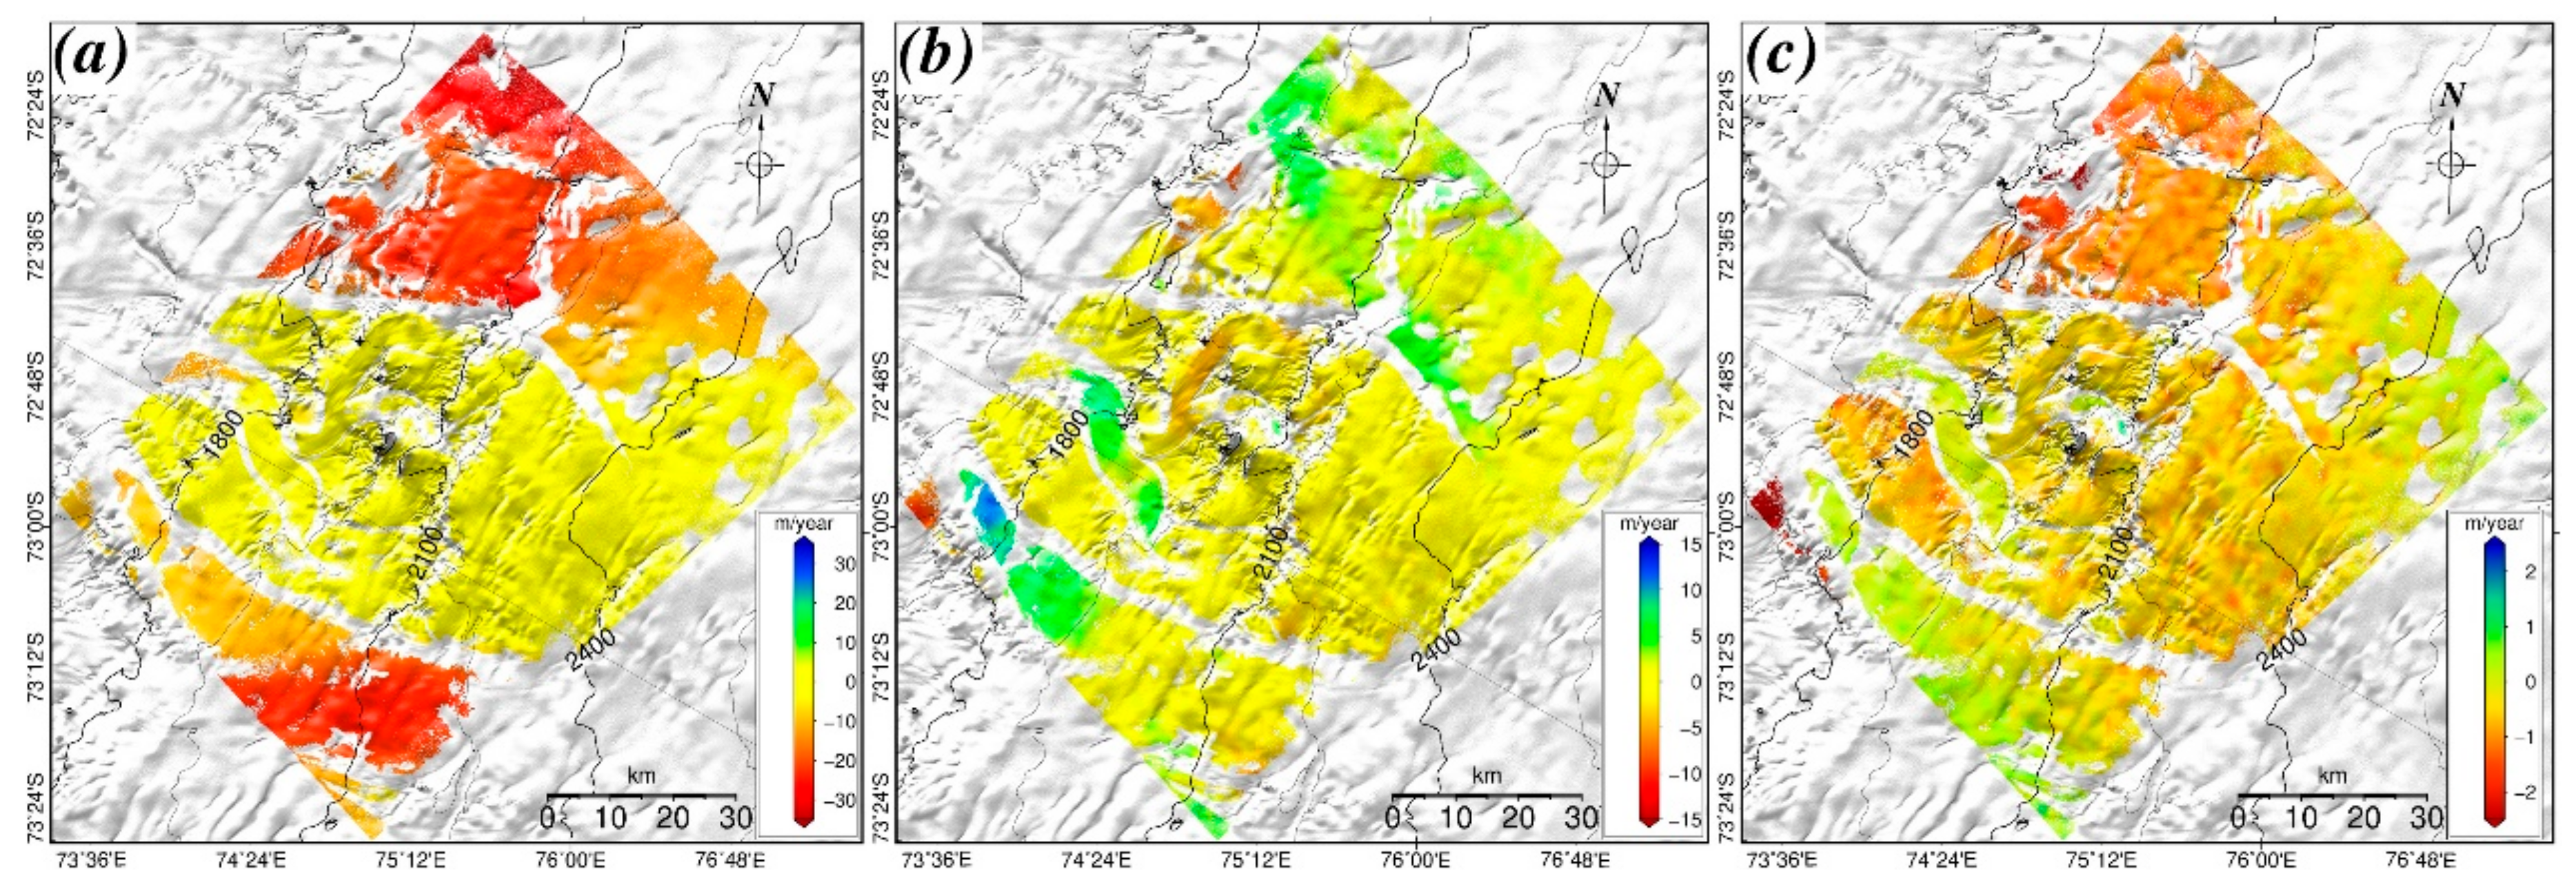
The estimated 3D ice velocities in the Grove Mountains area are shown in Figure 5. In the east direction, most of the ice flow was from east to west. The maximum ice velocity was ~34 m/yr and was mainly located in the northern and southern sides (Figure 5a). The effect of topography on the changing ice flow is obvious, with the ice stream divided into two streams on the southern side. In the rugged mountain area, there was less deformation along the east direction, and only a main ice stream could be found. As for the ice flow along the north direction, this was obviously smaller than that along the east direction, with a maximum velocity of ~15 m/yr (Figure 5b). Most of the ice flowed from south to north, and a clear ice stream could be found in the kernel area, which however could not be found in the DInSAR LOS observations. We could also observe that the ice velocity would be accelerated when the ice stream channel narrowed. However, the deformation along the vertical direction was quite a lot smaller than those along the east and north directions (Figure 5c). Most of the area moved down with a velocity of ~0.6m /yr, and some local areas experienced a slight uplift. Overall, the ice velocities outside the mountain areas were faster than those in the mountain areas, which demonstrates that the Grove Mountains area can slow down the ice velocity from the east Antarctic inland to the LAS. However, it should be noted that the completed 3D ice velocities were monitored in winter (i.e., from July to August), and the annual average results could be slower in the Antarctic.
The complete 3D ice velocities are shown in Figure 6a. The amplitude was derived by combining the ice velocities along the east, north, and vertical directions, and the arrows denote the moving direction. It is clear that most of the ice stream moved from southeast to northwest along with a decrease in altitude. Rugged terrain can also change the ice flow direction. It can be seen that the fastest ice stream is divided into two streams in the northern and southern areas. In the mountain area, three main ice streams can be observed; these ice streams transport the mass from the mountain area to the LAS and then combine as a main stream to leave the Grove Mountains area. The fastest ice velocity amplitude is ~35 m/yr and is located in the south and north sides of the study area. The rugged terrain can slow down the ice streams; most of the ice velocities were less than 10 m/yr in the mountain area, and only the velocity in the intersection of the ice streams was more than 15 m/yr.
The MEaSUREs observation was used to assess our results. MEaSUREs is a dataset that provides annual 2D horizontal ice velocities for the Antarctic ice sheet which are derived from a variety of SAR satellites with stacking multiple speckle tracking or interferometric observations [2]. We collected MEaSUREs observations acquired from July 2009 to June 2010 and calculated the amplitude and vector of ice velocity in the study area (Figure 6b). We found that the results of MEaSUREs were quite similar to our results. However, the fastest velocity from the MEaSUREs data was ~40 m/yr, which is slightly larger than in our results. A further quantified comparison was undertaken by subtracting the estimated results from the MEaSUREs data and generating a difference map (as shown in Section 5.1). Due to the Gale Escarpment, the seasonal ice flow was restricted outside of the kernel of the Grove Mountains area. The obvious differences were in the ice stream out of the Grove Mountains, especially in the northeast, which had a difference velocity of ~9.6 m/yr. The kernel areas in the Grove Mountains had fewer differences and these were no more than 1 m/yr. We calculated the root mean square (RMS) of the area, yielding a mean value of 2.63 m/yr. This is expected, since MEaSUREs data are derived from stacking multiple observations, meaning that the data from the Antarctic summer could be employed. Besides this, MEaSUREs data are calculated using the SPF assumption, so part of the vertical deformation would be counted as a part of the horizontal deformation. This is quantitatively compared in the following discussion section.
To further our quantitative assessment of the results, the GPS observations from the Chinese 22nd Antarctic scientific expedition were collected for comparison with our results [44]. We derived the azimuth and velocity of the ice flow from [44], following which the 2D deformation could be retrieved. The GPS results were observed from 17 to 31 January 2006 and the locations are plotted in Figure 6a. Only three observations could be used for comparison due to the effect of decorrelation. It can be seen in Figure 6 that the estimated velocities were consistent with the GPS observations in the east direction, and the differences between PLE1, PLE2, and PLE3 were 0.10, 0.83, and 0.11 m/yr, respectively. As for motion along the north direction, the differences between PLE1, PLE2, and PLE3 were 2.33, 0.13, and 0.1 m/yr, respectively. The obvious difference in the north result for PLE1 could be ascribed to two reasons. Firstly, the north results came from the MAI observations, which have a lower precision than the DInSAR observations. Secondly, the observation times of the InSAR and GPS measurements were different. Therefore, it can be inferred that the ice velocities determined by GPS in January were faster than those of the estimated results in July, especially along the north direction. However, the vertical ice velocity could not be found in any study. In order to provide an assessment of this, we selected a small region close to Mount Harding (as shown in the bottom left corner of Figure 1b, the small yellow box) with exposed bedrock, where the ice velocity could be safely assumed to be zero. We then calculated the mean values of these pixels, which reached 6.01, 15.43, and 2.61 cm/yr along the eastern, western, and vertical directions, respectively.

5. Discussions

5.1. Superiority of Complete 3D Ice Velocities

As mentioned before, there are various methods that can be used to estimate 3D ice velocities. Different methods have different prerequisites, advantages, and disadvantages. Therefore, we discuss the superiority of complete 3D ice velocities determined with the proposed method by comparing them to those determined with two traditional methods—i.e., 2D ice velocities ignoring vertical deformation and quasi-3D ice velocities based on the SPF assumption.
In order to measure 2D ice velocities, we can combine two independent observations from one or two tracks. In this study, we combined the same observations as used for the complete 3D results to obtain optimal 2D results and controlled the variables for the following comparison. Therefore, we integrated two LOS measurements after the baseline process and two multiaperture InSAR measurements from ascending and descending tracks with the SM-VCE method to derive the east and north ice velocities. It should be noted that the geometric matrix had to be modified to allow for 2D or quasi-3D results. Here, we removed the third column of Equation (7) to derived 2D ice velocities. With respect to the complete 3D ice velocities (Figure 5), the 2D velocities (Figure 7a,b) derived from the two tracks were faster in the north. A quantitative comparison was undertaken by subtracting the 2D results from the complete 3D results (Figure 7f,g). The difference between the 2D and complete 3D results was obvious in the north direction (Figure 7g), with a maximum value of ~5 m/yr. This could be ascribed to neglecting the vertical deformation. It can be seen that the areas with negative vertical ice movement (as shown in Figure 5c) presented faster ice velocities in the north direction (Figure 7g), while slower ice velocities were found in areas with positive vertical ice movement. However, the difference between the 2D and complete 3D results was slight in the east direction.
Deriving quasi-3D ice velocities from the SPF assumption is another commonly used option to measure ice movement in the Antarctic. This method assumes that the ice flow moves parallel to the surface and a relationship between the horizontal and vertical movements can thus be built to reduce the number of measured parameters [17]. To retrieve the quasi-3D ice velocities with the method based on the SPF assumption, we used the same measurements as those used in the retrieval of 2D ice velocities, with slope information derived from the TanDEM-X 90m DEM. We could then remove the third column of Equation (7) and introduce the topographic constraints into the geometric coefficient of eastern and northern components to estimate the quasi-3D ice velocities [17]. As shown in Figure 7c,d, the horizontal ice velocities from the quasi-3D results were quite similar to those from the 2D results and also faster than those from the 3D results (Figure 5a,b). The vertical ice velocity from the quasi-3D results is shown in Figure 7e. It can be seen that the vertical ice velocity from the quasi-3D results was much smaller than that from the 3D results and only a few ice movements occurred around the rugged mountain areas with a velocity of less than 0.5 m/yr. A quantitative comparison was conducted by subtracting the results from the complete 3D results (as shown in Figure 7h–j). The difference between the quasi- and complete 3D results was again obvious in the north with a maximum value of ~4.5 m/yr. It can be seen that the difference was reduced after taking into account the SPF assumption. However, in the complete 3D results the areas with negative vertical ice movement still showed faster ice movement along the northern direction. This is expected, since most of the vertical deformation is underestimated in the quasi-3D ice velocities. The small topographic gradient in the study area resulted in little vertical deformation in the method based on the SPF assumption. Therefore, the obvious difference between the vertical deformations from the quasi-3D and complete 3D results was caused by the ice thickening or thinning. The difference also contributed to the results in the north direction, which overestimate the annual horizontal ice velocities. This implies that accurate ice movements cannot be estimated with the 2D or quasi-3D ice velocities when ice thickening or thinning dominates the vertical deformation.
In order to assess the estimated 2D and quasi-3D results, we conducted a quantitative comparison by subtracting the amplitudes of the ice velocities from the MEaSUREs data (Figure 8a–c). The differences between the estimated amplitudes and MEaSUREs data were almost the same in the 2D, quasi-3D, and complete 3D results. The reason could be that the multiple-dimension measurements were derived from the weighted linear combination of observations. When a vector was overestimated, the other vector would be underestimated. When these measurements were combined into the amplitudes, the results ended up similar, which means that the amplitudes of ice velocities are insensitive to the used methods. We also compared the estimated results with the GPS observations. The results were also quite close in the east, but an obvious difference can be seen in the north. This indicates that the ignored vertical deformation contributed more to the results in the north. However, as we described above, the different times of observation could have caused a bias between the measurements and external data. Therefore, we also selected a small area on the leeside of Mount Harding that has nunataks and could be safely assumed as a stable area without movement [42] (as shown in Figure 1b, the small yellow box). The root mean square value of the ice velocities in this area was calculated as the uncertainty. The uncertainties of the 2D, quasi-3D, and complete 3D results in the east were ±6.8, ±6.5, and ±6.2 cm/yr, respectively, and in the north ±22.8, ±21.5, and ±15.6 cm/yr, respectively, which are in accordance with the previous discussion. The uncertainty of the vertical deformation was ±2.7 cm/yr and that of the ice thickness change could be estimated after removing the component of downslope movement and reached ±2.4 cm/year; this provides a reference for the discussion below. However, these measurements still need to be verified in future studies through other SAR or in situ datasets. For instance, TerraSAR-X, Radarsat-2 or ALOS PALSAR data acquired for the investigated period could be potential options for cross-validation.

5.2. Analysis of Ice Thickness Change

The change in ice thickness provides very important information on the origin of mass transition. Vertical deformation consists of ice thickening/thinning and downslope movement [37]. In order to highlight the ice thickening/thinning, the component of downslope movement was subtracted from the vertical displacement by combining the horizontal movement and the TanDEM-X 90m DEM data. Figure 9a shows the estimated ice thickening (from white to red) and thinning (from white to blue). Since the mountains stop the ice flow from the Antarctic inland, the Grove Mountains area cannot obtain enough mass supplement and thus most of the areas are thinning. It was, however, found that some of the areas showed ice thickening of up to ~1 m/yr. The topography was the main factor that was responsible for this ice thickening. In trunk A1, the ice flowed through the channel from the wide to the narrow areas with the acceleration process and finally accumulated in the narrow channel. In trunk A2, three ice tributaries have become combined and the ice velocities then accelerated. However, the narrow channel blocked the ice flow, yielding ice accumulation here. Two profiles were chosen for detailed comparisons of the topography, vertical deformation, downslope movement, and ice thickening/thinning. Profile B-B’ covers one of the tributaries in the Grove Mountains area; the component of downslope movement is slight due to the flat topography and the ice thinning is quite close to the vertical deformation. The ice goes from thinning to thickening along the profile B-B’ (Figure 9b). As for the profile C-C’, the component of downslope movement is weaker but ice thickening can be found. It is clear that the ice thickening and topography are related—i.e., the ice thickens in convex terrain (Figure 9c).

6. Conclusions

The Antarctic is one of the most sensitive areas to global climate change, and ice velocity is a fundamental parameter to indicate how ice is transported and mass evolves. In this study, we integrated multibaseline and multiaperture InSAR measurements from ascending/descending ENVISAT ASAR datasets to overcome DEM-induced errors and yield the complete 3D ice velocities in the Grove Mountains area of the Antarctic. In order to determine the optimal weights for combining the heterogeneous measurements, the SM-VCE method was employed. The reliability of the results was validated by the MEaSUREs and GPS measurements. By analyzing the sensitivity of the complete 3D results, it was found that the MAI measurements were the most sensitive components and that an increasing look number could obviously improve the accuracies of the 3D ice velocities. The results demonstrate that the complete 3D ice velocities are superior to the 2D and quasi-3D ice velocities. Unlike in other methods, the integration of multibaseline and multiaperture InSAR measurements is affected by changes in ice thickness. Based on the complete 3D ice velocities, the ice thickness and thinning were determined for the Grove Mountains area, which provides significant insight into how ice is transported from the interior to the ocean. This is of great importance to our understanding of how ice evolves in the east Antarctic.
Although we have estimated complete 3D ice velocities in the Grove Mountains area, the time-variation ice movements would further deepen the understanding of ice movement in Grove Mountain area. Therefore, the proposed method should be improved in the future to produce a time series of ice movements. Furthermore, the effect of the residual topographic phase can be minimized in the proposed method by combining the multibaseline and multiaperture InSAR measurements. This is helpful for deriving accurate deformation in other fields with obvious terrain change (e.g., landslides and mining-induced subsidence).

Supplementary Materials

The following are available online at https://www.mdpi.com/2072-4292/13/4/643/s1, Figure S1: Simulated deformation (a–c), the results derived by conventional weighted least squares (WLS) (d–f), and the results derived through the baseline-combination method and SM-VCE method (g–i), along with results for the east (a,d,g), north (b,e,h) and vertical (c,f,i) directions. Table S1: RMSEs of the differences between the simulated and the estimated 3D deformation

Author Contributions

Conceptualization, W.Z. and J.H.; Data curation, J.H. and Q.S.; Formal analysis, W.Z. and J.H.; Funding acquisition, J.H.; Investigation, J.L.; Methodology, W.Z. and J.L.; Project administration, J.H.; Resources, Z.L., J.Z. and L.W.; Software, J.H. and Z.L.; Supervision, J.H. and Q.S.; Validation, W.Z. and J.L.; Writing—original draft, W.Z.; Writing—review and editing, all authors. All authors have read and agreed to the published version of the manuscript.

Funding

This research was funded by the National Key R&D Program of China, grant number 2018YFC1505101; the National Natural Science Foundation of China, grant numbers 42030112, 41674010, and 41704001; the Hunan Natural Science Foundation, grant numbers 2020JJ2043; the Special fund for the construction of innovative provinces in Hunan, grant number 2019GK5006; the Project of Innovation-driven Plan of Central South University, grant number 2019CX007; and the Fundamental Research Funds for the Central Universities of Central South University, grant number 2019zzts298 and 2020zzts647.

Institutional Review Board Statement

Not applicable.

Informed Consent Statement

Not applicable.

Data Availability Statement

The data used to support the findings of this study are available from the corresponding author upon request.

Acknowledgments

The ENVISAT ASAR datasets were provided by ESA through On-The-Fly services and the TanDEM-X 90m DEM data were freely downloaded from DLR. The authors also acknowledge the NSIDC for freely providing the MEaSUREs data for validating the results. The deepest gratitude goes to two anonymous reviewers for their careful work and thoughtful suggestions that have helped improve this paper substantially.

Conflicts of Interest

The authors declare no conflict of interest.

Appendix A

In order to ascertain the theory accuracy of the 3D ice velocities, the theory accuracy of the MAI measurements should be first determined. The azimuth displacement Δ x is defined from the MAI phase ϕ M A I and can be expressed as:
Δ x = ϕ M A I l 4 π n
where l is the length of the antenna and n is the normalized squint that indicates a fraction of the full aperture width. The MAI phase can be affected by the total coherence γ and the effective look numbers N L . Thus the measurements uncertainty of the azimuth displacement is calculated as:
σ Δ x = l 4 π n 1 γ 2 N L γ
The total coherence γ can be estimated by combining the coherences of forward- and backward-looking interferograms and the effective look numbers can be defined by the numbers of azimuth looks N a and range looks N r , the normalized squint n , pulse repetition frequency P R F , effective Doppler bandwidth B D , Doppler centroid difference between the master and slave images Δ f D C , chirp bandwidth B c , resampling frequency f s , and the noise reduction factor by an adoptive filter W f , as given by [32]:
N L = N a N r 1 n B D Δ f D C P R F B c f s W f
The theory accuracy of the MAI measurements can be estimated by combining Equations (A2) and (A3). The theory accuracy of the baseline-combination observations σ L O S can be defined as in [20]. Then, the theory accuracy of the 3D ice velocities σ D 2 = σ d e 2 σ d n 2 σ d u 2 T can be represented as in Equations (9)–(11).

References

  1. Goldstein, R.M.; Engelhardt, H.; Kamb, B.; Frolich, R.M. Satellite radar interferometry for monitoring ice sheet motion: Application to an Antarctic ice stream. Science 1993, 262, 1525–1530. [Google Scholar] [CrossRef] [PubMed]
  2. Rignot, E.; Mouginot, J.; Scheuchl, B. Ice flow of the Antarctic ice sheet. Science 2011, 333, 1427–1430. [Google Scholar] [CrossRef] [PubMed] [Green Version]
  3. Mouginot, J.; Rignot, E.; Scheuchl, B. Continent-wide, interferometric SAR phase, mapping of Antarctic ice velocity. Geophys. Res. Lett. 2019, 46, 9710–9718. [Google Scholar] [CrossRef]
  4. Rignot, E.; Velicogna, I.; Broeke, M.R.V.D.; Monaghan, A.J.; Lenaerts, J.T.M. Acceleration of the contribution of the Greenland and Antarctic ice sheets to sea level rise. Geophys. Res. Lett. 2011, 38. [Google Scholar] [CrossRef] [Green Version]
  5. Sasgen, I.; Martinec, Z.; Bamber, J.L. Combined GRACE and InSAR estimate of West Antarctic ice mass loss. J. Geophys. Res. Space Phys. 2010, 115. [Google Scholar] [CrossRef] [Green Version]
  6. Rignot, E.; Mouginot, J.; Morlighem, M.; Seroussi, H.; Scheuchl, B. Widespread, rapid grounding line retreat of Pine Island, Thwaites, Smith, and Kohler glaciers, West Antarctica, from 1992 to 2011. Geophys. Res. Lett. 2014, 41, 3502–3509. [Google Scholar] [CrossRef] [Green Version]
  7. Li, X.; Rignot, E.; Morlighem, M.; Mouginot, J.; Scheuchl, B. Grounding line retreat of Totten Glacier, East Antarctica, 1996 to 2013. Geophys. Res. Lett. 2015, 42, 8049–8056. [Google Scholar] [CrossRef] [Green Version]
  8. Shum, C.; Yi, Y.; Baek, S.; Anderson, O.; Zhong, L. Ross tide modeling using INSAR and radar altimetry. In AGU Fall Meeting Abstracts; 2020; Available online: https://ui.adsabs.harvard.edu/abs/2002AGUFM.G62A..08S/abstract (accessed on 10 February 2021).
  9. Rignot, E. Radar interferometry detection of hinge-line migration on Rutford ice stream and Carlson Inlet, Antarctica. Ann. Glaciol. 1998, 27, 25–32. [Google Scholar] [CrossRef] [Green Version]
  10. Hu, J.; Li, Z.; Ding, X.; Zhu, J.; Zhang, L.; Sun, Q. Resolving three-dimensional surface displacements from InSAR measurements: A review. Earth-Sci. Rev. 2014, 133, 1–17. [Google Scholar] [CrossRef]
  11. Gudmundsson, S.; Sigmundsson, F.; Carstensen, J.M. Three-dimensional surface motion maps estimated from combined interferometric synthetic aperture radar and GPS data. J. Geophys. Res. Space Phys. 2002, 107, ETG 13-1–ETG 13-14. [Google Scholar] [CrossRef]
  12. Wright, T.J.; Parsons, B.E.; Lu, Z. Toward mapping surface deformation in three dimensions using InSAR. Geophys. Res. Lett. 2004, 31. [Google Scholar] [CrossRef] [Green Version]
  13. Gray, L. Using multiple RADARSAT InSAR pairs to estimate a full three-dimensional solution for glacial ice movement. Geophys. Res. Lett. 2011, 38. [Google Scholar] [CrossRef]
  14. Gourmelen, N.; Kim, S.; Shepherd, A.; Park, J.; Sundal, A.; Björnsson, H.; Pálsson, F. Ice velocity determined using conventional and multiple-aperture InSAR. Earth Planet Sci. Lett. 2011, 307, 156–160. [Google Scholar] [CrossRef] [Green Version]
  15. Tong, X.; Liu, S.; Li, R.; Xie, H.; Liu, S.; Qiao, G.; Feng, T.; Tian, Y.; Ye, Z. Multi-track extraction of two-dimensional surface velocity by the combined use of differential and multiple-aperture InSAR in the Amery ice shelf, East Antarctica. Remote Sens. Environ. 2018, 204, 122–137. [Google Scholar] [CrossRef]
  16. Samsonov, S.; D’Oreye, N. Multidimensional time-series analysis of ground deformation from multiple InSAR data sets applied to Virunga Volcanic Province. Geophys. J. Int. 2012, 191, 1095–1108. [Google Scholar] [CrossRef] [Green Version]
  17. Joughin, I.R.; Kwok, R.; Fahnestock, M.A. Interferometric estimation of three-dimensional ice-flow using ascending and descending passes. IEEE Trans. Geosci. Remote Sens. 1998, 36, 25–37. [Google Scholar] [CrossRef] [Green Version]
  18. Mohr, J.J.; Reeh, N.; Madsen, S.N. Three-dimensional glacial flow and surface elevation measured with radar interferometry. Nature 1998, 391, 273–276. [Google Scholar] [CrossRef]
  19. Samsonov, S. Three-dimensional deformation time series of glacier motion from multiple-aperture DInSAR observation. J. Geod. 2019, 93, 2651–2660. [Google Scholar] [CrossRef] [Green Version]
  20. Zhou, Y.; Zhou, C.; Dongchen, E.; Wang, Z. A Baseline-combination method for precise estimation of ice motion in Antarctica. IEEE Trans. Geosci. Remote Sens. 2013, 52, 5790–5797. [Google Scholar] [CrossRef]
  21. Farr, T.G.; Kobrick, M. Shuttle radar topography mission produces a wealth of data. Eos 2000, 81, 583–585. [Google Scholar] [CrossRef]
  22. Grohmann, C.H. Evaluation of TanDEM-X DEMs on selected Brazilian sites: Comparison with SRTM, ASTER GDEM and ALOS AW3D30. Remote Sens. Environ. 2018, 212, 121–133. [Google Scholar] [CrossRef] [Green Version]
  23. Howat, I.M.; Porter, C.; Smith, B.E.; Noh, M.-J.; Morin, P. The reference elevation model of Antarctica. Cryosphere 2019, 13, 665–674. [Google Scholar] [CrossRef] [Green Version]
  24. Kwok, R.; Fahnestock, M. Ice sheet motion and topography from radar interferometry. IEEE Trans. Geosci. Remote Sens. 1996, 34, 189–200. [Google Scholar] [CrossRef]
  25. Zhou, Y.; Zhou, C.; Deng, F.; Dongchen, E.; Liu, H.; Wen, Y. Improving InSAR elevation models in Antarctica using laser altimetry, accounting for ice motion, orbital errors and atmospheric delays. Remote Sens. Environ. 2015, 162, 112–118. [Google Scholar] [CrossRef]
  26. Bechor, N.B.D.; Zebker, H.A. Measuring two-dimensional movements using a single InSAR pair. Geophys. Res. Lett. 2006, 33. [Google Scholar] [CrossRef] [Green Version]
  27. Jo, M.-J.; Jung, H.-S.; Won, J.-S.; Poland, M.P.; Miklius, A.; Lu, Z. Measurement of slow-moving along-track displacement from an efficient multiple-aperture SAR interferometry (MAI) stacking. J. Geod. 2015, 89, 411–425. [Google Scholar] [CrossRef]
  28. Hyung-Sup, J.; Joong-Sun, W.; Sang-Wan, K. An improvement of the performance of multiple-aperture SAR interferometry (MAI). IEEE Trans. Geosci. Remote Sens. 2009, 47, 2859–2869. [Google Scholar] [CrossRef]
  29. Liu, J.-H.; Hu, J.; Li, Z.; Zhu, J.; Sun, Q.; Gan, J. A Method for measuring 3-D surface deformations with InSAR based on strain model and variance component estimation. IEEE Trans. Geosci. Remote Sens. 2017, 56, 239–250. [Google Scholar] [CrossRef]
  30. Liu, J.; Hu, J.; Xu, W.; Li, Z.; Zhu, J.; Ding, X.; Zhang, L. Complete three-dimensional coseismic deformation field of the 2016 Central Tottori earthquake by integrating left-and right-looking InSAR observations with the improved SM-VCE method. JGR Solid Earth 2019, 124, 12099–12115. [Google Scholar] [CrossRef] [Green Version]
  31. Lythe, M.B.; Vaughan, D.G. BEDMAP: A new ice thickness and subglacial topographic model of Antarctica. J. Geophys. Res. Space Phys. 2001, 106, 11335–11351. [Google Scholar] [CrossRef] [Green Version]
  32. Jung, H.S.; Lee, W.J.; Zhang, L. Theoretical accuracy of along-track displacement measurements from multiple-aperture interferometry (MAI). Sensors 2014, 14, 17703–17724. [Google Scholar] [CrossRef] [PubMed] [Green Version]
  33. Jung, H.-S.; Lu, Z.; Won, J.-S.; Poland, M.P.; Miklius, A. Mapping three-dimensional surface deformation by combining multiple-aperture interferometry and conventional interferometry: Application to the June 2007 eruption of Kilauea Volcano, Hawaii. IEEE Geosci. Remote Sens. Lett. 2011, 8, 34–38. [Google Scholar] [CrossRef]
  34. Mastro, P.; Di Serio, C.; Masiello, G.; Pepe, A. The multiple aperture SAR interferometry (MAI) technique for the detection of large ground displacement dynamics: An overview. Remote Sens. 2020, 12, 1189. [Google Scholar] [CrossRef] [Green Version]
  35. Ouchi, K.; Yoshida, T.; Yang, C.-S. Multi-aperture along-track interferometric sar for estimating velocity vector of ocean currents. In Proceedings of the IGARSS 2018—2018 IEEE International Geoscience and Remote Sensing Symposium, Valencia, Spain, 22–27 July 2018; IEEE: Piscataway, NJ, USA, 2018; pp. 1001–1004. [Google Scholar]
  36. Hu, J.; Li, Z.; Zhang, L.; Ding, X.; Zhu, J.; Sun, Q.; Ding, W. Correcting ionospheric effects and monitoring two-dimensional displacement fields with multiple-aperture InSAR technology with application to the Yushu earthquake. Sci. China Earth Sci. 2012, 55, 1961–1971. [Google Scholar] [CrossRef]
  37. Hu, J.; Li, Z.-W.; Li, J.; Zhang, L.; Ding, X.-L.; Zhu, J.-J.; Sun, Q. 3-D movement mapping of the alpine glacier in Qinghai-Tibetan Plateau by integrating D-InSAR, MAI and Off-set-Tracking: Case study of the Dongkemadi Glacier. Glob. Planet. Chang. 2014, 118, 62–68. [Google Scholar] [CrossRef]
  38. Hu, J.; Liu, J.; Li, Z.; Zhu, J.; Wu, L.; Sun, Q.; Wu, W. Estimating three-dimensional coseismic deformations with the SM-VCE method based on heterogeneous SAR observations: Selection of homogeneous points and analysis of observation combinations. Remote Sens. Environ. 2021, 225, 112298. [Google Scholar]
  39. Gan, J.; Hu, J.; Li, Z.; Yang, C.; Liu, J.; Sun, Q.; Zheng, W. Mapping three-dimensional co-seismic surface deformations associated with the 2015 MW 7.2 Murghab earthquake based on InSAR and characteristics of crustal strain. Sci. China Earth Sci. 2018, 61, 1451–1466. [Google Scholar] [CrossRef]
  40. Hu, C.; Li, Y.; Dong, X.; Wang, R.; Cui, C.; Zhang, B. Three-dimensional deformation retrieval in geosynchronous SAR by multiple-aperture interferometry processing: Theory and performance analysis. IEEE Trans. Geosci. Remote Sens. 2017, 55, 6150–6169. [Google Scholar] [CrossRef]
  41. Liu, H.; Zhao, Z.; Jezek, K.C. Synergistic fusion of interferometric and speckle-tracking methods for deriving surface velocity from interferometric SAR data. IEEE Geosci. Remote Sens. Lett. 2007, 4, 102–106. [Google Scholar] [CrossRef]
  42. Dong, G.; Huang, F.; Yi, C.; Liu, X.; Zhou, W.; Caffee, M.W. Mid-late Pleistocene glacial evolution in the Grove Mountains, East Antarctica, constraints from cosmogenic 10Be surface exposure dating of glacial erratic cobbles. Quat. Sci. Rev. 2016, 145, 71–81. [Google Scholar] [CrossRef]
  43. Goldstein, R.M.; Werner, C.L. Radar interferogram filtering for geophysical applications. Geophys. Res. Lett. 1998, 25, 4035–4038. [Google Scholar] [CrossRef] [Green Version]
  44. Tian, X.; Liao, M.; Zhou, C.; Zhou, Y. Detecting ice motion in Grove Mountains, East Antarctica with ALOS/PALSAR and ENVISAT/ASAR Data. In Proceedings of the Fringe 2011 Workshop, Frascati, Italy, 19–23 September 2011. [Google Scholar]
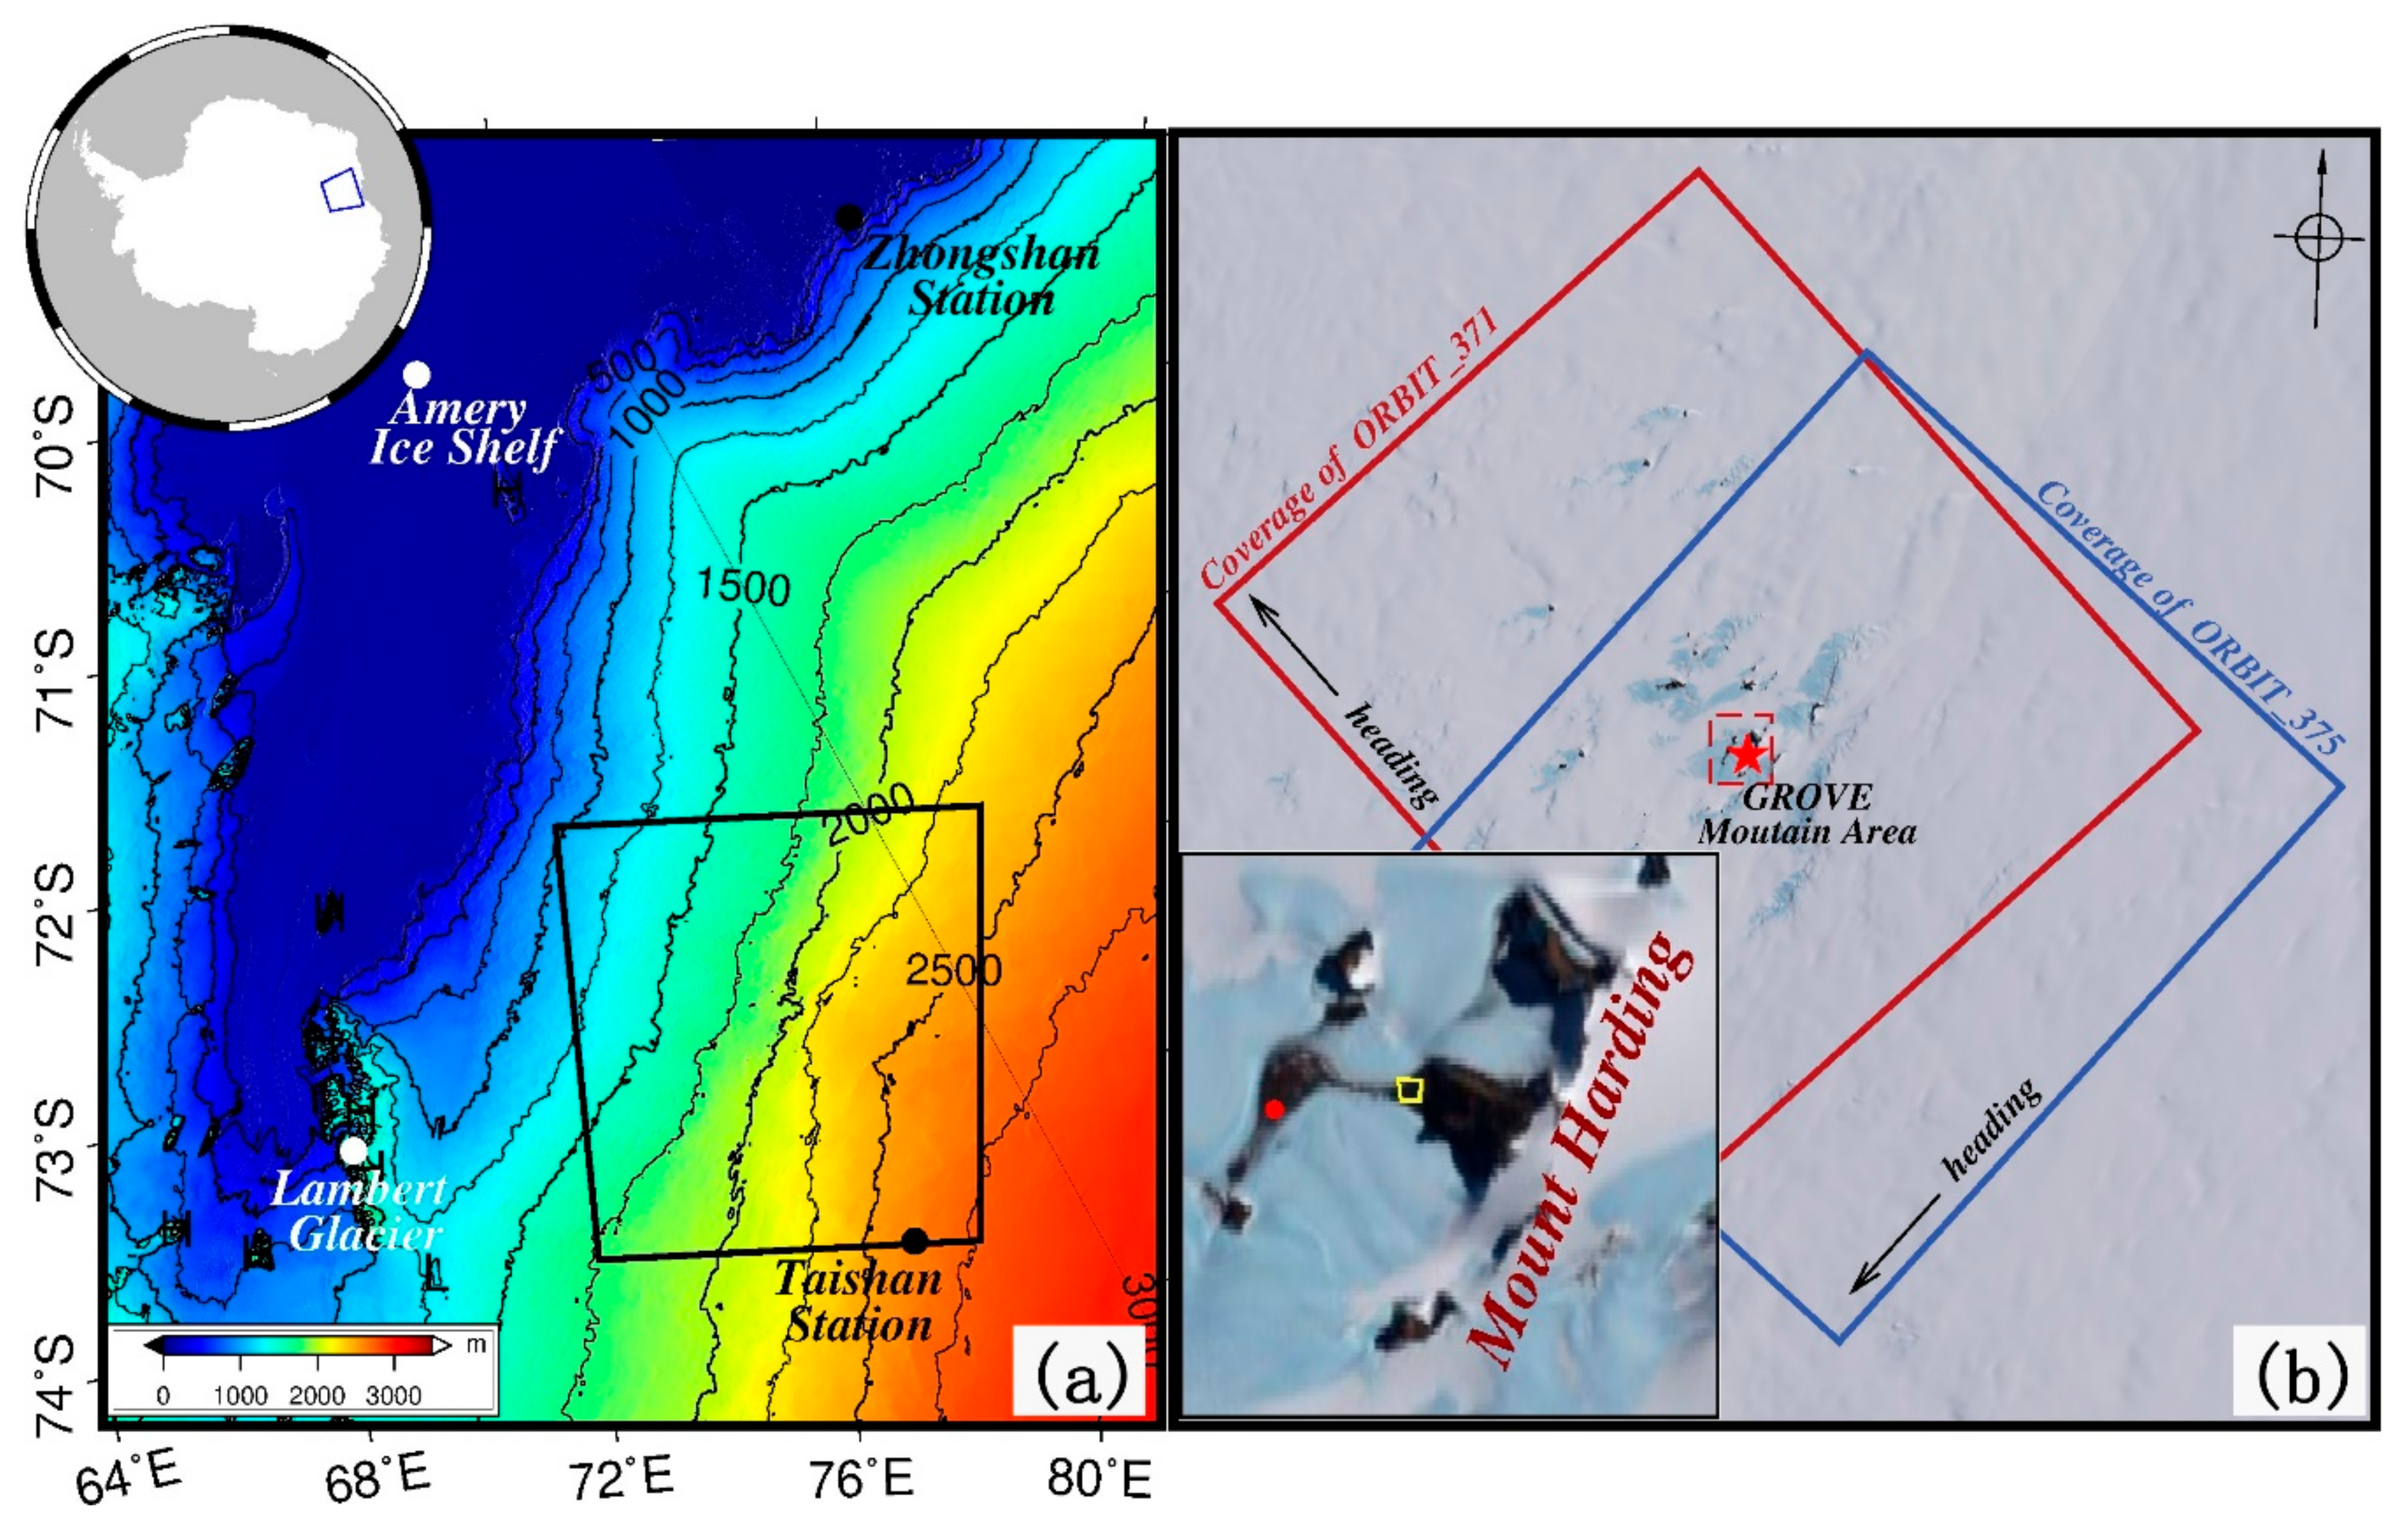
Figure 1. Location of the Grove Mountains area (a) and the coverage of SAR datasets (b). Black box in (a) shows the coverage of (b). Red and blue boxes indicate the coverage of ascending and descending datasets, respectively.
Remotesensing 13 00643 g001
Figure 2. The workflow of the baseline-combination method.
Remotesensing 13 00643 g002
Figure 3. Root mean squared errors (RMSEs) of 3D deformation along the east (a,d,g), north (b,e,h), and vertical (c,f,i) directions with a different total coherence of MAI observations in Pair 2 and Pair 4 under the look numbers of 1 × 5 (range × azimuth, (ac)), 2 × 10 (df) and 4×20 (gi), respectively. N_L denotes the effective look numbers.
Remotesensing 13 00643 g003
Figure 4. Observations for retrieving 3D ice velocities. (a,b) are the DInSAR line-of-sight (LOS) measurements after baseline-combination processing from the ascending and descending tracks, respectively. (c,d) are MAI azimuth measurements from the ascending and descending tracks, respectively.
Remotesensing 13 00643 g004
Figure 5. Complete 3D ice velocities in the Grove Mountains area. The ice movements along the east (a), north (b), and vertical (c) directions are superimposed on the topographic map, respectively.
Remotesensing 13 00643 g005
Figure 6. Estimated ice velocity (a) and MEaSUREs (b) and GPS observations (c). The position of the GPS rod is plotted in the lower left corner of (a). The amplitude of ice velocity is overlapped on the optical image.
Remotesensing 13 00643 g006
Figure 7. 2D ice velocities derived by ignoring vertical deformation in the eastern (a) and northern (b) directions, and quasi-3D ice velocities derived on the basis of the SPF assumption along the eastern (c), northern (d), and vertical (e) directions. (f,g) show the differences between the complete 3D and 2D results in the eastern and northern directions, respectively. (hj) show the differences between the complete 3D and quasi-3D results in the eastern, northern, and vertical directions, respectively.
Remotesensing 13 00643 g007
Figure 8. Differences between the MEaSUREs data and the amplitudes of the complete 3D (a), 2D (b), and quasi-3D (c) results, respectively. Comparisons between the GPS observations and different results in the east (d) and north (e), respectively.
Remotesensing 13 00643 g008
Figure 9. Ice thickening or thinning derived from the 3D ice velocities (a). The vertical (red line), downslope (green line), and thickening (blue line) displacement along the profiles of B-B’ (b) and C-C’ (c) are shown. The coverage is shown as a black rectangle in Figure 6a.
Remotesensing 13 00643 g009
Table 1. Basic information for the ENVISAT ASAR interferometric pairs used herein.
ParametersPair 1Pair 2Pair 3Pair 4
Time span2 July 2005 to 6 August 200511 July 2009 to 15 August 20098 July 2007 to 12 August 200712 July 2009 to 16 August 2009
Orbit no.371 (Ascending)375 (Descending)
Frame no.56615139
Incident angle23.37°23.38°23.46°23.46°
Azimuth angle−71.48°−71.46°−107.97°−107.98°
Imaging modeStrip Map
Publisher’s Note: MDPI stays neutral with regard to jurisdictional claims in published maps and institutional affiliations.