Abstract
Using the local climate zone (LCZ) framework and multiple Earth observation input features, an LCZ classification was developed and established for Riyadh City in 2017. Four land-cover-type and four urban-type LCZs were identified in the city with an overall accuracy of 87%. The bare soil/sand (LCZ-F) class was found to be the largest LCZ class, which was within the nature of arid climate cities. Other land-cover LCZs had a lower coverage percentage (each class with <7%). The compact low-rise (LCZ-3) class was the largest urban type, as urban development in arid climate cities tends to extend horizontally. The daytime surface thermal characteristics of the developed LCZs were analyzed at seasonal timescales using land surface temperature (LST) estimated from multiple Landsat 8 satellite images (June 2017–May 2018). The highest daytime mean LST was found over large low-rise (LCZ-8) class areas throughout the year. This class was the only urban-type LCZ class that demonstrated a positive LST departure from the overall mean LST across seasons. Other urban-type LCZ classes showed lower LSTs and negative deviations from the overall mean LSTs. The overall thermal results suggested the presence of the surface urban heat island sink phenomenon as urban areas experienced lower LSTs than their surroundings. Thermal results demonstrated that the magnitudes of LST differences among LCZs were considerably dependent on the way the region of interest/analysis was defined. This was related to the types of LCZ classes presented in the study area and the spatial distribution and abundance of these LCZ classes. The developed LCZ classification and thermal results have several potential applications in different areas including planning and urban design strategies and urban health-related studies.
1. Introduction
One of the major consequences of rapid urbanization and urban expansion in the 21st century is the modification of urban climate [1] by replacing natural covers and structures (e.g., vegetation and open areas) with urbanized formations [2], e.g., compact and high buildings. Urbanization processes alter local landscapes in which urban/local climate characteristics (e.g., airflow, and energy and water exchanges) are modified [3]. This creates environments within cities that are warmer than their surroundings, which are referred to as urban heat islands (UHIs). UHIs constitute an essential research topic in urban climate studies and have received increasing attention as the UHI effect involves serious environmental concerns, two of which are population growth and climate change [4].
Commonly, a UHI is quantified by the temperature difference between urban and rural areas. One of the challenges in UHI studies is urban–rural representation because of the lack of clear boundaries between urban and non-urban (rural) areas [5]. To overcome this challenge, several urban climate classification schemes have been developed, including urban terrain zones [6]; the Davenport Roughness Classification [7]; urban climate zones, UCZs [8]; and local climate zones, LCZs [4]. One of the main goals of these climate-based classification frameworks is to classify local landscapes (urban and rural) based on their surface properties (e.g., land-cover and urban geometry parameters) in such a way that different local thermal climate characteristics within and around cities can be adequately captured. In addition, these schemes were introduced to allow for standardized definitions and to simplify worldwide communication on different urban studies [2,9]. The LCZ scheme is the most recent, which extends the UCZ scheme, and is considered to be an international standard framework for urban climate classification because of its wide range of applications [2,9,10] and its effectiveness in urban thermal analysis [9].
Although the LCZ scheme was originally designed for UHI studies [4], it has several potential uses in many research and application fields, including weather and climate modeling, climate change, ecology, and urban planning [4,9]. As Zheng et al. [2] stated, the LCZ classification is an effective means for facilitating communication among urban planners, who are not familiar with local climate processes, and climatic researchers, who are not familiar with urban planning practices, for a better understanding of local climate and urban management strategies. The LCZ scheme has been applied in a wide range of urban studies including thermal comfort, energy consumption, human health, urban planning, and carbon emission [11,12]. For example, Verdonck et al. [13] evaluated the LCZ classification as an assessment tool for heat stress in Belgium and showed that the LCZ scheme is valuable when used a heat stress indicator and will help in urban planning for extreme weather events. Kotharkar et al. [14] demonstrated similar findings by using the LCZ scheme to explore population vulnerability to heat stress. Yang et al. [15] demonstrated that cooling and heating loads differed among different LCZs. As Xue et al. [11] explained, the LCZs is an important tool that can be employed in many research areas related to urban climate. This is because the LCZ scheme provides a means for classifying urban areas into different local climate zones, and allowing studies across different applications to document and compare results in a standardized way [11]. LCZ classification has extended the concept of urban–rural temperature differences to the neighborhood level (i.e., zone differences) to provide more details within a city and among cities [12].
LCZ mapping/classification approaches can be grouped into four techniques [1,2,9]: in situ measurements/sampling, satellite-image-based, GIS-based, and integrated approaches. In balancing the advantages and disadvantages of different mapping methods, the satellite-image-based technique is considered a fast and low-cost method for LCZ classification since it is based on readily available data with continuous spatiotemporal coverage at reasonable spatiotemporal resolutions [2,9]. A commonly used satellite-image-based LCZ classification protocol is the World Urban Database and Access Portal Tools (WUDAPT) scheme [16]. WUDAPT is a community-based project to develop, store, and share consistent urban climate datasets around the world. WUDAPT has established a protocol to classify the urban landscape into components using the LCZ classification scheme. This protocol is recognized as a framework for urban climate/weather research, urban planning, and public health worldwide as it provides a consistent, fast, reliable, and low-cost framework (e.g., [1,2,17]). For instance, because the LCZ scheme allows many studies to examine the spatiotemporal thermal patterns of cities using the WUDAPT framework and land surface temperature (LST) (e.g., [1,17,18,19]), the WUDAPT framework enables direct exploration of how these thermal patterns differ among cities as the urban morphology/texture is delineated in a standardized manner. WUDAPT contributes substantially to progress in the urban climate and planning field, as it provides standardized and detailed information on the fabric and structure of cities globally. However, global demands for more inputs to WUDAPT and verification of the framework’s applicability are still growing [1,17]. Nevertheless, WUDAPT involves three time-consuming steps: obtaining data, pre-processing, and accuracy assessment [20]. Recently, Demuzere et al. [20] developed an LCZ Generator tool that addresses these issues as it requires only a training sample and its reference date. The LCZ Generator is a new online platform that implements the WUDAPT framework in a reasonable time frame by using Google Earth’s engine computing environment to perform random forest classification and automated accuracy assessment.
Despite the importance of LCZs and the availability of LCZ maps for cities becoming an important step in facilitating urban studies [11], a climate-relevant database for the local climate in Riyadh City has not been established, as UHI studies in Riyadh City are limited, with only a few studies available (e.g., [21,22,23]). Furthermore, no studies have been conducted for the city’s LSTs at the seasonal scale. Wang et al. [9] noted that studies related to LCZs in arid climate cities are limited, and the LCZ scheme offers greater potential for further understanding UHIs in these cities. Eldesoky et al. [24] showed that the suitability of the LCZ scheme varies from one climate region to another. For LCZ classification to be applied in arid climate cities, they recommended adding subclasses (i.e., combining two zones into one zone) and additional observation input features to the classification process. To contribute to the WUDAPT initiative and the promotion of LCZs for arid climate cities [9], this work aimed to advance our knowledge about Riyadh City’s urban climate by mapping the local climate using the LCZ classification scheme and LCZ Generator for the first time. More specifically, the objectives were to (1) map the city LCZs and (2) evaluate how the LST (using Landsat-8) behaves seasonally (June 2017–May 2018) in different LCZs in order to investigate Riyadh City’s surface UHI (SUHI) phenomenon. We further highlighted the importance of defining the region of interest, which can influence LST differences among LCZ classes and ultimately the intensity of SUHIs.
2. Data and Methods
2.1. Study Area
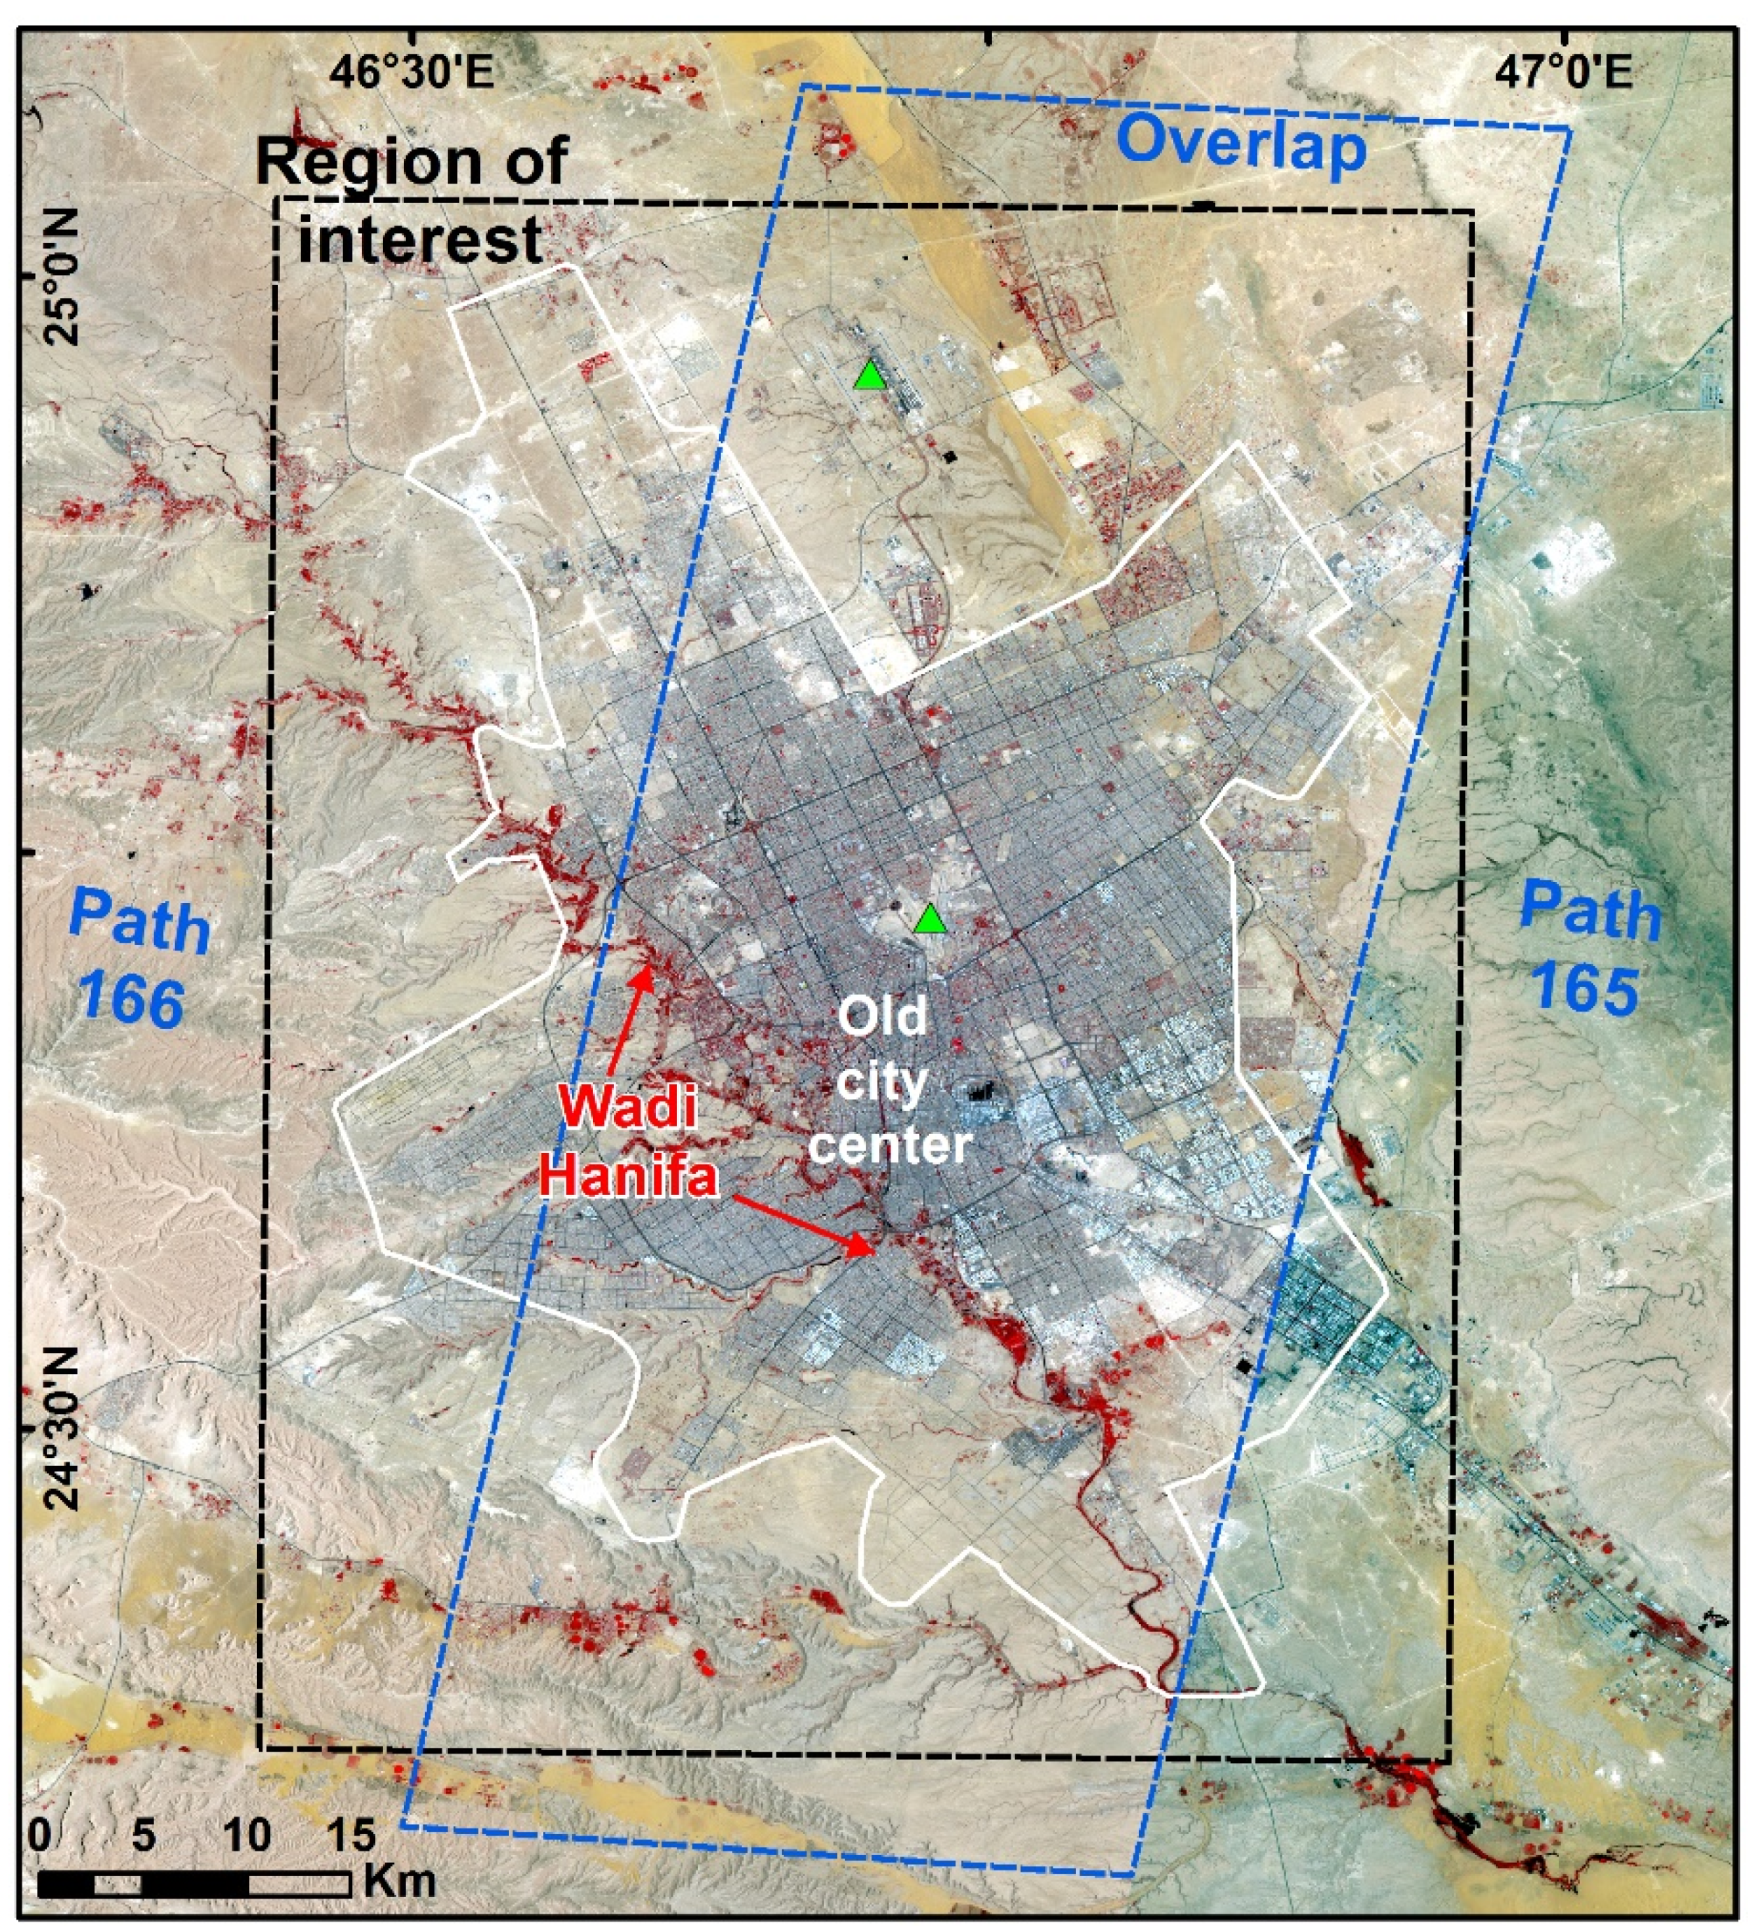
Riyadh City, the capital of Saudi Arabia (Figure 1), is positioned in an arid climate type according to the Koppen climate classification. The average air temperature of the city ranges from 15 °C in winter to 35.5 °C in summer (Table 1). Spring is the wettest season with an average precipitation of 22.4 mm, and summer is the driest season with an average precipitation of <1 mm (Table 1). The city is located at an elevation of approximately 700 m (Figure S1). During the last few decades, the city has experienced significant population growth from 80,000 in 1952 to 6,700,000 in 2015 [21,25]. Several studies have examined changes in land cover/use (LCLU) in Riyadh City (e.g., [26,27,28,29]) and a few have looked at future expansion (e.g., [25,30]). According to these studies, the urban area has substantially increased over the last few decades, with a higher likelihood of significant future expansions. For instance, population growth has led to spatial expansion of the built environment from less than 3.5 km2 before the 1950s [21] to 1500 km2 in 2014, and it is projected to reach 2161 km2 by 2034 [25].
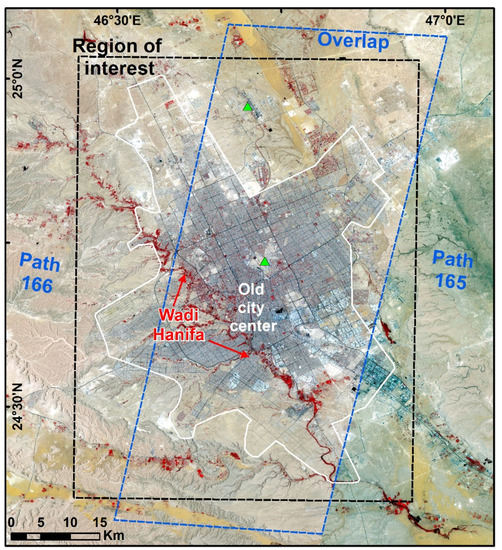
Figure 1.
A map showing the study area along with weather stations (green triangles), urban growth limit phase II (white boundary), region of interest/research (black dashed box), and overlapped area (blue dashed box) covered by Landsat-8 path 166 and 165.

Table 1.
Seasonal averages (1985–2020) of precipitation (Precip), mean temperature (Tmean), maximum temperature (Tmax), and minimum temperature (Tmin). Averages were derived from two weather stations (Figure 1) provided by the Saudi National Center of Meteorology as monthly means.
UHIs in Riyadh City are a weak phenomenon [31] and have the characteristics of UHIs in arid environments [21]. Recently, Sobrino and Irakulis (2020) [32] explored nighttime SUHIs in 71 urban agglomerations (including Riyadh) across different climate types and showed that arid climate cities have the lowest nighttime SUHIs. Studies have attributed this to the high thermal similarity between semi-bare lands and built-up areas in arid environments [33] and higher vegetation cover within urban areas [21]. Chen et al. [34] showed that temperature differences between urban and rural areas are reduced as semi-bare land around urban areas increases.
However, rural areas in Riyadh City have been shown to experience a negative daytime SUHI [21,23]. In arid desert cities, rural areas can display warmer daytime LSTs than urban areas, resulting in a SUHI sink phenomenon [9,21]. A SUHI sink in arid environments is due to the “oasis effect” [9], as urbanization in desert cities increases vegetation cover and water availability, which in turn lead to cooling effects by decreasing sensible heat flux and increasing latent heat flux and shading [21]. Alghamdi and Moore [21] and Aina et al. [23] used the urban growth boundary limit phase II (UG-II) to define the region of interest (Figure 1), yet Aina et al. [27] found that urbanization developments in the city do not precisely follow the UG-II. Accordingly, we defined the region of interest (i.e., research/analysis area) as the outer extent of the UG-II buffered by 3 km (black dashed box in Figure 1).
2.2. LCZ Definition
The LCZ classification includes 17 classes that can be divided into two major types: built-up/urban cover and land cover [4]. Not all LCZs can necessarily be found in a city due to differences in urban planning and strategies (for built cover types) and climate regimes (for land-cover types) (e.g., [1]). Given the climate and landscape of Riyadh City (i.e., arid environment), dense trees (LCZ-A), bush and scrub (LCZ-C), and water (LCZ-G) zones do not exist and were excluded. Some other original LCZ classes, namely compact high-rise (LCZ-1), compact midrise (LCZ-2), lightweight low-rise (LCZ-7), sparsely built (LCZ-9), and heavy industry (LCZ-10), had no or very few matches and were not generally identifiable at the local climate scale used for classification (i.e., 100 m) and thus were not included. The open midrise zone (LCZ-5) coexisted with the open high-rise zone (LCZ-4), and both were merged into one LCZ class (LCZ-54, open midrise with open high-rise). As Stewart and Oke [4] explained, the LCZ system is flexible and can be adjusted to create new subclasses (e.g., LCZ-54) using proposed LCZ properties (e.g., sky view factor, surface cover fractions). However, Stewart and Oke (2012) [4] acknowledged that straight alignment between LCZ properties is not necessary. Recently, Wang et al. (2018b) [1] showed that LCZ property value ranges in desert environments do not align with the LCZ properties proposed in the literature. Alternatively, traffic flow and variability in building heights can be used to distinguish between adjacent/mixed LCZ classes and create a new subclassification [4]. Accordingly, Table 2 summarizes the LCZ classification developed and employed in this work based on the nature of Riyadh City, the authors’ knowledge of the city, and a field survey. The suitability of this classification scheme was re-evaluated twice during the training process and post-classification field survey.
Table 2.
Adapted LCZs along with the description relative to Riyadh City.
2.3. LCZ Classification
The LCZ Generator was used to generate the LCZ classification. One of the main advantages of the LCZ Generator is that the random forest classifier is fed with 33 Earth observation input features, whereas the default WUDAPT uses only Landsat-8 data. Studies have shown that multi-input features improve LCZ classification [20]. For instance, the WUDAPT method tends to misclassify built-type LCZ classes in arid climate cities, even when multitemporal and multispectral remotely sensed data are used [1]. Ren et al. [35] explored the proficiency of the WUDAPT method over 20 Chinese cities and demonstrated that this issue (i.e., misclassification) is largely related to a lack of building height data. Another advantage is that the LCZ Generator provides an automated quality control approach to evaluate training areas and identify suspicious areas that require further attention. More information and references about the LCZ Generator can be found in Demuzere et al. [20].
The LCZ Generator requires two inputs: training areas, and the date of the imagery used to collect the training areas. Google Earth was used for collecting training samples. The choice of training samples is a leading source of errors in classification processes [36]. Thus, a set of quality control strategies was applied during the digitizing of training areas as outlined by WUDAPT and Demuzere et al. [20], including (1) avoiding mixed pixels, feature edges, and sites experiencing changes; (2) between 5 and 15 samples for each LCZ (9–20, in this work); (3) homogeneous spectral and surface characteristics; and (4) a less complex polygon shape. In addition, to reduce subjectivity in distinguishing between low-rise and midrise zones during digitizing training areas, building height data were used and acquired from the Saudi General Authority for Survey and Geospatial Information. The data were available for 2017 at a spatial resolution of 10 m. Accordingly, the training samples and LCZ classification were performed for 2017 using midsummer imagery to maintain a higher sun elevation angle to reduce shading effects.
Once the training areas file was uploaded to the LCZ Generator online platform, a random forest classification was performed using the training samples and 33 input features at 100 m resolution (see [20] for the list of input features). The use of multiple input features was within the recommendation of Eldesoky et al. [24]. The LCZ Generator applied a three-step automated quality control on the training samples to detect samples/polygons with (1) lower area size (below 400 m2) or complex shape, (2) abnormal average spectral value compared to other samples in the corresponding LCZ class, and (3) pixels with abnormal spectral values compared to their LCZ class’s average spectral value. The second and third steps were applied simultaneously on all input features. These quality control steps can be used to modify and adjust the initial training samples to reduce possible errors related to training samples in the classification processes. The initial training samples can be resubmitted to the LCZ Generator after revision and adjustment, and a minimum of three iterations is recommended. In this work, five iterations were used, where all the training samples passed the first two steps of quality control. Concerning the third quality control step, it was difficult in most cases to identify the reasons for the flagged training samples. Demuzere et al. [20] acknowledged this issue as the quality control methods are still experimental. In our case, part of the difficulty was because the third step was applied to all 33 input features, which were not currently available for users.
2.4. Accuracy Assessment and Filtering
An automated accuracy assessment was performed for the generated LCZ classification using the LCZ Generator. The accuracy assessment was based on an automated cross-validation approach using 25 bootstraps (runs). In each bootstrap (run), 70% of the training samples (stratified random sampling) were used to train the classifier and 30% for evaluation. Five accuracy metrics were generated over the 25 bootstraps: overall accuracy (OA), OA for urban LCZ classes only (OAu), OA of the built versus land-cover LCZ classes only (OAbu), weighted accuracy (OAw), and F1-score. The main advantage of the bootstrapping procedure is that the accuracy metrics are generated with confidence intervals. For more details on accuracy metrics and bootstrapping, refer to Demuzere et al. [37] and Demuzere et al. [20].
Although the classification was performed for features with a 100 m resolution, the derived LCZ classification did not necessarily have homogenous structures that reflected the local climate concept [10]. Thus, the initial classification was further filtered to account for heterogeneity and granularity as an LCZ class does not consist of single isolated pixels [10,37]. The LCZ Generator executes morphological Gaussian filtering using a Gaussian kernel with varying standard deviation (σi) values for different LCZs. The σi values are not fixed values and are expert-driven as they differ among LCZs and cities [37]. However, the current version of the LCZ Generator does not allow users to adjust σi values. Thus, a majority filter post-classification of 3 × 3 pixels (i.e., 300 m) was used to reduce granularity and increase homogeneous structures as implemented by WUDAPT and several studies (e.g., [17,19,38]).
2.5. Evaluating Thermal Characteristics of LCZs Using LSTs
To examine the seasonal variations of thermal characteristics of LCZs, 40 multi-seasonal and cloud-free Landsat-8 images (Table 3) were obtained from the United States Geological Survey (USGS). The data were collected as level-2 surface reflectance (i.e., atmospherically, and geometrically corrected), and thus, LSTs were readily available in a surface temperature band. USGS produces this band using a single band approach with several atmospheric parameters (e.g., atmospheric transmission, and upwelled/downwelled radiance), thermal radiance band, and emissivity band. For more specific details and equations, one can refer to Malakar et al. (2018) [39] and USGS (2021) [40]. The Landsat-8 sensor passes over Riyadh at around 10 am (local time) in two adjacent paths (166 and 165) with a seven-day difference (Figure 1). This was considered to be an advantage as the overlapped area (Figure 1) could be sampled twice. To increase data representation and to account for temporal variation in LSTs within seasons, multi-season LSTs were obtained for each season (Table 3). This approach of multi-sampling was implemented to minimize any possible abnormality in LSTs within seasons and to reduce potential bias related to the inclusion of Landsat-8 thermal bands in the LCZ Generator. Since the winter season extends over two years, LSTs from winter 2017–2018 (Table 3) were selected as more images were available compared to winter 2016–2017. Data for spring were from 2018 due to the very limited number of cloud-free images over the city in 2017 (only 4 out of 12 available images in USGS). Thus, the study period for LST analysis was from June 2017 to May 2018 using 40 Landsat-8 images.
Table 3.
Landsat-8 image information used for LST mapping. Cloud cover percentages are in parentheses.
To assess the differences in LSTs among LCZs, the departure of each LCZ class’s mean LST from the mean LST of the region of interest (ROI) and the UG-II was computed. To quantify the differences in LSTs among LCZs, pairwise comparisons were applied using a two-sample Kolmogorov–Smirnov (K–S) test [41]. The K–S test is a nonparametric test and was applied to assess significant differences among different LCZs in terms of the cumulative distribution of LSTs. Although the magnitude/intensity of a UHI (SUHI) is simply defined as the air temperature (LST) difference between urban and rural, determining it is not a straightforward task. The current literature does not have a standard and clear method by which urban and rural areas are defined [32]. This issue is related to the lack of clear physical and climatic boundaries between urban and rural areas [5]. Additionally, LCZs can be found in urban and rural areas with different spatial coverages and distributions.
Consequently, this study relied and focused on the overall patterns of LSTs, not on the absolute magnitude of the SUHI. To investigate the nature of the SUHI, longitudinal and latitudinal profiles of mean and standard deviation (STD) of LSTs were computed. By analyzing the spatial patterns of both profiles, the overall spatial patterns of LSTs could be summarized across the city and SUHI could be reorganized. To minimize possible bias related to the size and spatial configuration of LCZs, all analyses were performed for both the ROI and the UG-II.
3. Results and Discussion
3.1. LCZ Classification
Figure 2 shows the obtained LCZ classification, and Figure 3 presents the distribution of the accuracy matrices over the 25 bootstraps. The average OA, OAu, OAbu, and OAw of the LCZ classification were 87, 87, 98, and 95%, respectively. While the average F1-score for urban-type LCZs ranged from 59% for LCZ-54 (open midrise with open high-rise) to 90% for LCZ-8 (large low-rise), the average land-cover-type F1-score ranged from ~70% for LCZ-E (bare rock/paved) to 95% for LCZ-F (bare soil/sand). LCZ-54 showed the lowest average F1-score, and studies have shown that both LCZ 4 and 5 classes are challenging to map [37]. LCZ-54 recorded a lower average F1-score (a harmonic average of the user’s and producer’s accuracy, [37]) as the corresponding average user’s accuracy (53%) was lower than the average producer’s accuracy (94%). LCZ-54 was often confused with LCZ-3 (compact low-rise). The confusion among urban-type LCZs, particularly when the main distinctions among them were geometric characteristics (e.g., building heights, spacing, and sky view factor), is a typical issue in LCZ classification due to resampling input data at 100 m resolution and the limitation of high-quality geometric data [9,37]. Nevertheless, the OAu indicated a fair overall accuracy (87%) for the urban-type LCZ classes, and all the average overall accuracy indices exceeded the suggested minimum accuracy of 50% [20]. Moreover, the obtained mean OA (87%) was within the commonly recognized target accuracy of 85% [9,42].

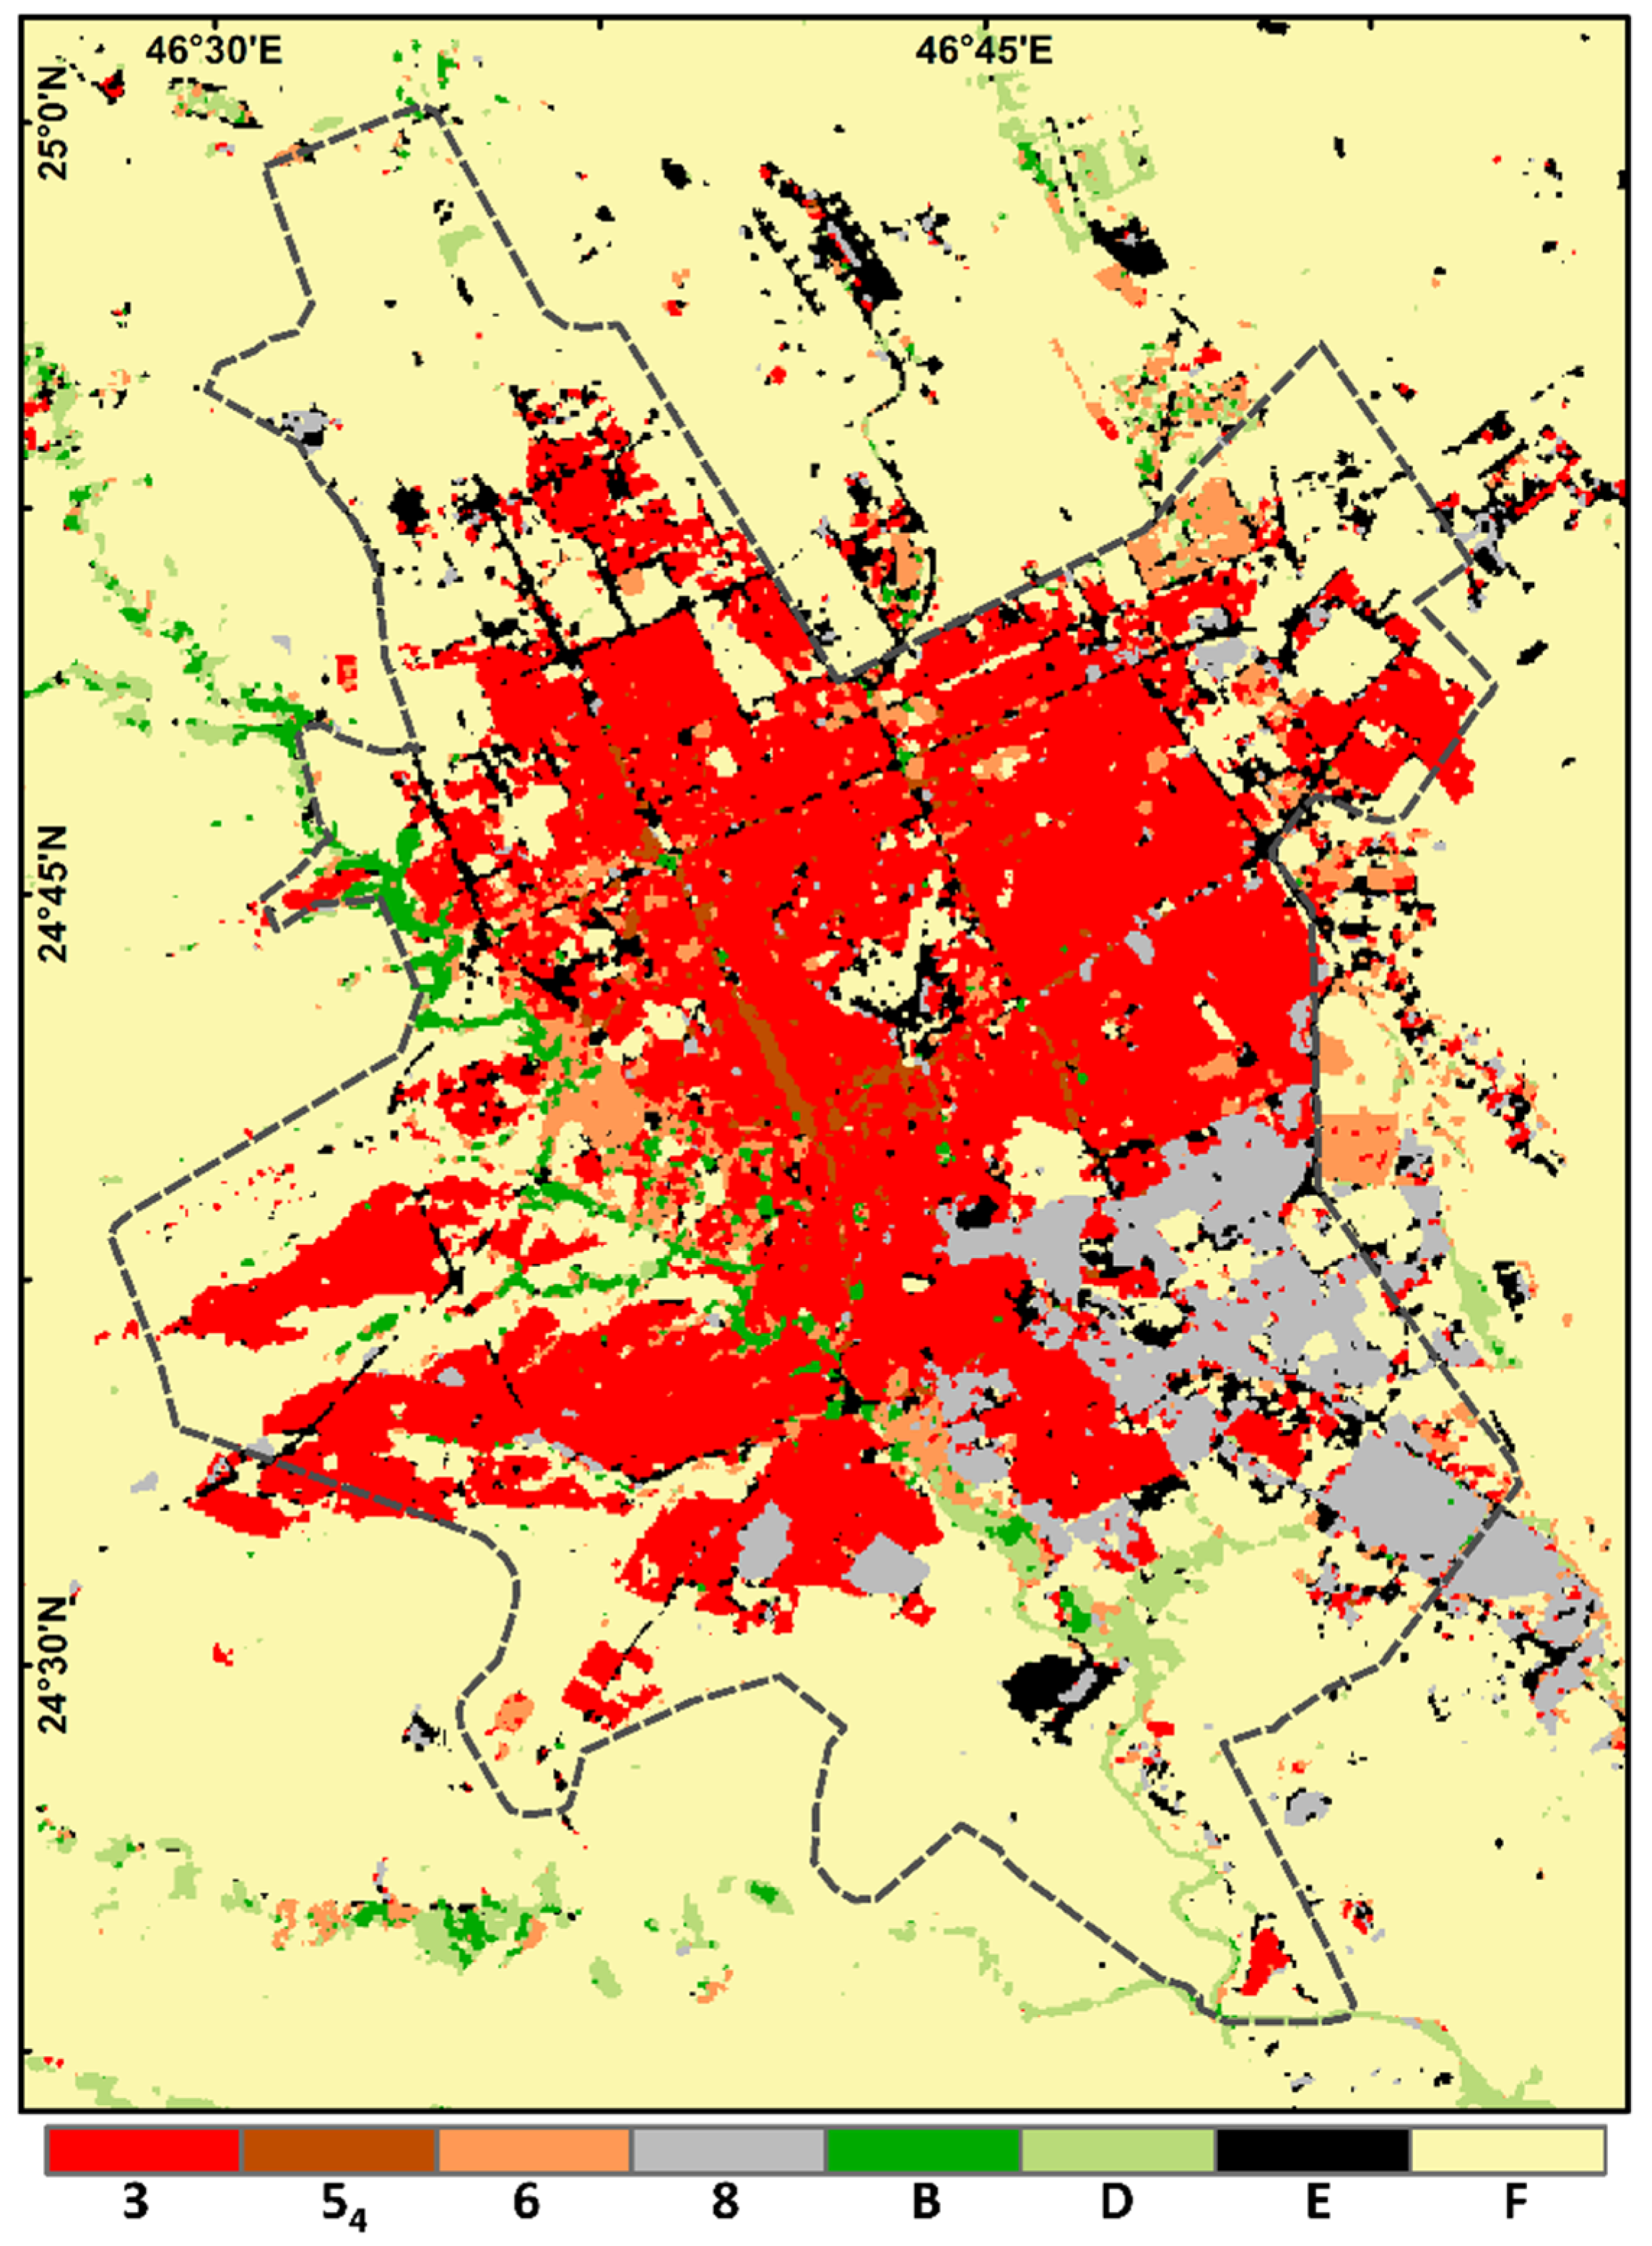
Figure 2.
Developed local climate zones (LCZs) of Riyadh for 2017.
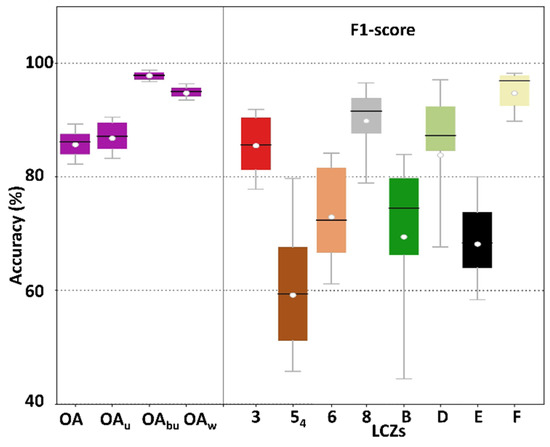
Figure 3.
Distribution of the accuracy matrices over the 25 bootstraps for the developed LCZs. The plot was generated by the LCZ Generator, and the layout was modified for visualization.
Over the region of interest (ROI) and urban growth limit phase II (UG-II), bare soil/sand (LCZ-F) was the largest LCZ class, covering 68 and 41% of the total areas, respectively (Table 4). The second-largest LCZ class was compact low-rise zone (LCZ-3), and it was the most dominant urban type within both the ROI and UG-II, covering 685 (18%) and 657 km2 (37%), respectively. LCZ-54 (open midrise with open high-rise) was confined to the UG-II (99.6%) and only constituted 1% (17 km2) of the UG-II area. Most of this class was found within the old city center and along the main commercial roads (Figure 1 and Figure 2). The main building types within this class were offices and tall residential apartment buildings. These results are consistent with the findings of Wang et al. (2018a) [9], who found that bare soil/sand and open low-rise zones were the predominant LCZs in Phoenix and Las Vegas, USA, as cities in desert environments tended to develop more horizontally because of abundant land for development. LCZ-6 (open low-rise) covered 114 km2, 67% (~77 km2) of which was within the UG-II. The zone spread mostly in the eastern and western outskirts of the city. LCZ-8 (large low-rise) covered 156 km2, 80% (~125 km2) of which was within the UG-II. This zone was occupied mostly by light industrial activities and was largely limited to the southeastern outskirts in compliance with city regulations.
Table 4.
Area (km2) statistic of LCZs in Riyadh for 2017.
LCZ-E (bare rock/paved) accounted for 4% (6%) of the ROI (UG-II) area, consisted predominantly of asphalt, and was mainly found alongside transportation features (e.g., highways, airports, parking lots). Accordingly, LCZ-E could not be regarded as a natural cover in Riyadh City. LCZs B and D had the lowest area coverages of 46 (30 km2) and 79 (26 km2) km2, respectively, within the ROI (UG-II). Both classes are human-made (desert city), and LCZ-B was found over large parks and farming fields with trees (commonly ornamental trees and palms), whereas agricultural lands and grassy parks constituted the LCZ-D class. Within the UG-II, both zones were spatially distributed along Wadi Hanifa (Hanifa valley, Figure 1), where agricultural sites are clustered. LCZ-D had a lower frequency across the built-up areas as low plant cover within the city was restricted to small neighborhoods parks, which are difficult to detect and classify at 100 m resolution. Thus, agricultural activities are suggested as the major contributor to those land-cover classes.
3.2. LST and LCZs
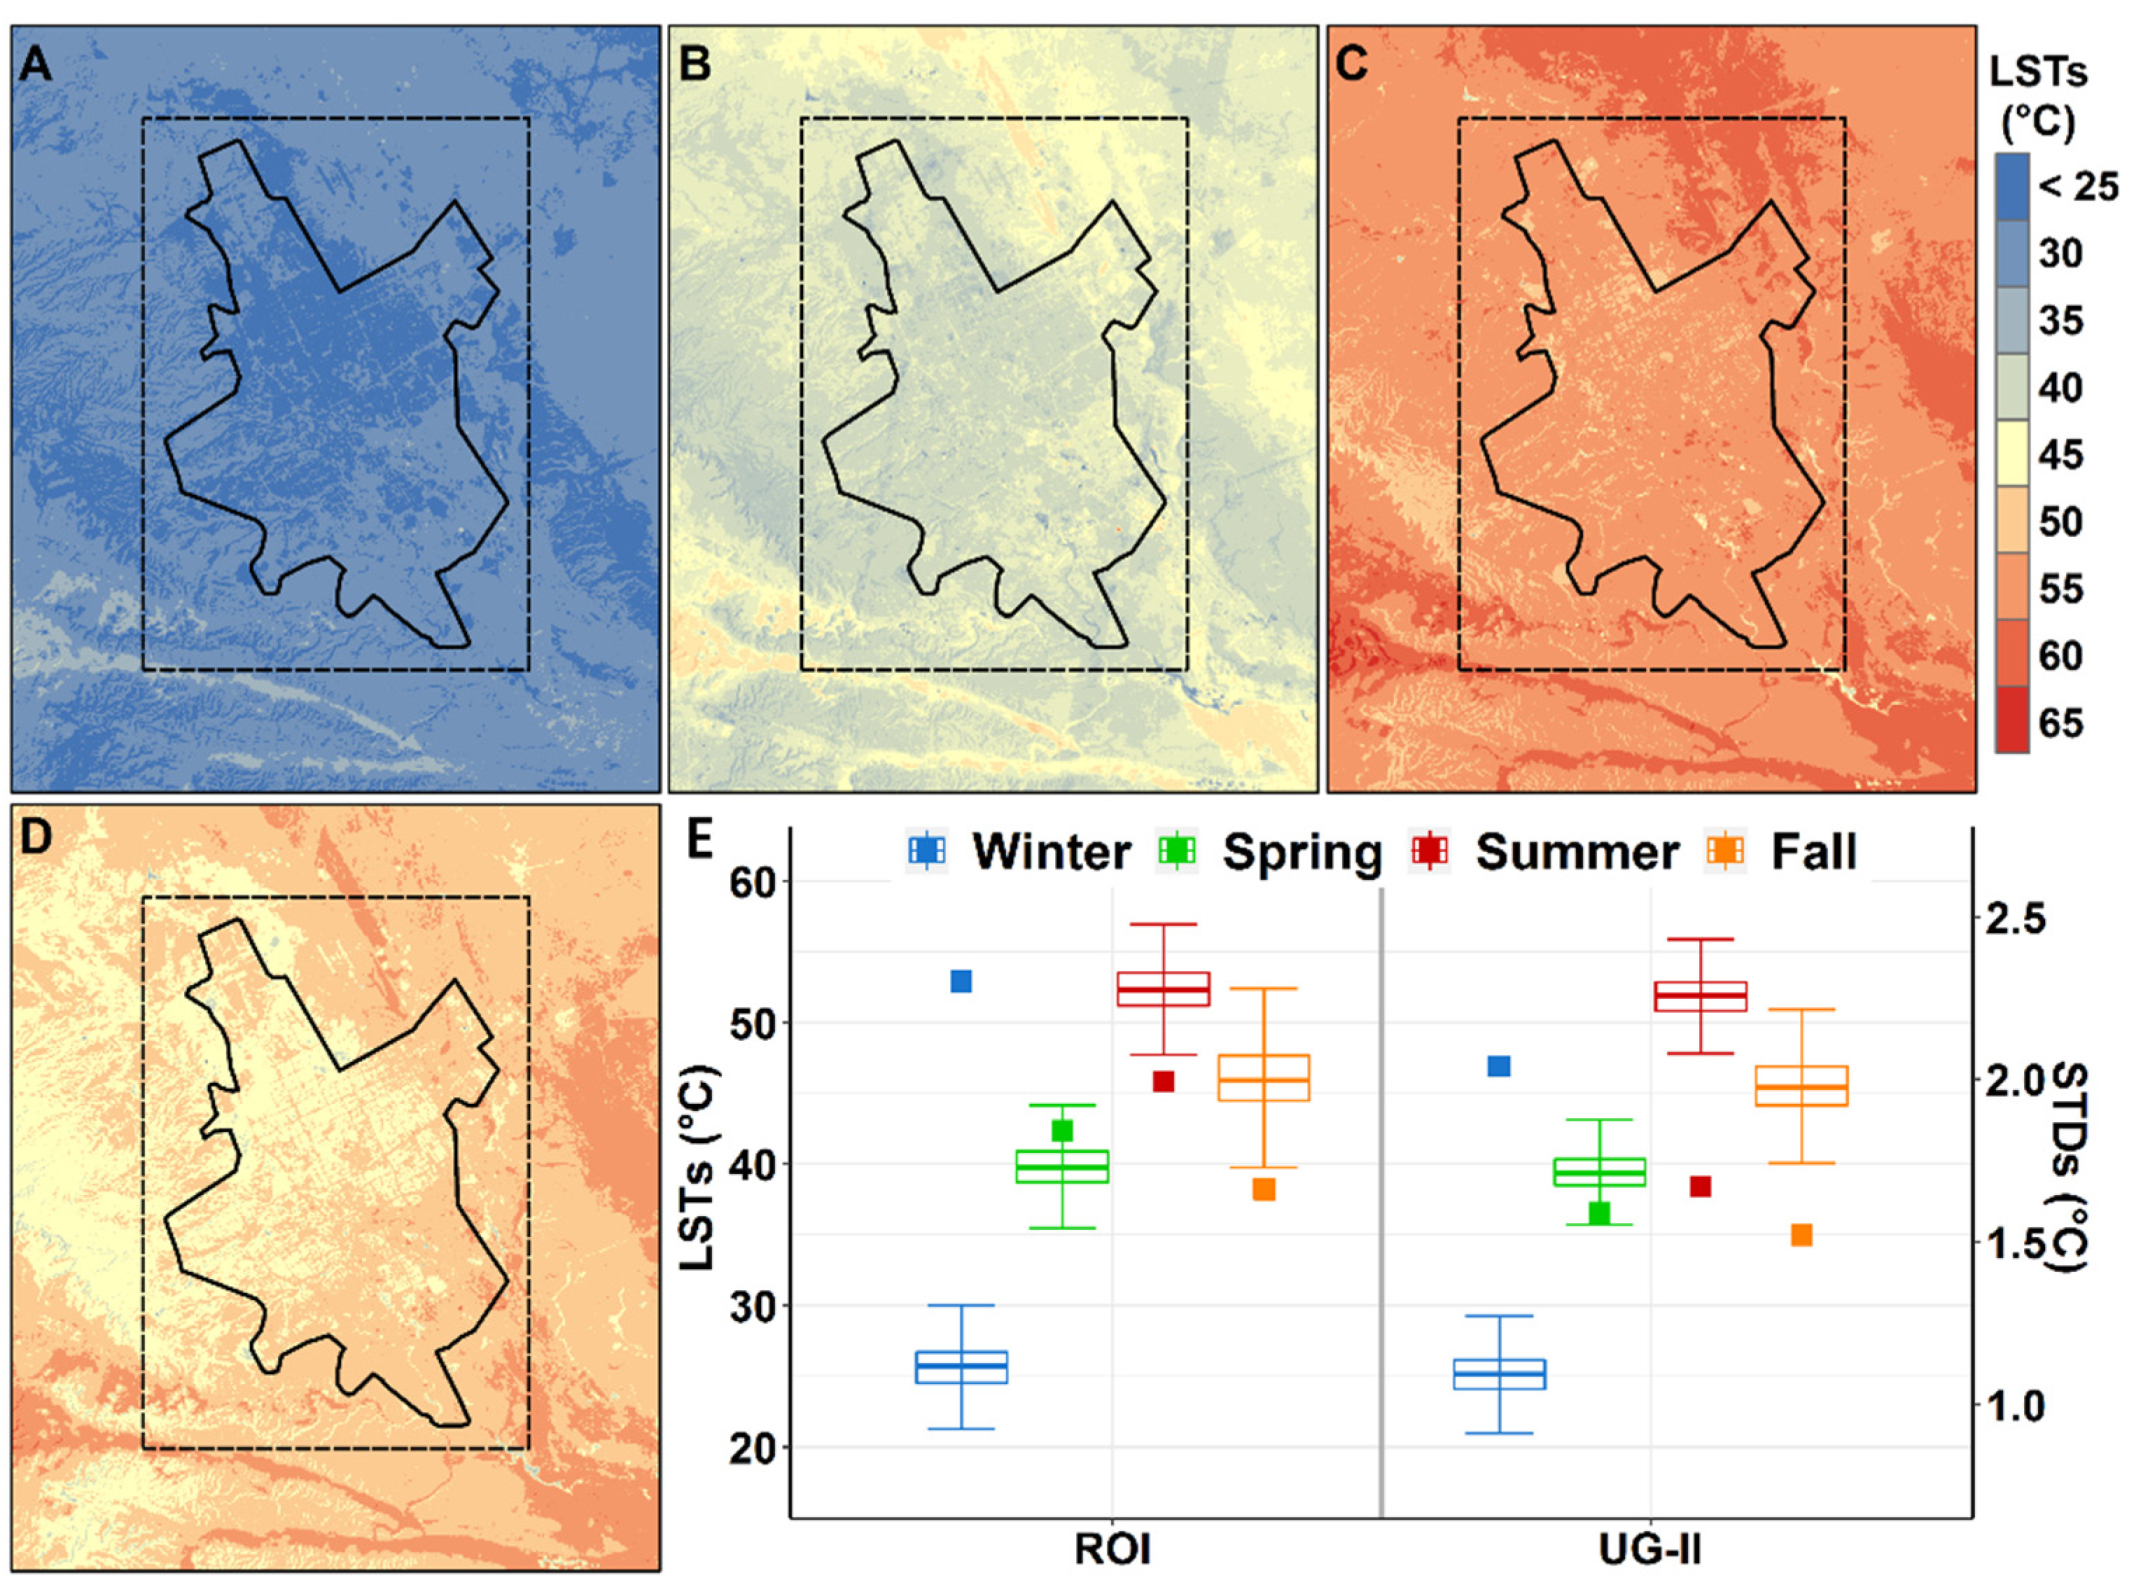
The estimated morning LST demonstrated large seasonal and spatial variability (Figure 4). Summer recorded the highest mean LST (52 °C), followed by fall (46 °C), spring (40 °C), and winter (26 °C) within the ROI (i.e., the study area as a whole). The UG-II experienced similar seasonal patterns with mean LSTs about one-degree lower (Figure 4). Alghamdi and Moore [21] reported similar findings for the city’s UHI due to seasonal changes in solar inclination. In summer (winter), the sun is at higher (lower) elevation, and incoming radiation is more (less) direct and concentrated over smaller (larger) areas. As a result, LSTs are higher in summer and lower in winter. The ROI displayed higher seasonal LST variability (standard deviation) compared to the UG-II (Figure 4D). LSTs experienced increasingly higher variability during fall, summer, spring, and winter. This pattern was observed over both the ROI and UG-II, yet the seasonal differences in variability were higher over the ROI (Figure 4D). The higher mean LSTs over the ROI could be explained by its larger area and a higher presence of sand cover compared to the UG-II (Figure 1). The latter factor might be more important, as sand warms at a higher rate during the daytime and has high heat capacity [21]. In fact, maximum LSTs were detected over areas with pure sand cover in all four seasons. Pan et al. [43] reported similar results in Zhangye City, located in the northern arid region of China. These differences between the ROI and UG-II highlighted the importance of accounting for possible bias related to the size and spatial distribution of land cover (i.e., LCZs) in assessing SUHIs.
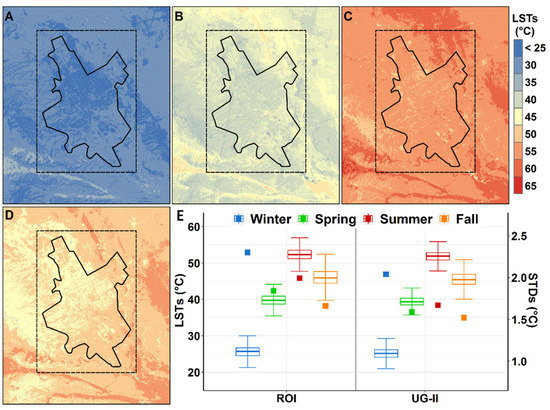
Figure 4.
Mean winter (A), spring (B), summer (C), fall (D) estimated daytime LSTs (°C) and the corresponding boxplots (E) with standard deviations (squares).
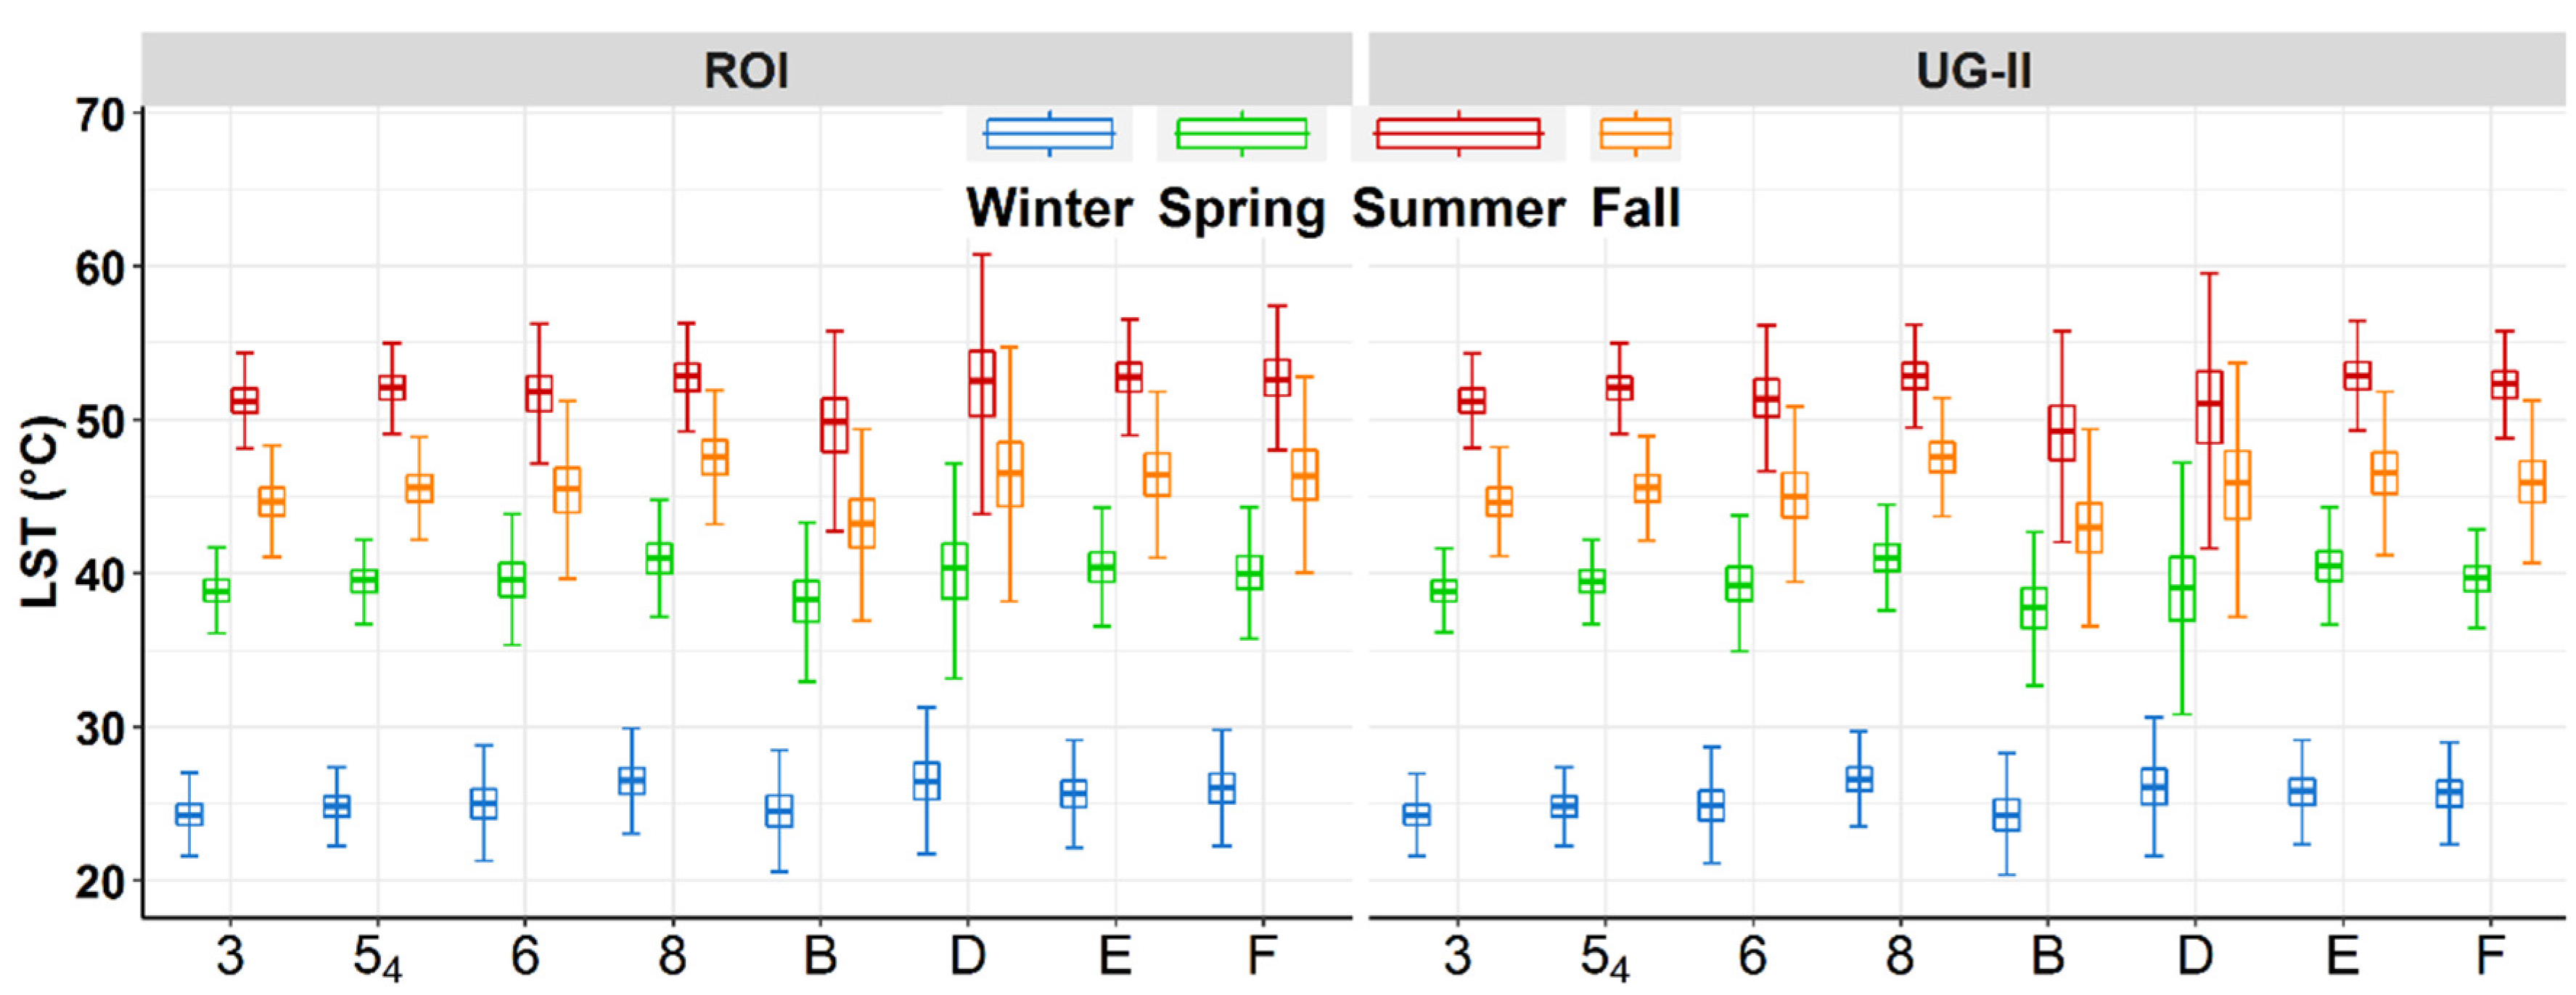
Daytime LST exhibited considerable seasonal variability among LCZ classes over both the UG-II and the ROI (Figure 5). In summer and over the ROI, the LCZ-8, LCZ-E, and LCZ-F classes displayed the highest mean LST of ~53 °C, whereas the LCZ-B class recorded the lowest mean LST of 49 °C. Within the UG-II, LCZ-8 and LCZ-E classes displayed the highest mean LST of 53 °C, and LCZ-B class had the lowest LST of 49 °C. The similarity in summer mean LST values of LCZ-8, LCZ-E, and LCZ-B classes over both the ROI and UG-II could be due to the observation that more than two-thirds of these classes are within the UG-II. In fall, the highest (lowest) mean LST of 47 °C (43 °C) was recorded by the LCZ-8 (LCZ-B) class within both the ROI and UG-II. Over both the ROI and UG-II both LCZ 8 and D classes exhibited the highest mean winter and spring LST, whereas LCZ-B and LCZ-3 classes showed the lowest mean winter and spring LST. Overall, the large low-rise class (LCZ-8) had the highest average LST in all seasons. Other studies showed similar findings for low-rise classes in different cities (e.g., [9,44]). LCZ-B class showed the lowest mean LST across seasons. This class mainly consists of high-height vegetation (e.g., palms), and thus, lower average LSTs could be related to shadowing effects.

Figure 5.
Boxplots of estimated seasonal daytime LSTs for mapped LCZs in the ROI (right) and UG-II (left).
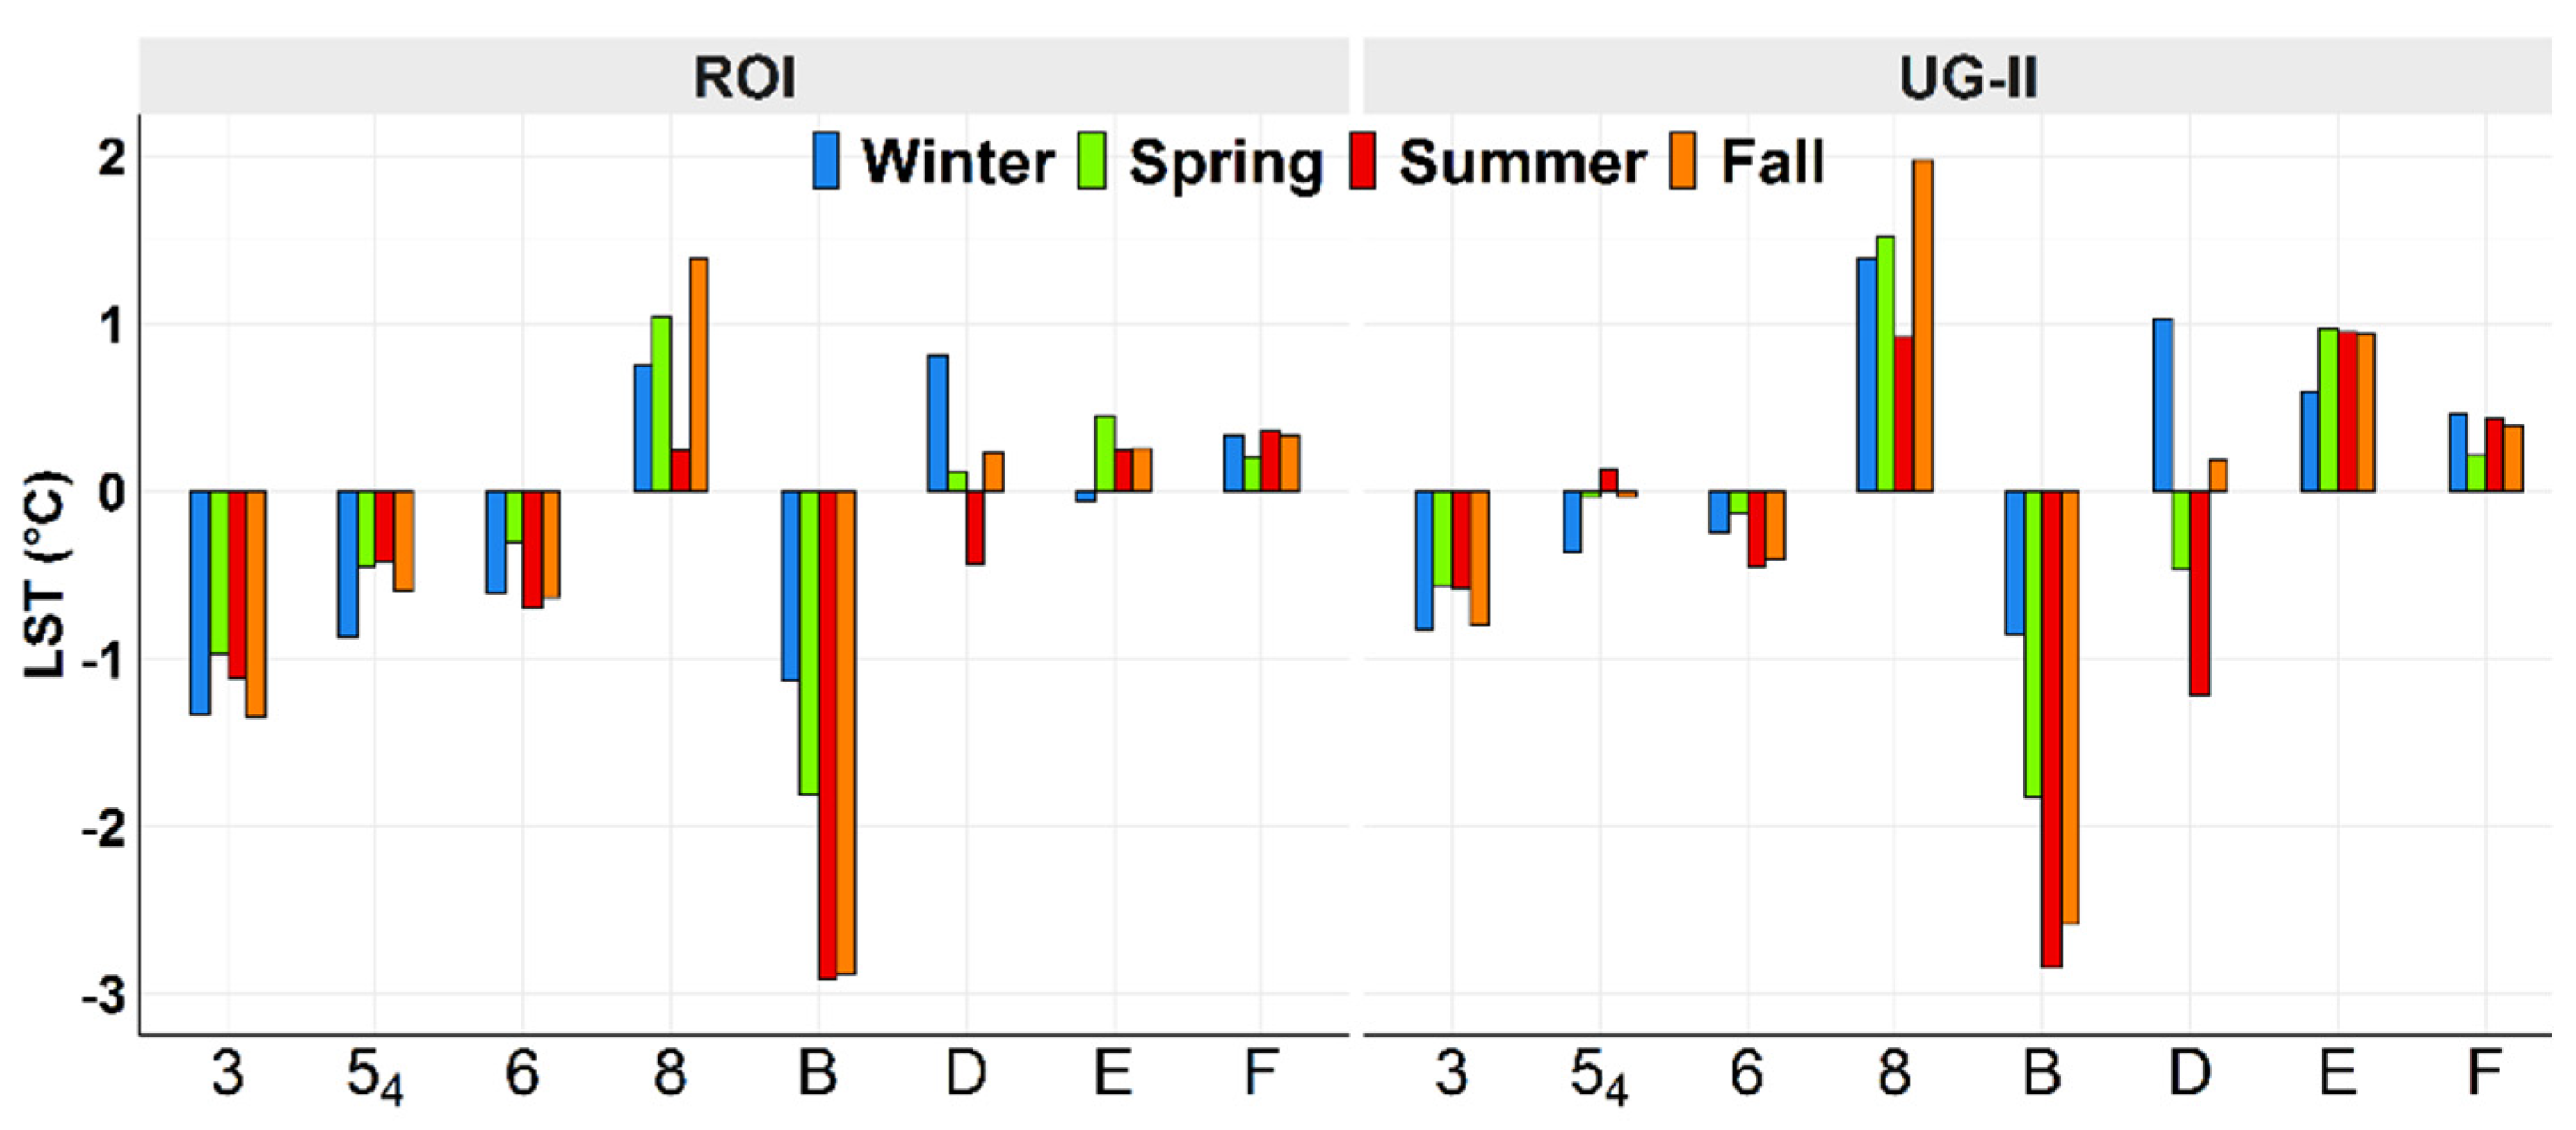
To further explore differences among the LSTs of LCZs, and between the ROI and UG-II, the departure of each LCZ from the mean LST was calculated at ROI and UG-II scales (Figure 6). All LCZs showed similar anomaly directions (positive/negative) over both the ROI and UG-II and across all seasons, except the LCZ-54 class in summer, LCZ-D in spring and summer, and LCZ-E in winter. While urban-type LCZs tended to have large LST departure values (positive and negative) across the ROI (except LCZs 8 and E, largely distributed within the UG-II), land-cover-type LCZs showed large departure values over the UG-II, except the LCZ-B class. Thus, it was important to evaluate LSTs over the UG-II to understand the urban LST variabilities/differences (UG-II) and how urban LSTs differed from the surroundings (ROI). LCZs 3, 54, 6 (urban types), and B classes experienced cooler (negative departure) daytime mean LST in all seasons across the ROI. Similar results were seen across the UG-II, except for the LCZ-54 class during summer. The LCZ-D class exhibited a lower LST than the average in summer across both the ROI and UG-II and in spring over the UG-II. The negative departure values were larger across the ROI for LCZs 3, 54, and B classes compared to the UG-II. This can be attributed to the lower contribution of these classes to the ROI and the higher seasonal mean LSTs of the ROI. These classes were largely confined to the UG-II (Table 4), which had lower seasonal mean LSTs compared to the ROI (Figure 4D). Warm LST deviations (positive departures) were found for the LCZ-8 class (urban-type) and all land-cover types (except LCZ-B) during most of the seasons and across both the ROI and UG-II. For these classes, the magnitudes of LST departures were higher over the UG-II, unlike negative LST deviations.

Figure 6.
Departure from the ROI (right) and UG-II (left) winter (blue), spring (green), summer (red), and fall (orange) daytime mean LSTs (°C) for each LCZ class.
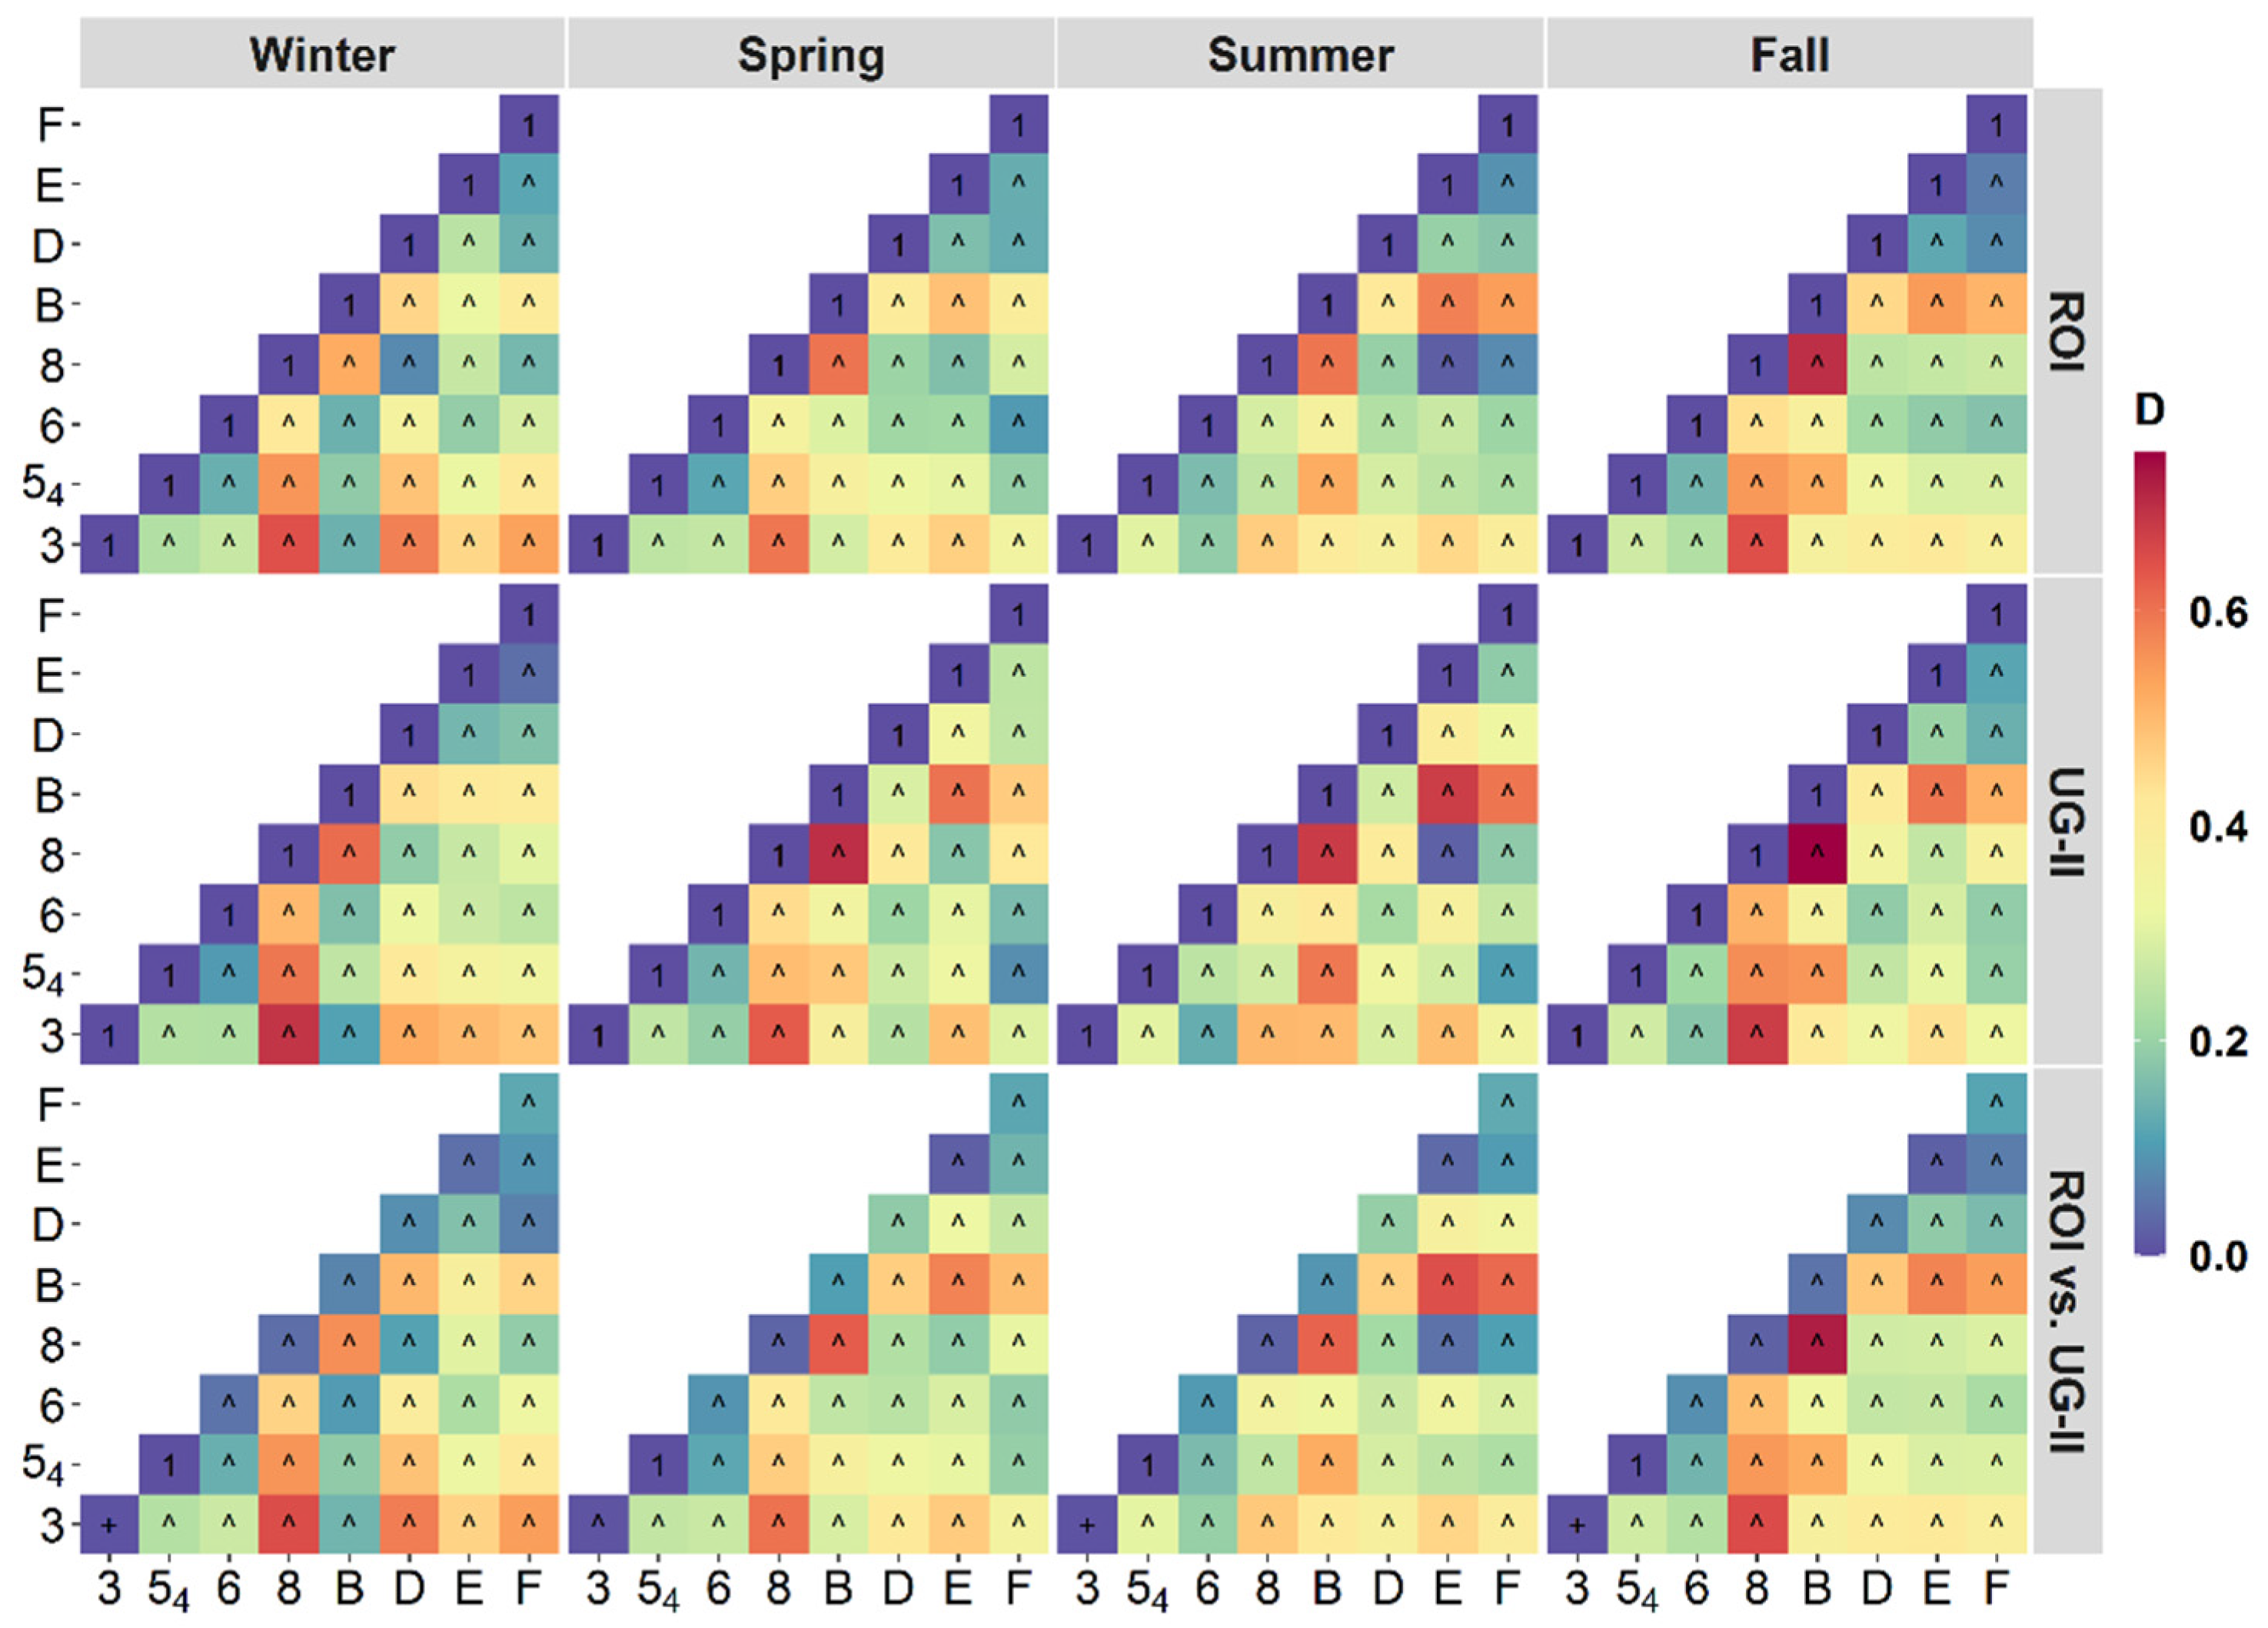
To quantify LST differences among LCZs and between different areas of interest/analysis (ROI vs. UG-II), the K–S test was applied. The results revealed that all LCZs differed significantly in terms of their cumulative distributions of LSTs (i.e., coming from different populations) at all seasons within both the ROI and UG-II (Figure 7, upper and mid panels). This result suggested that the developed LCZs could identify distinctive LSTs among classes [45]. That is, the developed LCZ classification is suitable for the city, as it groups distinct LSTs into different zones. The K–S test also revealed significant differences among LSTs of LCZs over the ROI and those over the UG-II across seasons (Figure 7, lower panel). This indicated that the definition of the research/analysis area is an important aspect, as different definitions can result in significantly different LST cumulative distributions. Such differences might be more related to the spatial configurations of LCZ classes, as they showed different distributions over the ROI and UG-II (Figure 2). Subsequently, different definitions would result in different LST magnitudes and, thus, different SUHI intensity. The results from Figure 6 and Figure 7 revealed the developed LCZs can be used to investigate daytime SUHIs in Riyadh City. Accordingly, the negative LST departures of urban-type and the positive LST departures of land-cover type (excluding LCZ-B) were highly suggestive of SUHI sink presence in Riyadh City.
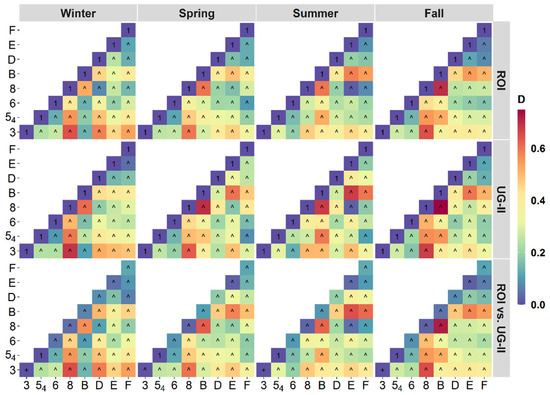
Figure 7.
Results of the K–S tests to compare LCZ classes within each area of interest/analysis (upper [ROI] and mid [UG-II] panels) and between areas of interests/analysis (lower panel, ROI vs. UG-II). Cells with “^” (+) indicate significant difference at p < 0.05 (0.1) level. Cells with value of 1 indicate no significant differences at p < 0.05 or 0.1 levels.
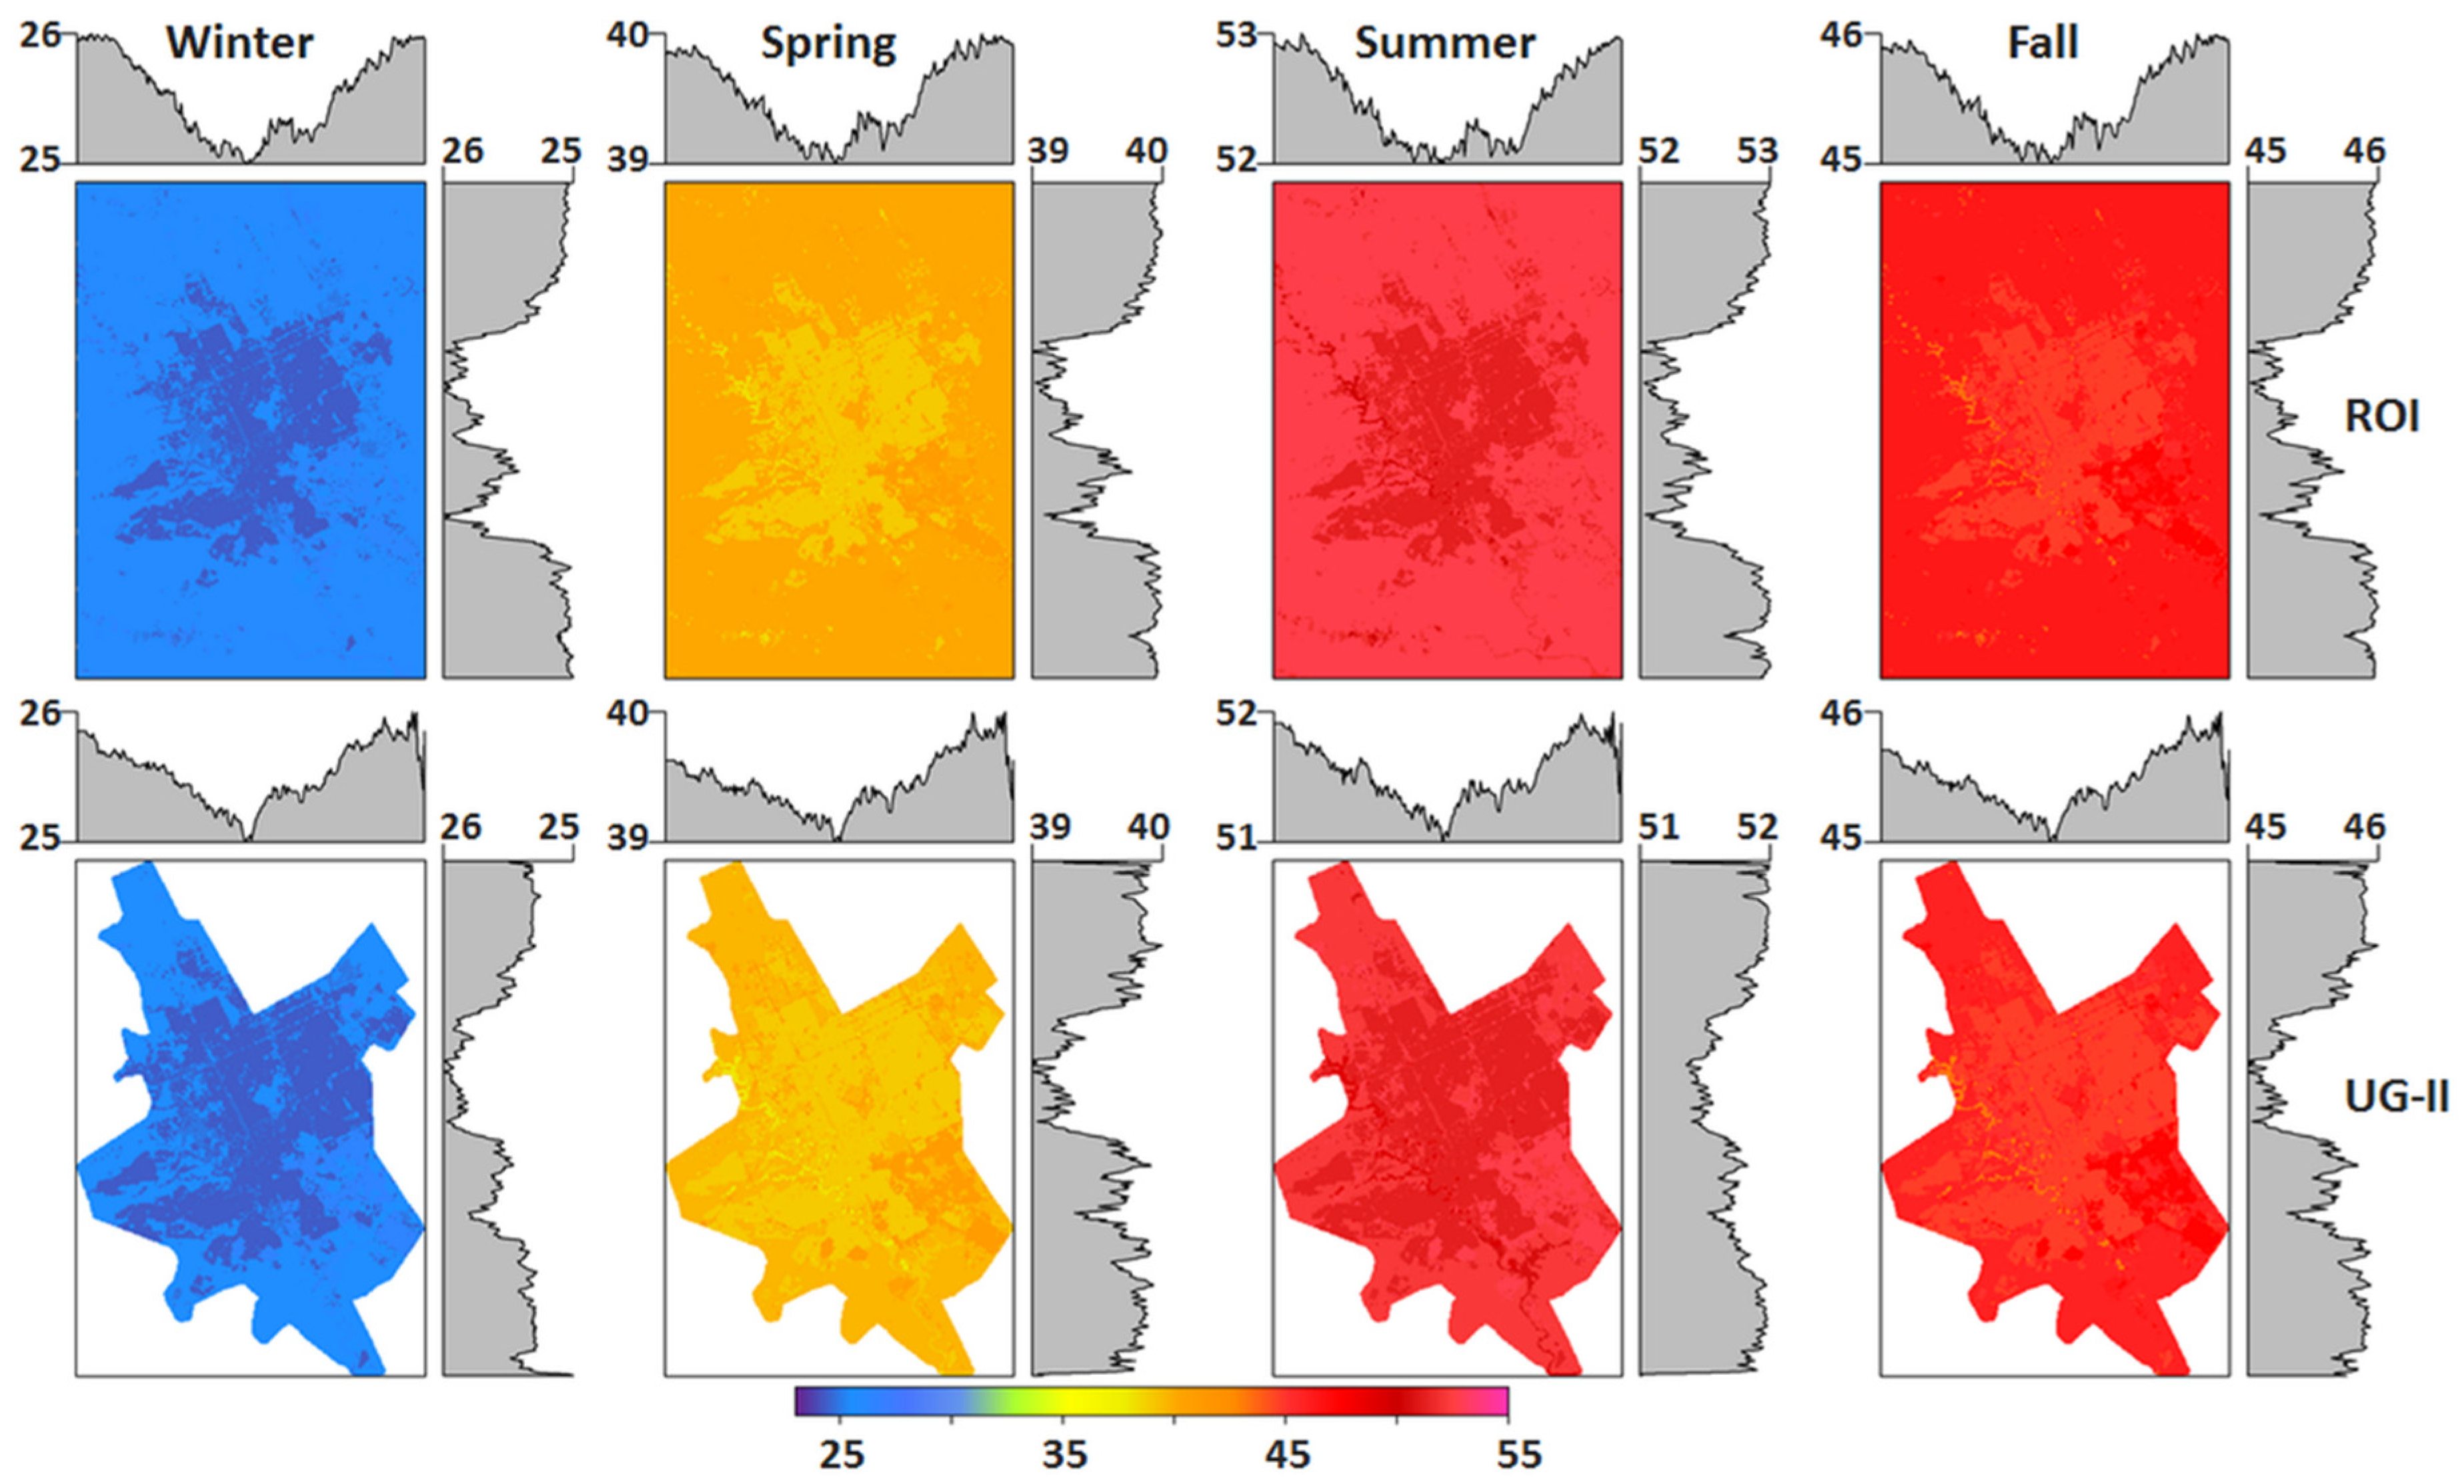
To further explore the nature of daytime SUHIs (i.e., positive or negative) in the city, mean and standard deviation (STD) of LSTs for each LCZ class were mapped, and longitudinal and latitudinal profiles were evaluated (Figure 8 and Figure 9). This approach allowed for a more comprehensive spatial view of the LST profiles, in which LST differences between urban and surroundings could be evaluated. To account for the observed differences in LSTs between the ROI and UG-II due to differences in LCZs distribution, the analyses were performed for both areas. Results in Figure 8 were in line with those in Figure 6 and clearly showed that urban areas experienced lower daytime mean LSTs across seasons compared to the surroundings. This indicated that daytime SUHI sink was highly evident. Longitudinal and latitudinal LST profiles (upper and left sides of each season map in Figure 8 and Figure 9) provide west–east and north–south, respectively, views of mean LSTs and indicate the presence of SUHI sink. For instance, the latitudinal (longitudinal) mean shows the north–south (west–east) profile of LSTs and demonstrates that the mean LSTs started at higher values over northern (western) areas and decreased toward the south (east) over the urban area and then increased south (east) afterward. This observed pattern was seen across all the analyzed seasons, but with different magnitudes, as summer has higher daytime LSTs followed by fall, spring, and winter, in that order. Generally, both the ROI and UG-II areas displayed similar profile patterns, and the UG-II tended to show a detailed profile version of this over the ROI.
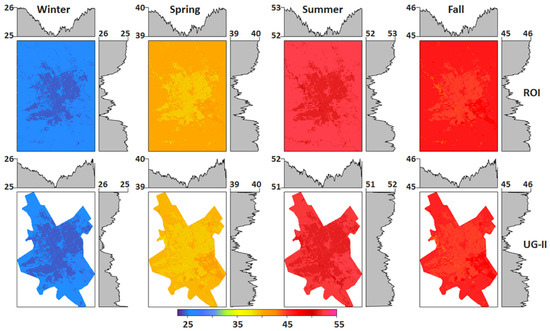
Figure 8.
Seasonal mean daytime LSTs (°C) for each LCZ along with longitudinal (right-side of each map) and latitudinal (upper-side of each map) profiles over the ROI (upper panel) and UG-II (lower panel).
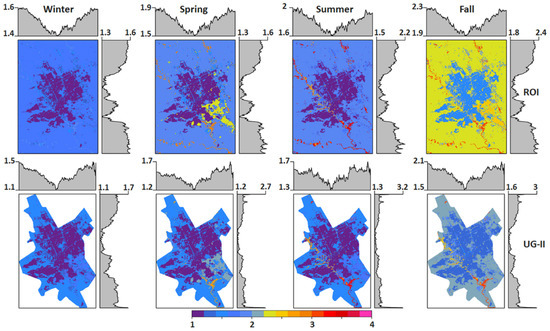
Figure 9.
As in Figure 8, but for STD (°C).
The consistent profile patterns of low mean LSTs over urban areas across seasons and both the ROI and UG-II agreed with the results in Figure 6. These combined results indicated that Riyadh City had daytime SUHI sink during the studied period (June 2017–May 2018). The urban class types of LCZs 3, 54, and 6 were where lower mean LSTs were recorded, and these classes were what mostly constituted the urban area. The spatial distribution of low mean LSTs (Figure 8) corresponded well with the spatial destitution of these classes in Figure 2. Similarly, higher mean LSTs were recorded over the LCZ 8, E, and F classes and their spatial distribution (Figure 2) was similar to that of high mean LSTs (Figure 8). For example, a closer look at the latitudinal and longitudinal profiles showed that mean LSTs have a peak around the middle of the profiles, and this peak parallels the area of LCZ-8. This class had the largest positive departure from mean area LSTs (Figure 6). This was consistent with the findings of Aina et al. [23] and Abulibdeh [46], in which industrial lands (in our case LCZ-8) in Riyadh had the highest daytime LSTs within the urban agglomeration. The higher values at the beginning and end of LST profiles corresponded to areas where the LCZ-F class was primarily distributed.
Generally, profiles of STDs of LSTs showed patterns similar to those found for the mean profiles, where lower values are over urban areas (Figure 9). LST variabilities (STDs) were low over urban areas in all seasons over both the ROI and UG-II, and thus, the daytime SUHI sink appears to have homogenous LSTs. In fall, LSTs had higher variability, followed by summer and winter across most of the LCZs. Higher STD values were found mainly over the areas of the LCZ B and D classes across seasons, with higher magnitudes in summer and fall. The frequent small peaks along the STD profiles of LST (Figure 9) corresponded to the areas of both classes (Figure 2). In summer and fall seasons, the lowest mean LSTs were over both classes (Figure 8), more notably in summer. During warm seasons, evapotranspiration is high (higher sun elevation angle), and most of the heat is transported as latent heat [47]. Accordingly, low mean LSTs in winter were not found across LCZs B and D (Figure 8), and both showed positive LST departure values (Figure 6) as evapotranspiration is lower in this season. This is also combined with the observation that both classes were distributed largely along Wadi Hanifa, which suggested there was more heat trapped near the ground during winter. Furthermore, we noticed that there was a notable frequency of relatively lower LSTs over the LCZ-3 class coupled with the presence of small parks and sparse residential vegetation, which were omitted at the 100 m resolution. Kwarteng and Small [48] detected lower LSTs over residential areas in Kuwait City due to cooling effects of vegetation, even when the proportion of vegetation was low.
4. Summary and Conclusions
Using the LCZ Generator platform, an LCZ classification was developed for Riyadh City for 2017, based on multiple Earth observation input features. Eight LCZs were identified with an overall accuracy of 87%. The bare soil/sand (LCZ-F) class was found to be the largest LCZ class followed by the compact low-rise zone (LCZ-3), which was the largest urban-type class. Other LCZ classes were not dominant as each covered less than 8% of the total area. This is within the expected nature of an arid climate city.
The seasonal thermal characteristics of the developed LCZs were analyzed using LSTs estimated from 40 thermal bands (June 2017–May 2018). The results revealed that the urban area had lower LSTs as urban-type LCZs had low LSTs and experienced a large negative departure from the mean area LSTs across seasons. However, the large low-rise (LCZ-8) class showed the highest seasonal LSTs and tended to demonstrate the largest positive LST departure. The lowest LSTs were found over the scattered trees (LCZ-B) class, except in winter, when LCZ-3 had the lowest LSTs. All the thermal analyses suggested the presence of the SUHI sink and were consistent with the findings of previous research. Studies have indicated that the intensity of Riyadh’s UHI has experienced a decreasing trend [21,31], while Aina et al. [23] reported LSTs have increased. Alghamdi and Moore [21] showed that the daytime UHI in Riyadh transitioned to a UHI sink phenomenon in the early 1990s, which was explained by increases in vegetation cover within the urban area. This study further provided seasonal analysis and showed that LSTs and, substantially SUHIs have seasonal variabilities and their magnitudes depend on how the region of study/analysis is defined. The latter is more related to the spatial distribution of LCZ classes.
The developed LCZ classification has several potential applications in different areas. For instance, one city zoning policy requires that light industrial and large storage facilities be limited to certain areas outside the city. The LCZ-8 class is an example of that policy, and it illustrates how such a strategy has helped to keep higher LSTs outside the city as that zone had the highest mean LSTs. This would also highlight the importance of a new urban design strategy for this zone to mitigate its LSTs, such as increasing spacing and vegetation cover. Another application of the developed LCZ classification is as data input for studies of population vulnerability to temperature discomfort and heat stress (e.g., [14]). Other studies have used the LCZ scheme to model and predict diseases in urban areas (e.g., [49]) as this scheme offers detailed information about urban climate. Accordingly, this developed LCZ classification can be used to provide more insights into several urban-related issues (e.g., health hazards and diseases) that have spatial patterns in the city, like those related to air pollution. Detailed knowledge about these aspects would assist the efforts of urban and health management not only to mitigate UHI/SUHI effects in the city, but also to improve the overall life quality. For instance, a better understanding of how the current urban structures influence the local climate, which contributes to heat stress during heat waves, would not only help improve heat warring and response systems, but would also help direct planning efforts for some of the mitigation strategies.
Vegetation’s negative effects on UHIs/SUHIs are well established in the literature, yet the exact effects on Riyadh City’s UHI/SUHI have not been evaluated, and the results presented here suggest temporal variability as in the winter case. As Collins and Dronova [50] showed, the replacement of bare soil cover (LCZ-F) with open structures and vegetation cover could lead to cooling effects. However, abundance of vegetation cover does not necessarily mitigate UHIs effects, as the low plant cover (LCZ-D) experienced relatively warm LSTs in fall and winter in this work. In a study by Collins and Dronova [50], a similar observation was found but in summer. This can be explained by the work of Li et al. [51], as they found that the spatial configuration of green space plays an important role in the association between LSTs and vegetation as higher fragmentation and density of greenspace increase LSTs. These points emphasize the need for further research as they have received limited attention in arid climate cities.
Supplementary Materials
The following are available online at https://www.mdpi.com/article/10.3390/rs13224526/s1. Figure S1: A map showing a digital elevation model of the study area. Data source: UGGS.
Author Contributions
A.I.A. and H.H.A. formulated, collected and analyzed the data, visualized the results, and drafted the manuscript. A.S.A. developed the methodology, reviewed, and revised the manuscript, and supervised the work. All authors have read and agreed to the published version of the manuscript.
Funding
This research was supported by the Deanship of Scientific Research at King Saud University through research group program (RG-1441-344). There are no conflicts of interest to declare.
Data Availability Statement
The Landsat data are available from the United States Geological Survey website at https://earthexplorer.usgs.gov (accessed on 27 July 2021).
Acknowledgments
The authors extend their appreciation to the Deanship of Scientific Research at King Saud University for funding this work through Research Group no RG-1441-344. We are grateful to four anonymous reviewers for their insightful comments.
Conflicts of Interest
The authors declare no conflict of interest.
Abbreviations
| Abbreviations | Full Name |
| LCLU | Land cover/use |
| LCZ | Local climate zones |
| LCZs Generator | Local climate zone generator platform/tool |
| LST | Land surface temperature |
| ROI | Region of interest |
| SUHI | Surface urban heat island |
| UG-II | Urban growth boundary limit phase II |
| UHI | Urban heat island |
| WUDAPT | World Urban Database and Access Portal Tools |
| STD | Standard deviation |
| OA | Overall accuracy |
| OAu | Overall accuracy for urban LCZ classes only |
| OAbu | Overall accuracy of the built versus land-cover LCZ classes only |
| OAw | Weighted accuracy |
References
- Wang, R.; Ren, C.; Xu, Y.; Lau, K.K.-L.; Shi, Y. Mapping the local climate zones of urban areas by GIS-based and WUDAPT methods: A case study of Hong Kong. Urban Clim. 2018, 24, 567–576. [Google Scholar] [CrossRef]
- Zheng, Y.; Ren, C.; Xu, Y.; Wang, R.; Ho, J.; Lau, K.; Ng, E. GIS-based mapping of Local Climate Zone in the high-density city of Hong Kong. Urban Clim. 2018, 24, 419–448. [Google Scholar] [CrossRef]
- Goodwin, N.R.; Coops, N.C.; Tooke, T.R.; Christen, A.; A Voogt, J. Characterizing urban surface cover and structure with airborne lidar technology. Can. J. Remote Sens. 2009, 35, 297–309. [Google Scholar] [CrossRef]
- Stewart, I.D.; Oke, T.R. Local Climate Zones for Urban Temperature Studies. Bull. Am. Meteorol. Soc. 2012, 93, 1879–1900. [Google Scholar] [CrossRef]
- Martin-Vide, J.; Sarricolea, P.; Moreno-García, M.C. On the definition of urban heat island intensity: The “rural” reference. Front. Earth Sci. 2015, 3, 24. [Google Scholar]
- Ellefsen, R. Mapping and measuring buildings in the canopy boundary layer in ten U.S. cities. Energy Build. 1991, 16, 1025–1049. [Google Scholar] [CrossRef]
- Davenport, A.G.; Grimmond, C.S.B.; Oke, T.R.; Wieringa, J. Estimating the roughness of cities and sheltered country. In Proceedings of the 12th Conference on Applied Climatology, Asheville, NC, USA, 8–11 May 2000; American Meteor Society: New York, NY, USA, 2000; Volume 96, p. 99. [Google Scholar]
- Oke, T.R. Initial guidance to obtain representative meteorological observations at urban sites. Instrum. Obs. Methods 2004, 47, 2006. [Google Scholar]
- Wang, C.; Middel, A.; Myint, S.W.; Kaplan, S.; Brazel, A.J.; Lukasczyk, J. Assessing local climate zones in arid cities: The case of Phoenix, Arizona and Las Vegas, Nevada. ISPRS J. Photogramm. Remote Sens. 2018, 141, 59–71. [Google Scholar] [CrossRef]
- Bechtel, B.; Alexander, P.J.; Böhner, J.; Ching, J.; Conrad, O.; Feddema, J.; Mills, G.; See, L.; Stewart, I. Mapping Local Climate Zones for a Worldwide Database of the Form and Function of Cities. ISPRS Int. J. Geo-Inf. 2015, 4, 199–219. [Google Scholar] [CrossRef] [Green Version]
- Xue, J.; You, R.; Liu, W.; Chen, C.; Lai, D. Applications of Local Climate Zone Classification Scheme to Improve Urban Sustainability: A Bibliometric Review. Sustainability 2020, 12, 8083. [Google Scholar] [CrossRef]
- Lehnert, M.; Savić, S.; Milošević, D.; Dunjić, J.; Geletič, J. Mapping Local Climate Zones and Their Applications in European Urban Environments: A Systematic Literature Review and Future Development Trends. ISPRS Int. J. Geo-Inf. 2021, 10, 260. [Google Scholar] [CrossRef]
- Verdonck, M.-L.; Demuzere, M.; Hooyberghs, H.; Beck, C.; Cyrys, J.; Schneider, A.; Dewulf, R.; Van Coillie, F. The potential of local climate zones maps as a heat stress assessment tool, supported by simulated air temperature data. Landsc. Urban Plan. 2018, 178, 183–197. [Google Scholar] [CrossRef]
- Kotharkar, R.; Ghosh, A.; Kotharkar, V. Estimating summertime heat stress in a tropical Indian city using Local Climate Zone (LCZ) framework. Urban Clim. 2021, 36, 100784. [Google Scholar] [CrossRef]
- Yang, X.; Peng, L.L.H.; Jiang, Z.; Chen, Y.; Yao, L.; He, Y.; Xu, T. Impact of urban heat island on energy demand in buildings: Local climate zones in Nanjing. Appl. Energy 2020, 260, 114279. [Google Scholar] [CrossRef]
- Ching, J.; Mills, G.; Bechtel, B.; See, L.; Feddema, J.; Wang, X.; Ren, C.; Brousse, O.; Martilli, A.; Neophytou, M.; et al. WUDAPT: An Urban Weather, Climate, and Environmental Modeling Infrastructure for the Anthropocene. Bull. Am. Meteorol. Soc. 2018, 99, 1907–1924. [Google Scholar] [CrossRef] [Green Version]
- Mushore, T.D.; Dube, T.; Manjowe, M.; Gumindoga, W.; Chemura, A.; Rousta, I.; Odindi, J.; Mutanga, O. Remotely sensed retrieval of Local Climate Zones and their linkages to land surface temperature in Harare metropolitan city, Zimbabwe. Urban Clim. 2019, 27, 259–271. [Google Scholar] [CrossRef]
- Verdonck, M.L.; Okujeni, A.; van der Linden, S.; Demuzere, M.; De Wulf, R.; Van Coillie, F. Influence of neighbourhood information on ‘Local Climate Zone’ mapping in heterogeneous cities. Int. J. Appl. Earth Obs. Geoinf. 2017, 62, 102–113. [Google Scholar] [CrossRef]
- Fricke, C.; Pongrácz, R.; Gál, T.; Savić, S.; Unger, J. Using local climate zones to compare remotely sensed surface temperatures in temperate cities and hot desert cities. Morav. Geogr. Rep. 2020, 28, 48–60. [Google Scholar] [CrossRef]
- Demuzere, M.; Kittner, J.; Bechtel, B. LCZ Generator: A Web Application to Create Local Climate Zone Maps. Front. Environ. Sci. 2021, 9. [Google Scholar] [CrossRef]
- Alghamdi, A.S.; Moore, T.W. Detecting temporal changes in Riyadh’s urban heat island. Appl. Geogr. 2015, 1, 312–325. [Google Scholar] [CrossRef]
- Bakarman, M.A.; Chang, J.D. The Influence of Height/width Ratio on Urban Heat Island in Hot-arid Climates. Procedia Eng. 2015, 118, 101–108. [Google Scholar] [CrossRef]
- Aina, Y.A.; Adam, E.M.; Ahmed, F. Spatiotemporal variations in the impacts of urban land use types on urban heat island effects: The case of Riyadh, Saudi Arabia. Int. Arch. Photogramm. Remote Sens. Spat. Inf. Sci. 2017, 42, 9–14. [Google Scholar] [CrossRef] [Green Version]
- Eldesoky, A.H.; Gil, J.; Pont, M.B. The suitability of the urban local climate zone classification scheme for surface temperature studies in distinct macroclimate regions. Urban Clim. 2021, 37, 100823. [Google Scholar] [CrossRef]
- Alqurashi, A.F.; Kumar, L.; Sinha, P. Urban Land Cover Change Modelling Using Time-Series Satellite Images: A Case Study of Urban Growth in Five Cities of Saudi Arabia. Remote Sens. 2016, 8, 838. [Google Scholar] [CrossRef] [Green Version]
- Rahman, M.T.; Planning, R. Land use and land cover changes and urban sprawl in Riyadh, Saudi Arabia: An analysis using multi-temporal Landsat data and Shannon’s Entropy Index. Int. Arch. Photogramm. Remote Sens. Spat. Inf. Sci. 2016, 41, 1017–1021. [Google Scholar] [CrossRef] [Green Version]
- Aina, Y.A.; Adam, E.; Ahmed, F.; Wafer, A.; Alshuwaikhat, H.M. Using multisource data and the V-I-S model in assessing the urban expansion of Riyadh city, Saudi Arabia. Eur. J. Remote Sens. 2019, 52, 557–571. [Google Scholar] [CrossRef] [Green Version]
- Alghamdi, A.; Cummings, A.R. Assessing Riyadh’s Urban Change Utilizing High-Resolution Imagery. Land 2019, 8, 193. [Google Scholar] [CrossRef] [Green Version]
- AlQurashi, A.F.; Kumar, L. An assessment of the impact of urbanization and land use changes in the fast-growing cities of Saudi Arabia. Geocarto Int. 2017, 34, 78–97. [Google Scholar] [CrossRef]
- Altuwaijri, H.A.; Alotaibi, M.H.; Almudlaj, A.M.; Almalki, F.M. Predicting urban growth of Arriyadh city, capital of the Kingdom of Saudi Arabia, using Markov cellular automata in TerrSet geospatial system. Arab. J. Geosci. 2019, 12, 135. [Google Scholar] [CrossRef]
- Alkolibi, F.M. Possible Effects of Global Warming on Agriculture and Water Resources in Saudi Arabia: Impacts and Responses. Clim. Chang. 2002, 54, 225–245. [Google Scholar] [CrossRef]
- Sobrino, J.A.; Irakulis, I. A Methodology for Comparing the Surface Urban Heat Island in Selected Urban Agglomerations Around the World from Sentinel-3 SLSTR Data. Remote Sens. 2020, 12, 2052. [Google Scholar] [CrossRef]
- Nasrallah, H.A.; Brazel, A.J.; Balling, R.C., Jr. Analysis of the Kuwait City urban heat island. International Journal of Climatology 1990, 10, 401–405. [Google Scholar] [CrossRef]
- Chen, X.-L.; Zhao, H.-M.; Li, P.-X.; Yin, Z.-Y. Remote sensing image-based analysis of the relationship between urban heat island and land use/cover changes. Remote Sens. Environ. 2006, 104, 133–146. [Google Scholar] [CrossRef]
- Ren, C.; Cai, M.; Li, X.; Zhang, L.; Wang, R.; Xu, Y.; Ng, E.Y.Y. Assessment of Local Climate Zone Classification Maps of Cities in China and Feasible Refinements. Sci. Rep. 2019, 9, 1–11. [Google Scholar] [CrossRef] [Green Version]
- Radoux, J.; Lamarche, C.; Van Bogaert, E.; Bontemps, S.; Brockmann, C.; Defourny, P. Automated Training Sample Extraction for Global Land Cover Mapping. Remote Sens. 2014, 6, 3965–3987. [Google Scholar] [CrossRef] [Green Version]
- Demuzere, M.; Hankey, S.; Mills, G.; Zhang, W.; Lu, T.; Bechtel, B. Combining expert and crowd-sourced training data to map urban form and functions for the continental US. Sci. Data 2020, 7, 1–13. [Google Scholar] [CrossRef]
- Bechtel, B.; Demuzere, M.; Mills, G.; Zhan, W.; Sismanidis, P.; Small, C.; Voogt, J. SUHI analysis using Local Climate Zones—A comparison of 50 cities. Urban Clim. 2019, 28, 100451. [Google Scholar] [CrossRef]
- Malakar, N.K.; Hulley, G.C.; Hook, S.J.; Laraby, K.; Cook, M.; Schott, J.R. An Operational Land Surface Temperature Product for Landsat Thermal Data: Methodology and Validation. IEEE Trans. Geosci. Remote Sens. 2018, 56, 5717–5735. [Google Scholar] [CrossRef]
- USGS. Landsat 8-9 Calibration and Validation (Cal/Val) Algorithm Description Document (ADD). 2021. Available online: https://prd-wret.s3.us-west-2.amazonaws.com/assets/palladium/production/atoms/files/LSDS-1747_Landsat8-9_CalVal_ADD-v4.pdf (accessed on 14 August 2021).
- Massey, F.J., Jr. The Kolmogorov-Smirnov test for goodness of fit. J. Am. Stat. Assoc. 1951, 46, 68–78. [Google Scholar] [CrossRef]
- Zhao, C.; Jensen, J.; Weng, Q.; Currit, N.; Weaver, R. Application of airborne remote sensing data on mapping local climate zones: Cases of three metropolitan areas of Texas, U.S. Comput. Environ. Urban Syst. 2019, 74, 175–193. [Google Scholar] [CrossRef]
- Pan, X.; Zhu, X.; Yang, Y.; Cao, C.; Zhang, X.; Shan, L. Applicability of Downscaling Land Surface Temperature by Using Normalized Difference Sand Index. Sci. Rep. 2018, 8, 1–14. [Google Scholar] [CrossRef] [Green Version]
- Du, P.; Chen, J.; Bai, X.; Han, W. Understanding the seasonal variations of land surface temperature in Nanjing urban area based on local climate zone. Urban Clim. 2020, 33, 100657. [Google Scholar] [CrossRef]
- Zhao, C.; Jensen, J.L.R.; Weng, Q.; Currit, N.; Weaver, R. Use of Local Climate Zones to investigate surface urban heat islands in Texas. GIScience Remote Sens. 2020, 57, 1083–1101. [Google Scholar] [CrossRef]
- Abulibdeh, A. Analysis of urban heat island characteristics and mitigation strategies for eight arid and semi-arid gulf region cities. Environ. Earth Sci. 2021, 80, 1–26. [Google Scholar] [CrossRef] [PubMed]
- Li, N.; Yang, J.; Qiao, Z.; Wang, Y.; Miao, S. Urban Thermal Characteristics of Local Climate Zones and Their Mitigation Measures across Cities in Different Climate Zones of China. Remote Sens. 2021, 13, 1468. [Google Scholar] [CrossRef]
- Kwarteng, A.Y.; Small, C.L. Comparative analysis of thermal environments in New York City and Kuwait City. In Proceedings of the Remote Sensing of Urban Areas, Tempe, AZ, USA, 14–16 March 2005. [Google Scholar]
- Brousse, O.; Georganos, S.; Demuzere, M.; Dujardin, S.; Lennert, M.; Linard, C.; Snow, R.W.; Thiery, W.; Van Lipzig, N.P.M. Can we use local climate zones for predicting malaria prevalence across sub-Saharan African cities? Environ. Res. Lett. 2020, 15, 124051. [Google Scholar] [CrossRef]
- Collins, J.; Dronova, I. Urban Landscape Change Analysis Using Local Climate Zones and Object-Based Classification in the Salt Lake Metro Region, Utah, USA. Remote Sens. 2019, 11, 1615. [Google Scholar] [CrossRef] [Green Version]
- Li, X.; Zhou, W.; Ouyang, Z. Relationship between land surface temperature and spatial pattern of greenspace: What are the effects of spatial resolution? Landsc. Urban Plan. 2013, 114, 1–8. [Google Scholar] [CrossRef]


Publisher’s Note: MDPI stays neutral with regard to jurisdictional claims in published maps and institutional affiliations. |
© 2021 by the authors. Licensee MDPI, Basel, Switzerland. This article is an open access article distributed under the terms and conditions of the Creative Commons Attribution (CC BY) license (https://creativecommons.org/licenses/by/4.0/).