Abstract
Asia currently has the world’s largest arid and semi-arid zones, so a timely assessment of future droughts in the Asian drylands is prudent, particularly in the context of recent frequent sandstorms. This paper assesses the duration, frequency, and intensity of drought events in the Asian drylands based on nine climate models of the Coupled Model Intercomparison Project Phase 6 (CMIP6). The results show that a high percentage of land area is experiencing significant drought intensification of 65.1%, 89.9%, and 99.8% under Shared Socioeconomic Pathways (SSP)126, SSP245, and SSP585 scenarios, respectively. Furthermore, the data indicate that future droughts will become less frequent but longer in duration and more intense, with even more severe future droughts predicted for northwest China and western parts of Uzbekistan and Kazakhstan. Drought durations of 10.8 months and 13.4 months are anticipated for the future periods of 2021–2060 and 2061–2100, respectively, compared to the duration of 6.6 months for the historical period (1960–2000). Meanwhile, drought intensity is expected to reach 1.37 and 1.66, respectively, for future events compared to 0.97 for the historical period. However, drought severity under SSP245 will be weaker than that under SSP126 due to the mitigating effect of precipitation. The results of this study can provide a basis for the development of adaptation measures in Asian dryland nations.
1. Introduction
Arid regions are among the most vulnerable to ongoing climate change and climate extremes [1]. Three-quarters of arid zone expansion will occur in poor and technologically underdeveloped countries [2]. Asia has the largest arid and semi-arid zones in the world and stretches over 10.8 × 10⁶ km2 [3]. The drylands region stretches from the Caspian Sea in the west to Manchuria in the east and includes the five Central Asian countries (Kazakhstan, Uzbekistan, Turkmenistan, Tajikistan, and Kyrgyzstan), along with the Republic of Mongolia and northwest China. In the context of climate change, the Asian drylands face numerous threats, such as increasing climate disaster risks, unstable socio-economic forces, and environmental challenges, all of which impact regional survival [4,5]. In March 2021, China’s northern provinces were struck with one of the most intense and widespread dust storms that the country has experienced in the past decade. The storm originated in the Asian arid zone, and the cause of the event is inextricably linked to the long-term drought trend in the region caused by global climate change.
According to a report by the 2021 Intergovernmental Panel on Climate Change (IPCC), the Northern Hemisphere in general, along with Central Asia and the arid regions of northwest China in particular, are all experiencing increased agricultural and ecological drought in some regions due to increased land evapotranspiration [6,7,8]. Climate model projections suggest that Central Asia may face increasing drought frequency and intensity [9,10]. Compared to global averages, the mid-latitudes of the Northern Hemisphere, drylands of Asia, are more sensitive to climate change [11,12,13], and previous studies suggest that the average annual temperature in the drylands of Asia increased by 1.7 degrees Celsius at a rate of 0.14 degrees Celsius per decade from 1901 to 2018 [3]. This trend will lead to increasing pressure on water supply demand from rising evaporation water requirements [12], while increased aridification will place the agriculture-dependent zone at risk of further land degradation. Therefore, it is imperative to study projected future drought trends in the Asian drylands in order to find means to prevent high poverty from occurring in this region [4,14].
The IPCC assessment report, along with current analyses from the Coupled Model Intercomparison Project (CMIP), form our primary sources of data support and knowledge regarding how droughts will likely change in the future [15,16]. CMIP3 and CMIP5 are model ensembles developed based on the Fourth and Fifth Assessment Reports of the IPCC, respectively. These GCMs consistently show increased global drought in the 21st century [17,18], while the recently developed CMIP6 coordinates its work with the Representative Concentration Pathway (RCP) through shared policy assumptions and adopts a rational approach to Shared Socioeconomic Pathways (SSPs) [19]. Compared to the CMIP5 model, CMIP6 shows improved performance in many drought-related aspects, such as runoff, terrestrial water storage, and surface energy allocation (including the shortwave and longwave radiative fluxes at the surface) [20,21]. It also shows general improvements in simulating extreme climate and trend patterns in most terrestrial regions in extreme climate studies [22,23,24].
Based on CMIP6 data, drought projections have been conducted at global and regional (China, South Asia, and India) scales [18,25,26,27,28]. Climate model projections indicate that drought will affect many areas at low and mid-latitudes under increasing Greenhouse Gas (GHG) concentrations. Although dryland environments are shared across countries and regions, the management of these ecosystems varies from country to country. At the same time, there is a lack of current studies based on CMIP6 data for the Asian drylands.
Therefore, our aim in this study is to investigate long-term changes in the characteristics of future drought events from the perspective of the entire Asia drylands region.
- Based on raw data from nine CMIP6 models, we evaluate the performance and feasibility of Global Climate Model (GCM) data in reproducing temperature, precipitation, and potential evapotranspiration (PET) over the past 50 years for the drylands of Asia.
- As well, we use the Standardized Precipitation Evapotranspiration Index (SPEI) to assess future trends in drought characteristics. The SPEI comprehensively considers changes in precipitation, solar and infrared radiation, humidity, and wind speed.
- Spatial and temporal changes in drought intensity, frequency, and duration in the Asian drylands are projected simultaneously for the two time periods of 2021–2060 (near future) and 2061–2100 (far future), under high (SSP585), medium (SSP245), and low (SSP126).
Our study extends beyond the standard assessment paradigm based on national boundaries to examine climate hazards and risks from a continent-wide drylands perspective. Further, it provides ideas and references on how best to mitigate dryland-specific hazards across the drylands of Asia.
2. Materials and Methods
2.1. Study Area
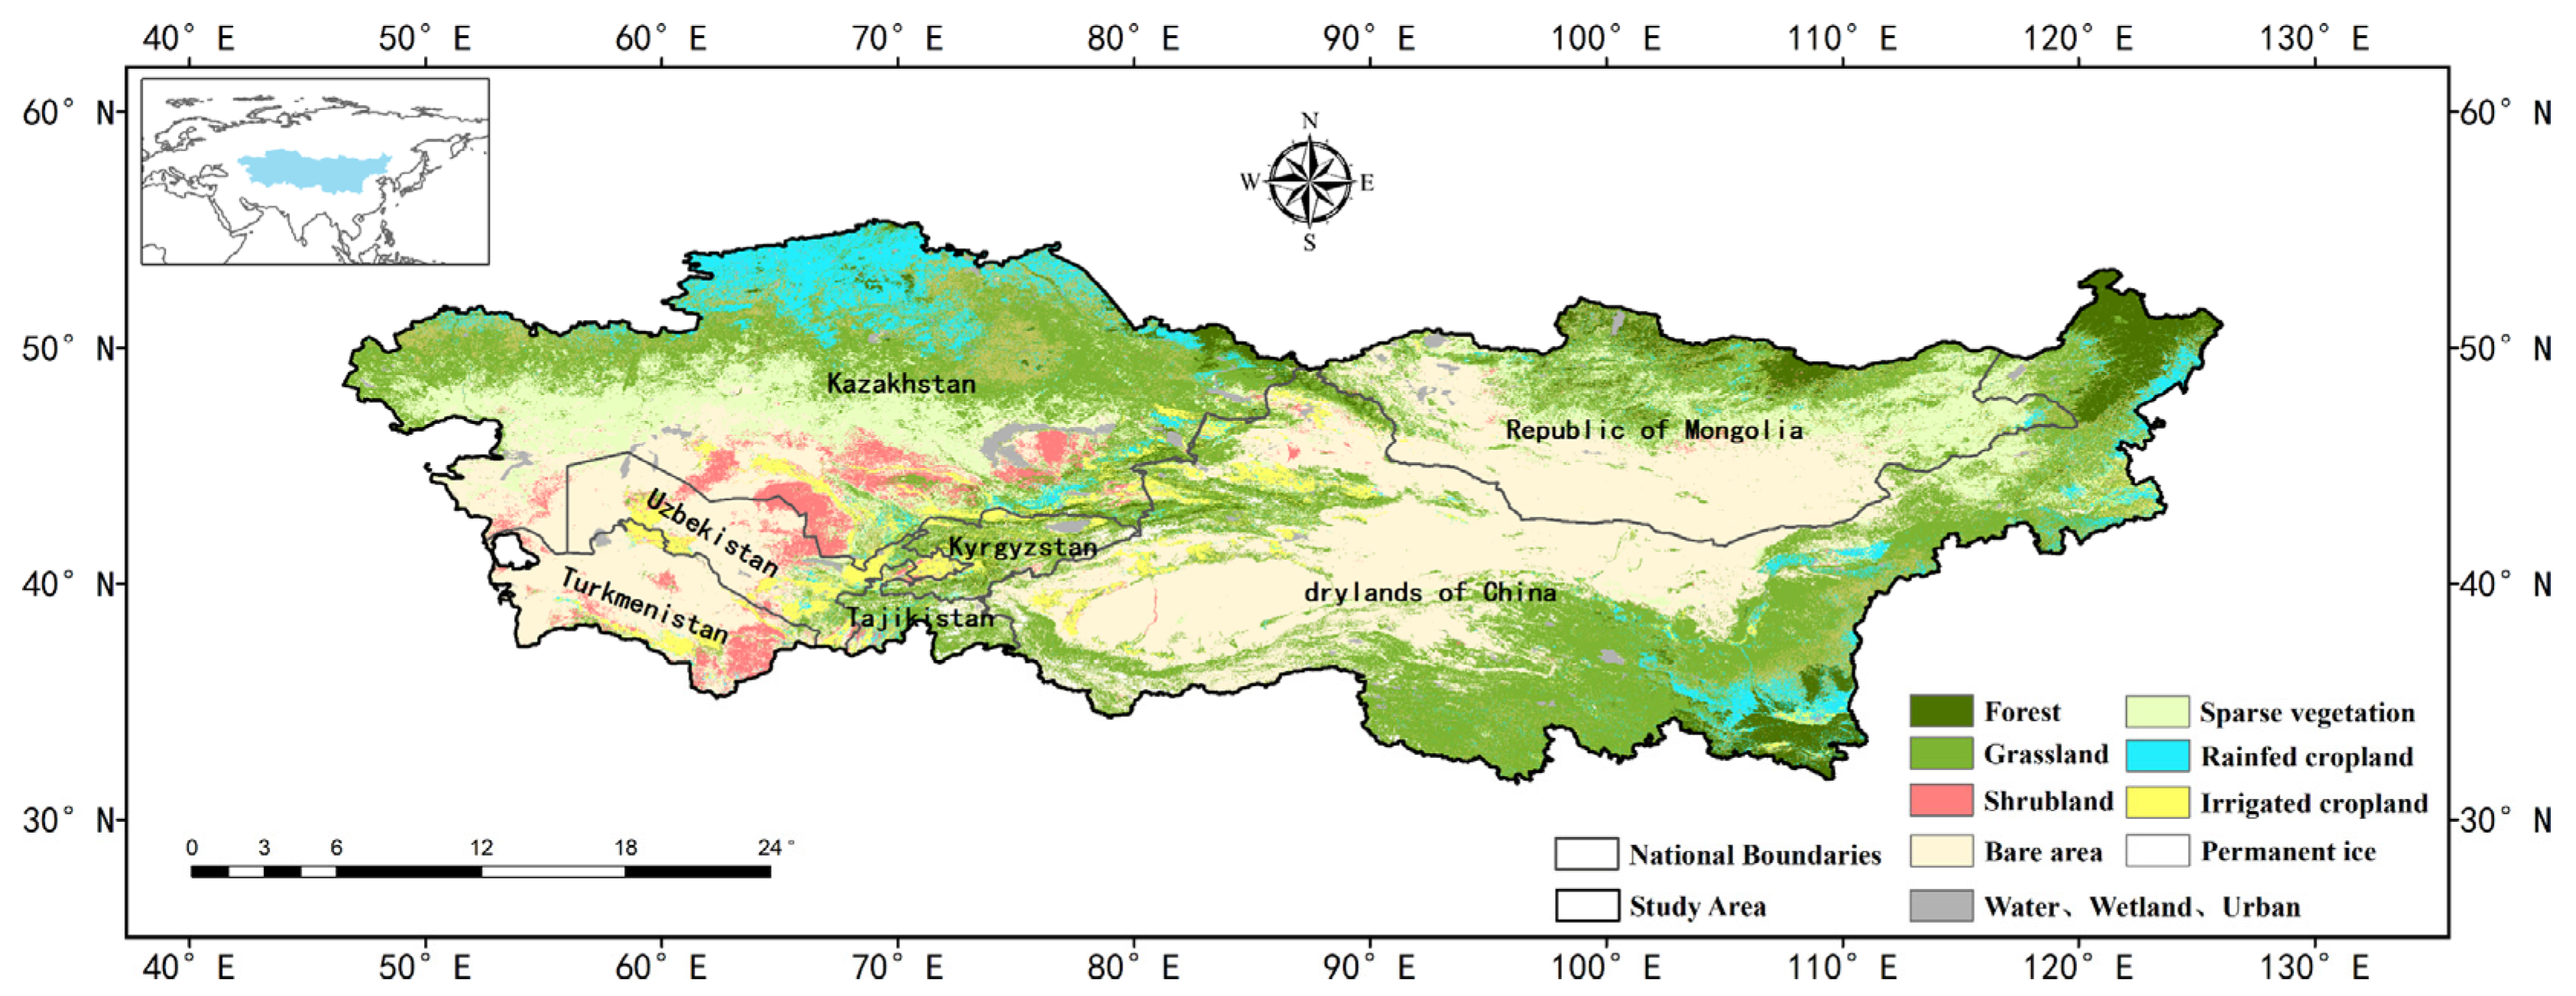
The Asian drylands consist of typical arid and semi-arid lands. Situated at 46–126° E (east to west) and 31–55° N (north to south), the drylands have an average elevation of 1269 m, and the total area stretches over 10.8 × 10 6 km2. The region includes the Pamir Plateau, the Tianshan Mountains, the Mongolian Plateau, and part of the Tibetan Plateau. The main vegetation cover types are forests, grasslands, sparse vegetation, agricultural land (rainfed and irrigated), and bare land in Figure 1 (Data from European Space Agency, https://www.esa.int/Applications/Observing_the_Earth/Space_for_our_climate (accessed on 1 November 2020)). Being deep inland and far from the sea, the Asian drylands have a typical semi-arid-to-arid climate with low relative humidity and scarcity of soil moisture. Based on Koppen Climate classification [29], the main climate classification is arid desert cold (Bwk), arid steppe cold (BSk), polar tundra (ET). The climate is dry, with low average annual precipitation (Figure S1) and strong evaporation [12].

Figure 1.
Spatial distribution of land cover types in Asian drylands. (Data from European Space Agency).
Due to climate change and increasing human activities, the arid zone of Central Asia is experiencing increasing water scarcity [5]. In particular, the region is facing enhanced seasonal droughts caused by reduced precipitation during the rainy season [30].
2.2. Data Resources
2.2.1. Observation-Based Data
The Climatic Research Unit (CRU) was developed at the University of East Anglia and contains data on precipitation, potential evapotranspiration, temperature, precipitation days, and so on. It has a long time series (up to more than a century) of site interpolation datasets at a resolution of 0.5° and good quality and homogeneity control [31]. The PET data in CRU are calculated based on the Penman–Monteith equation, which is considered the most accurate formula for calculating PET [4,32]. Recent CRU data have been widely used in research on Asian drylands [11,33]. However, it should be noted that the pre-1960 CRU dataset is not suitable for applications that require high data accuracy due to the relatively small amount of ground station data included prior to 1960 [33]. Therefore, in this study, we extracted precipitation and temperature data only for the period from 1960 to 2019 and with a spatial resolution of 0.5 × 0.5°.
2.2.2. CMIP6 Data
SSPs is the Experiment ID under CMIP6; the complete name is Shared Socioeconomic Pathways, which are a series of new "pathways" that an international team of climate scientists, economists, and energy system modelers has created to study how global societies, populations, and economies are likely to change over the next century. These SSPs are now being used as important inputs to the latest climate models to inform the Sixth Assessment Report of the Intergovernmental Panel on Climate Change (IPCC).
As shown in Table 1, we used the latest CMIP6 data for nine GCMs (ACCESS-CM2. ACCESS-ESM1-5, CanESM5, FIO-ESM-2-0, IPSL-CM6A-LR, MRI-ESM2-0, GFDL-ESM4, INM-CM5-0, and MIROC6) under three SSPs (SSP126, SSP245, SSP585), securing the first variant label “r1i1p1f1” (“r1i1p1f1” refers to the experiment label, r denotes realization index (set membership index), i denotes initialization index, p denotes physics index, and f denotes forcing index) [34]. In this work, basic calculation variables for SPEI-PM, including maximum temperature, minimum temperature, precipitation, wind speed, downward shortwave radiation, and relative humidity were downloaded. At the time of analysis (November 2020), only nine models were available. Specific information about the three future SSPs: SSP1-2.6 is a low radiative forcing SSP with low vulnerability and low mitigation challenges. Under this pathway, global average temperature results would be significantly lower than 2 °C relative to the pre-industrial revolution multi-modal ensemble average. SSP2-4.5 belongs to the medium radiative forcing SSP since the land use and aerosol pathways of SSP2 are not extreme and represent only a combination of a medium social vulnerability and medium radiative forcing SSP. SSP5-8.5 is a high forcing shared socio-economic pathway, with SSP5 being a prerequisite for achieving a pathway with emissions as high as 8.5 W/m2 by the year 2100. To maintain model consistent degree, we resampled all GCM data to 0.5° uniformly using bilinear interpolation before the data analysis.

Table 1.
Information of nine global climate models (GCMs).
2.3. Methods
2.3.1. Drought Assessment
We applied the SPEI to assess future drought conditions in the Asian drylands. The SPEI is based on precipitation (P) and potential evapotranspiration (PET), as proposed by Vicente-Serrano, and is able to reflect water deficit in a changing environment [35]. PET was originally calculated using the Thornthwaite evapotranspiration equation without considering solar and infrared radiation, humidity, and wind speed variations [36,37]. However, as the role of temperature was exaggerated in this approach [38,39], we instead employed the Penman–Monteith equation recommended by the Food and Agriculture Organization (FAO) of the United Nations to calculate PET [40]. This formulation incorporates the effects of thermal and dynamic factors such as temperature, solar and infrared radiation, humidity, and wind speed variations on evapotranspiration [4,37]. Referring to the most recent IPCC report in 2021 and Wang conducted in the Tarim River Basin (arid regions) [8,41], SPEI values on a 12-month time scale are used to characterize drought in the present study and are calculated as below. In this case, the PET is calculated using the FAO Penman–Monteith (PM) formula [42], which is given by:
where PET is potential evapotranspiration (mm), Rn is the net radiation (MJ m−2 d−1), G is the soil heat flux density (MJ m−2 d−1), T is the air temperature at 2 m height (°C), U2 is the wind speed at 2 m height (m s−1), es is the saturation vapor pressure (kPa), ea is the actual vapor pressure (kPa), ▽ is the slope vapor pressure curve (kPa °C −1), and γ is the psychrometric constant (kPa °C−1).
After obtaining PET data calculate SPEI: First, the difference between month-by-month precipitation and evapotranspiration is calculated using the formula:
where Pi and PETi are precipitation and potential evapotranspiration in month i (mm).
Based on the precipitation and PET from GCM data, the log-logistic probability distribution is then used to fit the difference between the two, and the SPEI value corresponding to each Di value is calculated. By applying the same distribution function parameters established for the historical period 1961–2014, the dry/wet condition of future SPEI can be assessed. When the cumulative probability P < 0.5, the SPEI is calculated as:
However, when P > 0.5,
where d1 = 1.432788, d2 = 0.189269, d3 = 0.001308, c0 = 2.551517, c1 = 0.802853, and c2 = 0.010328 [43].
2.3.2. Trend and Significance Detection
Sen’s slope estimation is a non-parametric slope estimation method [44]. This strategy allows for missing values in the data series and does not require the data to conform to a particular distribution. For time series values, Sen’s slope estimation calculates the rank of samples of different lengths to form a new series, obtains the range of slope values through statistical tests, and then uses the median of the slope series as the basis for trend estimation. This method can better eliminate the influence of outliers or missing values on the result estimation.
The Mann–Kendall (MK) significance test, developed by Mann and Kendall [45,46], is a non-parametric method for determining the significance of trends in sample time series. Since the MK trend analysis method is less sensitive to outliers, does not require the sample series to conform to a certain distribution, and allows for missing values, the non-parametric MK method is used for trend significance testing in climatological studies.
2.3.3. Determination of Drought Events
The run theory [47] can easily identify the characteristic values of drought events, such as the beginning, end, duration, intensity, etc. The identification of drought events is mainly based on the following three points: (1) the SPEI values are continuously less than 0; (2) the minimum SPEI value during the period is less than −1; and (3) the total duration is greater than or equal to three months [48]. The drought epoch D refers to the number of months in which the SPEI value is continuously less than 0. Drought intensity I is the cumulative sum of the difference between the SPEI value and 0 for each drought event; i is the month; and drought intensity I (for calculation convenience) is multiplied by −1 to turn it into a positive value, i.e.:
In this paper, mean drought duration, frequency, and intensity are measured by averaging the corresponding attributes for all individual drought events on each grid in the reference and future periods. By using the reference period of forty years (1961–2000), we give in our results the spatial distribution of Relative Mean Drought Duration (RMDD), Relative Mean Drought Frequency (RMDF), and Relative Mean Drought Intensity (RMDI) under three different SSPs.
3. Results
3.1. Comparison of GCM Simulated Data with Observed Data
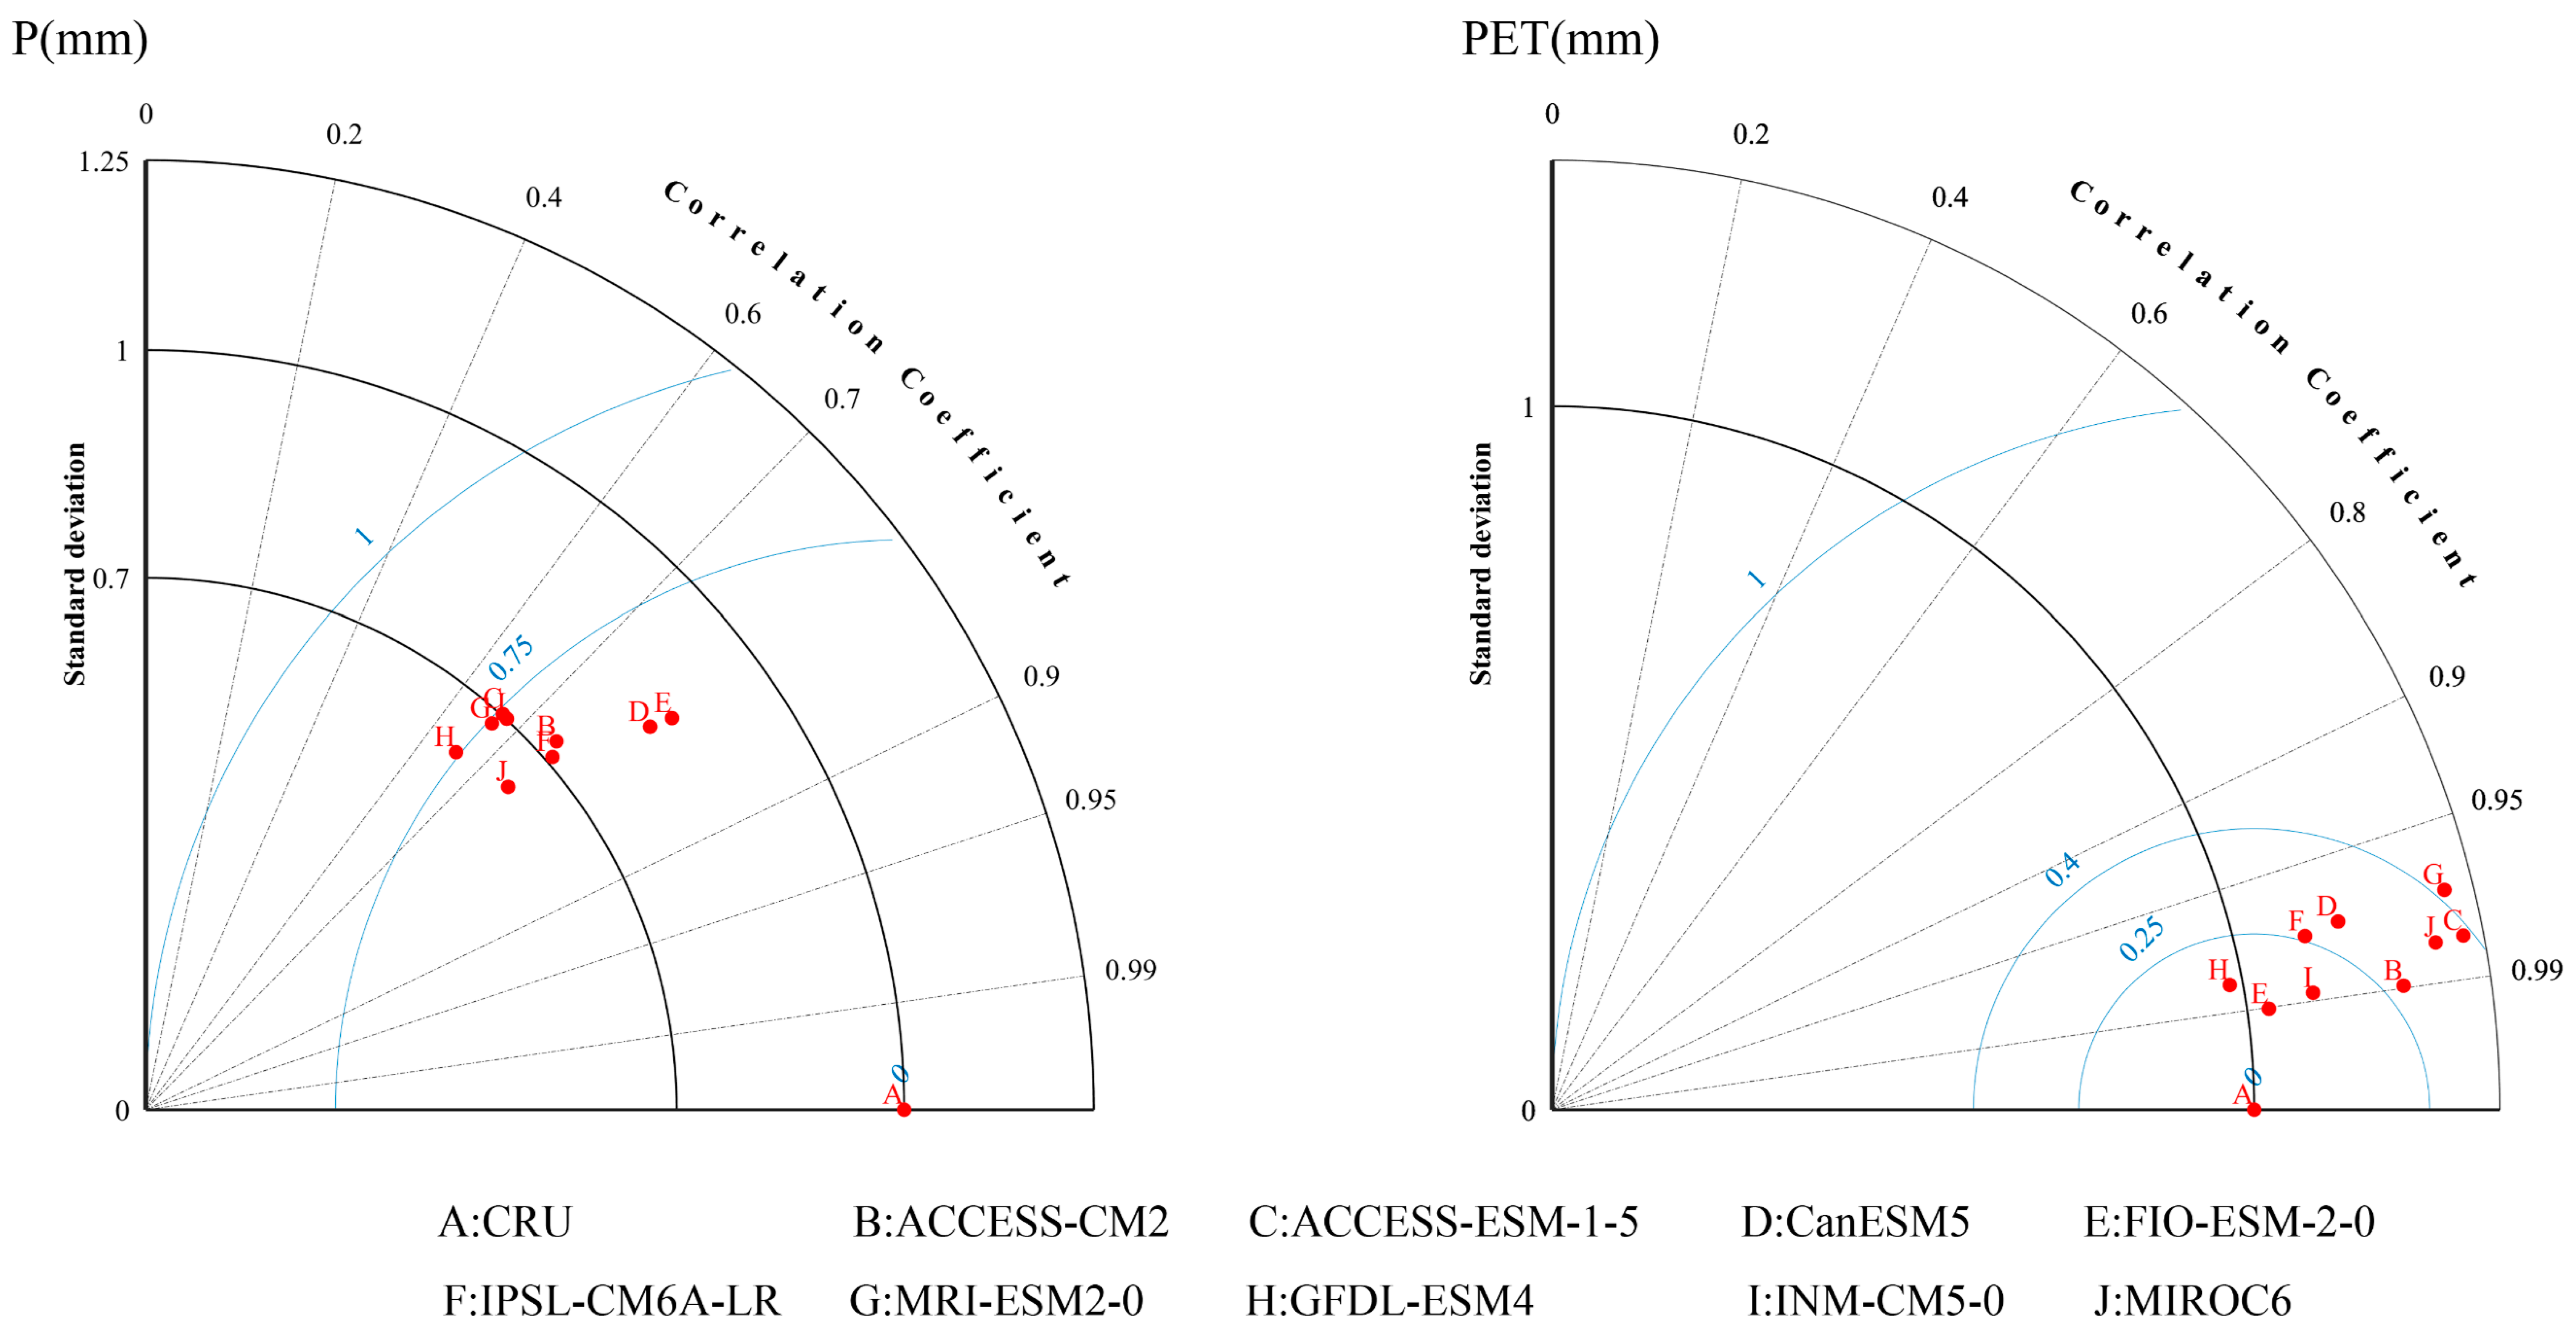
As shown in Figure 2 and Table 2, the simulation of precipitation (Precipitation) is not as effective as that for potential evapotranspiration. The correlation coefficients between GCM and measured data are distributed between 0.80 and 0.66, from high to low, with CanESM5 and FIO-ESM-2-0 at 0.80, and IPSL-CM6A-LR and MIROC6 at 0.75.
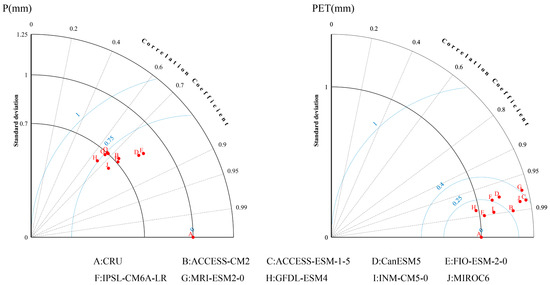
Figure 2.
Standardized Taylor diagram showing the model simulation capability of simulated values for nine GCMs from 1960–2014 for observational data of temperature, precipitation, and potential evapotranspiration. (The standard deviation in a Standardized Taylor diagram is the ratio of the standard deviation of the model to the standard deviation of the observations).
Table 2.
Information of Simulation Capability of precipitation (P) and potential evaporation (PET) by GCMs.
Regarding the ability to simulate the amplitude of precipitation, the standard deviation of GCM is overall generally small, with a standard deviation of less than 1. The simulation of precipitation amplitude is weak. In contrast, the standard deviation of GFDL-ESM4 is the smallest at 0.62.
Regarding the deviation between measured and GCM data, the root means square error values of the nine GCMs were distributed between 0.61 and 0.75, with the smallest deviation occurring in the IPSL-CM6A-LR model and the largest in the FIO-ESM-2-0 model.
The GCMs performed well for PET simulations, illustrating the accuracy of the Penman–Monteith formula for calculating PET. The correlation coefficients for all nine GCMs were greater than 0.97, with high correlations. The overall performance is good in terms of the ability to simulate the central amplitude, which can then better simulate the amplitude. Other than for GFDL-ESM4, which had a standard deviation of 0.98, the standard deviations of all the other GCMs were slightly greater than 1. Regarding the deviation between observations and GCMs, the root mean square error was less than 0.41 for all nine GCMs.
3.2. Future Trend Changes and Significance of SPEI
As illustrated in Figure 3, the results indicate that changes in wetness and dryness in the Asian drylands show an overall decreasing trend in the middle of the 2015–2100 period, with droughts intensifying over time. However, while drought shows a slight intensification in both the SSP126 and SSP245 scenarios, the intensification is much stronger in SSP585, particularly after the year 2060. In contrast, the first two scenarios level off, and the drought gap further widens. Therefore, in our analysis of the later drought event, we examine drought between 2021–2060 and 2061–2100 for two 40-year time periods. (SPEI values are averaged across the Asia drylands and are less than 0 due to the influence of large dry areas. We show the SPEI values for Central Asia (relatively wetter) and the Tarim River basin (relatively arid region) in Figure S2.
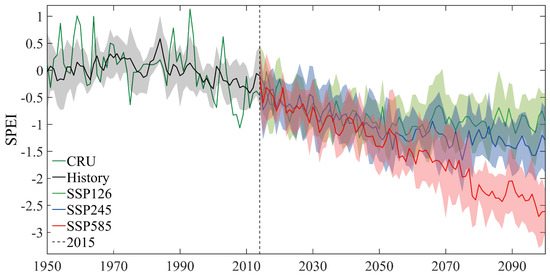
Figure 3.
Temporal evolution of SPEI on a 12-month scale for the drylands of Asia and three future paths, which are SSP126, SSP245, and SSP585 (Averaged for the whole region). The colored lines represent the SPEI by ensemble means of GCMs in 2015–2100 under SSPs. The shadow represents the range of multiple GCMs. The black dashed line indicates the year 2015, allowing for a better comparison between historical and future periods.
As shown in Figure 4, we analyzed the spatial distribution characteristics of drought change trends in the Asian drylands based on Sen’s slope of drought trends and the Mann–Kendall (MK) significance test, with a 0.05 significance level. Based on spatial distribution, the spatial pattern of drought future change trends under three different future SSPs (SSP126, SSP245, and SSP585) is generally consistent. Central Asia and East Asia form the main focal points of drought intensification. In Central Asia, the center of drought is located in southwest Kazakhstan and Turkmenistan as well as in west-central Turkmenistan, while in East Asia, the center of drought is located in Xinjiang, western Inner Mongolia, and southwest Mongolia, which are all in China. The drought intensification area is mostly bare land. Owing to enhanced emission pathways, the decreases in precipitation and increases in PET across the drylands have led to the expansion of the drought intensification zones. This ongoing event seriously threatens the grassland and scrub in the surrounding region and increases the ecological vulnerability of an area already characterized by low humidity and limited productivity.
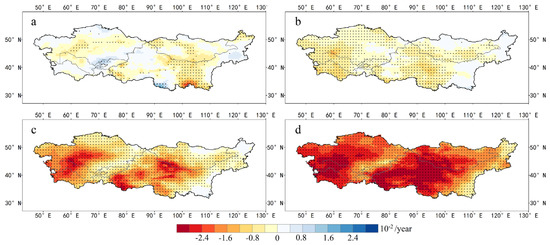
Figure 4.
Spatial distribution of estimated Sen’s slope of monthly SPEI values for (a) the historical period and the three future paths of (b) SSP126, (c) SSP245, and (d) SSP585 in the drylands of Asia. The dot in the figure indicates that the region exceeds the Mann–Kendall significance test (0.05).
However, under the low scenario (SSP126), the magnitude of change is smaller and the stability of change lower than the general trend. Additionally, the percentage of land area that surpassed the 0.05 significance test and thus indicated drought intensification was 65.1%. In contrast, under the high scenario (SSP585), the magnitude of change is large, and the intensified drought trend covers the entire Asian drylands, with a dramatic intensification trend in the central region. In this scenario, 100% of the land area surpassed the 0.05 significance test. This fully illustrates not only that the Asian drylands will be exposed to drought risk in the future but that it is critically important to control global warming by reducing GHG emissions. When the lower emission SSP was compared with the medium emission SSP scenario (SSP245), 89.9% of the land in the Asian drylands under the SSP245 scenario showed an increase in drought and surpassed the 0.05 significance test.
In terms of trend values, the regional values of Sen for SSP126, SSP245, and SSP585 were 4.8 × 10⁻³/month, 11.4 × 10⁻³/month, and 23.6 × 10⁻³/month, respectively. The increases were roughly exponential, which further demonstrates the need to control GHG emissions. However, even with lower emissions, droughts are expected to occur in most regions, especially in the two drought centers of Northwest China and Mongolia region (NCM) and Central Asia region (CA). Notably, important agricultural production areas in northern Kazakhstan and Shaanxi, China, are also at risk of increased drought under the SSP585 scenario, threatening water and food security in those regions. Additionally, we have analyzed Sen’s trend values for the different land cover types in Figure S3.
3.3. Drought Event Characteristics Prediction
To study the characteristics of future drought events and quantify the development of future droughts, this paper combines the historical period of 1960–2000 with the SPEI values of two future time periods (2021–2060 and 2061–2100). We then apply the tour theory to extract drought events and describe their basic characteristics, including Drought Frequency (Drought Frequency), Mean Drought Duration (Mean Drought Frequency), Mean Drought Duration (Mean Drought Intensity), and Mean Drought Intensity (Mean Drought Intensity). The differences in multi-year drought characteristics between the two time periods were also calculated to analyze how the drought characteristics between the two periods differed, as expressed as relative mean drought duration (RMDD), relative annual drought frequency (RADF), and relative mean drought intensity (RMDI).
3.3.1. Drought Duration
Relative to the historical period, the spatial pattern of drought event duration for the two different study periods and three future SSPs are shown in Figure 5. As can be seen, the high emission SSP (SSP585) clearly and consistently shows the longest drought duration for both time periods. In contrast, the differences in the magnitudes of drought duration under the SSP126 and SSP245 emission scenarios are more subtle. Temporally, the difference in the spatial pattern of drought duration in the first four decades (2021–2060) is only slight, while the difference in drought duration in the next four decades (2061–2100) is further widened under different pathways. In this time frame scenario, grasslands and forests around the bare land will also be at risk of increasing drought duration due to disruptions in the original ecosystem balance.
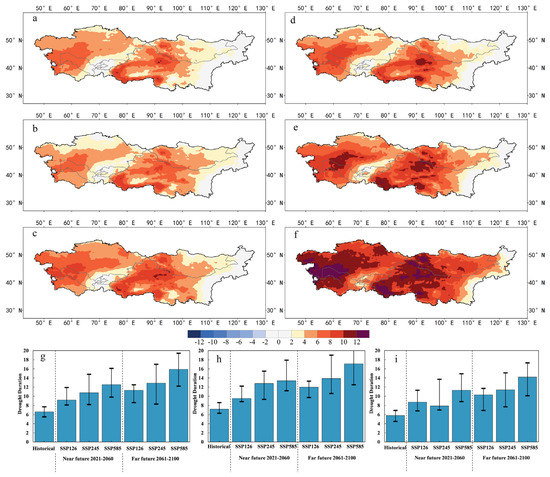
Figure 5.
Spatial distribution of Asian dryland RMDD for the 2021–2060 (a,b,c) and 2061–2100 (c,d,f) cycles under SSP126 (a,d), SSP245 (b,e), and SSP585 (c,f) scenarios, relative to the 1961–2000 reference cycle. Changes in drought duration for 2021–2100 as identified by the SPEI drought index. Drought duration changes in Asian drylands for 2021–2060 and 2061–2100 under SSP126, SSP245, and SSP585 scenarios (g). Two regions (i) in northwest China and Mongolia (h) in the five Central Asian countries are delineated. The bar graphs and black vertical lines indicate the mean and range of multiple GCM projections.
In terms of drought duration data, droughts are expected to last longer for all SSP scenarios, with drought durations of 6.6, 10.8, and 13.4 months for the three study periods (1961–2000, 2021–2060, and 2061–2100), respectively. In other words, the drought duration of the far future would be twice the length of the reference period.
Based on the results of the previous trend analysis, we spatially divided the study area into the sub-regions of northwest China and Mongolia region and Central Asia region, finding that drought duration was generally longer in the former than in the latter sub-region. Specifically, the duration of drought was 7.2 months, 11.9 months, and 14.3 months in Central/Mongolia for the three mentioned study periods, respectively, compared with 5.8 months, 9.3 months, and 12 months in Central Asia. It is noteworthy that the duration of drought in Central Asia for the near future is higher under SSP126 than under SSP245. It should be emphasized that drought events of a longer duration are expected to be particularly prominent in the Asian drylands during 2061–2100, especially in the already arid regions.
3.3.2. Drought Frequency
In this study, drought frequencies were calculated for each grid for the reference and future periods. Relative to the reference period, changes in spatial patterns of drought frequency are expected to be concentrated in southwestern and northern Central Asia and in western parts of northwestern China and Mongolia under different periods and scenarios (see Figure 6). The drought frequency mainly shows a decreasing trend, which, combined with the changes in drought duration above, suggests that drought events in these regions will be transformed or combined into longer-lasting, long-term drought events under the influence of global warming. From the data statistics, the average drought frequencies for all future Asian dryland regions are about 18 and 15.8 (average of all scenarios), respectively, which are lower than the reference cycle of 19.2 for the two future periods of near-future and far-future. Therefore, the frequency of future drought events will be lower relative to that within the reference period.
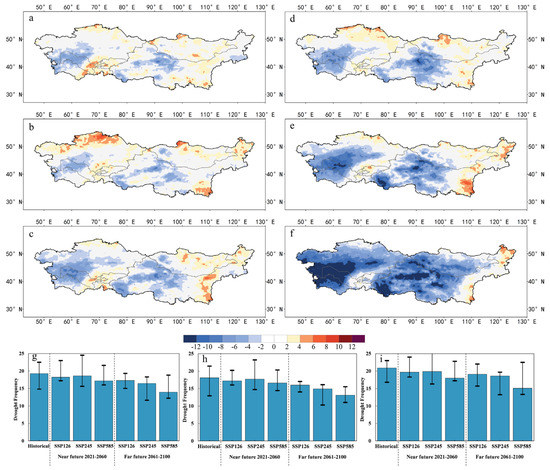
Figure 6.
Spatial distribution of Asian dryland RADF for the cycles 2021–2060 (a,b,c) and 2061–2100 (c,d,f) under the SSP126 (a,d), SSP245 (b,e) and SSP585 (c,f) scenarios, relative to the 1961–2000 reference cycle. Changes in drought frequency as identified by the SPEI drought index for 2021–2100. Drought frequency changes (g) in the drylands of Asia for 2021–2060 and 2061–2100 under the SSP126, SSP245, and SSP585 scenarios. Two regions (i) in northwest China and Mongolia and (h) in the five Central Asian countries are delineated. The bar graphs and black vertical lines indicate the mean and range of multiple GCM projections.
The average frequency of drought events in the five Central Asian countries is 19.2 and 17.6, respectively. The frequency of long-term drought events in this sub-region will decrease during 2021–2060 and 2061–2100, while the duration and intensity of drought events will increase. This shift in intensity indicates that drought events in the arid zone will become stronger.
As in Central Asia, the changes in drought frequency in northwest China and Mongolia also show a decreasing trend of 17.1 and 14.6 events, respectively, for the time periods 2021–2060 and 2081–2100. However, the frequency of droughts in China and Mongolia is lower than that in Central Asia, while the duration of droughts in the above analysis is higher in China and Mongolia than in Central Asia. These changes indicate that drought events in China and Mongolia are dominated by long-term droughts.
In terms of comparing SSPs for emission effects, drought frequency reduction corresponds to the high emission SSP585 scenario, which is quite similar to SSP126 and SSP245 during 2021–2060. Drought frequencies are 18.2, 18.6, and 17.1 for the three pathways in numerical order. This relationship is even more obvious during 2061–2100, showing frequencies of 17.2, 16.4, and 13.9 times, respectively. Combined with the above analysis of drought ephemeris, this further indicates that drought in the study area will transform into a long-term event under the high SSP.
3.3.3. Drought Intensity
Drought intensity was calculated by computing the average intensity of all drought events on each grid during the reference and two future periods. Figure 7 shows the absolute change in drought intensity between these time frames.
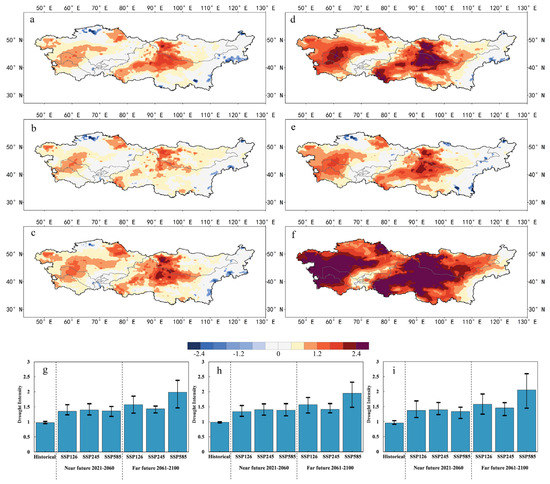
Figure 7.
Spatial distribution of Asian dryland (RMDI) for the two cycles of 2021–2060 (a,b,c) and 2061–2100 (c,d,f) under SSP126 (a,d), SSP245 (b,e), and SSP585 (c,f) scenarios, relative to the 1961–2000 reference cycle. Changes in drought intensity as identified by the SPEI drought index for 2021–2100. Drought intensity changes (g) in drylands of Asia for 2021–2060 and 2061–2100 under SSP126, SSP245, and SSP585 scenarios. Two regions (i) in northwest China and Mongolia (h) in the five Central Asian countries are delineated. The bar graphs and black vertical lines indicate the mean and range of multiple GCM projections.
Relative to the reference period, all bare land and steppe forest areas in the study area exhibit an increase in drought intensity in all SSP scenarios and future periods. The spatial distribution map shows that the increase in drought intensity is greater in the southwestern region of Central Asia, the Xinjiang region of China, and the southwestern region of Mongolia. The drought intensity of grassland and desert is also increasing with the emissions pathway; combined with the above analysis for drought duration and drought frequency, these regions will face the threat of drought deterioration in the future. Drought intensity and spatial distribution patterns will be very similar in the three climate scenarios from 2021 to 2060. There is also a noteworthy phenomenon during 2061–2100. Namely, the drought intensity under the SSP245 scenario will not be as severe as that under the SSP126 scenario, which may be related to the mitigation effect of the increased precipitation predicted by SSP245.
During the reference period, the average drought event intensity is estimated to be 0.97 for the study area. However, according to the model, severe droughts are expected to occur in the future, such that in 2021–2060 and 2061–2100, the intensity is expected to be 1.37 and 1.66 (average of all SSPs), respectively. Drought intensity in Central Asia and Central Mongolia both show a worsening of drought, with similar values in these two sub-regions. In addition, in terms of changes in intensity levels under climate scenarios, the projections show that more severe droughts have a higher likelihood of occurring in the region under higher emission scenarios. This is especially valid for the far future when the drought intensity reaches 1.98 under the SSP585 emission scenario, which is close to extreme drought.
4. Discussion
4.1. Asian Drylands at Greater Risk
CMIP5 projections provide some of the most comprehensive information on how drought will respond to climate change, but it is also important to reassess the state of knowledge as new datasets and research tools become available [3]. We estimated drought duration, frequency, and intensity in the Asian drylands for the future period 2021–2100 based on data from three SSPs under the newly released CMIP6, using the SPEI index with FAO’s Penman–Monteith (PM) formula. The results indicate that the Asian drylands are at extreme risk of drought, with small drought events merging into longer ones. As well, there will be more intense drought events resulting in increased drought duration, decreased drought frequency, and increased drought intensity.
Previous studies have shown that the warming trend is twice as high in drylands compared to wetter regions [1]. Regional hotspots of intense global dryness include western North America, Central America, Europe and the Mediterranean, southern Amazon, Africa, China, Southeast Asia, and Australia. Based on current trajectories, drylands are expected to cover half of the earth’s land surface by the end of the century [1,20], with extreme drought land area more than doubling [49]. At the same time, land degradation and desertification on a global scale are expected to occur [50], which aligns with our results. Furthermore, socio-economic development in Asian drylands is strongly affected by drought. According to the International Disaster Database [51], although the frequency of drought in Asia accounts for only 3% of the total frequency of disasters, drought caused 9.66 million deaths and affected more than 2.1 billion people during 1900–2021. In addition, under future climate change scenarios, controlling temperature increase to 1.5 °C could reduce drought losses in China by tens of billions of dollars per year compared to warming of 2.0 °C [52]. Therefore, based on analysis of the latest dataset, Asia faces a greater threat of drought in future global warming scenarios and thus should be given ongoing analytical attention.
4.2. Why SSP126 Drought Intensity Exceeds That of SSP245
Climate change will increase the risk and severity of drought. Under the expectation of continued global warming, previous analyses have shown that the Asian drylands are more sensitive to climate change compared to the global average and that this region will experience more severe drought threats [12,53]. Furthermore, our analysis shows that drought conditions in the Asian drylands will intensify, with the percentage of land area exhibiting significantly increased drought being 65.1%, 89.9%, and 99.8% under the SSP126, SSP245, and SSP585 shared socio-economic pathways, respectively. The worsening of drought is closely related to the imbalance of local and regional water cycles, which is influenced by many complex processes (e.g., precipitation, evapotranspiration, runoff, and plant physiological responses). Among these influences, evapotranspiration is an important process of the water cycle that determines drought.
Increasing surface temperatures lead to an increased allocation of terrestrial precipitation to evapotranspiration rather than to runoff [54], a phenomenon that is highly applicable to drought variability in the Asian drylands. We used the Penman–Monteith equation to integrate the effects of thermal and dynamic factors such as temperature, solar and infrared radiation, humidity, and wind speed changes on evapotranspiration [4,37]. Our results indicate that elevated evapotranspiration brings worsening drought and that entire grassland and forest ecosystems in the Asian drylands are expected to be at risk of drought, including those located in northwest China and northern Kazakhstan.
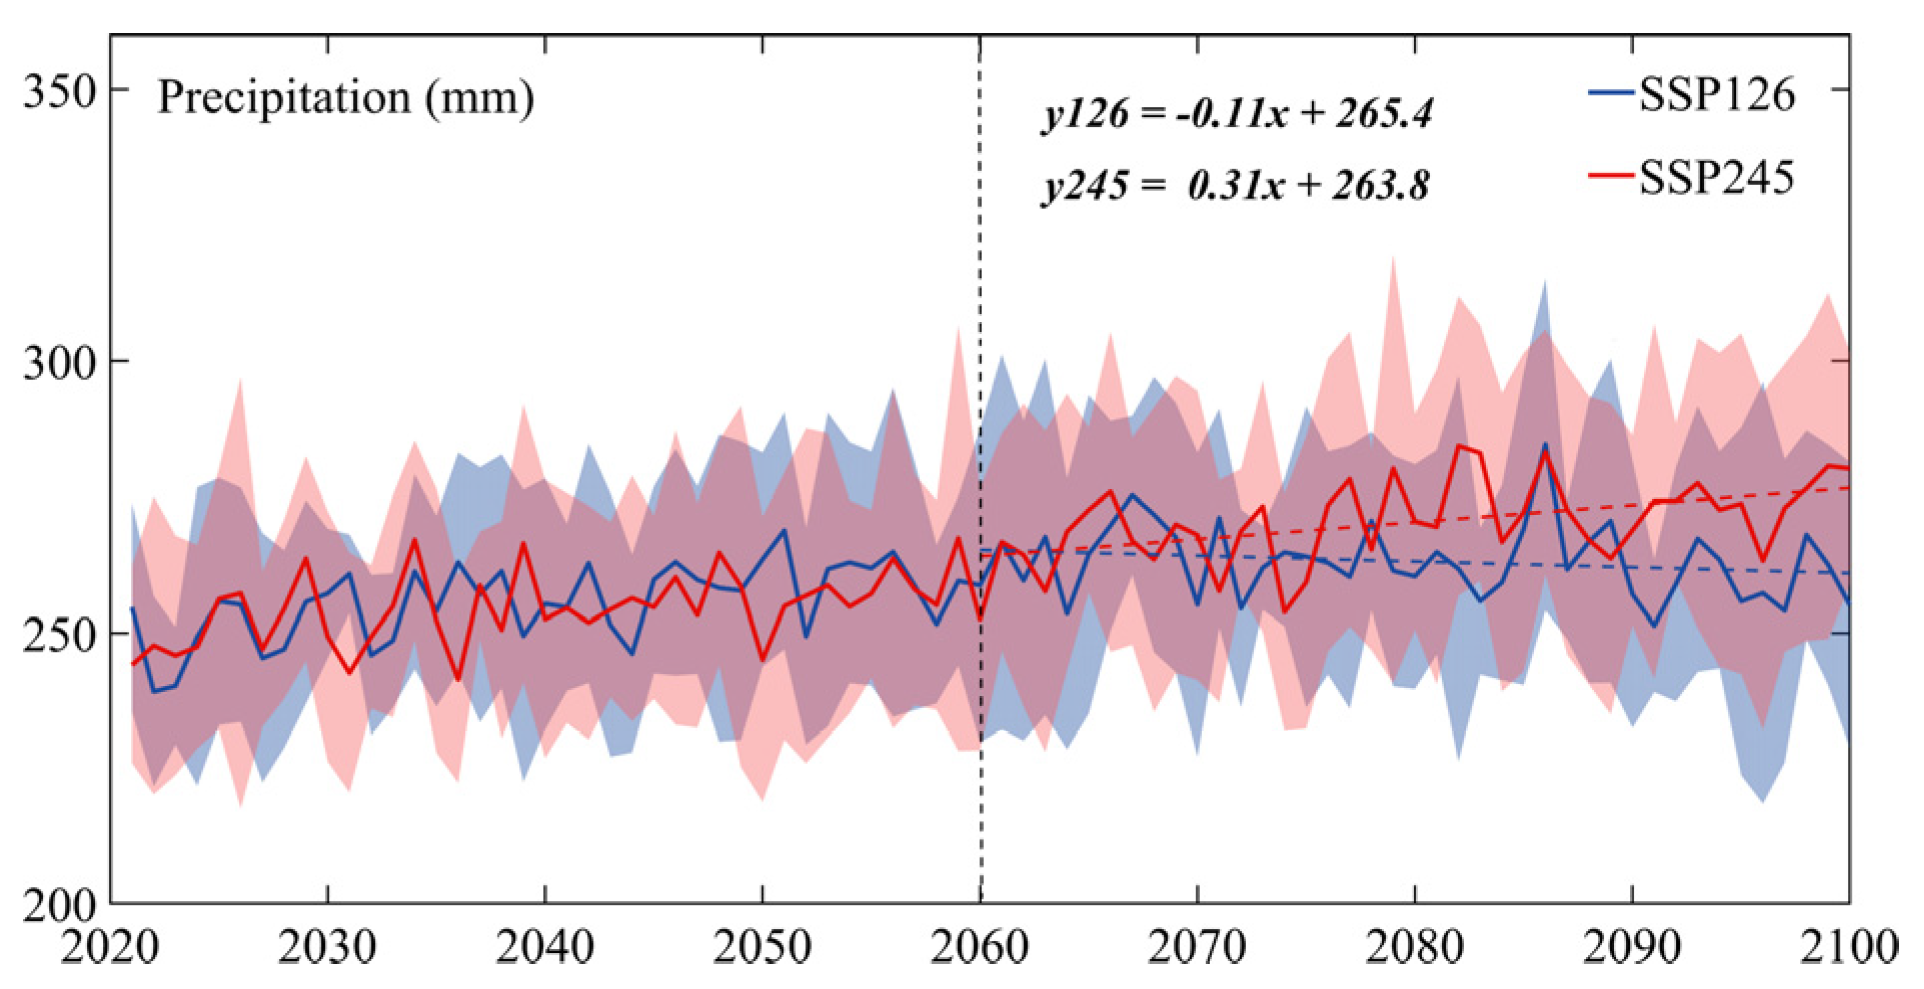
As shown in Figure 7, the study results in Section 3.3.3 indicate that the drought intensity of SSP245 is lower compared to that of SSP126. The explanation for this puzzling phenomenon is that evapotranspiration and precipitation are important processes in the water cycle that determine drought. We found that when global warming accelerates, evapotranspiration increases, and drought conditions worsen under both the SSP126 and SSP245 scenarios. According to our previous studies, wind speed and Vapor Pressure Deficit (VPD) are the main reasons for increased evapotranspiration [55]. In contrast, as shown in Figure 8 and Figure S4, when we analyzed precipitation, we found that during 2061–2100, precipitation under the SSP126 showed a weak decreasing trend, while under the SSP245, precipitation showed an increasing trend. At the same time, the difference in precipitation between the two pathways was increasing. For SSP245, the rise in precipitation alleviated the severe drought situation, whereas, for SSP126, the decrease in precipitation led to drought-enhanced deterioration. Hence, drought intensity under SSP126 is more severe than that under SSP245.
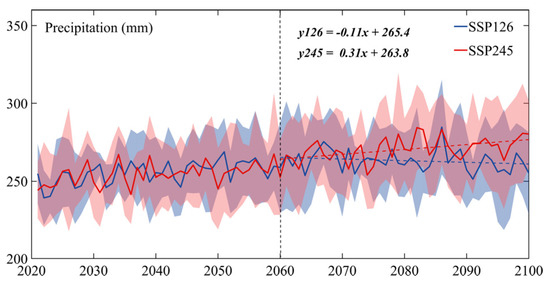
Figure 8.
Temporal evolution of precipitation in the drylands of Asia over the two future paths of SSP126 and SSP245. Colored lines represent the mean precipitation ensemble for GCMs 2021–2100 under SSP. Shading represents the range of multiple GCMs. Colored dashed lines indicate trend lines to better compare trend changes in precipitation.
4.3. Addressing Future Drought Risks across Geographical Boundaries
In this study, we note that future drought intensity is highest in northwest China and western Uzbekistan and Kazakhstan. This is related to the specific local geography of these areas, which has a typical semi-arid-to-arid climate with low relative humidity and soil moisture scarcity due to being deeply inland and far from the ocean [56]. The climate is dry and features low average annual precipitation and strong evaporation [57]. Furthermore, annual precipitation variability in Kazakhstan may be significantly affected by large-scale oscillations, which will impact future droughts in the region [58]. In the comparison of regional differences between Northwest China and Mongolia region (NCM) and Central Asia region (CA), we find that drought is more severe in NCM than in CA, with longer and more intensive drought events, while the more intense droughts in NCM are concentrated in the Xinjiang region of China and southwest Mongolia. Whereas the frequency of droughts in these regions shows a decreasing trend, the changing properties of drought events suggest that there is a move towards a convergence of small drought events into longer and more intense droughts in these regions and that this expected change will pose a potential challenge to the ecology of these areas of the oasis. The drought in the surrounding forest and grassland will also deteriorate under SSP585, with agricultural production areas, in particular, being threatened by drought. In addition, our previous research has indicated that the rapid expansion of irrigated areas and overuse of water resources has become endemic in the five Central Asian countries due to large-scale production [12]. These human activities will further worsen the regional drought situation. Increasing droughts, intensifying climate warming, and rapid population growth will exacerbate the risk of land degradation and desertification, especially in the seven developing nations that comprise the Asian drylands.
Although dryland environmental problems span countries and regions, current management varies from country to country. For example, the sand and dust storm problem that exists between China and Inner Mongolia requires China’s ecological management, even though Inner Mongolia suffers the worst effects of the storms. This paper argues that adopting a regional rather than a national approach to environmental issues pertaining to the Asian drylands is a more effective way to mitigate cross-boundary effects while at the same time constructing sustainable development models that benefit all of dryland Asia.
In addition, any aspect involving the prediction of climate change and associated risks (i.e., drought) needs to consider and limit uncertainty. Uncertainty can be transferred from shared socio-economic pathways to hydrological cycle processes and then to regional drought risk [59]. Our uncertainty in this study can be classified as cognitive or contingent. The former is the result of lack of knowledge and can be reduced by incorporating more climate models or improving climate models, while the latter is related to the intrinsic stochasticity of the phenomenon and therefore is not possible to reduce. Compared to CMIP5, future droughts are more variable, more consistent in CMIP6, and have a reduced range of uncertainty [28]. Thanks in large part to improved physical processes, CMIP6 climate models appear to have less uncertainty and are more robust in predicting climate and drought variables. Finally, refinement of drought analysis is widely opened for future scholars by especially considering the future changes in the drought characteristics of the different land types across different regions and the seasons and months of drought occurrence.
5. Conclusions
We investigated drought trends in the Asian drylands under the shared socio-economic pathways of SSP126, SSP245, and SSP585 for two future time periods. The duration, frequency, and intensity of the drought events were evaluated based on predicted SPEI changes, and the ability of the CMIP6 data to simulate historical precipitation with potential evapotranspiration was assessed. The study data showed that GCM has an excellent ability to simulate PET in historical periods, simulating mean correlation coefficients up to 0.98, mean Centered Root Mean Square Differences of 0.28, and mean Standard Deviation of 1.16. The percentage of land area showing a significant trend of increasing drought under the three shared socio-economic paths is 65.1%, 89.9%, and 99.8%, respectively, with more severe future drought conditions in northwest China and western Uzbekistan, and Kazakhstan.
Our investigation of long-term changes in the characteristics of drought events indicates that droughts in the Asian drylands will become less frequent, longer in duration, and more intense. For the historical (1960–2000), near future (2021–2060), and far future (2061–2100) periods, drought duration was 6.6 months, 10.8 months, and 13.4 months, respectively, and drought frequency was 19.2, 18, and 15.8 times, respectively. This is expected to be transformed or combined into longer-duration long-term drought events under the influence of global warming. In addition, drought intensity increased from 0.97 in the historical period to 1.37 in the near future and 1.66 in the far future, even reaching 1.98 under SSP585. Such a high measurement indicates extreme drought. It is worth noting that the drought condition under SSP245 is better than that under SSP126 for the 2061–2100 period due to an increase in precipitation mitigating the drought condition.
Global warming will affect the water cycle processes in the Asian drylands, exacerbate the area’s current regional water conflicts, and contribute to the occurrence of dust storms. The ongoing and worsening disruption of the balance of forest and grassland ecosystems in the region will also adversely affect local agricultural production. Therefore, it is imperative to “integrate climate change adaptation and disaster risk reduction” among countries and encourage greater transnational cooperation.
Supplementary Materials
The following are available online at https://www.mdpi.com/article/10.3390/rs13214409/s1, Figure S1: Spatial distribution of annual mean annual (1960–2019) precipitation (Data from CRU), Figure S2: Changes of the SPEI in the Central Asia and Tarim River Basin, Figure S3: Sen’s slope for different land cover types for five periods: historical (1960–2019), near future (2021–2060), far future (2061–2100). The land cover data selected from the most frequently occurring land cover types during 1992–2015. (data from European Space Agency), Figure S4: Spatial distribution of annual precipitation for the period 2061–2100 anomalies relative to historical period.
Author Contributions
Conceptualization, Z.L. and Y.C.; funding acquisition, Z.L. and Y.C.; data curation, H.L.; methodology, H.L., Y.H.; software, H.L., Y.L.; formal analysis, H.L.; investigation, H.L. and Z.L.; project administration, Z.L.; resources, Z.L.; validation, F.S.; writing—original draft, H.L. and P.M.K.; writing—review and editing, Y.C. and Z.L. All authors have read and agreed to the published version of the manuscript.
Funding
The research is supported by the National Natural Science Foundation of China (U2003302) and the Natural Science Foundation for Xinjiang Uygur Autonomous Region (2021D01E02). The authors gratefully acknowledge the Youth Innovation Promotion Association of the Chinese Academy of Sciences (No. 2018480).
Institutional Review Board Statement
Not applicable.
Informed Consent Statement
Not applicable.
Data Availability Statement
The data presented in this study are available on request from the corresponding author.
Acknowledgments
We thank Coupled Model Intercomparison Project Phase 6 (CMIP6) for provided the data, data were downloaded from the World Climate Research Programme (WCRP) Earth System Grid Federation (ESGF) website: https://esgf-node.llnl.gov/ (accessed on 23 September 2021).
Conflicts of Interest
The authors declare no conflict of interest.
References
- Huang, J.; Yu, H.; Guan, X.; Wang, G.; Guo, R. Accelerated dryland expansion under climate change. Nat. Clim. Chang. 2016, 6, 166–171. [Google Scholar] [CrossRef]
- Huang, J.; Yu, H.; Dai, A.; Wei, Y.; Kang, L. Drylands face potential threat under 2 °C global warming target. Nat. Clim. Chang. 2017, 7, 417–422. [Google Scholar] [CrossRef]
- Miao, L.; Li, S.; Zhang, F.; Chen, T.; Shan, Y.; Zhang, Y. Future Drought in the Dry Lands of Asia Under the 1.5 and 2.0 °C Warming Scenarios. Earth’s Futur. 2020, 8, e2019EF001337. [Google Scholar] [CrossRef]
- Trenberth, K.E.; Dai, A.; Van Der Schrier, G.; Jones, P.D.; Barichivich, J.; Briffa, K.R.; Sheffield, J. Global warming and changes in drought. Nat. Clim. Chang. 2014, 4, 17–22. [Google Scholar] [CrossRef]
- Wang, X.; Chen, Y.; Li, Z.; Fang, G.; Wang, Y. Development and utilization of water resources and assessment of water security in Central Asia. Agric. Water Manag. 2020, 240, 106297. [Google Scholar] [CrossRef]
- Jiang, L.; Jiapaer, G.; Bao, A.; Guo, H.; Ndayisaba, F. Science of the Total Environment Vegetation dynamics and responses to climate change and human activities in Central Asia. Sci. Total Environ. 2017, 599–600, 967–980. [Google Scholar] [CrossRef]
- Guo, H.; Bao, A.; Ndayisaba, F.; Liu, T.; Kurban, A.; Maeyer, P.D. Systematical Evaluation of Satellite Precipitation Estimates over Central Asia Using an Improved Error-Component Procedure. J. Geophys. Res. Atmos. 2017, 122, 10906–10927. [Google Scholar] [CrossRef]
- AR6 Climate Change 2021: The Physical Science Basis—IPCC. Available online: https://www.ipcc.ch/report/sixth-assessment-report-working-group-i/ (accessed on 14 October 2021).
- IPCC Climate change 2014: Impacts, Adaptation, and Vulnerability. Part A: Global and Sectoral Aspects. Contribution of Working Group II to the Fifth Assessment Report of the Intergovernmental Panel on Climate Change; 2014; ISBN 9781107641655. Available online: https://www.ipcc.ch/report/ar5/wg2/ (accessed on 23 September 2021).
- Patrick, E. Drought Characteristics and Management in Central Asia and Turkey; 2017; ISBN 9789251096048. Available online: https://www.fao.org/policy-support/tools-and-publications/resources-details/en/c/897235/ (accessed on 23 September 2021).
- Li, Z.; Chen, Y.; Li, W.; Deng, H.; Fang, G. Potential impacts of climate change on vegetation dynamics in Central Asia. J. Geophys. Res. 2015, 120, 12345–12356. [Google Scholar] [CrossRef]
- Li, Z.; Fang, G.; Chen, Y.; Duan, W.; Mukanov, Y. Agricultural water demands in Central Asia under 1.5 °C and 2.0 °C global warming. Agric. Water Manag. 2020, 231, 106020. [Google Scholar] [CrossRef]
- Ji, F.; Wu, Z.; Huang, J.; Chassignet, E.P. Evolution of land surface air temperature trend. Nat. Clim. Chang. 2014, 4, 462–466. [Google Scholar] [CrossRef]
- Wang, J.; Brown, D.G.; Agrawal, A. Climate adaptation, local institutions, and rural livelihoods: A comparative study of herder communities in Mongolia and Inner Mongolia, China. Glob. Environ. Chang. 2013, 23, 1673–1683. [Google Scholar] [CrossRef]
- Kirono, D.G.C.; Round, V.; Heady, C.; Chiew, F.H.S.; Osbrough, S. Drought projections for Australia: Updated results and analysis of model simulations. Weather Clim. Extrem. 2020, 30, 100280. [Google Scholar] [CrossRef]
- Ma, F.; Yuan, X.; Jiao, Y.; Ji, P. Unprecedented Europe Heat in June–July 2019: Risk in the Historical and Future Context. Geophys. Res. Lett. 2020, 47, 1–10. [Google Scholar] [CrossRef]
- Cook, B.I.; Smerdon, J.E.; Seager, R.; Coats, S. Global warming and 21st century drying. Clim. Dyn. 2014, 43, 2607–2627. [Google Scholar] [CrossRef]
- Shrestha, A.; Rahaman, M.M.; Kalra, A.; Jogineedi, R.; Maheshwari, P. Climatological Drought Forecasting Using Bias Corrected CMIP6 Climate Data: A Case Study for India. Forecasting 2020, 2, 59–84. [Google Scholar] [CrossRef]
- The CMIP6 landscape. Nat. Clim. Chang. 2019, 9, 727. [CrossRef]
- Cook, B.I.; Mankin, J.S.; Marvel, K.; Williams, A.P.; Smerdon, J.E.; Anchukaitis, K.J. Twenty-First Century Drought Projections in the CMIP6 Forcing Scenarios. Earth’s Futur. 2020, 8, e2019EF001461. [Google Scholar] [CrossRef]
- Wild, M. The global energy balance as represented in CMIP6 climate models. Clim. Dyn. 2020, 55, 553–577. [Google Scholar] [CrossRef] [PubMed]
- Chen, H.; Sun, J.; Lin, W.; Xu, H. Comparison of CMIP6 and CMIP5 models in simulating climate extremes. Sci. Bull. 2020, 65, 1415–1418. [Google Scholar] [CrossRef]
- Di Luca, A.; Pitman, A.J.; de Elía, R. Decomposing Temperature Extremes Errors in CMIP5 and CMIP6 Models. Geophys. Res. Lett. 2020, 47, e2020GL088031. [Google Scholar] [CrossRef]
- Agel, L.; Barlow, M. How well do CMIP6 historical runs match observed Northeast U.S. Precipitation and extreme precipitation–related circulation? J. Clim. 2020, 33, 9835–9848. [Google Scholar] [CrossRef]
- Zhai, J.; Mondal, S.K.; Fischer, T.; Wang, Y.; Su, B.; Huang, J.; Tao, H.; Wang, G.; Ullah, W.; Uddin, M.J. Future drought characteristics through a multi-model ensemble from CMIP6 over South Asia. Atmos. Res. 2020, 246, 105111. [Google Scholar] [CrossRef]
- Su, B.; Huang, J.; Mondal, S.K.; Zhai, J.; Wang, Y.; Wen, S.; Gao, M.; Lv, Y.; Jiang, S.; Jiang, T.; et al. Insight from CMIP6 SSP-RCP scenarios for future drought characteristics in China. Atmos. Res. 2020, 250, 105375. [Google Scholar] [CrossRef]
- Aadhar, S.; Mishra, V. On the Projected Decline in Droughts Over South Asia in CMIP6 Multimodel Ensemble. J. Geophys. Res. Atmos. 2020, 125, 1–18. [Google Scholar] [CrossRef]
- Ukkola, A.M.; De Kauwe, M.G.; Roderick, M.L.; Abramowitz, G.; Pitman, A.J. Robust Future Changes in Meteorological Drought in CMIP6 Projections Despite Uncertainty in Precipitation. Geophys. Res. Lett. 2020, 47, 1–9. [Google Scholar] [CrossRef]
- Beck, H.E.; Zimmermann, N.E.; McVicar, T.R.; Vergopolan, N.; Berg, A.; Wood, E.F. Present and future köppen-geiger climate classification maps at 1-km resolution. Sci. Data 2018, 5, 1–12. [Google Scholar] [CrossRef]
- Guo, H.; Bao, A.; Ndayisaba, F.; Liu, T.; Jiapaer, G.; El-Tantawi, A.M.; De Maeyer, P. Space-time characterization of drought events and their impacts on vegetation in Central Asia. J. Hydrol. 2018, 564, 1165–1178. [Google Scholar] [CrossRef]
- Harris, I.; Osborn, T.J.; Jones, P.; Lister, D. Version 4 of the CRU TS monthly high-resolution gridded multivariate climate dataset. Sci. Data 2020, 7, 1–18. [Google Scholar] [CrossRef]
- Djaman, K.; Balde, A.B.; Sow, A.; Muller, B.; Irmak, S.; N’Diaye, M.K.; Manneh, B.; Moukoumbi, Y.D.; Futakuchi, K.; Saito, K. Evaluation of sixteen reference evapotranspiration methods under sahelian conditions in the Senegal River Valley. J. Hydrol. Reg. Stud. 2015, 3, 139–159. [Google Scholar] [CrossRef]
- Deng, H.; Chen, Y. Influences of recent climate change and human activities on water storage variations in Central Asia. J. Hydrol. 2017, 544, 46–57. [Google Scholar] [CrossRef]
- Taylor, K.E.; Balaji, V.; Hankin, S.; Juckes, M.; Lawrence, B.; Balaji, V.; Cinquini, L.; Denvil, S.; Durack, P.J.; Elkington, M.; et al. CMIP6 Global Attributes, DRS, Filenames, Directory Structure, and CV’s; PCMDI Document; CERFACS: Toulouse, France, 2017. [Google Scholar]
- Vicente-Serrano, S.M.; Beguería, S.; López-Moreno, J.I. A multiscalar drought index sensitive to global warming: The standardized precipitation evapotranspiration index. J. Clim. 2010, 23, 1696–1718. [Google Scholar] [CrossRef]
- Dai, A. Increasing drought under global warming in observations and models. Nat. Clim. Chang. 2013, 3, 52–58. [Google Scholar] [CrossRef]
- Sheffield, J.; Wood, E.F.; Roderick, M.L. Little change in global drought over the past 60 years. Nature 2012, 491, 435–438. [Google Scholar] [CrossRef] [PubMed]
- Zhang, J.; Sun, F.; Xu, J.; Chen, Y.; Sang, Y.F.; Liu, C. Dependence of trends in and sensitivity of drought over China (1961–2013) on potential evaporation model. Geophys. Res. Lett. 2016, 43, 206–213. [Google Scholar] [CrossRef]
- Li, Z.; Chen, Y.; Fang, G.; Li, Y. Multivariate assessment and attribution of droughts in Central Asia. Sci. Rep. 2017, 7, 1–12. [Google Scholar] [CrossRef]
- Allen, R.G.; Pereira, L.S.; Raes, D.; Smith, M. FAO Irrigation and Drainage Paper No. 56—Crop Evapotranspiration; Food and Agriculture Organization of the United Nations: Rome, Italy, 1998; pp. 26–40. [Google Scholar]
- Wang, A.; Wang, Y.; Su, B.; Kundzewicz, Z.W.; Tao, H.; Wen, S.; Qin, J.; Gong, Y.; Jiang, T. Comparison of Changing Population Exposure to Droughts in River Basins of the Tarim and the Indus. Earth’s Futur. 2020, 8, 1–13. [Google Scholar] [CrossRef]
- Allen, R.G.; Pereira, L.S.; Raes, D.; Smith, M. Table of Contents Originated by: Agriculture Crop Evapotranspiration—Guidelines for Computing Crop Water Requirements—FAO Irrigation and Drainage Paper 56; Food and Agriculture Organization of the United Nations: Rome, Italy, 1998; ISBN 9251042195. Available online: https://www.fao.org/3/X0490E/x0490e00.htm (accessed on 23 September 2021).
- Gao, F.; Zhang, Y.; Ren, X.; Yao, Y.; Hao, Z.; Cai, W. Evaluation of CHIRPS and its application for drought monitoring over the Haihe River Basin, China. Nat. Hazards 2018, 92, 155–172. [Google Scholar] [CrossRef]
- Sen, P.K. Estimates of the Regression Coefficient Based on Kendall’s Tau. J. Am. Stat. Assoc. 1968, 63, 1379–1389. [Google Scholar] [CrossRef]
- Kendall, M.G. Rank Correlation Methods; Charles Griffin: London, UK, 1975; Available online: https://psycnet.apa.org/record/1948-15040-000 (accessed on 23 September 2021).
- Mann, H.B. Non-Parametric Test Against Trend. Econometrica 1945, 13, 245–259. [Google Scholar] [CrossRef]
- Yevjevich, V. An objective approach to definitions and investigations of continental hydrologic droughts. J. Hydrol. 1969, 7, 353. [Google Scholar] [CrossRef]
- Guo, H.; Bao, A.; Liu, T.; Jiapaer, G.; Ndayisaba, F.; Jiang, L.; Kurban, A.; De Maeyer, P. Spatial and temporal characteristics of droughts in Central Asia during 1966–2015. Sci. Total Environ. 2018, 624, 1523–1538. [Google Scholar] [CrossRef]
- Pokhrel, Y.; Felfelani, F.; Satoh, Y.; Boulange, J.; Burek, P.; Gädeke, A.; Gerten, D.; Gosling, S.N.; Grillakis, M.; Gudmundsson, L.; et al. Global terrestrial water storage and drought severity under climate change. Nat. Clim. Chang. 2021, 11, 226–233. [Google Scholar] [CrossRef]
- Berdugo, M.; Delgado-Baquerizo, M.; Soliveres, S.; Hernández-Clemente, R.; Zhao, Y.; Gaitán, J.J.; Gross, N.; Saiz, H.; Maire, V.; Lehman, A.; et al. Global ecosystem thresholds driven by aridity. Science 2020, 367, 787–790. [Google Scholar] [CrossRef] [PubMed]
- EM-DAT. The International Disaster Database [DS]. Available online: https://www.emdat.be/index.php (accessed on 23 September 2021).
- Su, B.; Huang, J.; Fischer, T.; Wang, Y.; Kundzewicz, Z.W.; Zhai, J.; Sun, H.; Wang, A.; Zeng, X.; Wang, G.; et al. Drought losses in China might double between the 1.5 °C and 2.0 °C warming. Proc. Natl. Acad. Sci. USA 2018, 115, 10600–10605. [Google Scholar] [CrossRef] [PubMed]
- Xu, H.; Zhou, K.; Lan, J.; Zhang, G.; Zhou, X. Arid Central Asia saw mid-Holocene drought. Geology 2019, 47, 255–258. [Google Scholar] [CrossRef]
- Pascolini-Campbell, M.; Reager, J.T.; Chandanpurkar, H.A.; Rodell, M. A 10 percent increase in global land evapotranspiration from 2003 to 2019. Nature 2021, 593, 543–547. [Google Scholar] [CrossRef]
- Li, Z.; Chen, Y.; Shen, Y.; Liu, Y.; Zhang, S. Analysis of changing pan evaporation in the arid region of Northwest China. Water Resour. Res. 2013, 49, 2205–2212. [Google Scholar] [CrossRef]
- Qi, J.; Bobushev, T.S.; Kulmatov, R.; Groisman, P.; Gutman, G. Addressing global change challenges for Central Asian socio-ecosystems. Front. Earth Sci. 2012, 6, 115–121. [Google Scholar] [CrossRef]
- Xu, H.J.; Wang, X.P.; Zhang, X.X. Decreased vegetation growth in response to summer drought in Central Asia from 2000 to 2012. Int. J. Appl. Earth Obs. Geoinf. 2016, 52, 390–402. [Google Scholar] [CrossRef]
- Zhang, R.; Shang, H.; Yu, S.; He, Q.; Yuan, Y.; Bolatov, K.; Mambetov, B.T. Tree-ring-based precipitation reconstruction in southern Kazakhstan, reveals drought variability since A.D. 1770. Int. J. Climatol. 2017, 37, 741–750. [Google Scholar] [CrossRef]
- Kundzewicz, Z.W.; Krysanova, V.; Benestad, R.E.; Hov, Ø.; Piniewski, M.; Otto, I.M. Uncertainty in climate change impacts on water resources. Environ. Sci. Policy 2018, 79, 1–8. [Google Scholar] [CrossRef]


Publisher’s Note: MDPI stays neutral with regard to jurisdictional claims in published maps and institutional affiliations. |
© 2021 by the authors. Licensee MDPI, Basel, Switzerland. This article is an open access article distributed under the terms and conditions of the Creative Commons Attribution (CC BY) license (https://creativecommons.org/licenses/by/4.0/).