
Mapping and Characterizing Displacements of Landslides with InSAR and Airborne LiDAR Technologies: A Case Study of Danba County, Southwest China


Abstract
:1. Introduction
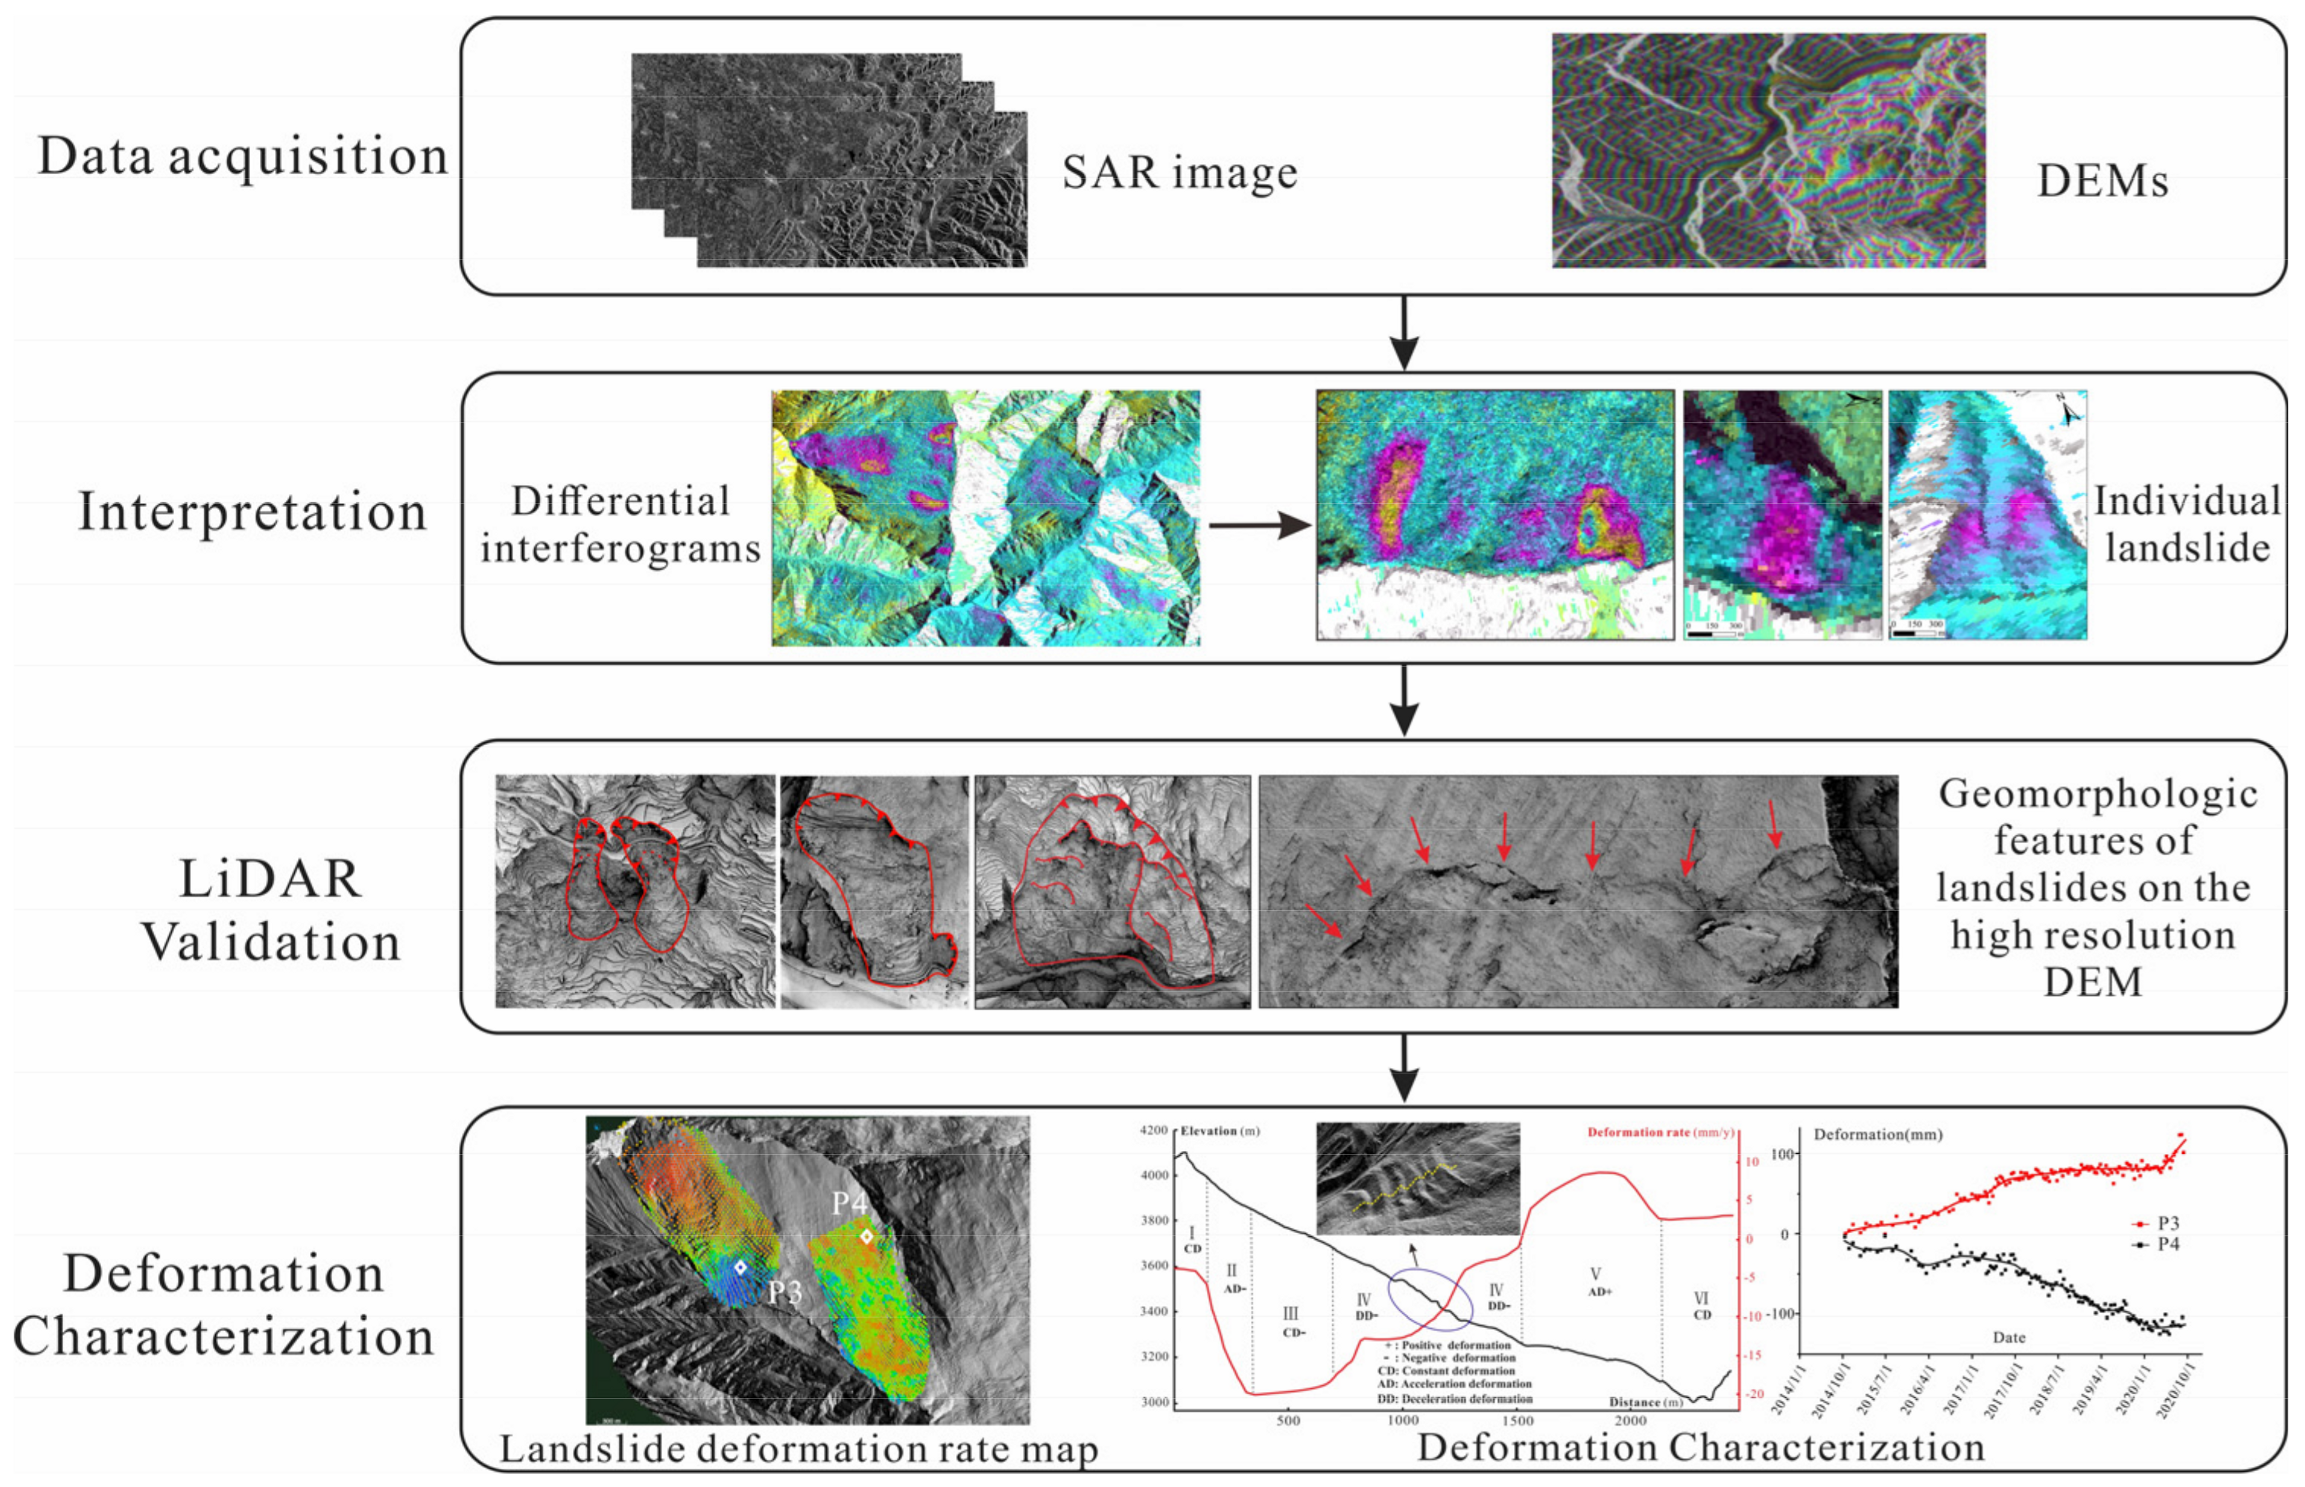
2. Methodology
2.1. Stacking InSAR and SBAS InSAR Technology
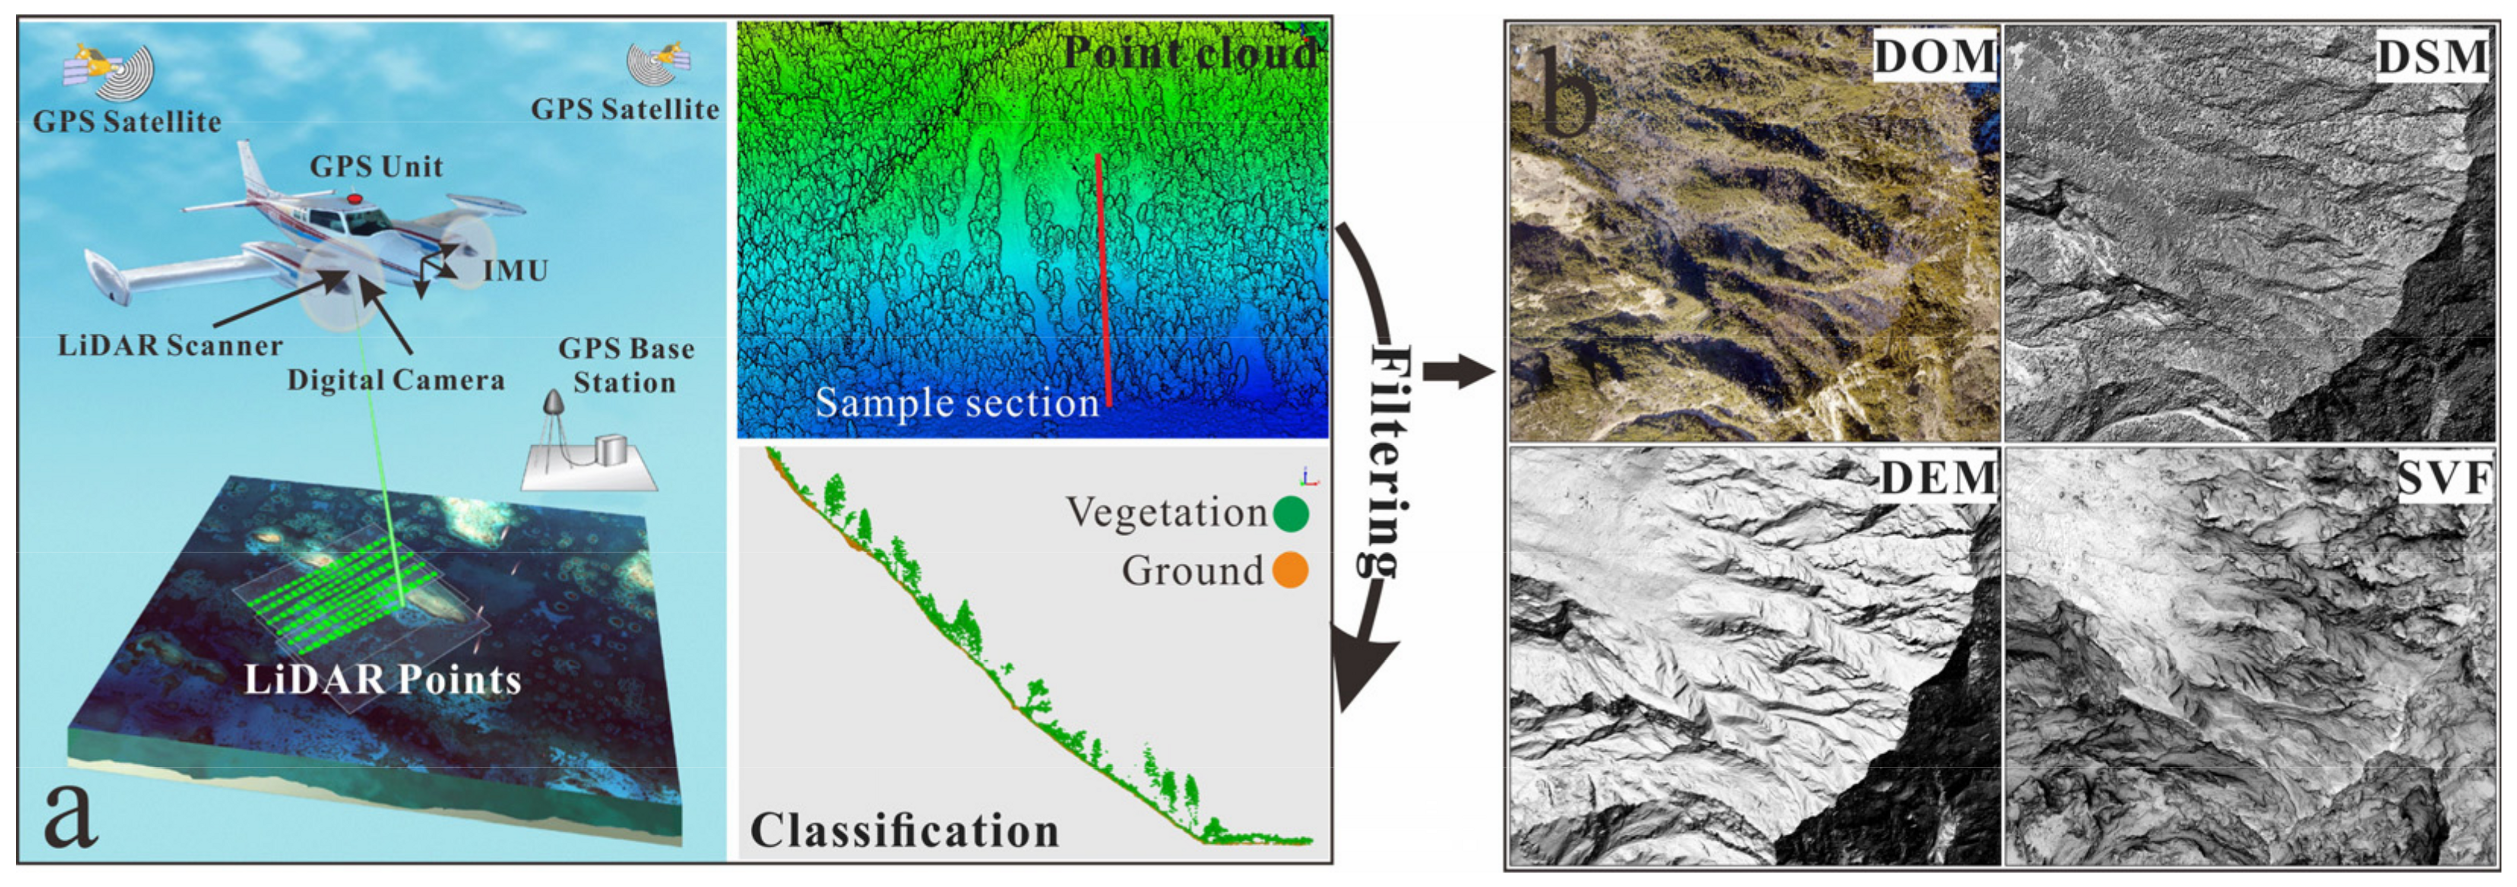
2.2. Airborne LiDAR
3. Study Area and Datasets
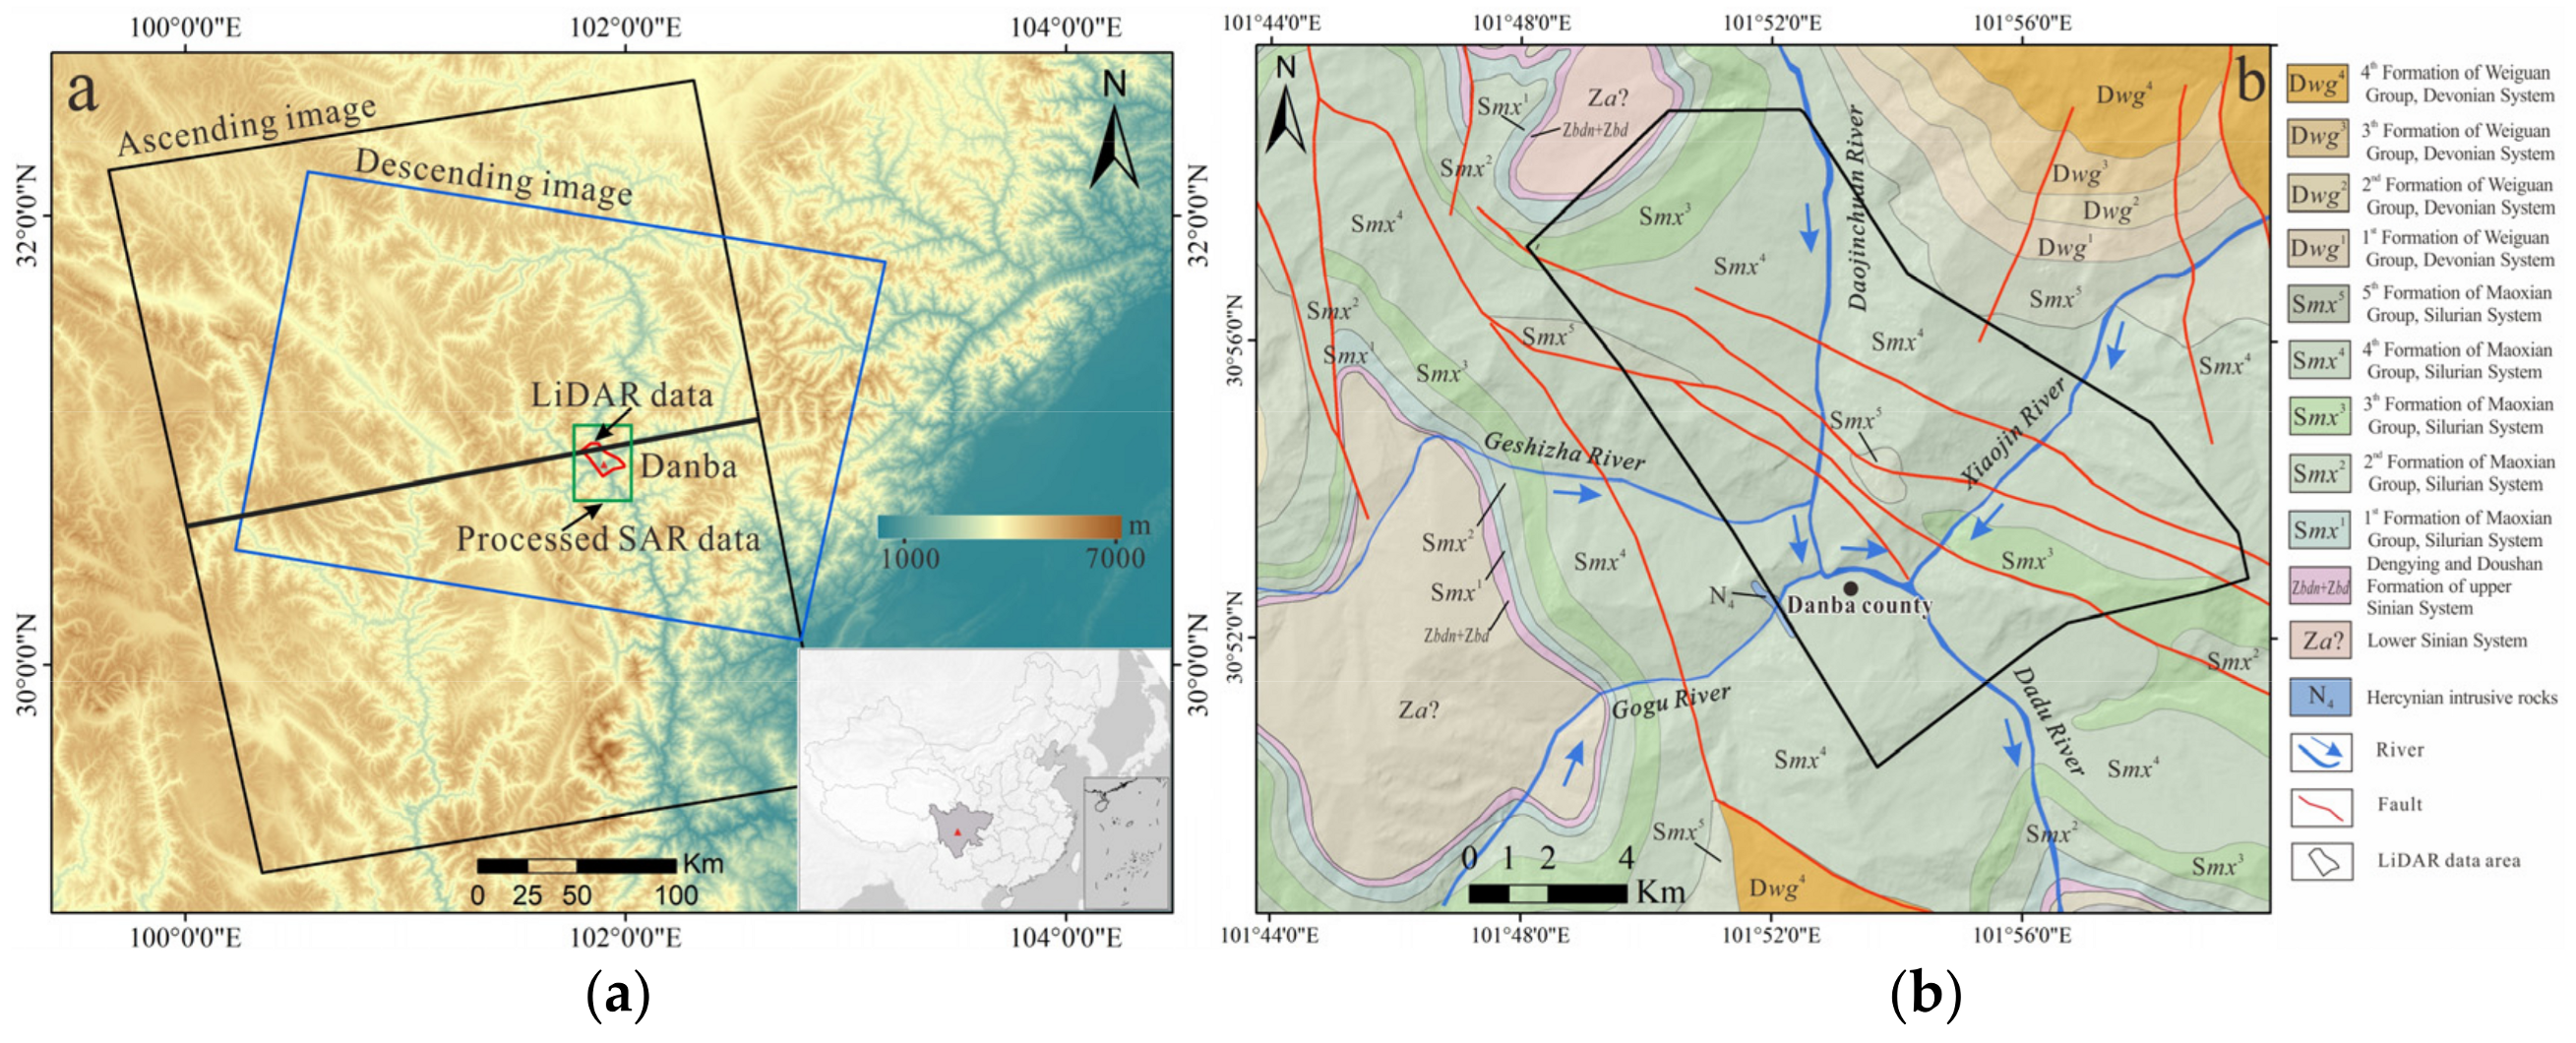
3.1. Study Area
3.2. SAR Data
3.3. Airborne LiDAR Data
4. Results
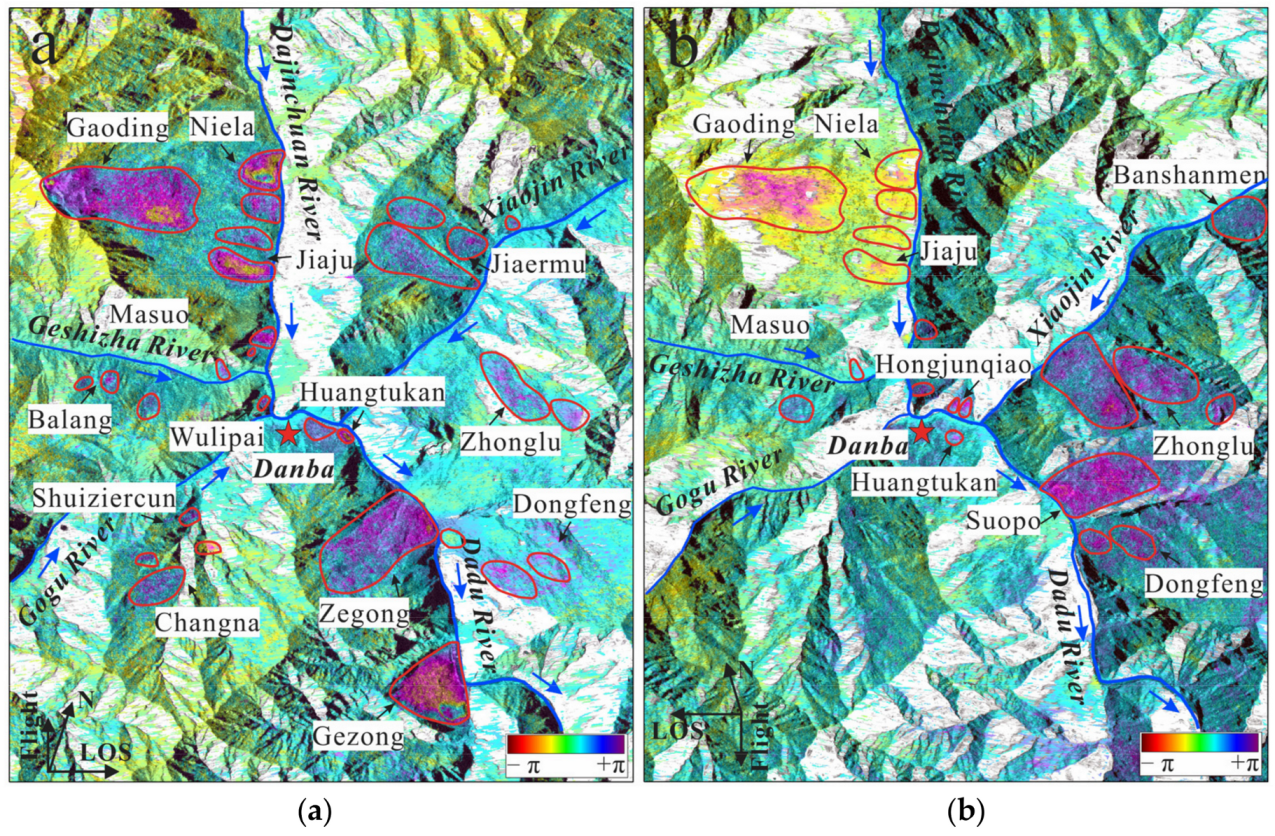
4.1. Active Landslides Mapped by Stacking InSAR
4.2. Landslide Validation Using Airborne LiDAR Data
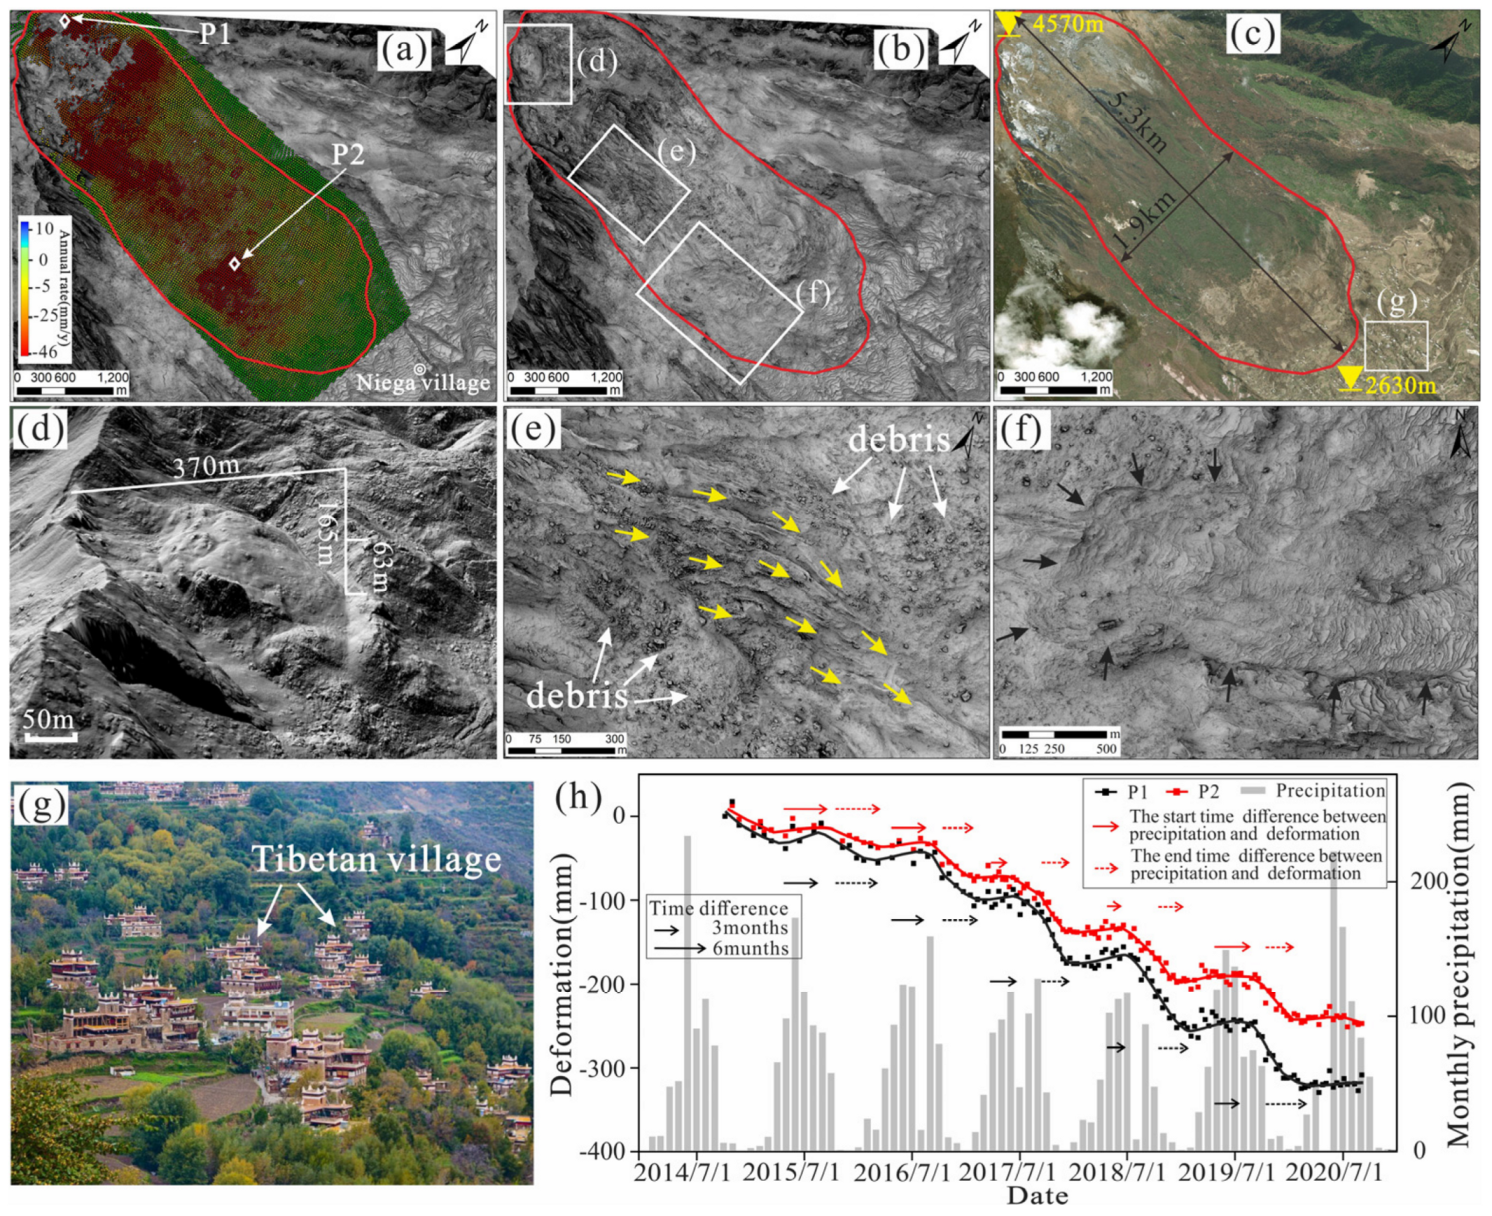
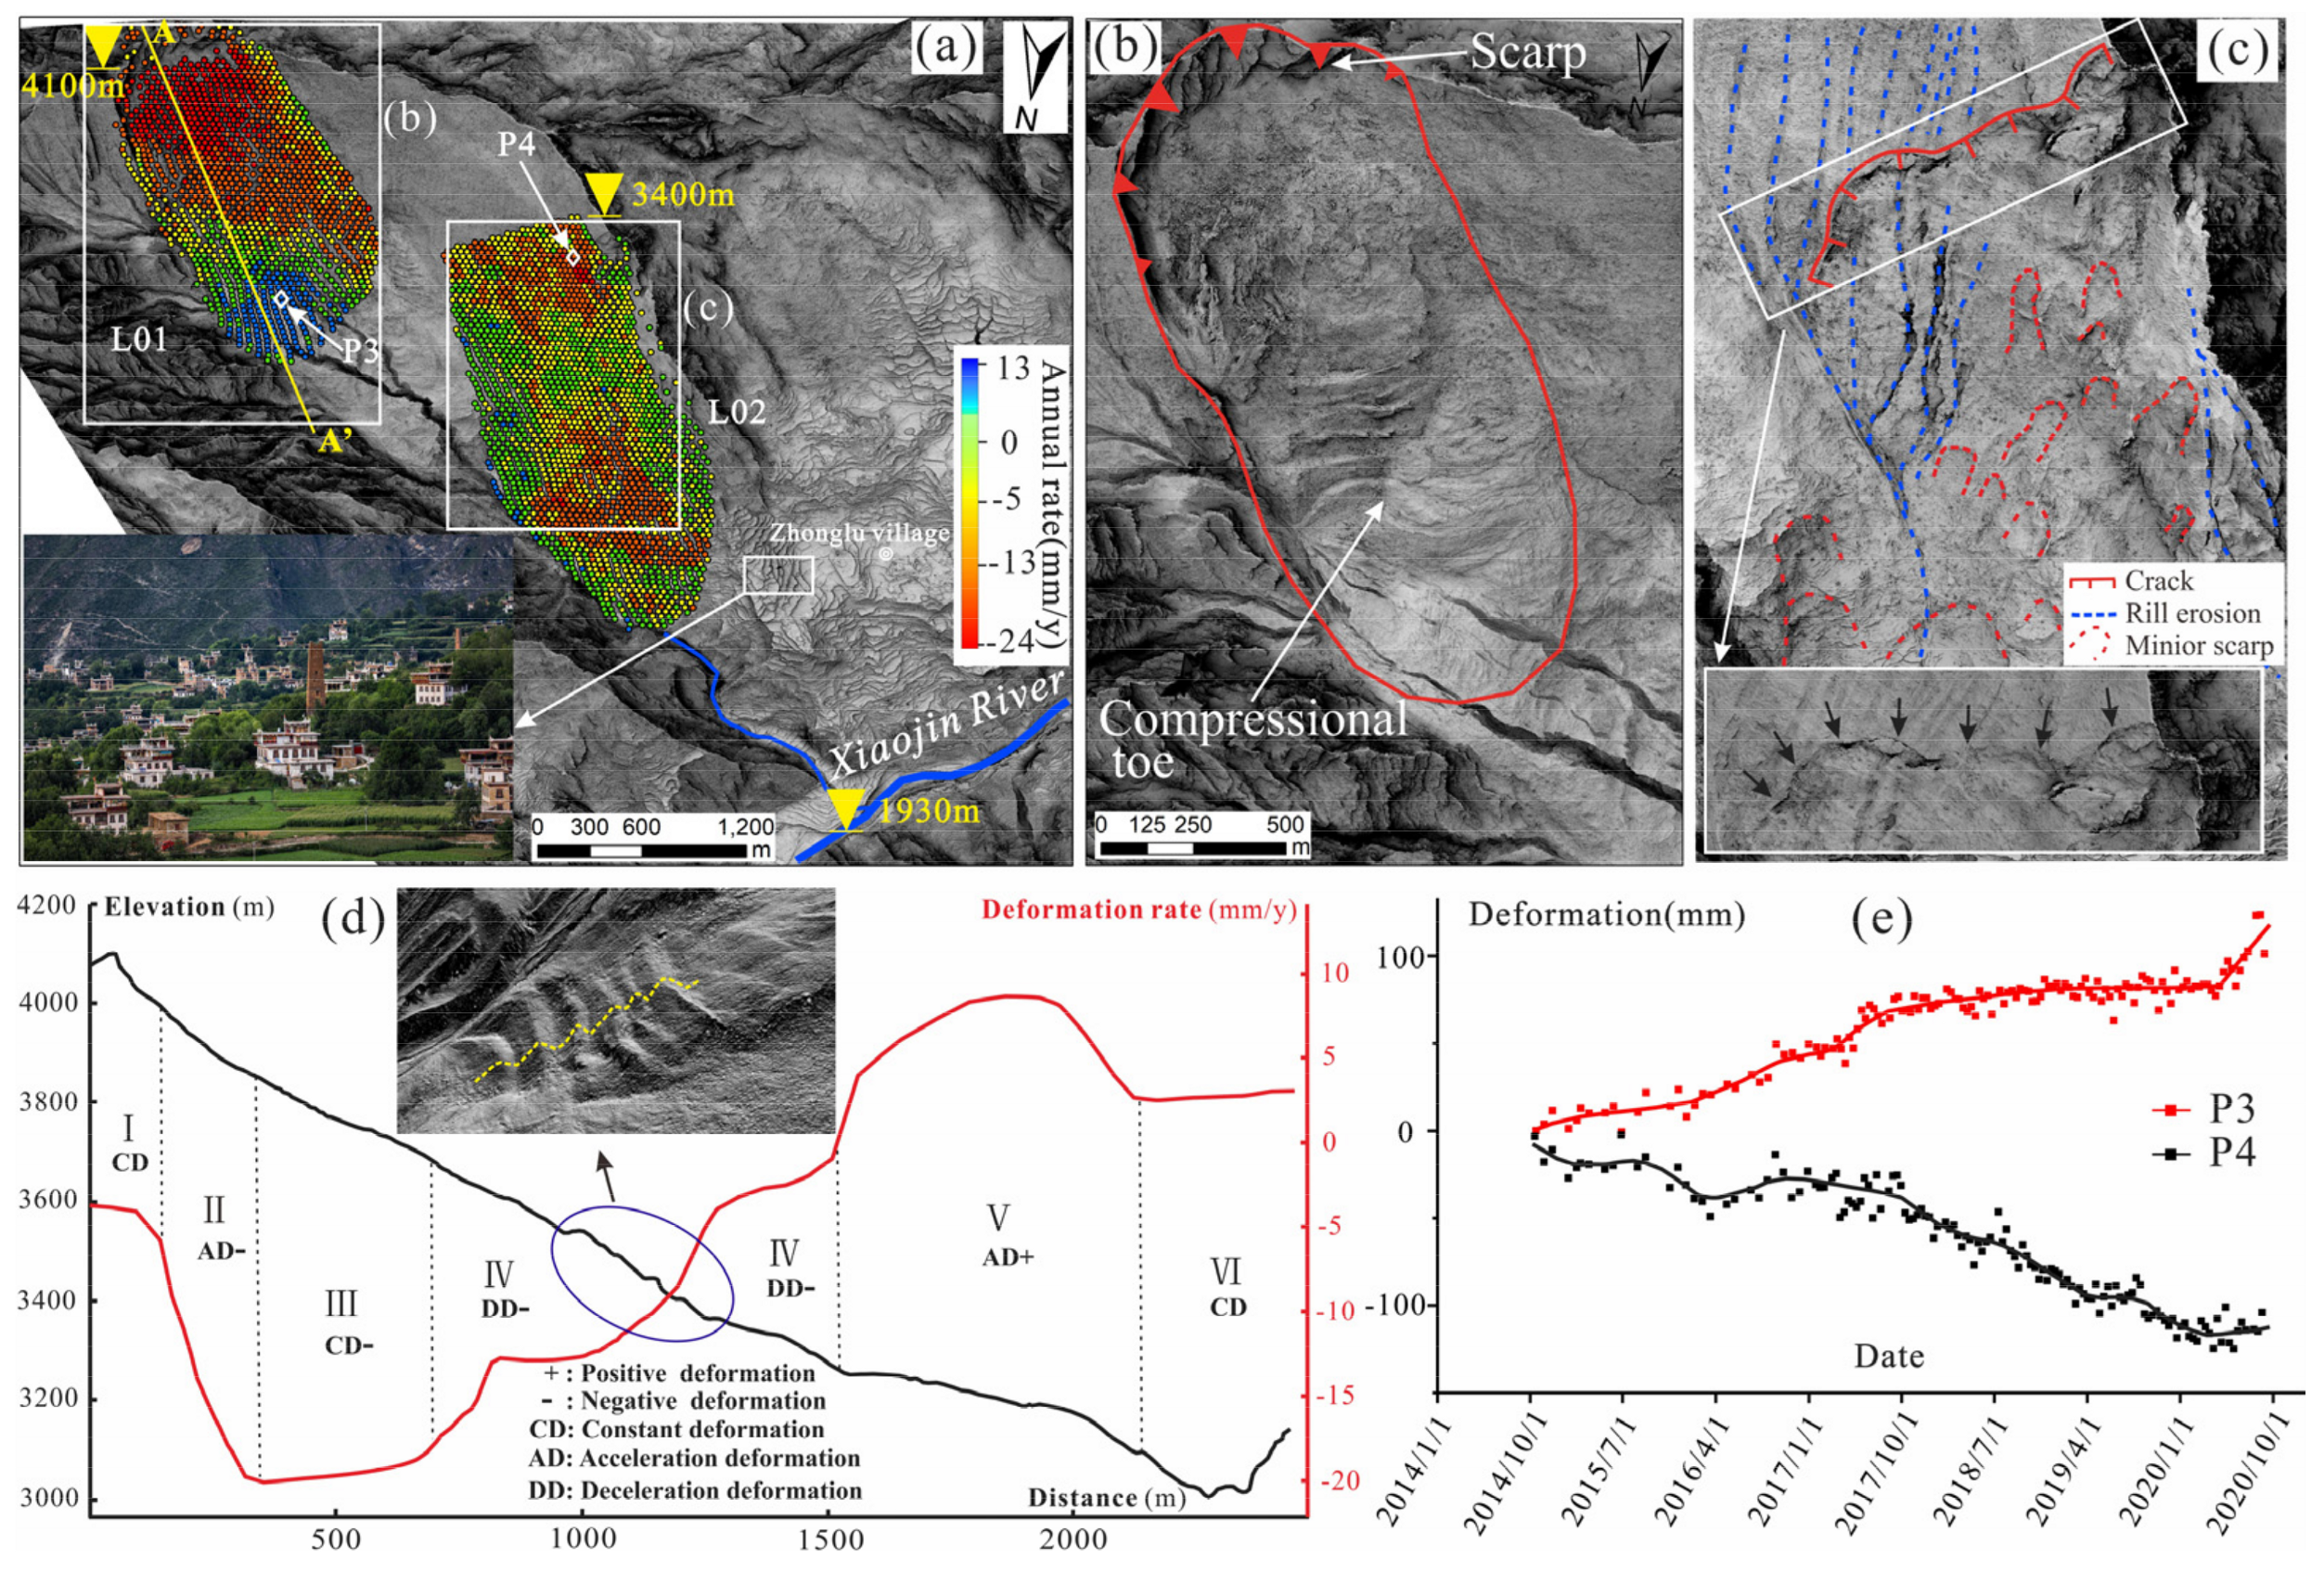
4.3. Displacements of Selected Giant Landslides by SBAS InSAR
5. Discussion
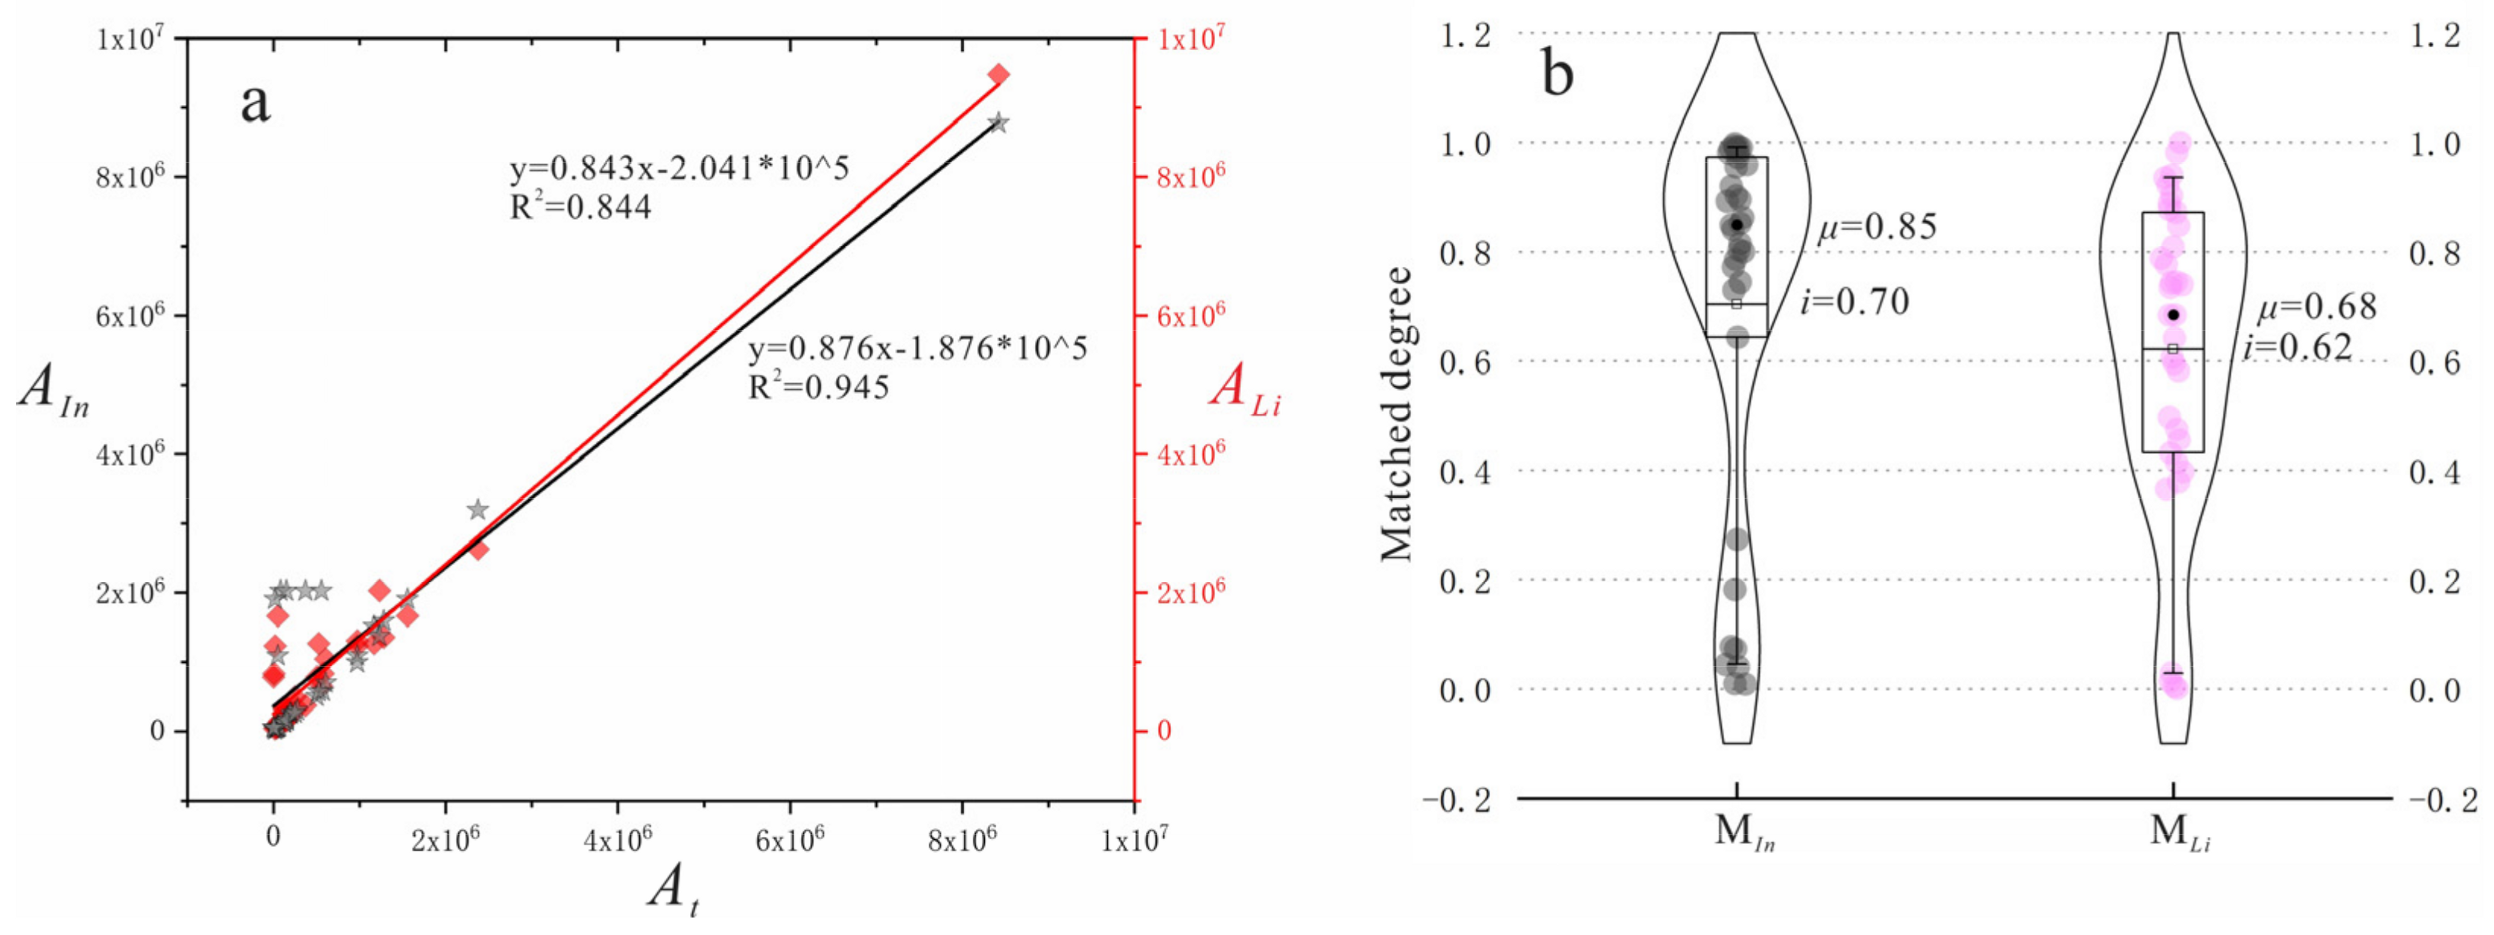
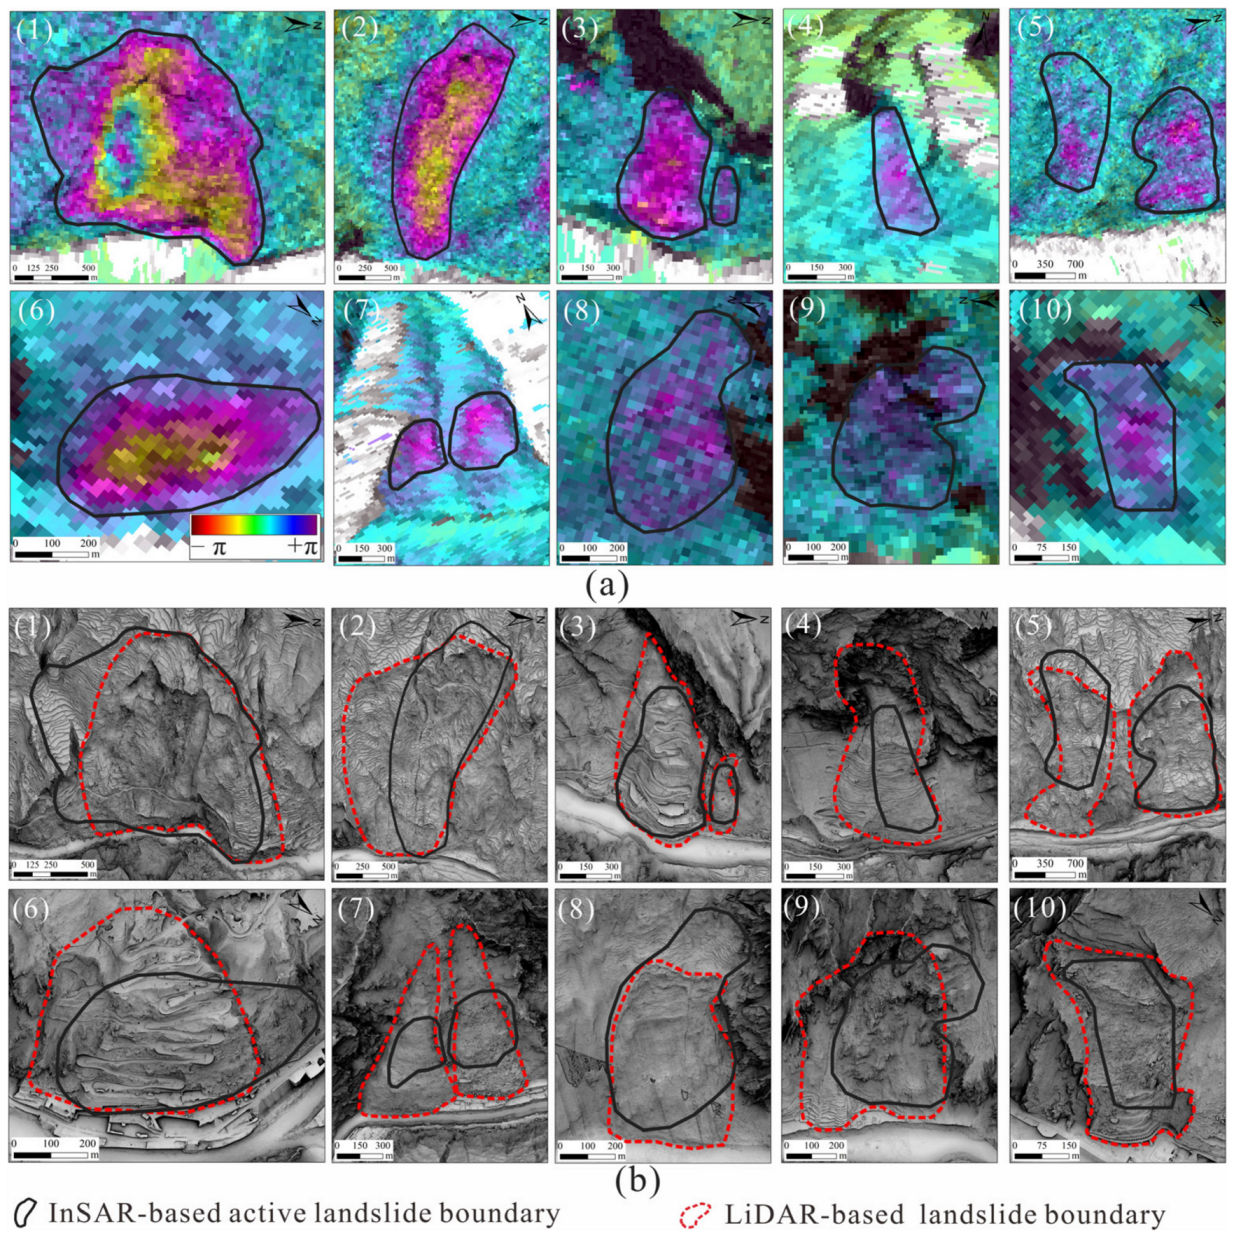
5.1. Comparison of InSAR-Based and LiDAR-Based Landslides
5.2. Advantages of Combining InSAR and LiDAR Technologies
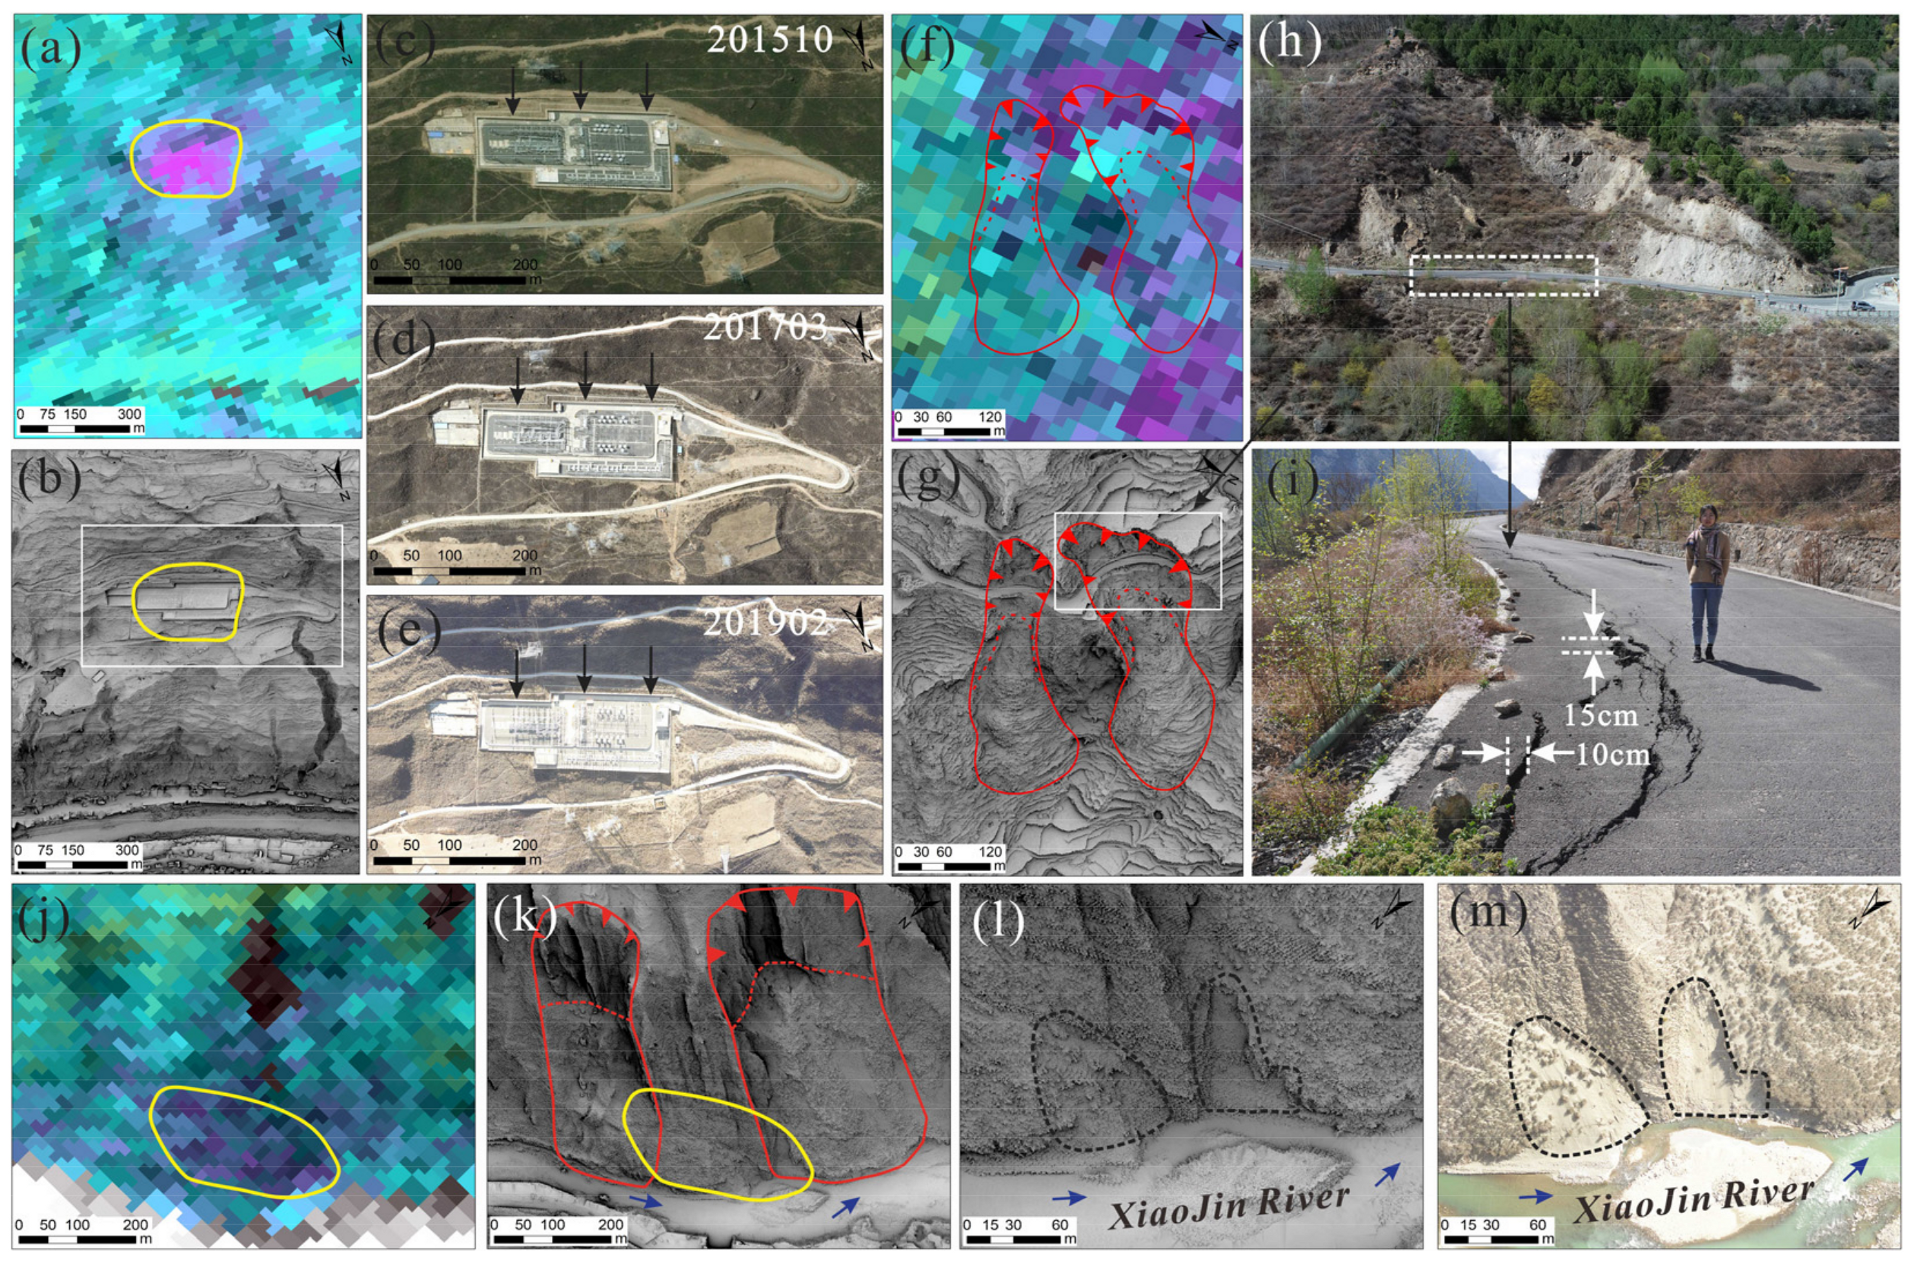
5.2.1. Eliminating Slope Deformation Caused by Nonlandslide Activities
5.2.2. Identifying Small Landslides and Landslides with Unobvious Deformation
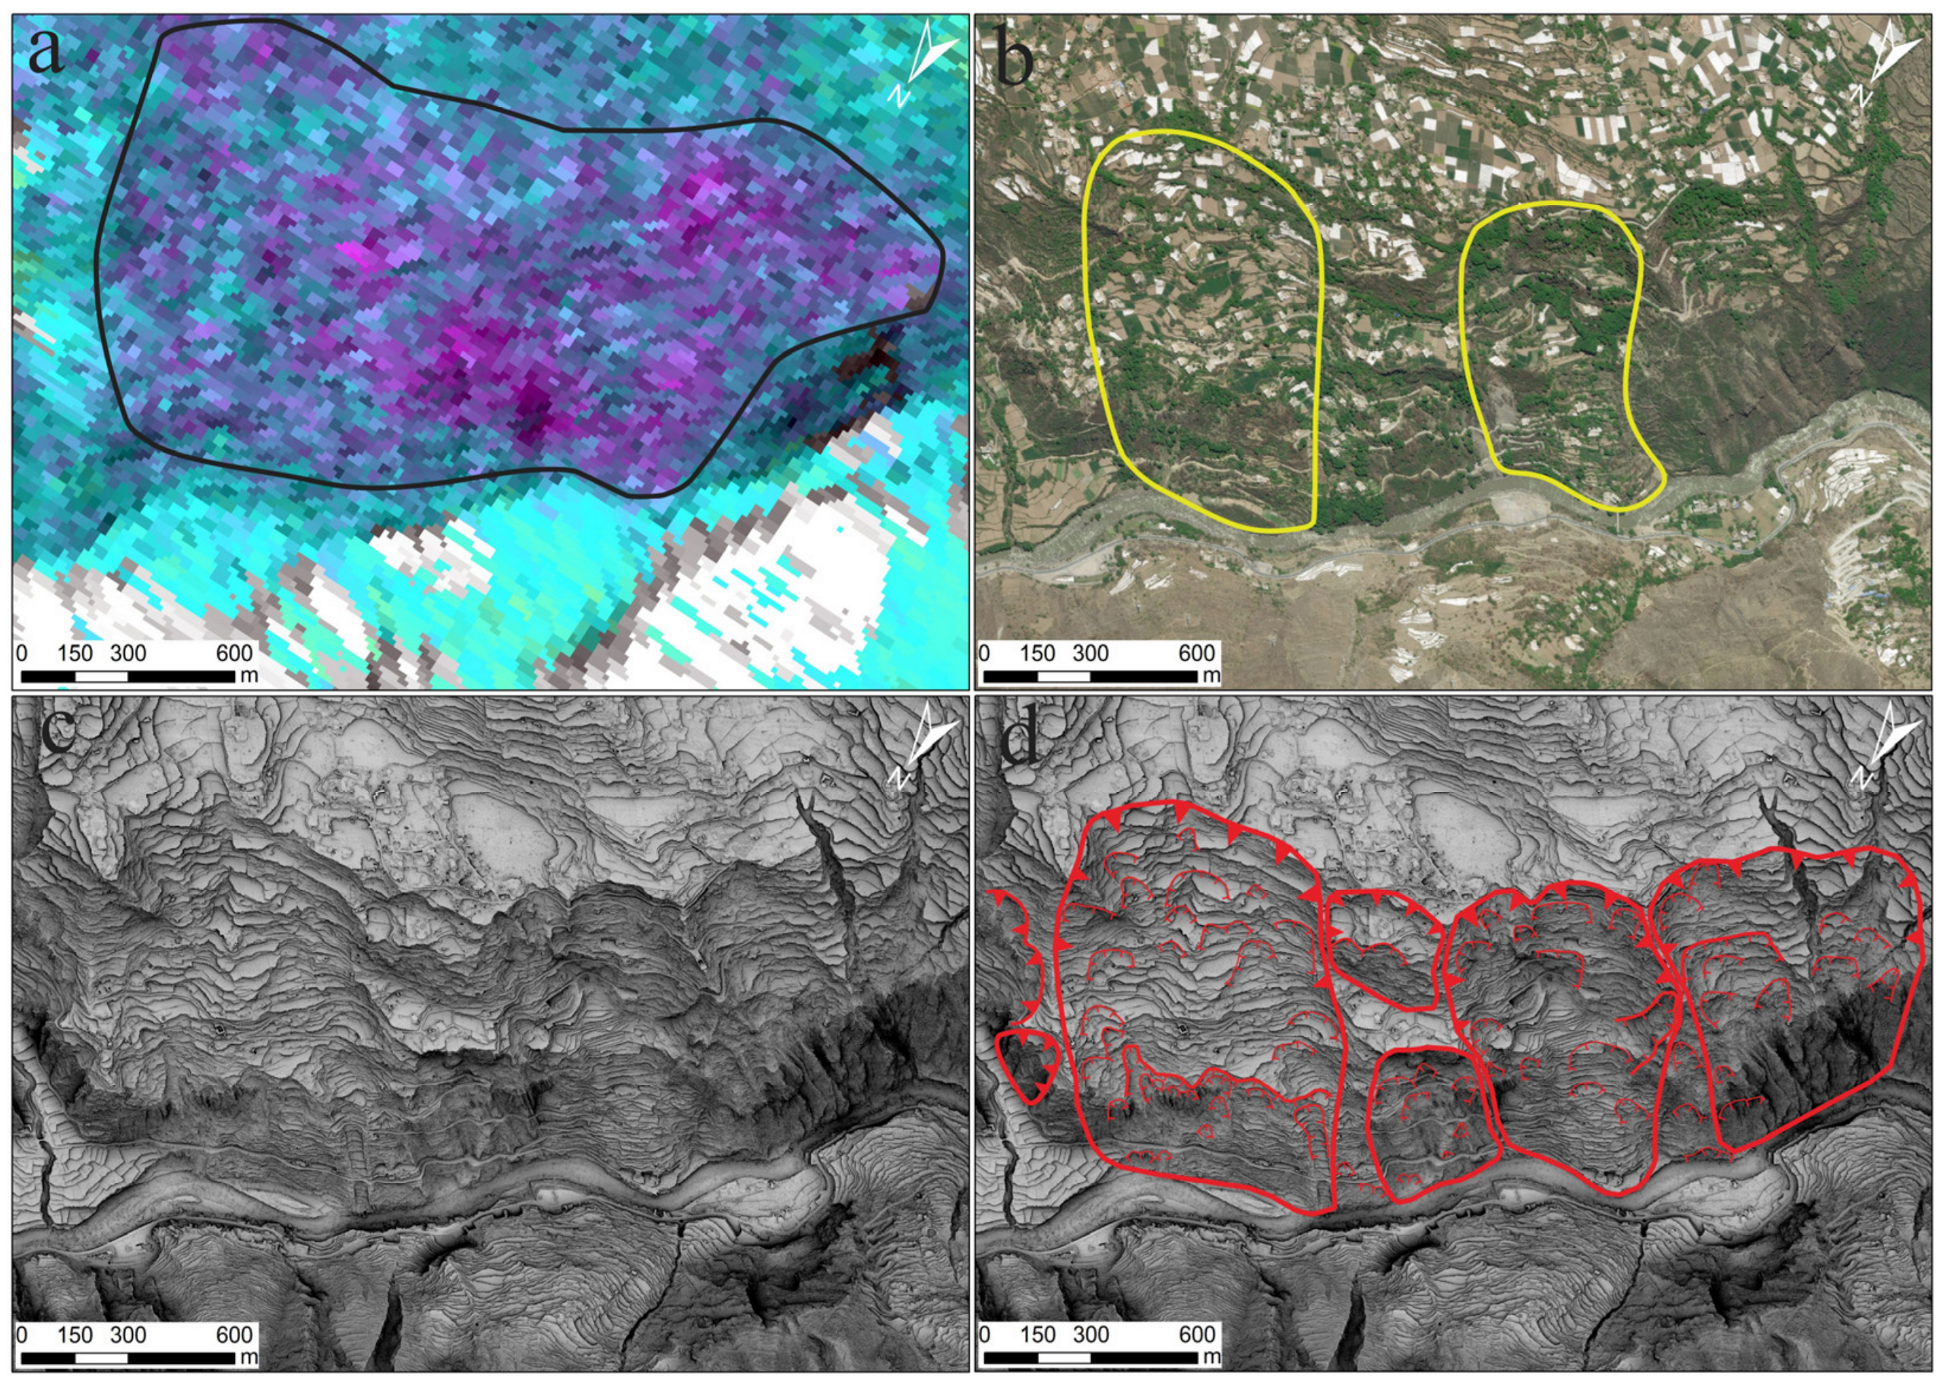
5.2.3. Accurately Drawing Landslide Boundaries
6. Conclusions
Author Contributions
Funding
Institutional Review Board Statement
Informed Consent Statement
Data Availability Statement
Acknowledgments
Conflicts of Interest
References
- Huang, R. Some catastrophic landslides since the twentieth century in the southwest of China. Landslides 2009, 6, 69–81. [Google Scholar] [CrossRef]
- Xu, Q.; Dong, X.; Li, W. Integrated Space-Air-Ground Early Detection, Monitoring and Warning System for Potential Catastrophic Geohazards. Geomat. Inf. Sci. Wuhan Univ. 2019, 44, 957–966. [Google Scholar]
- Xu, Q. Understanding and Consideration of Related Issues in Early Identification of Potential Geohaz-ards. Geomat. Inf. Sci. Wuhan Univ. 2020, 45, 1651–1659. [Google Scholar]
- Fan, X.; Xu, Q.; Scaringi, G.; Dai, L.; Li, W.; Dong, X.; Zhu, X.; Pei, X.; Dai, K.; Havenith, H.-B. Failure mechanism and kinematics of the deadly June 24th 2017 Xinmo landslide, Maoxian, Sichuan, China. Landslides 2017, 14, 2129–2146. [Google Scholar] [CrossRef]
- Jia, H.; Chen, F.; Pan, D. Disaster Chain Analysis of Avalanche and Landslide and the River Blocking Dam of the Yarlung Zangbo River in Milin County of Tibet on 17 and 29 October 2018. Int. J. Environ. Res. Public Health 2019, 16, 4707. [Google Scholar] [CrossRef] [Green Version]
- Fan, X.; Xu, Q.; Alonso-Rodriguez, A.; Subramanian, S.S.; Li, W.; Zheng, G.; Dong, X.; Huang, R. Successive landsliding and damming of the Jinsha River in eastern Tibet, China: Prime investigation, early warning, and emergency response. Landslides 2019, 16, 1003–1020. [Google Scholar] [CrossRef]
- Dong, J.; Zhang, L.; Tang, M.; Liao, M.; Xu, Q.; Gong, J.; Ao, M. Mapping landslide surface displacements with time series SAR interferometry by combining persistent and distributed scatterers: A case study of Jiaju landslide in Danba, China. Remote Sens. Environ. 2018, 205, 180–198. [Google Scholar] [CrossRef]
- Li, W.; Xu, Q.; Lu, H.; Dong, X.; Zhu, Y. Tracking the Deformation History of Large-Scale Rocky Landslides and Its Enlightenment. Geomat. Inf. Sci. Wuhan Univ. 2019, 44, 1043–1053. [Google Scholar]
- Nichol, J.; Wong, M.S. Detection and interpretation of landslides using satellite images. Land Degrad. Dev. 2005, 16, 243–255. [Google Scholar] [CrossRef]
- Roering, J.J.; Mackey, B.H.; Marshall, J.A.; Sweeney, K.E.; Deligne, N.I.; Booth, A.M.; Handwerger, A.L.; Cerovski-Darriau, C. “You are HERE”: Connecting the dots with airborne lidar for geomorphic fieldwork. Geomorphology 2013, 200, 172–183. [Google Scholar] [CrossRef]
- Görüm, T. Landslide recognition and mapping in a mixed forest environment from airborne LiDAR data. Eng. Geol. 2019, 258, 105155. [Google Scholar] [CrossRef]
- Calò, F.; Ardizzone, F.; Castaldo, R.; Lollino, P.; Tizzani, P.; Guzzetti, F.; Lanari, R.; Angeli, M.-G.; Pontoni, F.; Manunta, M. Enhanced landslide investigations through advanced DInSAR techniques: The Ivancich case study, Assisi, Italy. Remote Sens. Environ. 2014, 142, 69–82. [Google Scholar] [CrossRef] [Green Version]
- Intrieri, E.; Raspini, F.; Fumagalli, A.; Lu, P.; Del Conte, S.; Farina, P.; Allievi, J.; Ferretti, A.; Casagli, N. The Maoxian landslide as seen from space: Detecting precursors of failure with Sentinel-1 data. Landslides 2018, 15, 123–133. [Google Scholar] [CrossRef] [Green Version]
- Hu, X.; Lu, Z.; Pierson, T.C.; Kramer, R.; George, D.L. Combining InSAR and GPS to Determine Transient Movement and Thickness of a Seasonally Active Low-Gradient Translational Landslide. Geophys. Res. Lett. 2018, 45, 1453–1462. [Google Scholar] [CrossRef]
- Fruneau, B.; Achache, J.; Delacourt, C. Observation and modelling of the Saint-Étienne-de-Tinée landslide using SAR interferometry. Tectonophysics 1996, 265, 181–190. [Google Scholar] [CrossRef]
- Liao, M.; Tang, J.; Wang, T.; Balz, T.; Zhang, L. Landslide monitoring with high-resolution SAR data in the Three Gorges region. Sci. China Earth Sci. 2012, 55, 590–601. [Google Scholar] [CrossRef]
- Hilley, G.E. Dynamics of Slow-Moving Landslides from Permanent Scatterer Analysis. Science 2004, 304, 1952–1955. [Google Scholar] [CrossRef] [Green Version]
- Berardino, P.; Fornaro, G.; Lanari, R.; Sansosti, E. A new algorithm for surface deformation monitoring based on small baseline differential SAR interferograms. IEEE Trans. Geosci. Remote Sens. 2002, 40, 2375–2383. [Google Scholar] [CrossRef] [Green Version]
- Ferretti, A.; Prati, C.; Rocca, F. Permanent scatterers in SAR interferometry. IEEE Trans. Geosci. Remote Sens. 2001, 39, 8–20. [Google Scholar] [CrossRef]
- Zhang, L.; Ding, X.; Lu, Z. Modeling PSInSAR Time Series Without Phase Unwrapping. IEEE Trans. Geosci. Remote Sens. 2011, 49, 547–556. [Google Scholar] [CrossRef]
- Ferretti, A.; Fumagalli, A.; Novali, F.; Prati, C.; Rocca, F.; Rucci, A. A New Algorithm for Processing Interferometric Data-Stacks: SqueeSAR. IEEE Trans. Geosci. Remote Sens. 2011, 49, 3460–3470. [Google Scholar] [CrossRef]
- Zhang, Y.; Meng, X.; Chen, G.; Qiao, L.; Zeng, R.; Chang, J. Detection of geohazards in the Bailong River Basin using synthetic aperture radar interferometry. Landslides 2016, 13, 1273–1284. [Google Scholar] [CrossRef]
- Liu, X.; Zhao, C.; Zhang, Q.; Lu, Z.; Li, Z.; Yang, C.; Zhu, W.; Liu-Zeng, J.; Chen, L.; Liu, C. Integration of Sentinel-1 and ALOS/PALSAR-2 SAR datasets for mapping active landslides along the Jinsha River corridor, China. Eng. Geol. 2021, 284, 106033. [Google Scholar] [CrossRef]
- Lu, H.; Li, W.; Xu, Q.; Dong, X.; Dai, C.; Wang, D. Early Detection of Landslides in the Upstream and Downstream Areas of the Baige Landslide, the Jinsha River Based on Optical Remote Sensing and InSAR Technolo-gies. Geomat. Inf. Sci. Wuhan Univ. 2019, 44, 1342–1354. [Google Scholar]
- Dai, K.; Tie, Y.; Xu, Q.; Fen, Y.; Zhuo, G.; Shi, X. Early identification of potential landslide geohazards in al-pine-canyon terrain based on SAR interferometry—a case study of the middle section of yalong river. J. Radars 2020, 9, 554–568. [Google Scholar]
- Liu, X.; Zhao, C.; Zhang, Q.; Peng, J.; Zhu, W.; Lu, Z. Multi-Temporal Loess Landslide Inventory Mapping with C-, X- and L-Band SAR Datasets—A Case Study of Heifangtai Loess Landslides, China. Remote Sens. 2018, 10, 1756. [Google Scholar] [CrossRef] [Green Version]
- Lin, C.W.; Tseng, C.M.; Tseng, Y.H.; Fei, L.Y.; Hsieh, Y.C.; Tarolli, P. Recognition of large scale deep-seated landslides in forest areas of Taiwan using high resolution topography. J. Asian Earth Sci. 2013, 62, 389–400. [Google Scholar] [CrossRef]
- Guzzetti, F.; Mondini, A.C.; Cardinali, M.; Fiorucci, F.; Santangelo, M.; Chang, K.T. Landslide inventory maps: New tools for an old problem. Earth-Sci. Rev. 2012, 112, 42–66. [Google Scholar] [CrossRef] [Green Version]
- Chen, R.F.; Chang, K.J.; Angelier, J.; Chan, Y.C.; Deffontaines, B.; Lee, C.T.; Lin, M.L. Topographical changes revealed by high-resolution airborne LiDAR data: The 1999 Tsaoling landslide induced by the Chi-Chi earthquake. Eng. Geol. 2006, 88, 160–172. [Google Scholar] [CrossRef]
- Kang, Y.; Zhao, C.; Zhang, Q.; Lu, Z.; Li, B. Application of InSAR techniques to an analysis of the Guanling landslide. Remote Sens. 2017, 9, 1046. [Google Scholar] [CrossRef] [Green Version]
- Zhang, L.; Dai, K.; Deng, J.; Ge, D.; Liang, R.; Li, W.; Xu, Q. Identifying Potential Landslides by Stacking-InSAR in Southwestern China and Its Performance Comparison with SBAS-InSAR. Remote Sens. 2021, 13, 3662. [Google Scholar] [CrossRef]
- Van Den Eeckhaut, M.; Poesen, J.; Verstraeten, G.; Vanacker, V.; Nyssen, J.; Moeyersons, J.; van Beek, L.P.H.; Vandekerckhove, L. Use of LIDAR-derived images for mapping old landslides under forest. Earth Surf. Process. Landforms 2007, 32, 754–769. [Google Scholar] [CrossRef]
- Glenn, N.F.; Streutker, D.R.; Chadwick, D.J.; Thackray, G.D.; Dorsch, S.J. Analysis of LiDAR-derived topographic information for characterizing and differentiating landslide morphology and activity. Geomorphology 2006, 73, 131–148. [Google Scholar] [CrossRef]
- Kasai, M.; Ikeda, M.; Asahina, T.; Fujisawa, K. LiDAR-derived DEM evaluation of deep-seated landslides in a steep and rocky region of Japan. Geomorphology 2009, 113, 57–69. [Google Scholar] [CrossRef]
- Carrara, A.; Cardinali, M.; Guzzetti, F. Uncertainty in assessing landslide hazard and risk. ITC J. 1992, 172–183. [Google Scholar]
- Galli, M.; Ardizzone, F.; Cardinali, M.; Guzzetti, F.; Reichenbach, P. Comparing landslide inventory maps. Geomorphology 2008, 94, 268–289. [Google Scholar] [CrossRef]
- Li, Z.; Song, C.; Yu, C.; Xiao, R.; Chen, L.; Luo, H.; Dai, K.; Ge, D.; Ding, Y.; Zhang, Y.; et al. Application of Satellite Radar Remote Sensing to Landslide Detection Monitoring: Challenges and Solutions. Geomat. Inf. Sci. Wuhan Univ. 2019, 44, 967–979. [Google Scholar]
- Yang, C.Y.; Chi, C.Y.; Chen, R.F.; Lin, C.W. A new and powerful approach to mapping large-scale landslides using InSAR and LiDAR derived DEMs. In Proceedings of the 16th Asian Regional Conference on Soil Mechanics and Geotechnical Engineering, Taipei, Taiwan, 14–18 October 2019. [Google Scholar]


| Sensor | Sentinel-1A | Sentinel-1A |
|---|---|---|
| Orbit direction | Ascending | Descending |
| Wavelength (cm) | 5.6 | 5.6 |
| Resolution (m) | 5 × 20 | 5 × 20 |
| Repeat cycle (d) | 12 | 12 |
| Polarization | VV | VV |
| Look angle (°) | 20~45° | 20~45° |
| Temporal coverage | October 2014~September 2020 | October 2014~September 2020 |
| Number of images | 134 | 90 |
Publisher’s Note: MDPI stays neutral with regard to jurisdictional claims in published maps and institutional affiliations. |
© 2021 by the authors. Licensee MDPI, Basel, Switzerland. This article is an open access article distributed under the terms and conditions of the Creative Commons Attribution (CC BY) license (https://creativecommons.org/licenses/by/4.0/).
Share and Cite
Xu, Q.; Guo, C.; Dong, X.; Li, W.; Lu, H.; Fu, H.; Liu, X. Mapping and Characterizing Displacements of Landslides with InSAR and Airborne LiDAR Technologies: A Case Study of Danba County, Southwest China. Remote Sens. 2021, 13, 4234. https://doi.org/10.3390/rs13214234
Xu Q, Guo C, Dong X, Li W, Lu H, Fu H, Liu X. Mapping and Characterizing Displacements of Landslides with InSAR and Airborne LiDAR Technologies: A Case Study of Danba County, Southwest China. Remote Sensing. 2021; 13(21):4234. https://doi.org/10.3390/rs13214234
Chicago/Turabian StyleXu, Qiang, Chen Guo, Xiujun Dong, Weile Li, Huiyan Lu, Hao Fu, and Xiaosha Liu. 2021. "Mapping and Characterizing Displacements of Landslides with InSAR and Airborne LiDAR Technologies: A Case Study of Danba County, Southwest China" Remote Sensing 13, no. 21: 4234. https://doi.org/10.3390/rs13214234
APA StyleXu, Q., Guo, C., Dong, X., Li, W., Lu, H., Fu, H., & Liu, X. (2021). Mapping and Characterizing Displacements of Landslides with InSAR and Airborne LiDAR Technologies: A Case Study of Danba County, Southwest China. Remote Sensing, 13(21), 4234. https://doi.org/10.3390/rs13214234