Abstract
This study assessed four near-real-time satellite precipitation products (NRT SPPs) of Global Satellite Mapping of Precipitation (GSMaP)—NRT v6 (hereafter NRT6), NRT v7 (hereafter NRT7), Gauge-NRT v6 (hereafter GNRT6), and Gauge-NRT v7 (hereafter GNRT7)— in representing the daily and monthly rainfall variations over Taiwan, an island with complex terrain. The GNRT products are the gauge-adjusted version of NRT products. Evaluations for warm (May–October) and cold months (November–April) were conducted from May 2017 to April 2020. By using observations from more than 400 surface gauges in Taiwan as a reference, our evaluations showed that GNRT products had a greater error than NRT products in underestimating the monthly mean rainfall, especially during the warm months. Among SPPs, NRT7 performed best in quantitative monthly mean rainfall estimation; however, when examining the daily scale, GNRT6 and GNRT7 were superior, particularly for monitoring stronger (i.e., more intense) rainfall events during warm and cold months, respectively. Spatially, the major improvement from NRT6 to GNRT6 (from NRT7 to GNRT7) in monitoring stronger rainfall events over southwestern Taiwan was revealed during warm (cold) months. From NRT6 to NRT7, the improvement in daily rainfall estimation primarily occurred over southwestern and northwestern Taiwan during the warm and cold months, respectively. Possible explanations for the differences between the ability of SPPs are attributed to the algorithms used in SPPs. These findings highlight that different NRT SPPs of GSMaP should be used for studying or monitoring the rainfall variations over Taiwan for different purposes (e.g., warning of floods in different seasons, studying monthly or daily precipitation features in different seasons, etc.).
1. Introduction
Satellite precipitation products (SPPs) have been applied for research across many different subjects. In the literature [1,2,3,4,5,6,7], one of the most frequently adopted SPPs for studying rainfall variation over East Asia is the Tropical Rainfall Measurement Mission (TRMM) Multi-satellite Precipitation Analysis 3B42 (TMPA 3B42). However, TMPA 3B42 was concluded in December 2019. The Global Precipitation Mission (GPM), launched in February 2014, continued the global, high spatiotemporal resolution precipitation observation after TRMM. In association with GPM, two SPPs were developed: (1) Integrated Multi-satellite Retrievals for GPM (IMERG) [8] and (2) Global Satellite Mapping of Precipitation (GSMaP) [9]. Both IMERG and GSMaP provide various types of SPPs, including gauge-adjusted products and near-real-time products (depending on the data release time) [10,11]. Recently, many studies have focused on assessing the ability of these SPPs to represent rainfall characteristics over various regions [12,13,14,15,16,17]. In general, the late-release, gauge-adjusted products are expected to have a more accurate rainfall estimation than the early release, near-real-time products [17,18,19]. In contrast, for monitoring the development of extreme rainfall events that might lead to huge disasters and economic loss, the near-real-time products would be more valuable [20].
Located in the Western North Pacific region of Eastern Asia, Taiwan is an island with a large low-plane area in the west, a central mountain range extending north-to-south, and a small-plane area in the east [4]. During the warmer half of the year (May–October), Taiwan is frequently affected by various types of weather systems, including Mei-yu fronts, typhoons, and local afternoon rainfall events [21,22,23]. Additionally, the interactions between the summer southwesterly monsoonal flows and local orography have frequently resulted in the flooding of southwestern Taiwan [24,25]. In contrast, during the colder half of the year (November–April), the interactions between the winter northeasterly monsoonal flows and local orography make the windward side of northeastern Taiwan wetter than other sub-regions [26]. Because of the diversity of rainfall characteristics and its unique orography, Taiwan is a valuable location for assessing the performance of SPPs. For example, [27] examined the performance of IMERG gauge-adjusted product version 5 (IMERG-final v5) and indicated that it was capable of depicting the multiple timescale variations of rainfall over Taiwan. In [28], they further compared the performance of TMPA 3B42 v7 and IMERG-final v6 (both gauge-adjusted) and found that IMERG-final v6 outperformed TMPA 3B42 v7 in representing the summer rainfall variation over Taiwan. In contrast, [27,28] focused on gauge-adjusted SPPs, [29] assessed the near-real-time products of IMERG (IMERG-late v5 and IMERG-early v5), and indicated that IMERG-late v5 outperformed IMERG-early v5 in quantitatively depicting summer rainfall formation over Taiwan. However, the near-real-time products of GSMaP (GSMaP-NRT) over Taiwan have not been examined by [29] or in the literature thus far.
Recent studies have compared GSMaP-NRT products with observations and other SPPs over various regions, including China [30], Myanmar [16], Japan [31], Malaysia [32], and South America [33]. Currently, there are many different versions of GSMaP-NRT available for research use, including GSMaP-NRT v6 (hereafter NRT6) and GSMaP-NRT v7 (hereafter NRT7). According to [11,34], the major differences between NRT6 and NRT7 lie in their algorithms: (1) NRT7 uses both TRMM precipitation radar (PR) and GPM dual-frequency PR; (2) the snowfall estimation method is implemented in GPM Microwave Imager (GMI) and Special Sensor Microwave Imager/Sounder (SSMIS) in NRT7 but not in NRT6; and (3) NRT7 improves on the orographic rain correction method using revised estimates and formulas. It is therefore reasonable to expect that NRT7 might be superior to NRT6 for illustrating the rainfall variation over some regions, as has been seen in China [30]; however, it is not clear whether this expectation holds true for Taiwan as well.
Notably, to reduce the bias in NRT products, a new algorithm introducing gauge information was developed by the Japan Aerospace Exploration Agency (JAXA) to produce another product named Gauge-NRT (hereafter GNRT). In general, it would be expected that estimates containing gauge-adjusted information would be more accurate [19,33]. However, in order to produce these estimates as efficiently as possible, GNRT does not use the ground gauge data (which is not available near-real-time) directly for correction [35,36]. Rather, to produce GNRT, NRT data are adjusted using a system model with parameters calculated from the past GSMaP-Gauge data obtained over the previous 30 days [35,36]. Therefore, it is questionable whether GNRT more accurately depicts precipitation than NRT in monitoring rainfall variations over most locations, including Taiwan. To clarify this issue, past studies have examined the differences between GNRT and NRT, and they found that GNRT is superior in depicting the rainfall variation over some regions (e.g., Africa, China, Japan, North and South America) [19,20,30,37]. However, it is also not clear whether this suggestion holds true for Taiwan as well.
This study aims to address the above questions by assessing NRT and GNRT (for both the latest version v7 and its earlier version v6) from May 2017 to April 2020, covering three warm (May–October) and cold (November–April) month periods. Analyses focused on monthly and daily rainfall variations, especially for stronger rainfall events (those with daily accumulated rainfall >80 mm during warm months and >20 mm during cold months). The remainder of the manuscript is organized as follows. Section 2 describes the data and statistical methods applied to the evaluations. The rationale for separating analyses into warm and cold seasons, together with the related results of evaluating the performance of SPPs and possible explanations for the difference between SPPs, is provided in Section 3. Lastly, a summary is presented in Section 4.
2. Data and Methodology
2.1. Data
In this study, we used four SPPs, including v7 and v6 of NRT and GNRT (NRT6, NRT7, GNRT6, and GNRT7) provided by the GSMaP project. GSMaP is a satellite-based precipitation map algorithm that combines various available passive microwave (PMW) and infrared (IR) sensors aimed at developing high-precision precipitation products [38]. To maintain operability in near-real-time, NRT6 and NRT7 only employ forward cloud movement calculated from successive geostationary infrared images. A Kalman filter is then applied to modify the precipitation rate of NRT6 and NRT7 [39]. Both GNRT6 and GNRT7 are derived using corresponding NRT and GSMaP-Gauge data over the past 30 days to further adjust the precipitation over land [11,35]. However, for the gauge-adjustment algorithm used for the GSMaP-Gauge data, the number of gauges used in each 0.5° lat./lon. grid box is considered in GNRT7 but not in GNRT6 [35]. Additional details about the difference between NRT and GNRT, as well as between v6 and v7, can be found in [11].
Following [28], we used hourly gridded rainfall data generated from 436 rain gauge stations provided by the Central Weather Bureau in Taiwan as the reference base to evaluate the performance of SPPs. These data (hereafter CWB) have a spatial resolution of 0.1° × 0.1° (about 10 km × 10 km) and have been widely used in many studies [27,28,29]. For details of the procedure for producing CWB, please refer to [27].
2.2. Statistical Methods Applied for Evaluations
In this study, the correlation coefficients (CC; including temporal correlation coefficient, TCC; and spatial correlation coefficient, SCC) between the CWB and SPPs are calculated as follows:
where i is the index of summation starting from 1, and N is the sample size (e.g., time step or grid point) used for summation. and are each term of the sum extracted from SPP and CWB, respectively. SPP mean and CWB mean is the average of all sample size extracted from SPP and CWB, respectively. The root mean square error (RMSE) between the CWB and SPPs are calculated as follows:
For further details on the calculation of CC and RMSE, please refer to [40]. Hereafter, we define a rainy day as one with accumulated rainfall >0.1 mm·, whereas ≤0.1 mm· is considered non-rainy [29]. In addition, following [29], we categorized the rainfall events into four different strengths: light (0.1–5 mm·), moderate (5–20 mm·), heavy (20–80 mm·), and extreme (>80 mm·). The same criteria have been applied to warm and cold seasons; however, extreme rainfall events primarily occur during the warm season, so we additionally defined stronger rainfall events as daily rainfall >80 mm· in the warm season or >20 mm· in the cold season. Any observed rainfall events below these ranges are termed weaker rainfall events.
3. Results
3.1. Case Study and Annual Rainfall Pattern
First, we used a case study to illustrate why we questioned that GNRT7 (the latest version adjusted by the gauge information) might not be the most suitable near-real-time product of GSMaP for monitoring rainfall variations over Taiwan (with topography given in Figure 1a). Figure 1b depicts an extreme rainfall event on 30 July 2017 where CWB’s daily rainfall measured >200 mm over southern Taiwan. The daily sea-level pressure showed a low system, named typhoon Nesat, around 120° E, 25° N. A comparison between Figure 1a,b shows how the rainfall distribution was affected by the interaction between the low-level cyclonic circulation and local topography. As a result, CWB showed a north–south rainfall contrast with a maximum centered over southern Taiwan.
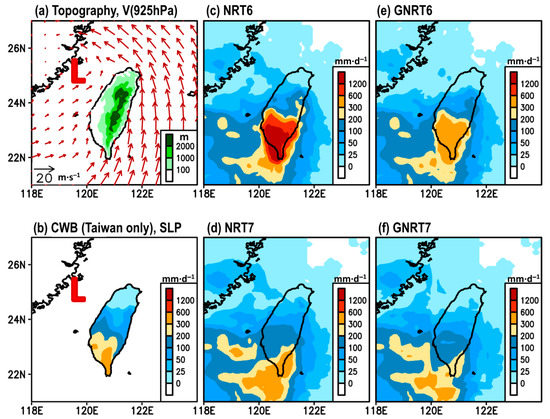
Figure 1.
(a) The topography of Taiwan superimposed with the low-level wind circulation at 925 hPa (denoted as V (925 hPa)) on 30 July 2017, extracted from the fifth generation of European Centre for Medium-Range Weather Forecasts (ECMWF) atmospheric reanalyses (ERA5). Daily accumulated gridded rainfall on 30 July 2017 estimated from: (b) Central Weather Bureau (CWB) (mainland Taiwan only), (c) NRT6, (d) NRT7, (e) GNRT6, and (f) GNRT7. In (b), the red contour represents the distribution of daily mean sea level pressure (SLP) on 30 July 2017 extracted from ERA5. The “L” in (a) and (b) marks the location of Typhoon Nesat.
By comparing CWB (Figure 1b) and SPPs (Figure 1c–f), it was found that (1) all SPPs were able to capture the north–south pattern observed, with larger rainfall over southern Taiwan; (2) NRT6 and GNRT6 tended to overestimate, whereas NRT7 and GNRT7 tended to underestimate the rainfall over southern Taiwan; (3) GNRT (both v6 and v7) tended to have weaker rainfall than the corresponding NRT; and (4) the differences between v6 and v7 were greater over land than the ocean. Statistically, it was found that GNRT6 had a larger SCC and smaller RMSE than GNRT7 when compared to CWB (Table 1). This finding is in contrast to the aforementioned general expectation that the latest version would outperform the earlier. Further, it is noteworthy that NRT7 had a smaller RMSE than GNRT7 (Table 1), a finding that is also in contrast to the expectation that SPPs would quantitatively perform better when adjusted by the gauge information.

Table 1.
Statistical values of spatial correlation coefficient (SCC) and root mean square error (RMSE) for the comparison between CWB and the SPPs shown in Figure 1. The highest SCC and lowest RMSE values are marked with an *. The unit of RMSE is mm·day−1.
To clarify if the above findings from a case study have wider applicability, we examined the performance of SPPs in depicting the climatological (3-year mean) area-averaged monthly rainfall over Taiwan (Figure 2). Visually, all SPPs successfully depicted that a larger rainfall amount occurred during the warm months (May–October) and a smaller rainfall amount during the cold months (November–February), where the definition of warm and cold months is dependent on the temperatures shown in Figure 2. Among all SPPs, only NRT6 showed an obvious overestimation of rainfall in July, whereas the other three SPPs showed an obvious underestimation in August, and either GNRT or NRT showed a similar value between v6 and v7 in June.
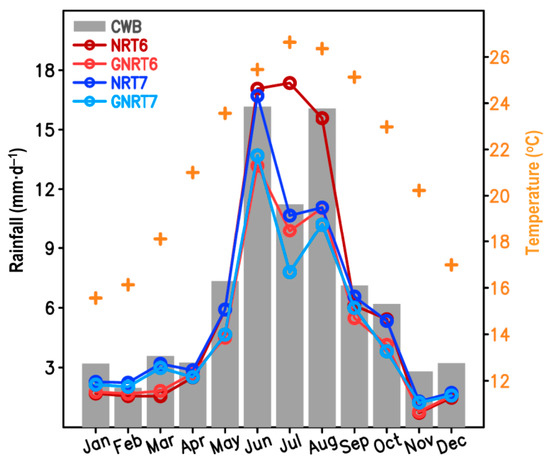
Figure 2.
Monthly mean rainfall in Taiwan averaged from May 2017 to April 2020 as calculated from various sources, including CWB (gray bar), NRT6 (dark red line), GNRT6 (light red line), NRT7 (dark blue line), and GNRT7 (light blue line). The scale of rainfall is given on the left. The monthly mean of surface temperature averaged over Taiwan provided by CWB is presented with a “+” symbol, and the scale can be seen on the right.
By comparing CWB and SPPs in Figure 2, the statistical results indicated that GNRT7 did not have the highest TCC or lowest RMSE (Table 2). Rather, NRT7 had the smallest RMSE, while GNRT6 had the highest TCC. These findings are consistent with Figure 1, showing that GNRT7 is likely not the best choice for studying rainfall variation in Taiwan. However, for both v6 and v7, the differences between NRT and its corresponding GNRT were more pronounced in the warm months (Figure 2). This might be due to the fact that rainfall events are generally stronger in the warm months than in the cold months. This might also imply that the difference between the algorithms of NRT and GNRT is sensitive to the stronger rainfall events. More discussion about this difference will be given later. Additionally, when focusing solely on cold months, we noted that v7 (GNRT7 and NRT7) tended to outperform v6 (GNRT6 and NRT6). Accordingly, the evaluation and discussion of warm and cold months have been separated hereafter.
Table 2.
Statistical values of temporal correlation coefficient (TCC) and RMSE for the comparison between CWB and the SPPs shown in Figure 2. The highest TCC and lowest RMSE values are marked with an *. The unit of RMSE is mm·day−1.
3.2. Rainfall Evaluation for Warm Months
It can be noted from Figure 2 that GNRT tended to have a weaker monthly mean rainfall in the warm months than the corresponding NRT. In particular, the differences between GNRT6 and NRT6 can be clearly seen in summer (June–August). To clarify whether this pattern is mainly attributed to the extreme rainfall events (>80 mm·) like in Figure 1, we evaluated the performance of SPPs in depicting the percentage (in % of total sample sizes) of occurrence frequency of rainfall at different strengths: non-rainy (0–0.1 mm·), light (0.1–5 mm·), moderate (5–20 mm·), heavy (20–80 mm·), and extreme (>80 mm·) [29]. The calculated results for all warm month days from May 2017 to April 2020 (total sample size = 392 grids × 184 days × 3 years) can be seen in Figure 3a.
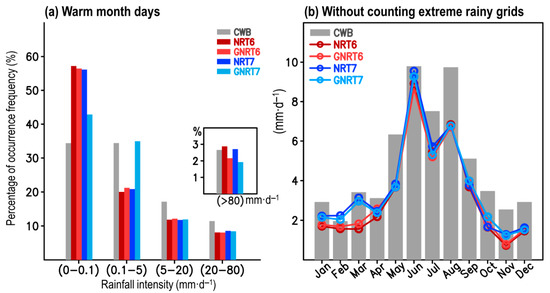
Figure 3.
(a) The distribution of occurrence frequency of three years of (May 2017–April 2020) warm season (May–October) daily rainfall in % of total rainy days, for varying rain strengths: non-rainy (0–0.1 mm∙), light (0.1–5 mm∙), moderate (5–20 mm∙), heavy (20–80 mm∙), and extreme (>80 mm∙). (b) is identical to Figure 2; however, the monthly mean was estimated without the inclusion of extreme rainy grids.
Compared to the reference base CWB, several features were revealed: (1) all SPPs tended to overestimate the percentage of non-rainy grids but underestimate the moderate and heavy rainy grids; (2) GNRT7 outperformed the others in capturing the percentage of non-rainy and light rainy grids but was worse at depicting the percentage of extreme rainy grids; (3) NRT6, GNRT6, and NRT7 had similar errors for all but extreme rainfall types, where NRT6 overestimated, GNRT6 underestimated, and NRT7 was similar to CWB values. As NRT6 only overestimated the non-rainy and extreme rainy grids (Figure 3a), one can infer that NRT6′s overestimation of the monthly mean rainfall in July (Figure 2) could be a result of either the extreme rainy grids or non-rainy grids. In fact, by removing the extreme rainy grids, we noted that the aforementioned NRT6′s overestimation of July rainfall (Figure 2) is not seen in Figure 3b, and the difference between all SPPs is decreased during the warm months. This implies that the major differences between all SPPs during the warm months are primarily a result of the extreme rainy grids.
It should be mentioned that the results shown in Figure 3 do not consider the differences in the localization of the extreme. Additionally, it is not clear whether the most accurate SPPs for monthly averages are also better performers in daily rainfall events. To clarify these issues, point-to-point comparisons were examined between CWB and SPPs using density scatterplots for all daily rainy grids (>0.1 mm·) of the warm months throughout the study period (Figure 4).
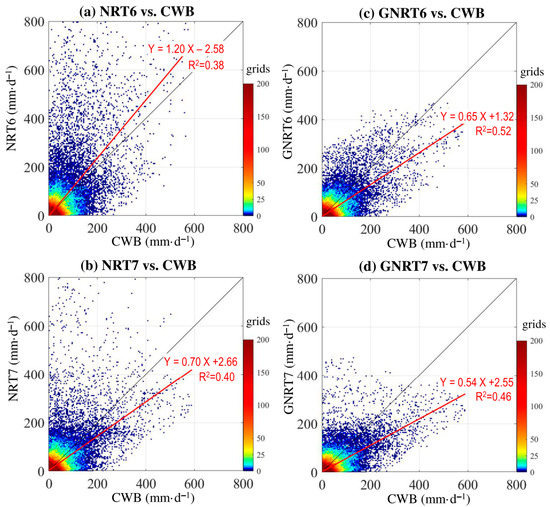
Figure 4.
Scatterplot density of point-to-point comparison for daily rainfall during the warm months of May 2017 to April 2020 between CWB and (a) NRT6, (b) NRT7, (c) GNRT6, and (d) GNRT7. A 1:1 fit line is presented in black, and the red line represents the linear regression using the equation listed. The value of R2 (coefficient of determination) of the linear regression is provided.
Overall, from the distribution of red linear regression lines, we noted that NRT6 tended to overestimate, whereas the other three SPPs tended to underestimate the warm season rainfall. This is consistent with the results of mean monthly rainfall, which showed that only NRT6 overestimated the monthly rainfall in July. However, a comparison between NRT7 (Figure 4b) and its corresponding GNRT7 (Figure 4d) showed that NRT7 also had problems in overestimating some rainfall events, and the overestimations seem to be much improved in GNRT7. Similarly, the overestimations in NRT6 (Figure 4a) seem to be much improved in GNRT6 (Figure 4b). These results imply that GNRTs are better at depicting daily rainfall variations, notably different from the previous findings, which showed that NRTs are superior for depicting monthly rainfall for the warm months.
To provide further statistical evidence, we calculated the correlation coefficient (CC) and RMSE for all rainy grids with CWB >0.1 mm· (Table 3). When compared to CWB for this period, GNRT6 had the largest CC (0.72) and smallest RMSE (25.1 mm·), suggesting that GNRT6 is superior to the other SPPs in depicting the warm season daily rainfall variations. Between NRT and GNRT, the latter generally had better metrics (i.e., larger CC and smaller RMSE) regardless of v6 or v7. This suggests that the application of gauge information to NRT has reduced error in depicting the warm season daily rainfall variations in Taiwan. The difference in rank of the performance of SPPs from Figure 2 and Figure 4 may be attributed to the fact that the area-averaged value (Figure 2) did not consider spatial information, whereas the point-to-point comparison (Figure 4) did. Notably, by separating the calculation of CC and RMSE for stronger rainfall (CWB >80 mm·) and weaker rainfall grids (CWB between 0.1 and 80 mm·) during the warm months, it was found that GNRT6 is superior at either level (Table 3). In addition, the difference between SPPs is more pronounced in stronger rainfall events than in weaker. Therefore, the performance of SPPs in depicting the stronger rainfall grids during the warm months was subsequently examined with respect to spatial distribution.
Table 3.
Statistical values of correlation coefficient (CC) and RMSE for the comparison between CWB and the SPPs shown in Figure 4 for the warm months under three different conditions: all rainfall events (CWB >0.1 mm·), stronger rainfall events (CWB >80 mm·), and weaker rainfall events (CWB is between 0.1 to 80 mm·). The highest CC values, as well as the lowest RMSEs, are marked with an *. The unit of RMSE is mm·day−1.
Figure 5a shows the horizontal distribution of rainfall averaged from all grids with daily CWB rainfall >80 mm· during the warm months from May 2017 to April 2020, compared to the four selected SPPs. Overall, when compared to CWB, it appeared that NRT6 overestimated the stronger rainfall events, mainly over southwestern and eastern Taiwan. After including gauge information, this overestimation was changed to an issue of underestimation seen in GNRT6. Similar to v6, the overestimation seen in NRT7 over eastern Taiwan was changed to an underestimation in GNRT7. These differences between NRTs and GNRTs are consistent with those inferred from Figure 2, Figure 3 and Figure 4. Similar underestimation issues to those seen in GNRTs are also noted by [30] across other regions of the world. To further clarify the performances of SPPs, we calculated the corresponding RMSE between CWB and SPPs. As noted by the RMSE values (Figure 5b), the major improvement from NRT6 to GNRT6 (i.e., RMSE is smaller) occurred over southwestern Taiwan and eastern Taiwan. Similarly, the major improvement from NRT6 to NRT7 also occurred over southwestern Taiwan, but the errors in eastern Taiwan did not show much reduction. In contrast, there was a major improvement in eastern Taiwan from NRT7 to GNRT7 (Figure 5b). Among SPPs, GNRT6 had the smallest RMSE over most Taiwan (Figure 5b), supporting the idea that it is the most suitable product for monitoring stronger rainfall events during the warm months. Notably, the enhanced performance of GNRT6 over GNRT7 is more obvious in southern Taiwan (Figure 5a), where there is greater rainfall during warm months [41] and is consistent with what was revealed in Figure 1 during the case study.
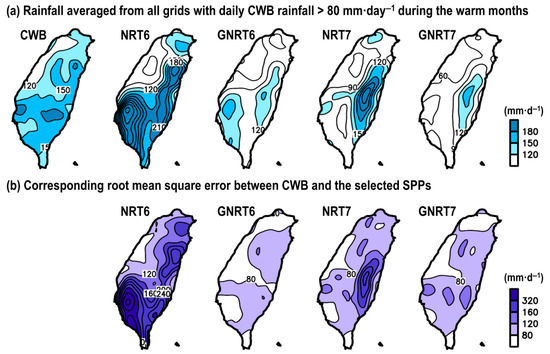
Figure 5.
(a) Spatial distribution of rainfall averaged from grids with CWB’s daily rainfall >80 mm· during warm months of May 2017 to April 2020, estimated from CWB, NRT6, GNRT6, NRT7, and GNRT7. (b) The related root mean square error (RMSE) between CWB and each SPP for the grids meeting the same criterion.
3.3. Rainfall Evaluation for Cold Months
Next, an analysis of the performance of SPPs in cold months was conducted to help determine whether SPPs’ performances differed between warm and cold months. First, we focused on the occurrence frequency of rainfall during the cold months of the study period. Figure 6 shows that all SPPs overestimated non-rainy grids, but underestimated moderate and stronger rainfall grids (>20 mm·). This may be the reason why all SPPs showed an underestimation of monthly rainfall in cold months (Figure 2). Relative to v6 products, v7 products performed better (i.e., the frequency of v7 is closer to CWB than v6; Figure 6). This might be part of the reason why v7 products were superior to v6 products in estimating the monthly rainfall during cold months (Figure 2). Similarly, consistent with the results shown in Figure 2 for the cold months, there are not many differences observed between GNRT and NRT regardless of v6 or v7 (Figure 6).
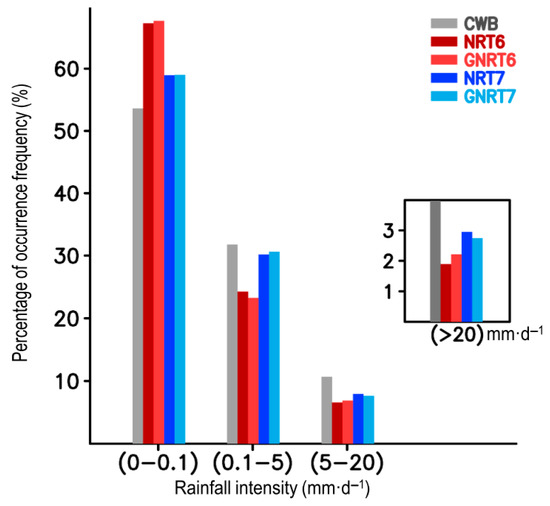
Figure 6.
Distribution of occurrence frequency of daily rainfall (in % of total rainy days) for the cold months of May 2017 to April 2020 for varying rain strengths: non-rainy (0–0.1 mm), light (0.1–5 mm), moderate (5–20 mm), and heavy or extreme (>20 mm).
Figure 7 shows the point-to-point comparison between CWB and SPPs for all rainy days during the cold months throughout the study period. Visually, from the distribution of red linear regression lines, we noted that all SPPs tended to underestimate the daily rainfall during the cold months. The major difference between NRT6 (Figure 7a) and GNRT6 (Figure 7c) is that the former greatly overestimated some stronger rainfall grids (>20 mm·), while this error is reduced in the latter. A similar improvement was also revealed from NRT7 (Figure 7b) to GNRT7 (Figure 7d).
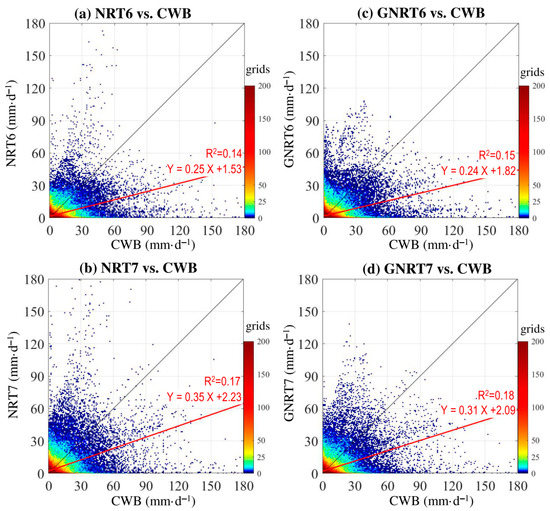
Figure 7.
Scatterplot density of point-to-point comparison for daily rainfall during the cold months of May 2017 to April 2020 between CWB and (a) NRT6, (b) NRT7, (c) GNRT6, and (d) GNRT7. A 1:1 fit line is presented in black, and the red line represents the linear regression using the equation listed. The value of R2 (coefficient of determination) of the linear regression is provided.
Statistically, when compared to all rainfall events in CWB (>0.1 mm·), GNRT7 (CC = 0.43, RMSE = 12.1 mm·) is superior to the other SPPs in depicting daily rainfall variation over Taiwan during cold months (Table 4). Comparatively, this is different from what was seen in Figure 4 and Table 3, which showed that GNRT6 is the best for depicting the daily rainfall during warm months. In addition, when separating the calculation for stronger rainfall (CWB >20 mm·) and weaker rainfall events (CWB~0.1–20 mm·) during the cold months, although the statistical values of all SPPs are close, GNRT7 is better than the others for monitoring cold season daily rainfall variation in Taiwan at either level. To further reveal the spatial variation between the performances of SPPs in depicting the cold season stronger rainfall events, we constructed the horizontal distribution of rainfall averaged from all grids with daily CWB rainfall >20 mm· and compared to the four selected SPPs (Figure 8a).
Table 4.
Statistical values of CC and RMSE for the comparison between CWB and the SPPs shown in Figure 7 for the cold months under three different conditions: all rainfall events (CWB >0.1 mm·), stronger rainfall events (CWB >20 mm·), and weaker rainfall events (CWB is between 0.1 to 20 mm·). The highest CC values, as well as the lowest RMSEs, are marked with an *. The unit of RMSE is mm·day−1.
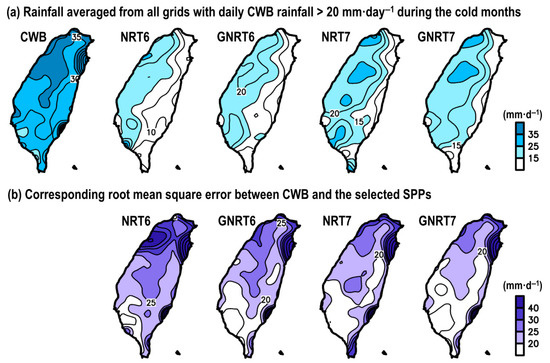
Figure 8.
(a) Spatial distribution of rainfall averaged from grids with CWB’s daily rainfall >20 mm· during cold months of May 2017 to April 2020, estimated from CWB, NRT6, GNRT6, NRT7, and GNRT7. (b) The related root mean square error (RMSE) between CWB and each SPP for the grids meeting the same criterion.
When compared to CWB, all SPPs underestimated stronger rainfall events during the cold months; in particular, they cannot capture the stronger rainfall distribution that occurred over northeastern Taiwan. It also appeared that v7’s rainfall estimation was closer to CWB (Figure 8a). By calculating the related RMSE (Figure 8b), it was shown that all SPPs had a larger error in northern Taiwan compared to the south. From NRT6 to GNRT6, the major improvement (i.e., smaller RMSE) was seen over northwestern and southwestern Taiwan. A similar improvement over southwestern Taiwan is also revealed from NRT7 to GNRT7 (Figure 8b). Altogether, it seems that monitoring of stronger rainfall events over southwestern Taiwan using GNRT has led to an improvement, regardless of whether it is v6 or v7, or for warm (Figure 5b) or cold months (Figure 8b). However, although GNRT6 is best for monitoring stronger rainy grids during warm months (Figure 5), GNRT7 has the smallest RMSE for depicting the stronger rainy grids during cold months (Figure 8). This seasonal difference should be considered for further research interested in using GSMaP near-real-time products in monitoring stronger rainfall events over Taiwan.
3.4. More Discussions and Explanations for the Difference Between SPPs
To further clarify the improvement from NRTs to GNRTs, we examined how the stronger rainy grids (>80 mm·) in NRTs were changed in GNRTs for the warm months during the study period (Figure 9). It is noted that GNRTs helped reduce the error seen in NRTs’ stronger rainfall events for warm months in both v6 and v7 (Figure 9). Contrarily, we noted that GNRTs also helped reduce the bias seen in NRTs’ stronger rainfall events (>20 mm·) for cold months (Figure 10), but the improvement is not as defined as in the warm months (Figure 9). The related values of CC and RMSE calculated from the data shown in Figure 9 (Figure 10) are given in Table 5 (Table 6). Again, one can note from Table 5 (Table 6) that GNRT6 (GNRT7) is superior for studying stronger rainfall events in warm (cold) months. Apparently, the feature seen in warm months is different from the general expectation that the latest version (i.e., GNRT7) should perform better than its predecessor. Some explanations for this feature might be inferred from Figure 5. As can be seen, prior to including the gauge information using statistical methods, NRT7 is indeed superior to NRT6 in monitoring stronger rainfall events in warm months. It can be concluded then that the reason GNRT7 is worse than GNRT6 stems from the statistical methods applied for including the gauge information (gauge-adjustment algorithm) [11]. Algorithm improvements should be sought in the production of future versions of GNRT.
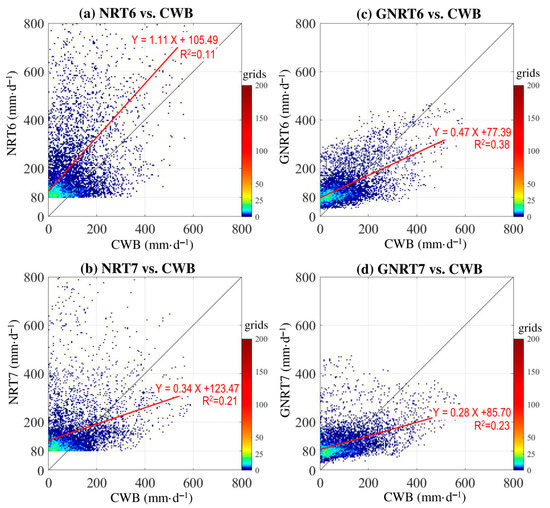
Figure 9.
Rainy grids >80 mm during the warm months of May 2017 to April 2020 estimated from (a) NRT6 and (b) NRT7, and compared to CWB. (c) is related to (a) and shows how the rainy grids with NRT6 > 80 mm· are estimated by GNRT6 and CWB. (d) is related to (b) and shows how the rainy grids with NRT7 >80 mm· are estimated by GNRT6 and CWB. A 1:1 fit is represented by the black line, and the red line represents the linear regression using with equation listed. The value of R2 (coefficient of determination) of the linear regression is provided.
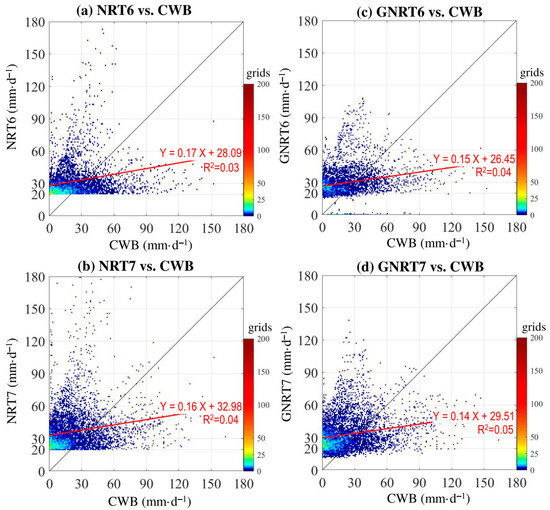
Figure 10.
Rainy grids >20 mm· during the cold months of May 2017 to April 2020 estimated from (a) NRT6 and (b) NRT7, and compared to CWB. (c) is related to (a) and shows how the rainy grids with NRT6 >20 mm· are estimated by GNRT6 and CWB. (d) is related to (b) and shows how the rainy grids with NRT7 >20 mm· are estimated by GNRT6 and CWB. A 1:1 fit is represented by the black line, and the red line represents a linear regression using the equation listed. The value of R2 (coefficient of determination) of the linear regression is provided.
As for why NRT7 is better than NRT6 in both the warm and cold months (Table 5 and Table 6), the reason might be that NRT7 includes GPM dual-frequency PR, which is more accurate in estimating rainfall [11,34]. In addition, NRT7 improves on the orographic rain correction method [11,34], which can better present the rainfall distribution over regions with complex terrain, such as Taiwan.
4. Conclusions
This study examined the performance of near-real-time products of GSMaP (including NRT6, NRT7, GNRT6, and GNRT7) in depicting the monthly and daily rainfall variation over Taiwan. Analyses were focused on the period from May 2017 to April 2020 and split into the warm (May–October) and cold months (November–April). The major findings are summarized as follows:
- (1)
- For the annual cycle of monthly rainfall, NRT7 is superior in quantitative rainfall estimation (Figure 2). Among SPPs, most of them underestimated the monthly rainfall throughout the year (except NRT6, which overestimated July rainfall), and the observed errors were larger in the GNRTs than the NRTs. The differences between NRT and GNRT in depicting monthly rainfall are larger during warm months than during cold months. For monthly rainfall during the cold months, v7 performed better than v6, although this was not always true for the warm months. The differences between SPPs in depicting the monthly rainfall variations are mainly controlled by the stronger rainfall events (Figure 3).
- (2)
- Among the four SPPs, GNRT6 and GNRT7 were the best in capturing the daily rainfall variations, including stronger rainfall events during warm (Figure 4 and Figure 5) and cold months (Figure 6 and Figure 7), respectively. Spatially, the major improvements from NRT6 to GNRT6 and NRT7 to GNRT7 in monitoring the stronger rainfall events over southwestern Taiwan can be seen during warm and cold months, respectively. Between NRT6 and NRT7, NRT7 was better at monitoring larger daily rainfall over southwestern Taiwan during both warm and cold months.
- (3)
- GNRT helped reduce the error seen in NRT’s overestimation of stronger rainfall events for both warm and cold months in v6 and v7 (Figure 9 and Figure 10). NRT7 is better than NRT6 in both the warm and cold months. Possible explanations for the differences between the ability of SPPs are attributed to the algorithms used in SPPs.
The above findings help us understand the uncertainty of using GSMaP near-real-time products in studying the daily and monthly rainfall variations over Taiwan. Based on these results, we have shown that different near-real-time SPPs should be used for monitoring and studying rainfall variations over Taiwan for different purposes (e.g., warning of floods in different seasons, and studying monthly or daily precipitation features in different seasons). In particular, it should be noted that GNRT7 is not superior to GNRT6 in monitoring extreme rainfall over Taiwan during the warm months. Thus, the next generation of GSMaP near-real-time products stands to be improved. Based on the conclusion of this study, we would suggest that the improvement should be given in the extreme rainfall events during the warm months. In addition, a construction of gauge bias correction function depending on the month or depending on rainfall rate might be helpful for the improvement.
Author Contributions
Conceptualization, W.-R.H.; data curation, P.-Y.L. and J.H., investigation, W.-R.H. and P.-Y.L.; software, P.-Y.L. and J.H.; writing—original draft, W.-R.H.; writing—review and editing, W.-R.H., P.-Y.L., J.H., X.L. and L.D. All authors have read and agreed to the published version of the manuscript.
Funding
This research was funded by the Ministry of Science and Technology of Taiwan under MOST 106-2628-M-003-001-MY4 and MOST 109-2625-M-003-004. X.L. was supported by National Natural Science Foundation of China (Project No. 41775043 and 42088101), and Guangdong Province Key Laboratory for Climate Change and Natural Disaster Studies (Grant 2020B1212060025). L.D. was supported by the National Natural Science Foundation of China (Grant No.41875071), “Yangfan” Talent Project of Guangdong Province (Grant No. 000001005) and Doctoral Fund of Guangdong Ocean University (Grant No. R17002).
Acknowledgments
We thank the provider of GSMaP and CWB data.
Conflicts of Interest
The authors declare no conflict of interest.
References
- Mao, J.; Wu, G. Diurnal variations of summer precipitation over the Asian monsoon region as revealed by TRMM satellite data. Sci. China Earth Sci. 2012, 55, 554–566. [Google Scholar] [CrossRef]
- Xu, W. Precipitation and Convective Characteristics of Summer Deep Convection over East Asia Observed by TRMM. Mon. Weather Rev. 2013, 141, 1577–1592. [Google Scholar] [CrossRef]
- Hsu, H.H.; Zhou, T.; Matsumoto, J. East Asian, Indochina and Western North Pacific Summer Monsoon—An update. Asia Pac. J. Atmos. Sci. 2014, 50, 45–68. [Google Scholar] [CrossRef]
- Huang, W.R.; Wang, S.Y. Impact of land-sea breezes at different scales on the diurnal rainfall in Taiwan. Clim. Dyn. 2014, 43, 1951–1963. [Google Scholar] [CrossRef]
- Chen, G.; Sha, W.; Iwasaki, T.; Wen, Z. Diurnal Cycle of a Heavy Rainfall Corridor over East Asia. Mon. Weather Rev. 2017, 145, 3365–3389. [Google Scholar] [CrossRef]
- Fu, Y.F.; Pan, X.; Yang, Y.J.; Chen, F.J.; Liu, P. Climatological characteristics of summer precipitation over East Asia measured by TRMM PR: A review. J. Meteorol. Res. 2017, 31, 142–159. [Google Scholar] [CrossRef]
- Huang, W.R.; Chang, Y.H. Impact of Boreal Summer Intraseasonal Oscillations on Warm Season Diurnal Convection Activity in Taiwan. Int. J. Climatol. 2018, 38, 2187–2200. [Google Scholar] [CrossRef]
- Huffman, G.J.; Bolvin, D.T.; Nelkin, E.J.; Wolff, D.B.; Adler, R.F.; Gu, G.; Hong, Y.; Bowman, K.P.; Stocker, E.F. The TRMM multisatellite precipitation analysis (TMPA): Quasi-global, multiyear, combined-sensor precipitation estimates at fine scales. J. Hydrometeorol. 2007, 8, 38–55. [Google Scholar] [CrossRef]
- Kubota, T.; Shige, S.; Hashizume, H.; Aonashi, K.; Takahashi, N.; Seto, S.; Hirose, M.; Takayabu, Y.N.; Ushio, T.; Nakagawa, K. Global precipitation map using satellite-borne microwave radiometers by the GSMaP project: Production and validation. IEEE Trans. Geosci. Remote Sens. 2007, 45, 2259–2275. [Google Scholar] [CrossRef]
- Huffman, G.J.; Bolvin, D.T.; Nelkin, E.J.; Stocker, E.F.; Tan, J. V06 IMERG Release Notes; NASA/GSFC: Greenbelt, MD, USA, 2019. [Google Scholar]
- Kubota, T.; Aonashi, K.; Ushio, T.; Shige, S.; Takayabu, Y.N.; Kachi, M.; Arai, Y.; Tashima, T.; Masaki, T.; Kawamoto, N.; et al. Global Satellite Mapping of Precipitation (GSMaP) Products in the GPM Era. In Satellite Precipitation Measurement. Advances in Global Change Research, 1st ed.; Levizzani, V., Kidd, C., Kirschbaum, D., Kummerow, C., Nakamura, K., Turk, F., Eds.; Springer: Berlin/Heidelberg, Germany, 2020; Volume 67. [Google Scholar]
- Derin, Y.; Anagnostou, E.; Berne, A.; Borga, M.; Boudevillain, B.; Buytaert, W.; Chang, C.-H.; Chen, H.; Delrieu, G.; Hsu, Y.C.; et al. Evaluation of GPM-era Global Satellite Precipitation Products over Multiple Complex Terrain Regions. Remote Sens. 2019, 11, 2936. [Google Scholar] [CrossRef]
- Liu, C.Y.; Aryastana, P.; Liu, G.R.; Huang, W.R. Assessment of satellite precipitation product estimates over Bali Island. Atmos. Res. 2020, 244, 105032. [Google Scholar] [CrossRef]
- Lu, D.; Yong, B. Evaluation and Hydrological Utility of the Latest GPM IMERG V5 and GSMaP V7 Precipitation Products over the Tibetan Plateau. Remote Sens. 2018, 10, 2022. [Google Scholar] [CrossRef]
- Tan, M.L.; Duan, Z. Assessment of GPM and TRMM Precipitation Products over Singapore. Remote Sens. 2017, 9, 720. [Google Scholar] [CrossRef]
- Yuan, F.; Zhang, L.; Soe, K.M.W.; Ren, L.; Zhao, C.; Zhu, Y.; Jiang, S.; Liu, Y. Applications of TRMM- and GPM-Era Multiple- Satellite Precipitation Products for Flood Simulations at Sub-Daily Scales in a Sparsely Gauged Watershed in Myanmar. Remote Sens. 2019, 11, 140. [Google Scholar] [CrossRef]
- Ning, S.; Song, F.; Udmale, P.; Jin, J.; Thapa, B.R.; Ishidaira, H. Error Analysis and Evaluation of the Latest GSMap and IMERG Precipitation Products over Eastern China. Adv. Meteorol. 2017, 2017, 1–16. [Google Scholar] [CrossRef]
- Tan, X.; Yong, B.; Ren, L. Error features of the hourly GSMaP multi-satellite precipitation estimates over nine major basins of China. Hydrol. Res. 2018, 49, 761–779. [Google Scholar] [CrossRef]
- Shi, J.; Yuan, F.; Shi, C.; Zhao, C.; Zhang, L.; Ren, L.; Zhu, Y.; Jiang, S.; Liu, Y. Statistical Evaluation of the Latest GPM-Era IMERG and GSMaP Satellite Precipitation Products in the Yellow River Source Region. Water 2020, 12, 1006. [Google Scholar] [CrossRef]
- Tang, G.Q.; Zeng, Z.; Ma, M.; Liu, R.; Wen, Y.; Hon, Y. Can near–real–time satellite precipitation products capture rainstorms and guide flood warning for the 2016 summer in south China? IEEE Geosci. Remote Sens. 2017, 14, 1208–1212. [Google Scholar] [CrossRef]
- Chen, T.C.; Huang, W.R.; Yen, M.C. Interannual variation of the late spring–early summer monsoon rainfall in the northern part of the South China Sea. J. Clim. 2011, 24, 4295–4313. [Google Scholar] [CrossRef]
- Kerns, B.W.J.; Chen, Y.L.; Chang, M.Y. The diurnal cycle of winds, rain, and clouds over Taiwan during the Mei-yu, summer, and autumn rainfall regimes. Mon. Weather Rev. 2010, 138, 497–516. [Google Scholar] [CrossRef]
- Wu, Y.C.; Wang, S.Y.; Yu, Y.C.; Kung, C.Y.; Wang, A.H.; Los, S.A.; Huang, W.R. Climatology and Change of Extreme Precipitation Events in Taiwan Based on Weather Types. Int. J. Climatol. 2019, 39, 5351–5366. [Google Scholar] [CrossRef]
- Yen, M.C.; Chen, T.C. Seasonal variation of the rainfall over Taiwan. Int. J. Climatol. 2000, 20, 803–809. [Google Scholar] [CrossRef]
- Chen, C.; Chen, Y. The Rainfall Characteristics of Taiwan. Mon. Weather Rev. 2003, 131, 1323–1341. [Google Scholar] [CrossRef]
- Huang, W.R.; Chang, Y.H. Characteristics and Mechanisms of the Diurnal Variation of Winter Precipitation in Taiwan. Int. J. Climatol. 2018, 38, 3058–3068. [Google Scholar] [CrossRef]
- Huang, W.R.; Chang, Y.H.; Liu, P.Y. Assessment of IMERG precipitation over Taiwan at multiple timescales. Atmos. Res. 2018, 214, 239–249. [Google Scholar] [CrossRef]
- Huang, W.R.; Liu, P.Y.; Chang, Y.H.; Liu, C.Y. Evaluation and Application of Satellite Precipitation Products in Studying the Summer Precipitation Variations over Taiwan. Remote Sens. 2020, 12, 347. [Google Scholar] [CrossRef]
- Liu, P.Y.; Huang, W.R. Comparison of the warm season rainfall estimations in Taiwan during 2014–2017 from IMERG version 5 Early, Late and Final run satellite products. J. Geogr. Sci. 2020, 96, 1–26. (In Chinese) [Google Scholar]
- Lu, D.; Yong, B. A Preliminary Assessment of the Gauge-Adjusted Near-Real-Time GSMaP Precipitation Estimate over Mainland China. Remote Sens. 2020, 12, 141. [Google Scholar] [CrossRef]
- Mastrantonas, N.; Bhattacharya, B.; Shibuo, Y.; Rasmy, M.; Espinoza-Dávalos, G.; Solomatine, D. Evaluating the Benefits of Merging Near-Real-Time Satellite Precipitation Products: A Case Study in the Kinu Basin Region, Japan. J. Hydrometeorol. 2019, 20, 1213–1233. [Google Scholar] [CrossRef]
- Tam, T.H.; Abd Rahman, M.Z.; Harun, S.; Hanapi, M.N.; Kaoje, I.U. Application of Satellite Rainfall Products for Flood Inundation Modelling in Kelantan River Basin, Malaysia. Hydrology 2019, 6, 95. [Google Scholar] [CrossRef]
- Palharini, R.S.A.; Vila, D.A.; Rodrigues, D.T.; Quispe, D.P.; Palharini, R.C.; de Siqueira, R.A.; de Sousa Afonso, J.M. Assessment of the Extreme Precipitation by Satellite Estimates over South America. Remote Sens. 2020, 12, 2085. [Google Scholar] [CrossRef]
- Kubota, T.; Liu, G.; Tashima, T.; Oki, R. Development of snowfall estimation method in Global Satellite Mapping of Precipitation (GSMaP) product. In Proceedings of the Japan Geoscience Union Meeting 2018, Chiba, Japan, 20–24 May 2018. [Google Scholar]
- Mega, T.; Ushio, T.; Matsuda, M.T.; Kubota, T.; Kachi, M.; Oki, R. Gauge-adjusted global satellite mapping of precipitation. IEEE Trans. Geosci. Remote Sens. 2019, 57, 1928–1935. [Google Scholar] [CrossRef]
- Tashima, T.; Kubota, T.; Mega, T.; Ushio, T.; Oki, R. Precipitation Extremes Monitoring Using the Near-Real-Time GSMaP Product. IEEE J. Sel. Top. Appl. Earth Observ. Remote Sens. 2020, 13, 5640–5651. [Google Scholar] [CrossRef]
- Chen, H.; Yong, B.; Shen, Y.; Liu, J.; Hong, Y.; Zhang, J. Comparison analysis of six purely satellite-derived global precipitation estimates. J. Hydrol. 2020, 581, 124376. [Google Scholar] [CrossRef]
- Kachi, M.; Kubota, T.; Ushio, T.; Shige, S.; Kida, S.; Aonashi, K.; Okamoto, K. Development and utilization of “JAXA Global Rainfall Watch” system. IEEJ Trans. Fundam. Mater. 2011, 131, 729–737, (In Japanese with English abstract). [Google Scholar] [CrossRef]
- Ushio, T.; Kubota, T.; Shige, S.; Okamoto, K.; Aonashi, K.; Inoue, T.; Takahashi, N.; Iguchi, T.; Kachi, M.; Oki, R.; et al. A Kalman filter approach to the Global Satellite Mapping of Precipitation (GSMaP) from combined passive microwave and infrared radiometric data. J. Meteorol. Soc. Jpn. 2009, 87A, 137–151. [Google Scholar] [CrossRef]
- Storch, H.V.; Zwiers, F.W. Statistical Analysis in Climate Research, 1st ed.; Cambridge University Press: Cambridge, UK, 1999. [Google Scholar]
- Huang, W.R.; Chang, Y.H.; Hsu, H.H.; Cheng, C.T.; Tu, C.Y. Dynamical Downscaling Simulation and Future Projection of Summer Rainfall in Taiwan: Contributions from Different Types of Rain Events. J. Geophys. Res. Atmos. 2016, 121, 13973–13988. [Google Scholar] [CrossRef]


Publisher’s Note: MDPI stays neutral with regard to jurisdictional claims in published maps and institutional affiliations. |
© 2021 by the authors. Licensee MDPI, Basel, Switzerland. This article is an open access article distributed under the terms and conditions of the Creative Commons Attribution (CC BY) license (http://creativecommons.org/licenses/by/4.0/).