Article

A Novel Method for Automated Supraglacial Lake Mapping in Antarctica Using Sentinel-1 SAR Imagery and Deep Learning

1
German Remote Sensing Data Center (DFD), German Aerospace Center (DLR), Muenchener Str. 20, 82234 Wessling, Germany
2
Institute of Geography and Geology, University Wuerzburg, Am Hubland, 97074 Wuerzburg, Germany
*
Author to whom correspondence should be addressed.
Remote Sens. 2021, 13(2), 197; https://doi.org/10.3390/rs13020197
Submission received: 9 December 2020 / Revised: 4 January 2021 / Accepted: 6 January 2021 / Published: 8 January 2021

Abstract

:
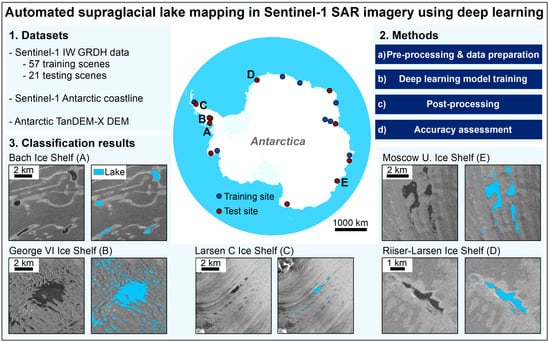
Supraglacial meltwater accumulation on ice sheets can be a main driver for accelerated ice discharge, mass loss, and global sea-level-rise. With further increasing surface air temperatures, meltwater-induced hydrofracturing, basal sliding, or surface thinning will cumulate and most likely trigger unprecedented ice mass loss on the Greenland and Antarctic ice sheets. While the Greenland surface hydrological network as well as its impacts on ice dynamics and mass balance has been studied in much detail, Antarctic supraglacial lakes remain understudied with a circum-Antarctic record of their spatio-temporal development entirely lacking. This study provides the first automated supraglacial lake extent mapping method using Sentinel-1 synthetic aperture radar (SAR) imagery over Antarctica and complements the developed optical Sentinel-2 supraglacial lake detection algorithm presented in our companion paper. In detail, we propose the use of a modified U-Net for semantic segmentation of supraglacial lakes in single-polarized Sentinel-1 imagery. The convolutional neural network (CNN) is implemented with residual connections for optimized performance as well as an Atrous Spatial Pyramid Pooling (ASPP) module for multiscale feature extraction. The algorithm is trained on 21,200 Sentinel-1 image patches and evaluated in ten spatially or temporally independent test acquisitions. In addition, George VI Ice Shelf is analyzed for intra-annual lake dynamics throughout austral summer 2019/2020 and a decision-level fused Sentinel-1 and Sentinel-2 maximum lake extent mapping product is presented for January 2020 revealing a more complete supraglacial lake coverage (~770 km2) than the individual single-sensor products. Classification results confirm the reliability of the proposed workflow with an average Kappa coefficient of 0.925 and a F 1 -score of 93.0% for the supraglacial water class across all test regions. Furthermore, the algorithm is applied in an additional test region covering supraglacial lakes on the Greenland ice sheet which further highlights the potential for spatio-temporal transferability. Future work involves the integration of more training data as well as intra-annual analyses of supraglacial lake occurrence across the whole continent and with focus on supraglacial lake development throughout a summer melt season and into Antarctic winter.

Graphical Abstract

1. Introduction

With accelerating climate change, the global ice sheets are melting at ever-increasing rates. Between 1992 and 2018, the Greenland ice sheet (GrIS) lost 3902 ± 342 billion tonnes of ice, equivalent to ~10.8 mm of global sea-level-rise (SLR) [1]. Similarly, Antarctica lost 2720 ± 1390 billion tonnes of ice during 1992–2017 and contributed ~7.6 mm to global SLR [2]. While ice mass loss on the GrIS due to glacier dynamics and particularly surface melting has been monitored and discussed extensively (e.g., [3,4,5]), the impact of surface melting on mass changes on the Antarctic ice sheet (AIS) has not been investigated in sufficient detail. As the AIS holds ~91% of the global ice mass and represents the largest uncertainty in current projections of global sea-level-rise, it is yet of essential need to understand the response of Antarctic outlet glaciers to further increasing surface air temperatures resulting in enhanced surface melting and the formation of an increasing number of supraglacial lakes in local surface depressions of the ice sheet. Supraglacial meltwater accumulation can impact ice sheet dynamics and mass balance through three main processes (A-C, Figure 1) [5]. First, meltwater injection to the glacier bed can alter the basal conditions and enhance sliding ultimately leading to transient ice flow accelerations and increased ice discharge (A, Figure 1) [5], as observed over the Greenland ice sheet (e.g., [6,7,8,9,10]). Second, surface melting and runoff causes ice thinning which directly affects surface mass balance (SMB) (B, Figure 1) [5]. The third process results from the repeated filling and draining of supraglacial lakes into fractures or crevasses initiating their downward propagation and consequent removal of ice shelves or small icebergs, also referred to as hydrofracturing (C, Figure 1) [5,11]. Ice shelf removal causes rapid ice flow accelerations and increased ice discharge through the loss of the efficient buttressing force exerted on the inland ice, as documented after several ice shelf collapses along the Antarctic Peninsula (API) (e.g., [12,13,14,15]). Another important aspect to consider are positive feedback mechanisms that further trigger surface melting, e.g., through an increased absorption of solar radiation hence a decreasing surface albedo caused by the increasing abundance of supraglacial meltwater (D, Figure 1) [16,17,18,19]. Similarly, increased surface melting leads to an increasing appearance of rock outcrop which again decreases surface albedo and enhances ice melting and lake ponding (D, Figure 1). Figure 1 illustrates supraglacial meltwater features at an ocean-terminating outlet glacier as well as the main processes acting on ice sheet dynamics and mass balance.
To enable more detailed analyses on the effects of supraglacial meltwater accumulation on Antarctic ice dynamics, mass balance, or ice shelf stability, a thorough mapping of the Antarctic surface hydrological network is required. For this purpose, spaceborne remote sensing is an ideal tool and enables both, unprecedented spatial coverage and high temporal resolution compared to ground-based mapping efforts. In addition to several local- and regional-scale investigations using manual to semi-automated mapping techniques (e.g., [18,19,20,21,22,23,24]), only few studies implemented algorithms for either automated or continent-wide mapping of Antarctic supraglacial lakes in optical satellite imagery. Of these, Moussavi et al. [25] used optical Landast 8 and Sentinel-2 data in combination with fixed band and index thresholding to automatically extract supraglacial lake extents and volumes over four East Antarctic ice shelves. Next, Halberstadt et al. [26] employed unsupervised k-means clustering on Landsat 8 scenes over two East Antarctic ice shelves to train a suite of supervised classifiers and Dell et al. [24] advanced the “FAST” (Fully Automated Supraglacial lake area and volume Tracking) algorithm [27] to automatically track supraglacial lakes in Landsat 8 and Sentinel-2 imagery over Nivlisen Ice Shelf, East Antarctica. Finally, our companion paper [28] presented an automated Sentinel-2 supraglacial lake classification algorithm developed on basis of a random forest (RF) classifier and was tested on spatially and temporally independent acquisitions distributed across the Antarctic continent. While these studies rely on the use of optical multi-spectral data, synthetic aperture radar (SAR) data are currently used for mainly visual interpretation and evaluation of Antarctic supraglacial lakes (e.g., [22,29]). In fact, an automated or spatially transferable supraglacial lake detection algorithm using SAR data is entirely missing. Given the advantage of SAR data, e.g., for detection of subsurface lakes or considering its year-round as well as all-weather imaging capabilities, the development of an automated SAR-based mapping method is overdue. In this context, year-round image acquisitions are particularly suitable for analyses on intra-annual lake dynamics revealing whether lakes refreeze or drain at the onset of Antarctic winter as well as for delivery of complementary mapping products to optical lake extent classifications.
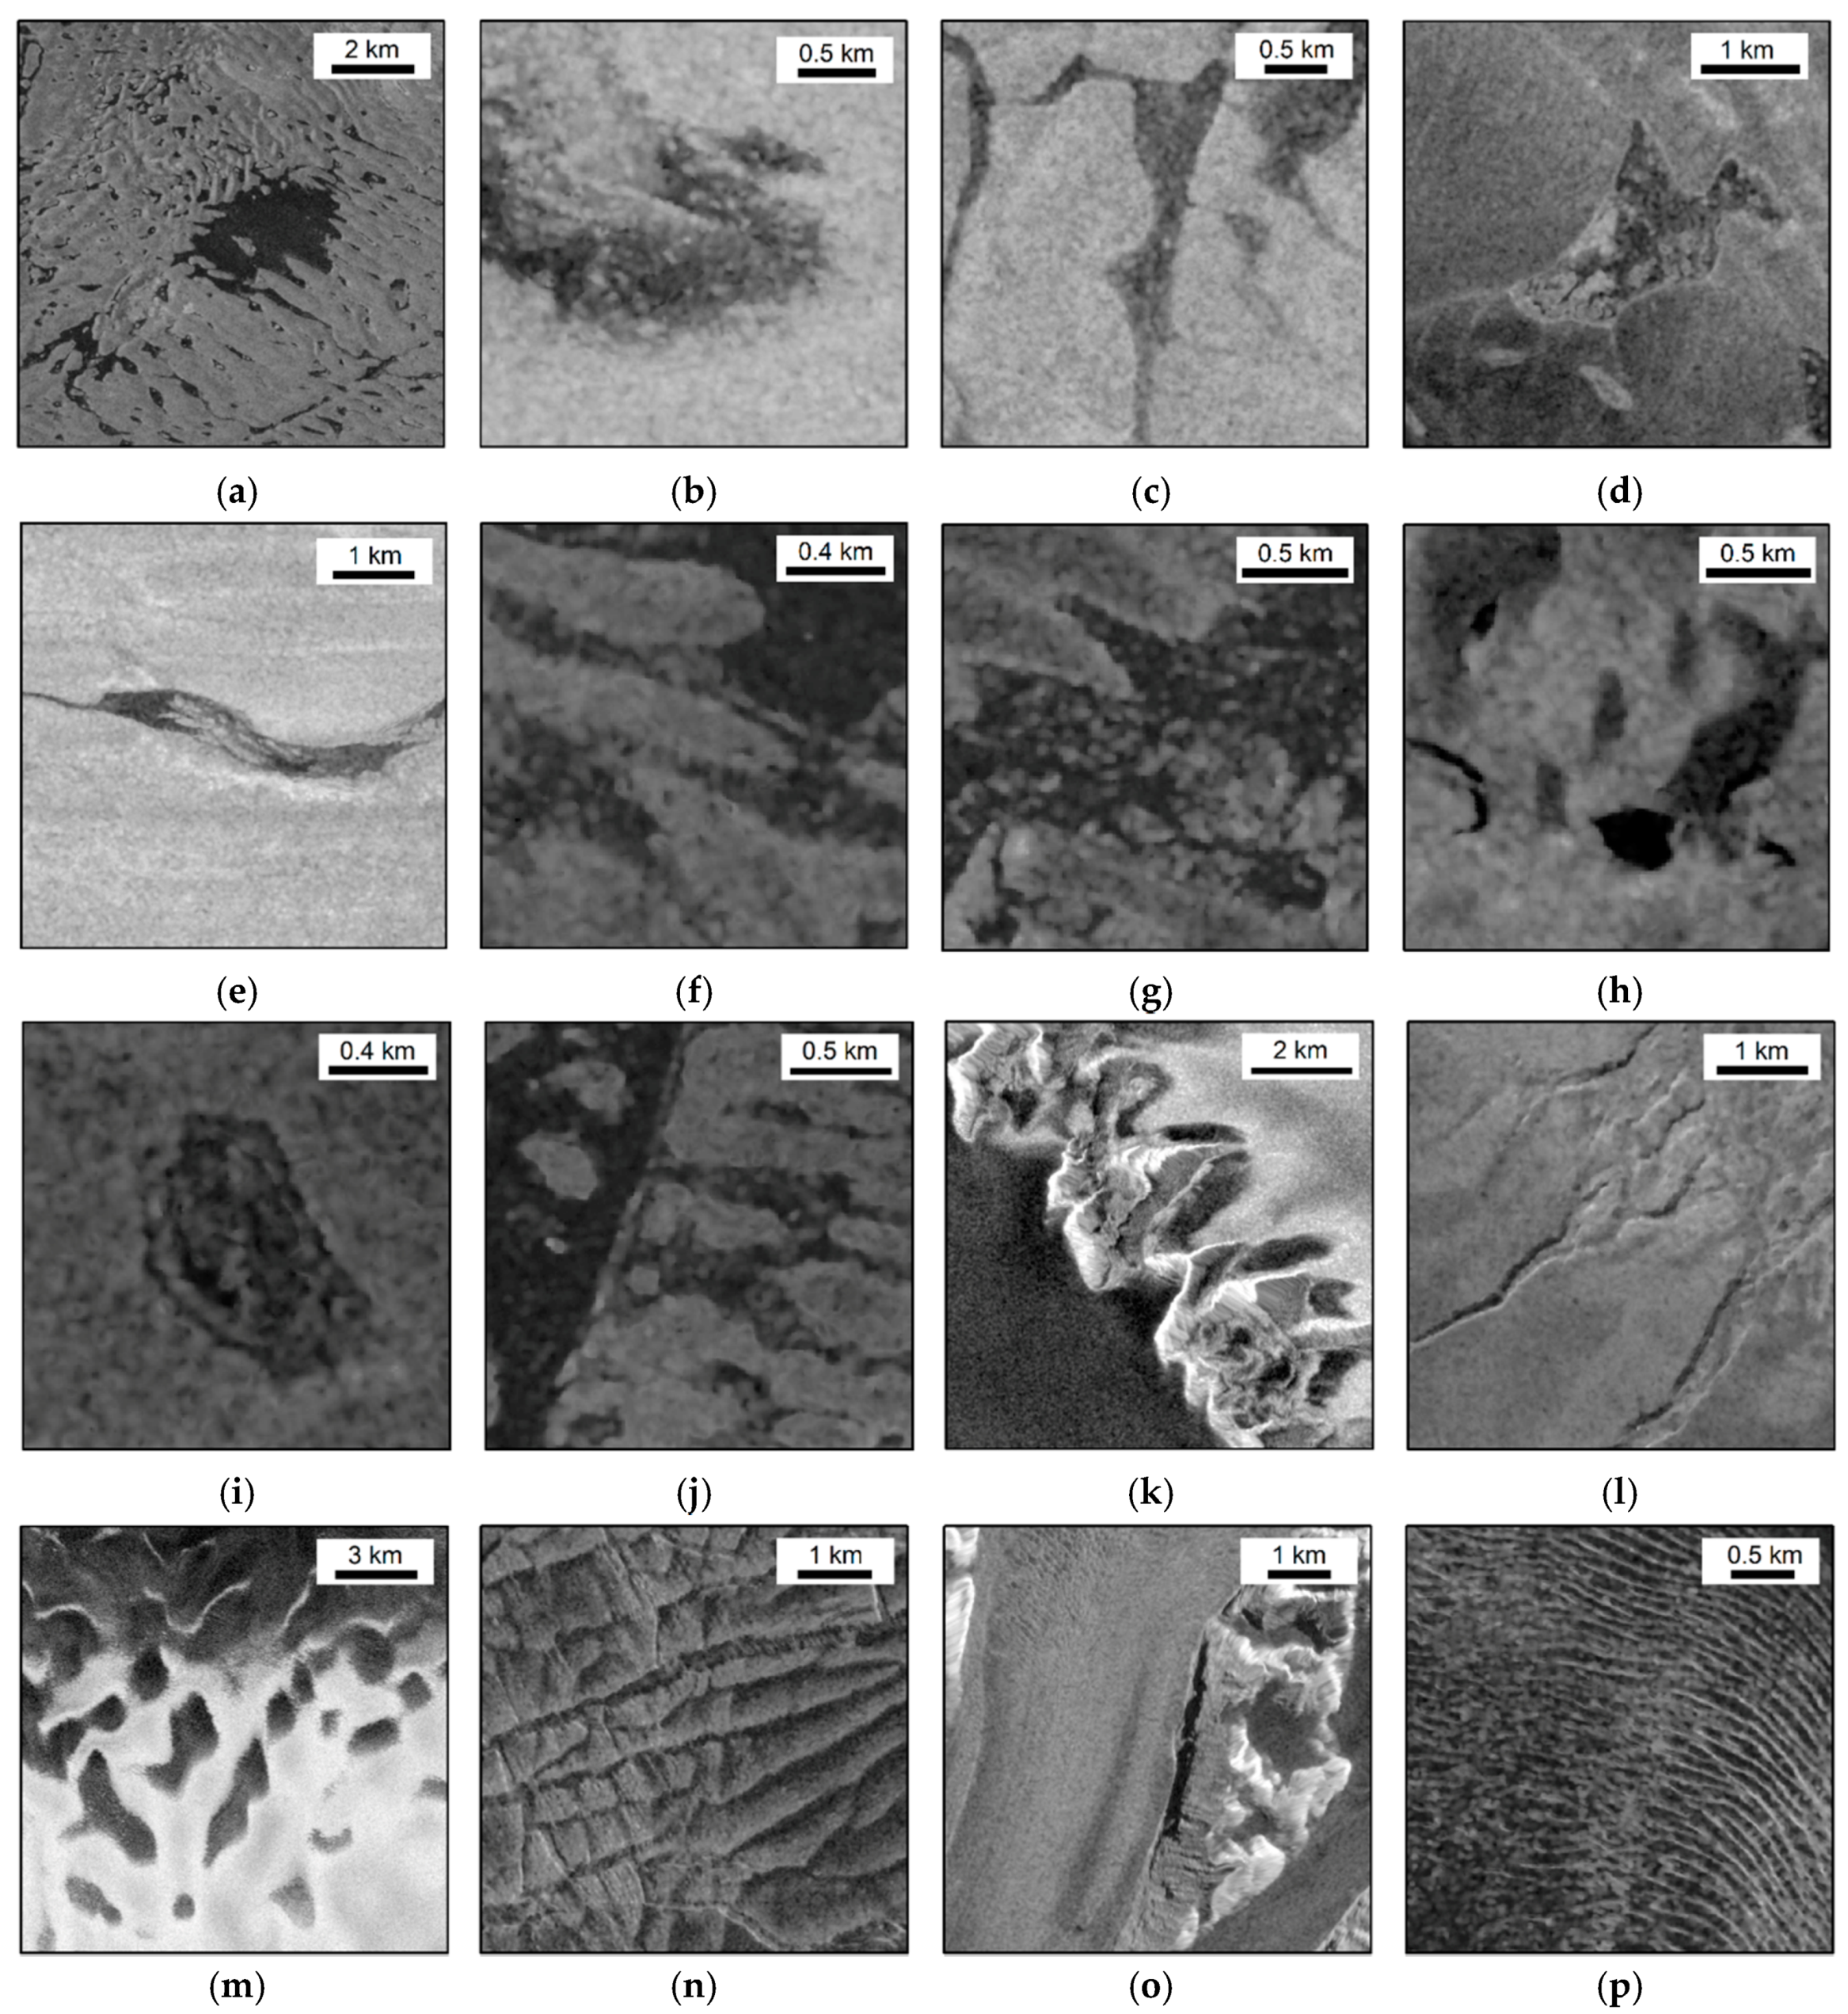
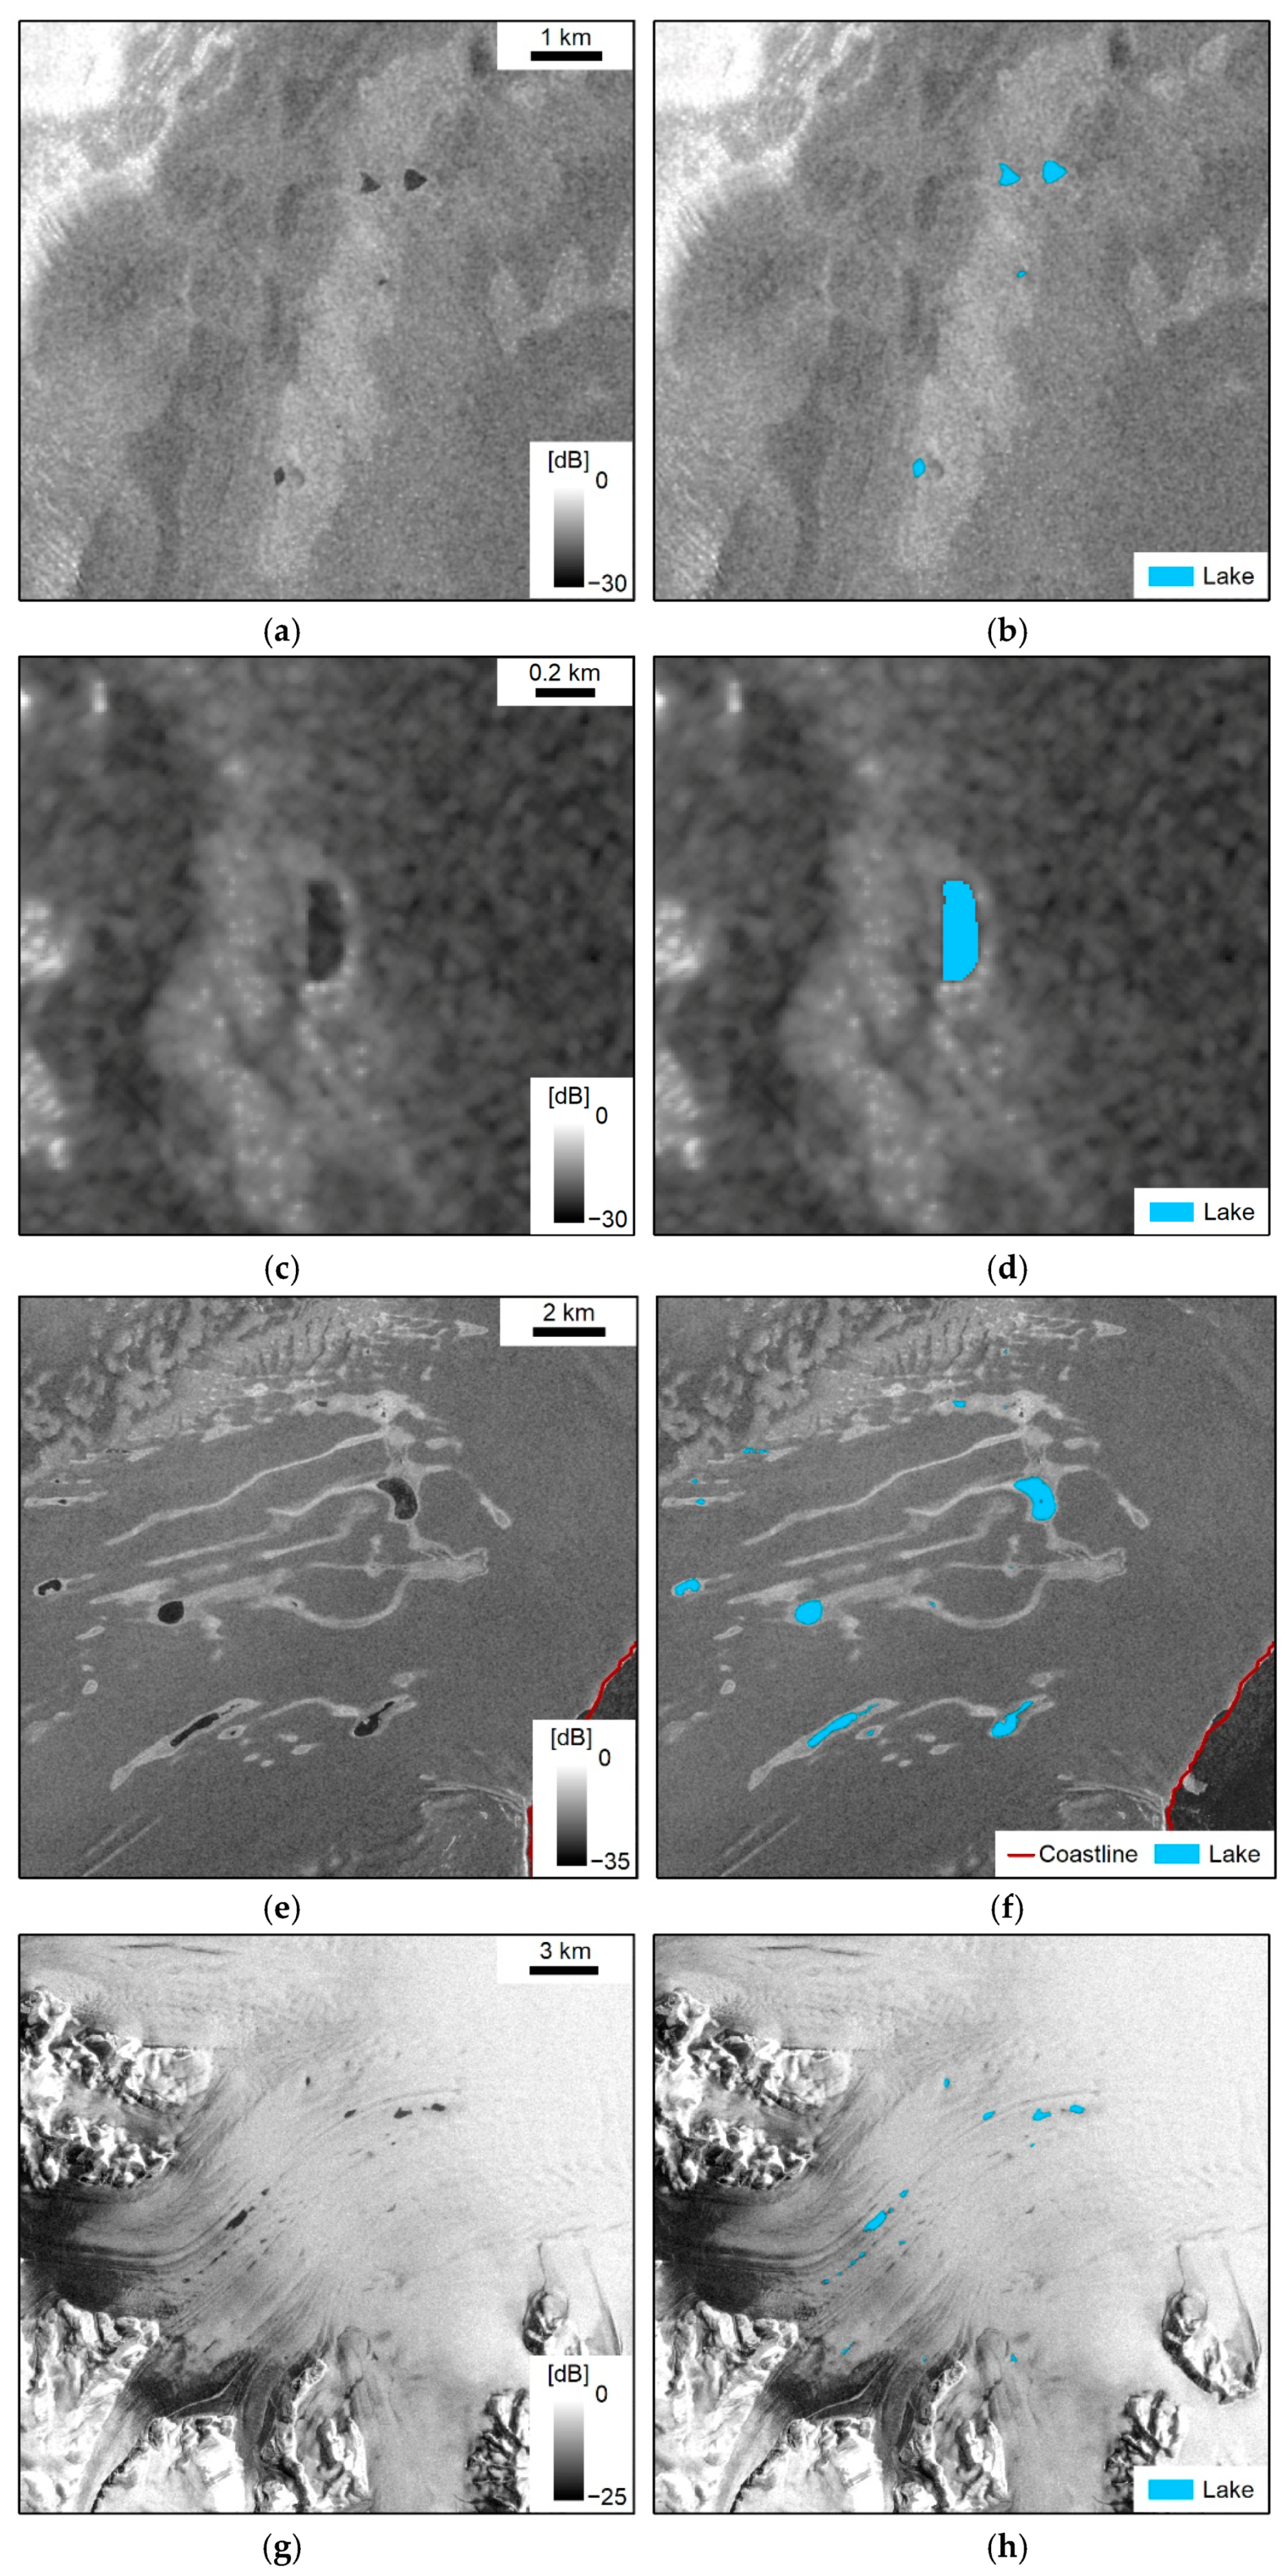
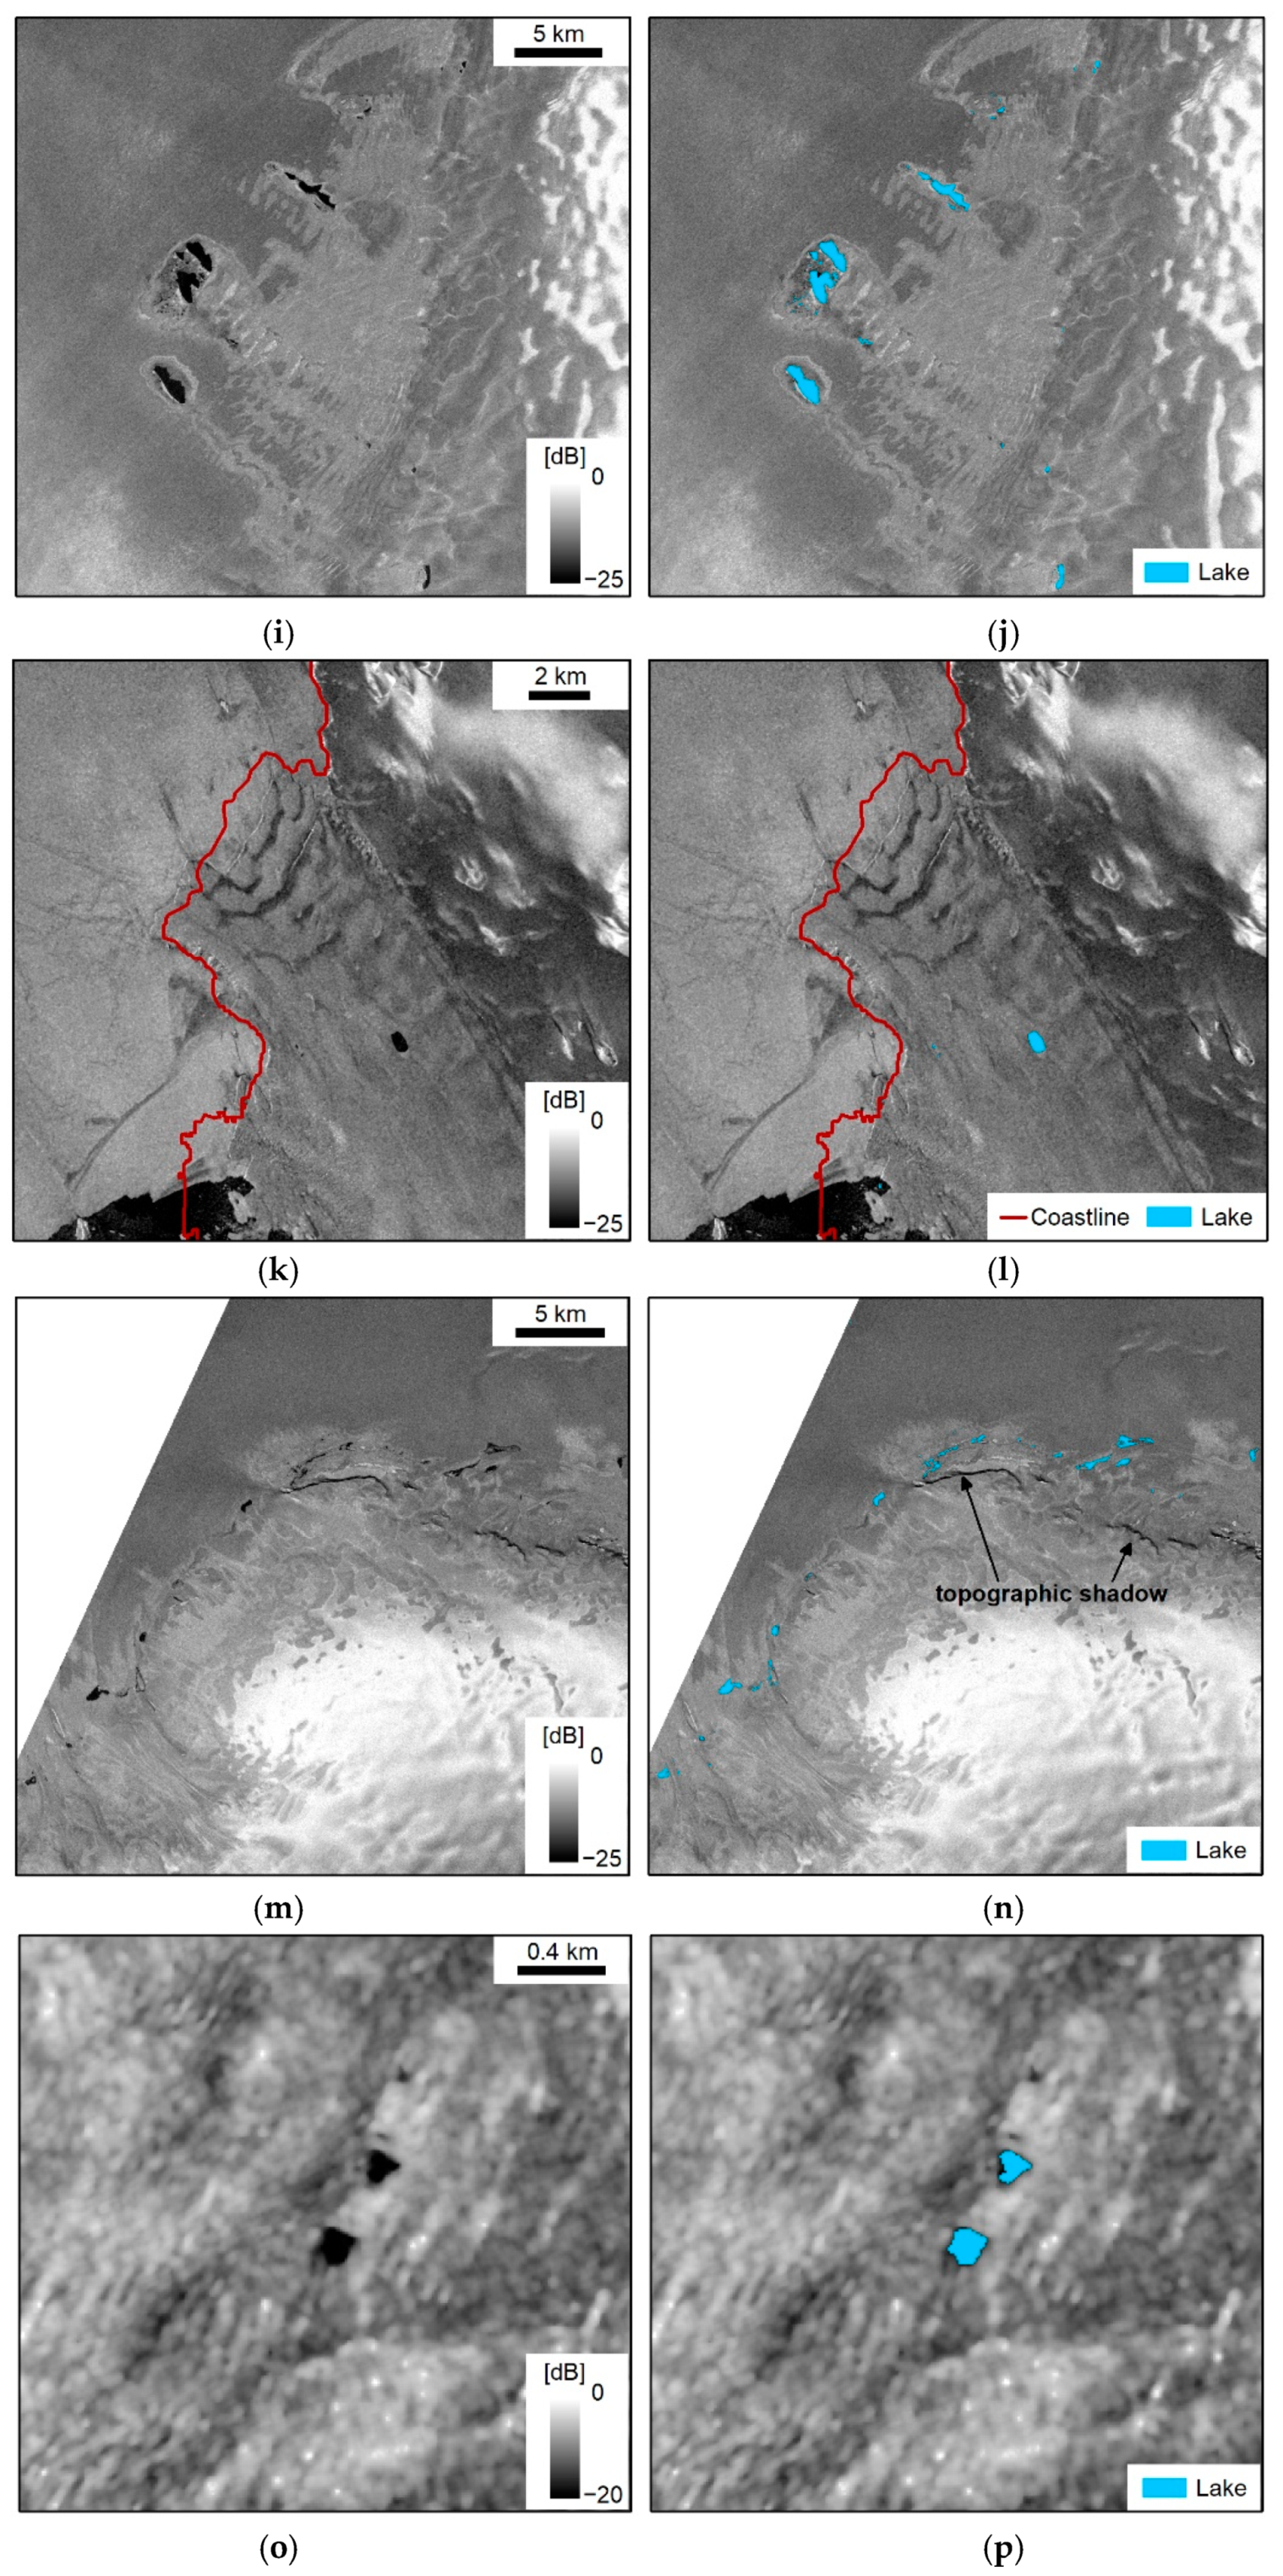
In order to address the lack of a SAR-based mapping technique, the main aim of this study is to develop the first automated supraglacial lake classification algorithm using Sentinel-1 SAR data. The Sentinel-1 constellation consists of two polar-orbiting satellites operating at C-band (5.405 GHz center frequency) and a revisit frequency of six days at the equator and up to daily in polar regions [30]. Over Antarctica, Sentinel-1 operates in either extra wide (EW) swath or interferometric wide (IW) swath acquisition mode delivering data products at 40 m and 10 m pixel spacing and in HH/HV and HH polarizations, respectively. However, the detection of supraglacial lake features in radar imagery over Antarctica can be a difficult task using traditional threshold- or segmentation-based techniques even if high spatial resolution Sentinel-1 IW products are available. In fact, previous experiments with machine learning classifiers including random forest or support vector machines and single-polarized Sentinel-1 imagery at 10 m pixel spacing revealed inaccurate classification results even considering temporal image metrics. As can be seen in Figure 2, Antarctic supraglacial lakes do not always appear with sharp round boundaries and homogeneous low backscatter (Figure 2a) but instead with fuzzy lake edges (Figure 2b,f), low visual contrast (Figure 2c), strongly varying shapes and sizes (Figure 2a) or strongly varying backscattering values ranging from approximately −20 dB to −40 dB, e.g., in the case of shallow slushy lakes (Figure 2b,f,g) or when lakes are covered with a thin layer of ice or small floating icebergs (Figure 2c–g,i,j). In addition, speckle noise as well as wind may further roughen the appearance of lake surfaces in radar imagery. Due to the inhomogeneous appearance of supraglacial lakes, surface features with similar shapes and sizes as well as low backscatter signatures such as open cracks and fractures on ice tongues (Figure 2l), small blue ice or wet snow patches (Figure 2h,k,m), topographically induced shadowing (Figure 2o) or wet/dry snow on crevasse fields and fractured ice tongues (Figure 2n,p) can be difficult to differentiate from supraglacial lakes or streams if no additional image information (e.g., different radar polarizations, temporal information, elevation data) is available. Another difficult surface feature are drained lakes leaving round wet patches in the snow.
To overcome most of the described issues, we propose the use of a convolutional neural network (CNN) allowing to consider the spatial image context through convolutional extraction of feature maps from a given input image. CNNs are particularly suitable where traditional classification methods fail and were commonly used in computer vision and particularly for semantic segmentation and object detection tasks in remote sensing [31,32], e.g., for automated calving front detection using SAR and optical satellite imagery [33,34,35], for sea-land classification in optical satellite imagery [36], for multi-temporal crop type classification in optical Landsat imagery [37], for sea ice concentration estimation in dual-polarized RADARSAT-2 imagery [38], for automated mapping of ice-wedge polygons in high-resolution satellite and unmanned aerial vehicle images [39,40], or for building and road extraction in optical and aerial satellite imagery [41,42], to only name a few. In this study, we extract supraglacial lake extents from single-polarized Sentinel-1 imagery using a modified version of a CNN originally developed for semantic segmentation of biomedical images (U-Net) [43]. In Earth Observation, encoder-decoder designs and particularly variants of U-Net are most commonly used for semantic image segmentation due to their better performance compared to other approaches including naïve-decoder models [31]. With the main aim of this study being the derivation of lake areas by means of pixel-wise classifications, object detection approaches including multi-task instance segmentation (e.g., [39,40]) were not considered or tested. In detail, we aim at the segmentation of open water lakes as well as lakes that are roughened at their surface, e.g., by wind or return higher backscatter values due to a thin ice cover and appear with fuzzy edges, low contrast and speckle noise. Lake regions and subsurface lakes that are entirely covered with thick ice or lakes that are subject to very severe wind roughening are not considered in this analysis. Particular focus during method development was the spatio-temporal transferability of the segmentation algorithm. Another aim of this study is to demonstrate the importance of fusing Sentinel-1 and Sentinel-2 supraglacial lake classifications for retrieval of more complete lake extent mapping products for a given time period. In fact, the exploitation of the advantages of both sensor types conjointly is particularly crucial in Antarctica where polar darkness during austral winter as well as a frequent cloud coverage oftentimes restricts the availability of optical data and where SAR data may be limited by the described effects in order to capture the full picture of lake occurrences.
In the following, Section 2 describes the selected study sites and datasets as well as the implemented methodology for data pre-processing, deep learning model training, post-processing, and the accuracy assessment. Following this, Section 3 presents mapping results as well as the outcome of the accuracy assessment and Section 4 discusses the results as well as remaining limitations of our algorithm. Finally, Section 5 summarizes the findings of this paper.

2. Materials and Methods

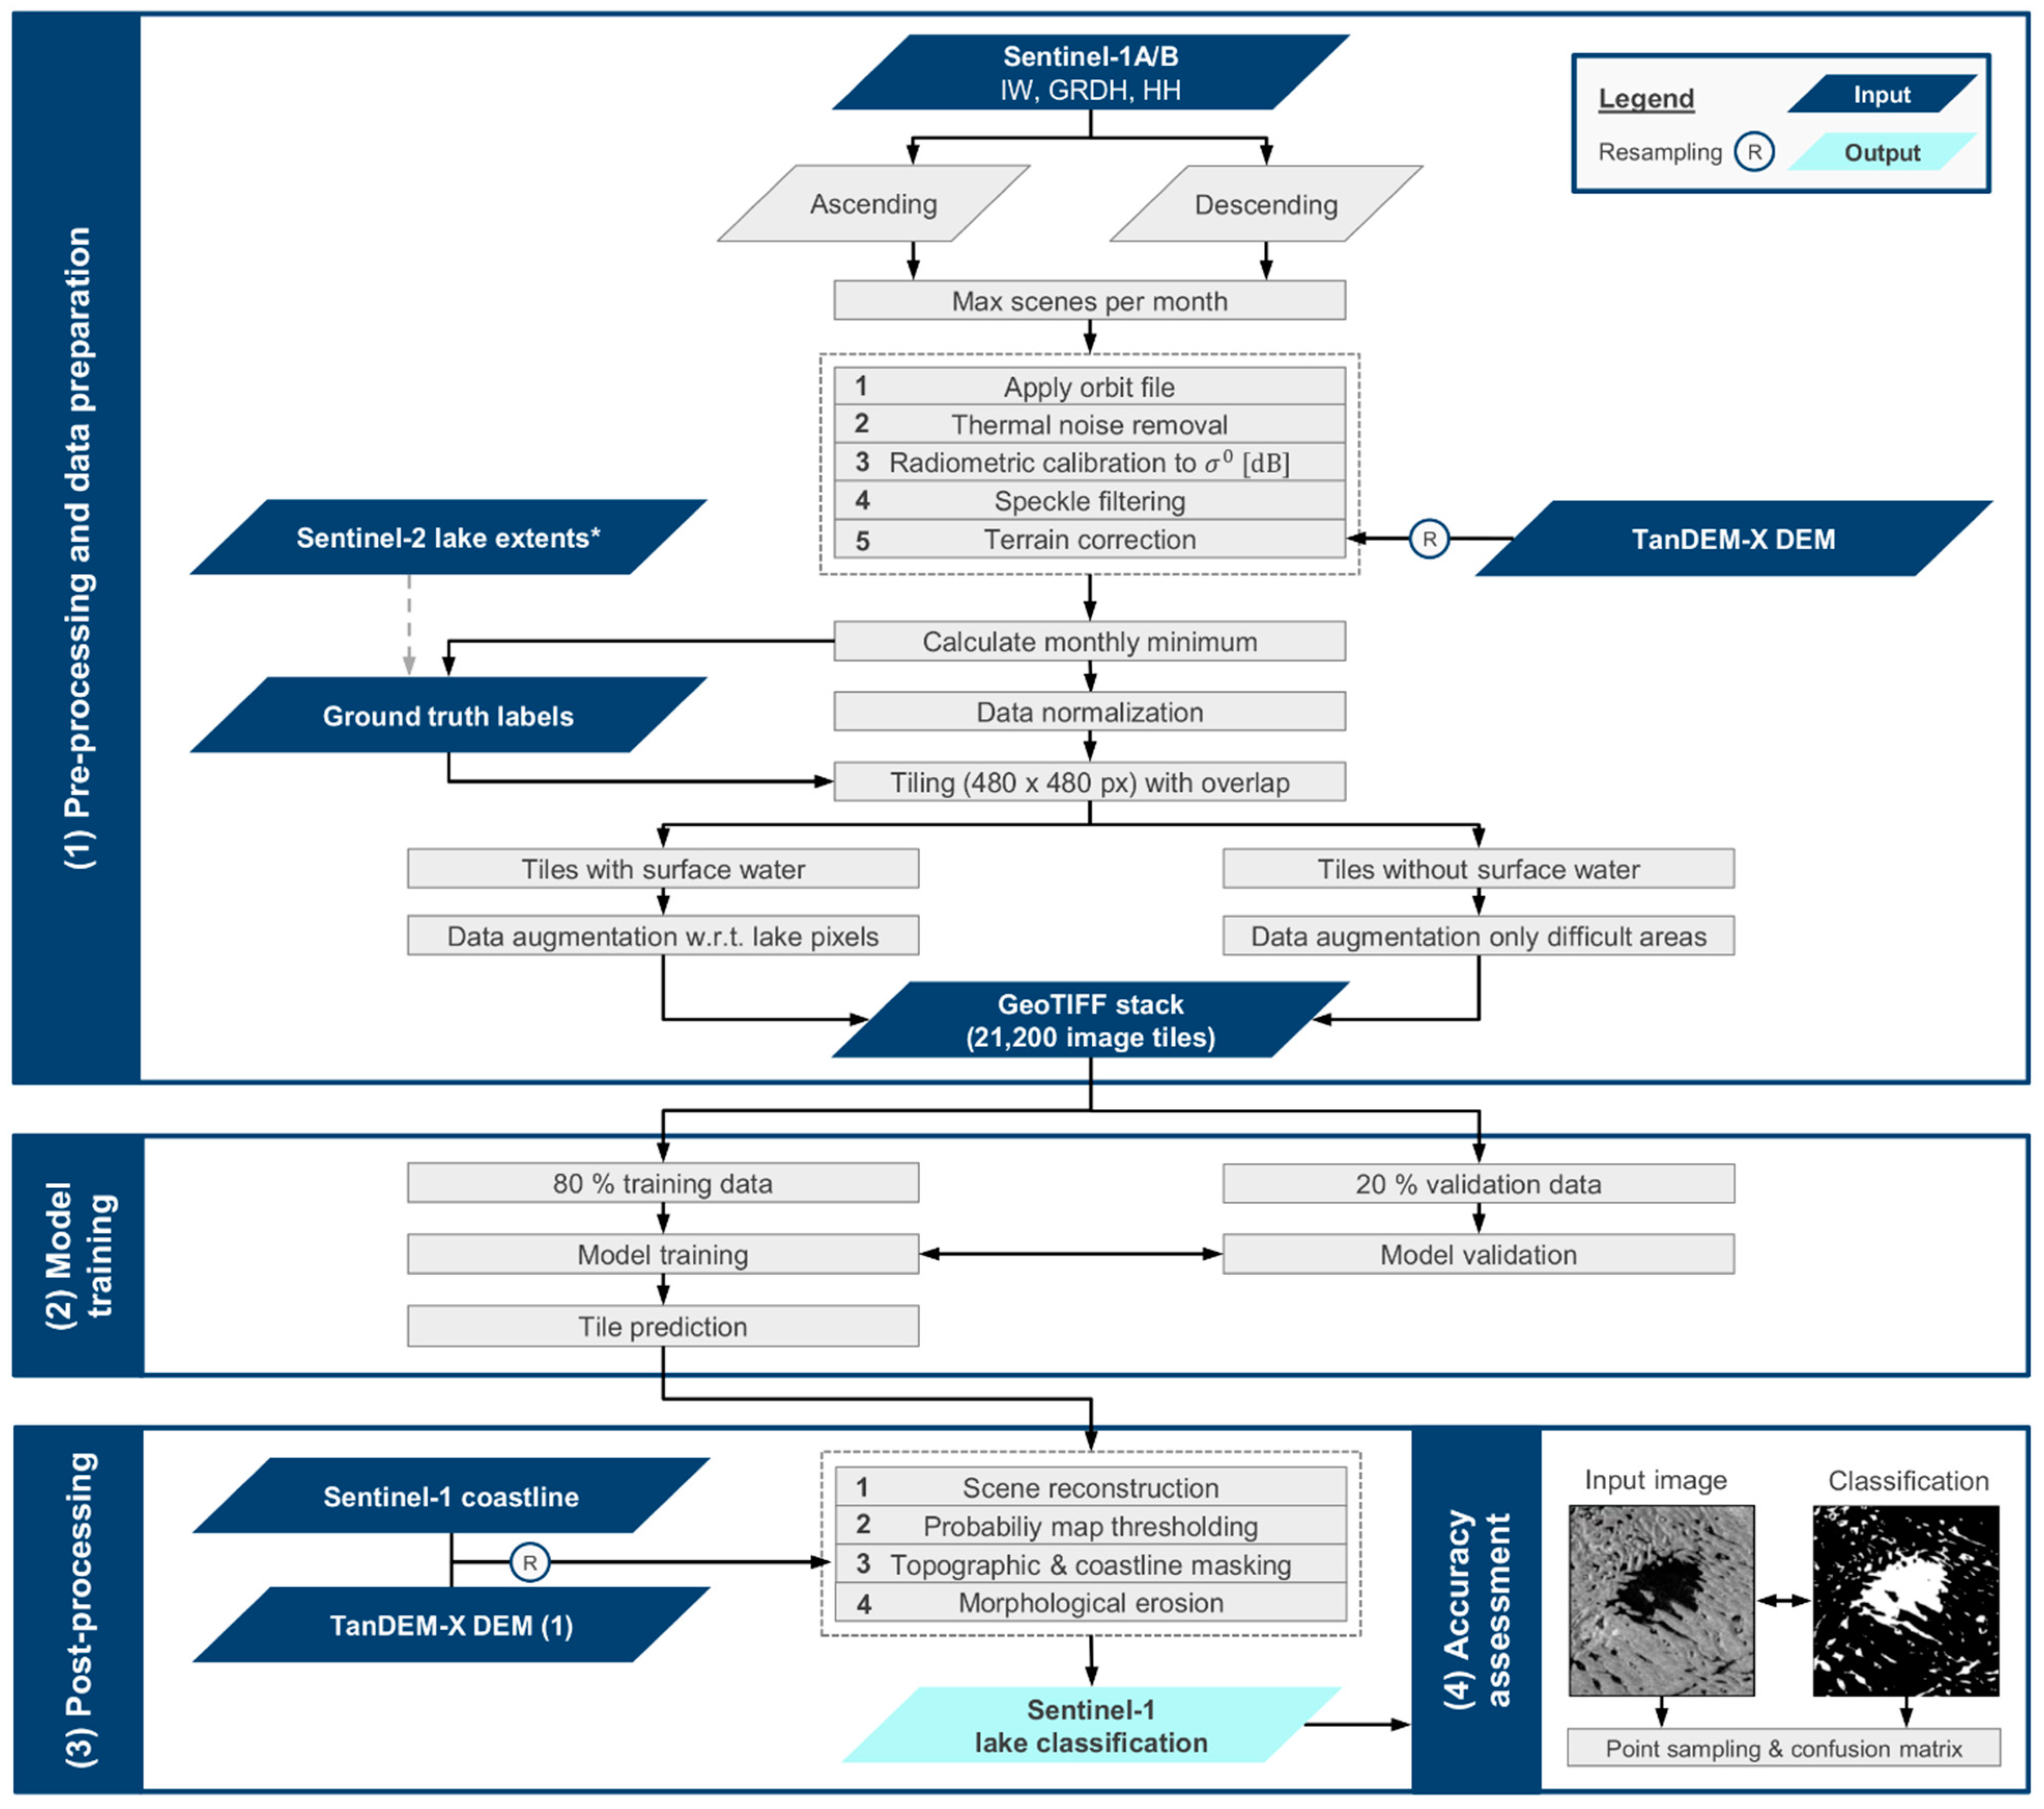
In the following, we first provide details on the study sites selected for model training and testing (Section 2.1) as well as the corresponding input data (Section 2.2). In addition to single-polarized Sentinel-1 radar imagery (Section 2.2.1) used as input variables for model training, auxiliary topographic TanDEM-X digital elevation model (DEM) (Section 2.2.2) as well as Sentinel-1 coastline (Section 2.2.3) data were employed to support data pre- and post-processing. According to Figure 3, the workflow for automated supraglacial lake mapping using Sentinel-1 SAR data can be subdivided into (1) pre-processing and data preparation, (2) deep learning model training, (3) post-processing, and (4) accuracy assessment. In this context, corresponding methods are presented in Section 2.3.1, Section 2.3.2, Section 2.3.3, Section 2.3.4. Except for data pre-processing, all processing steps were implemented using the Python programming language.

2.1. Study Sites

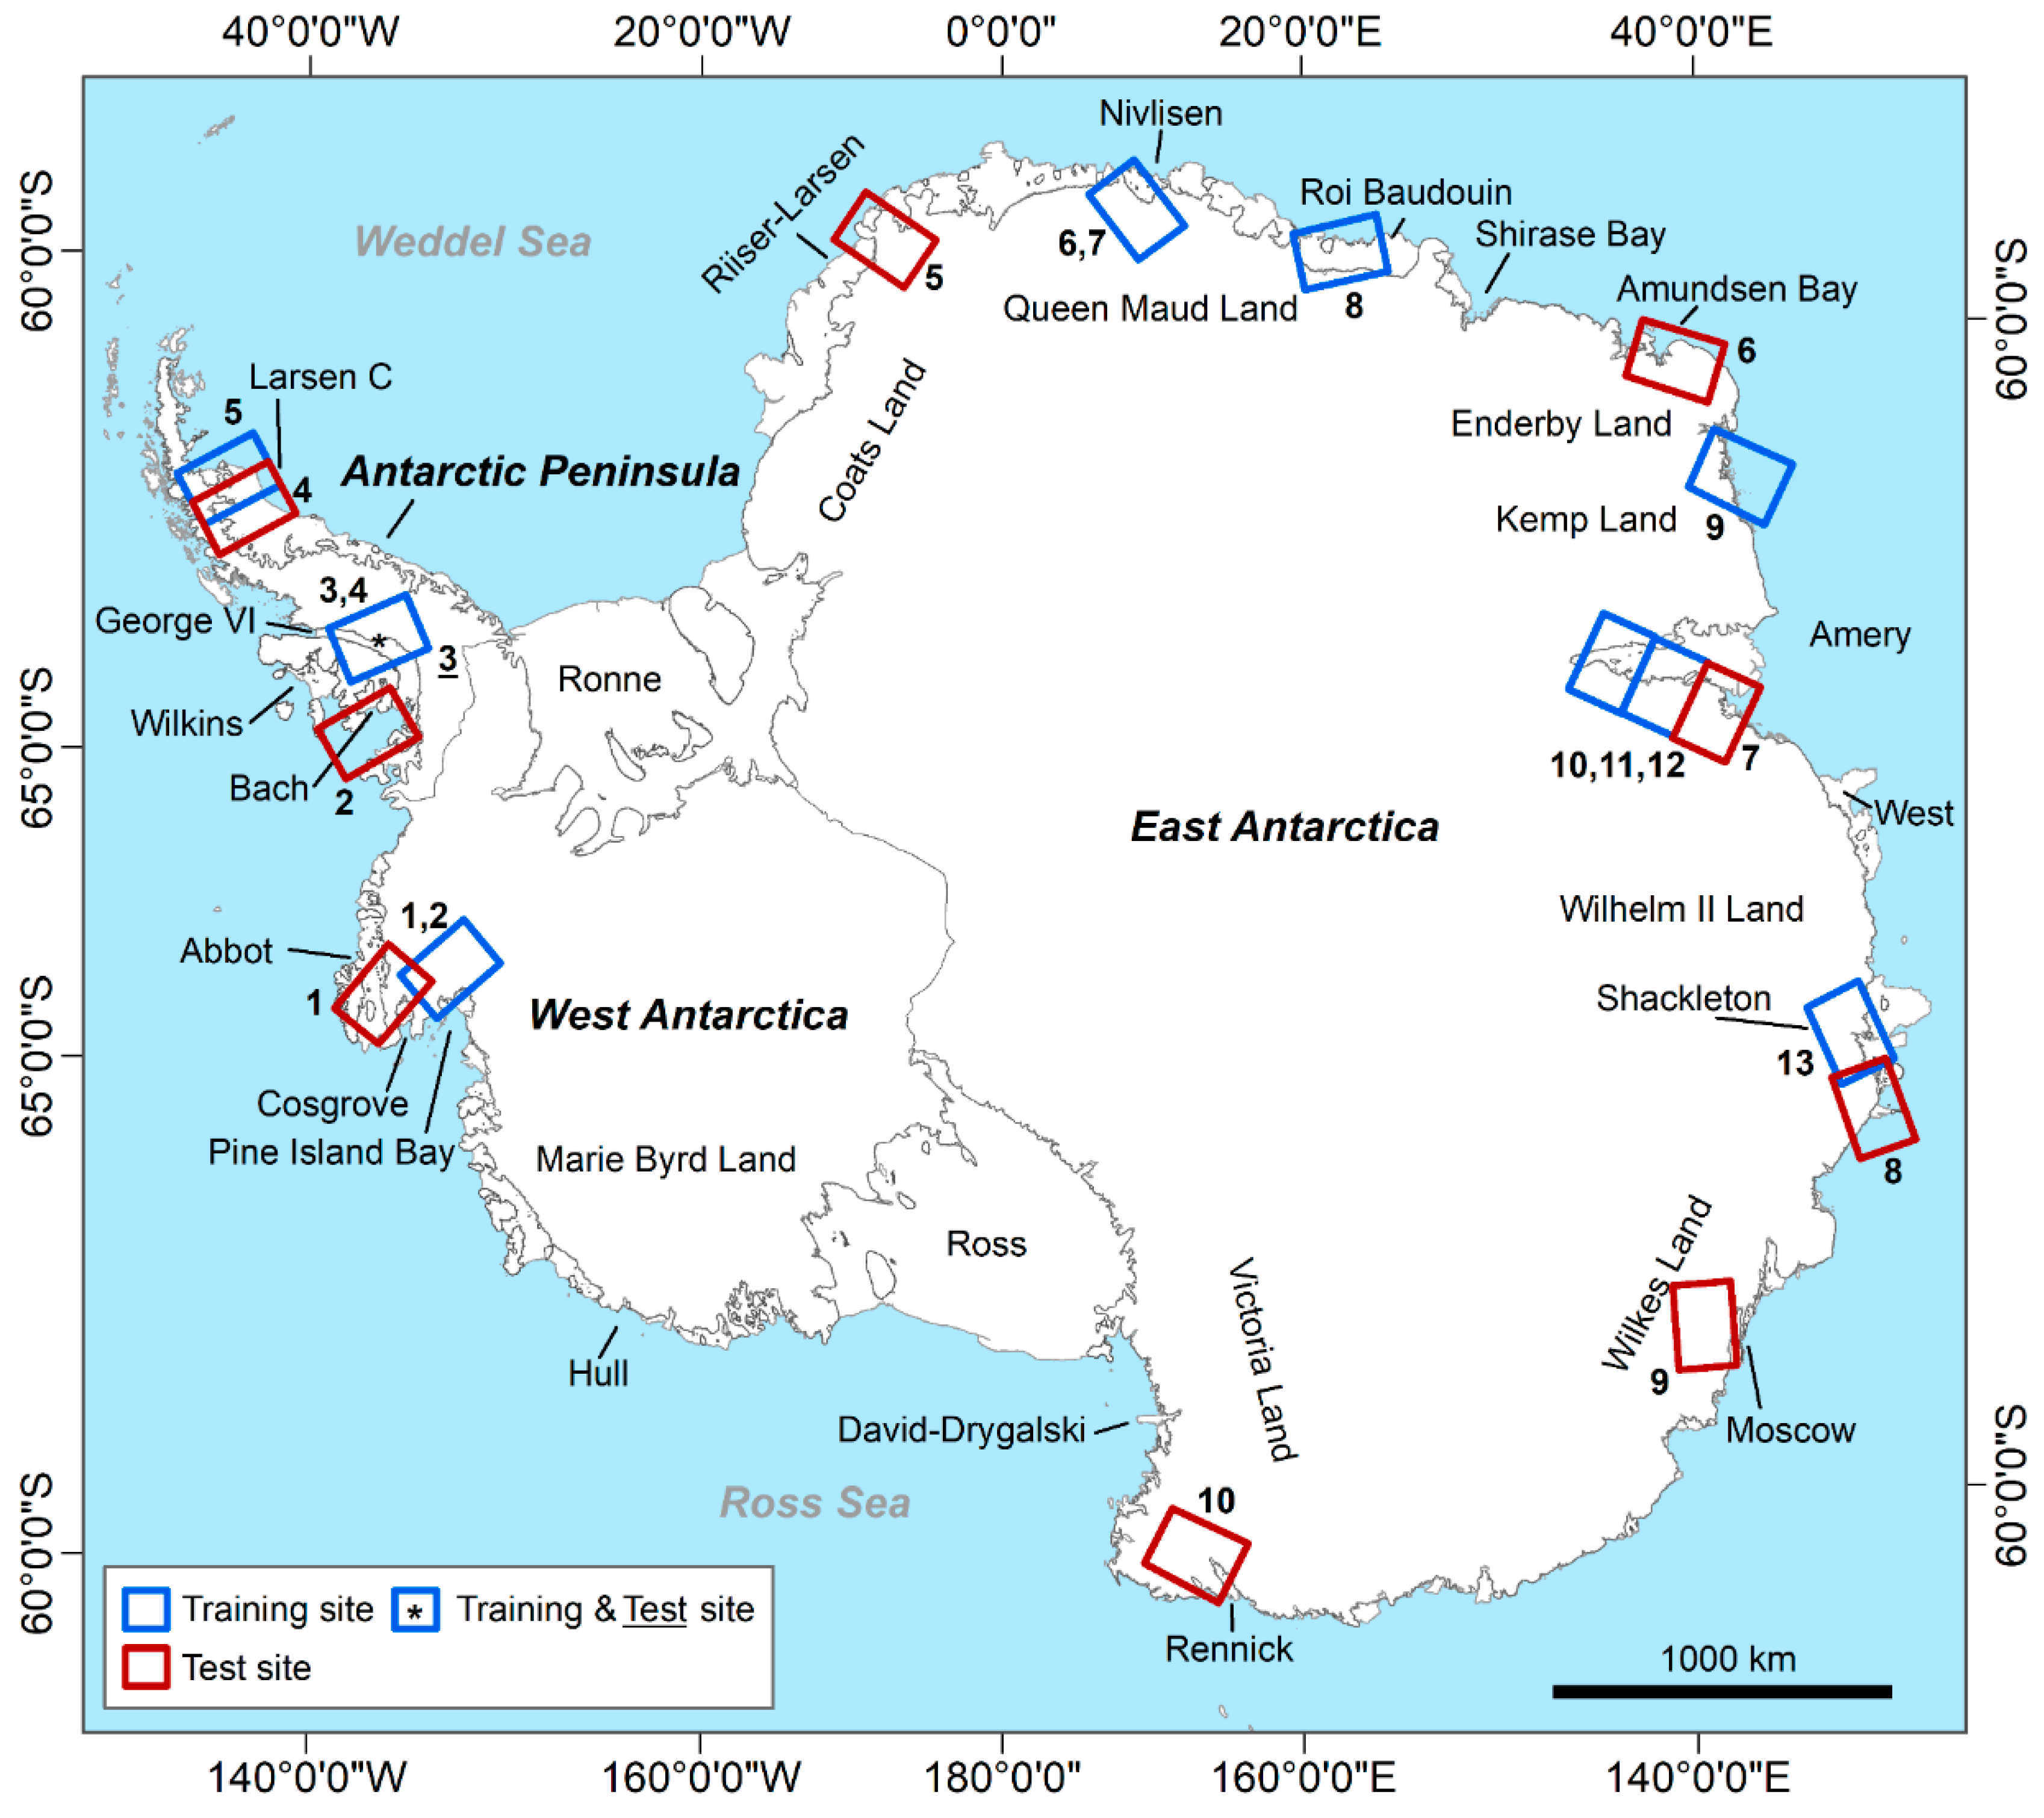
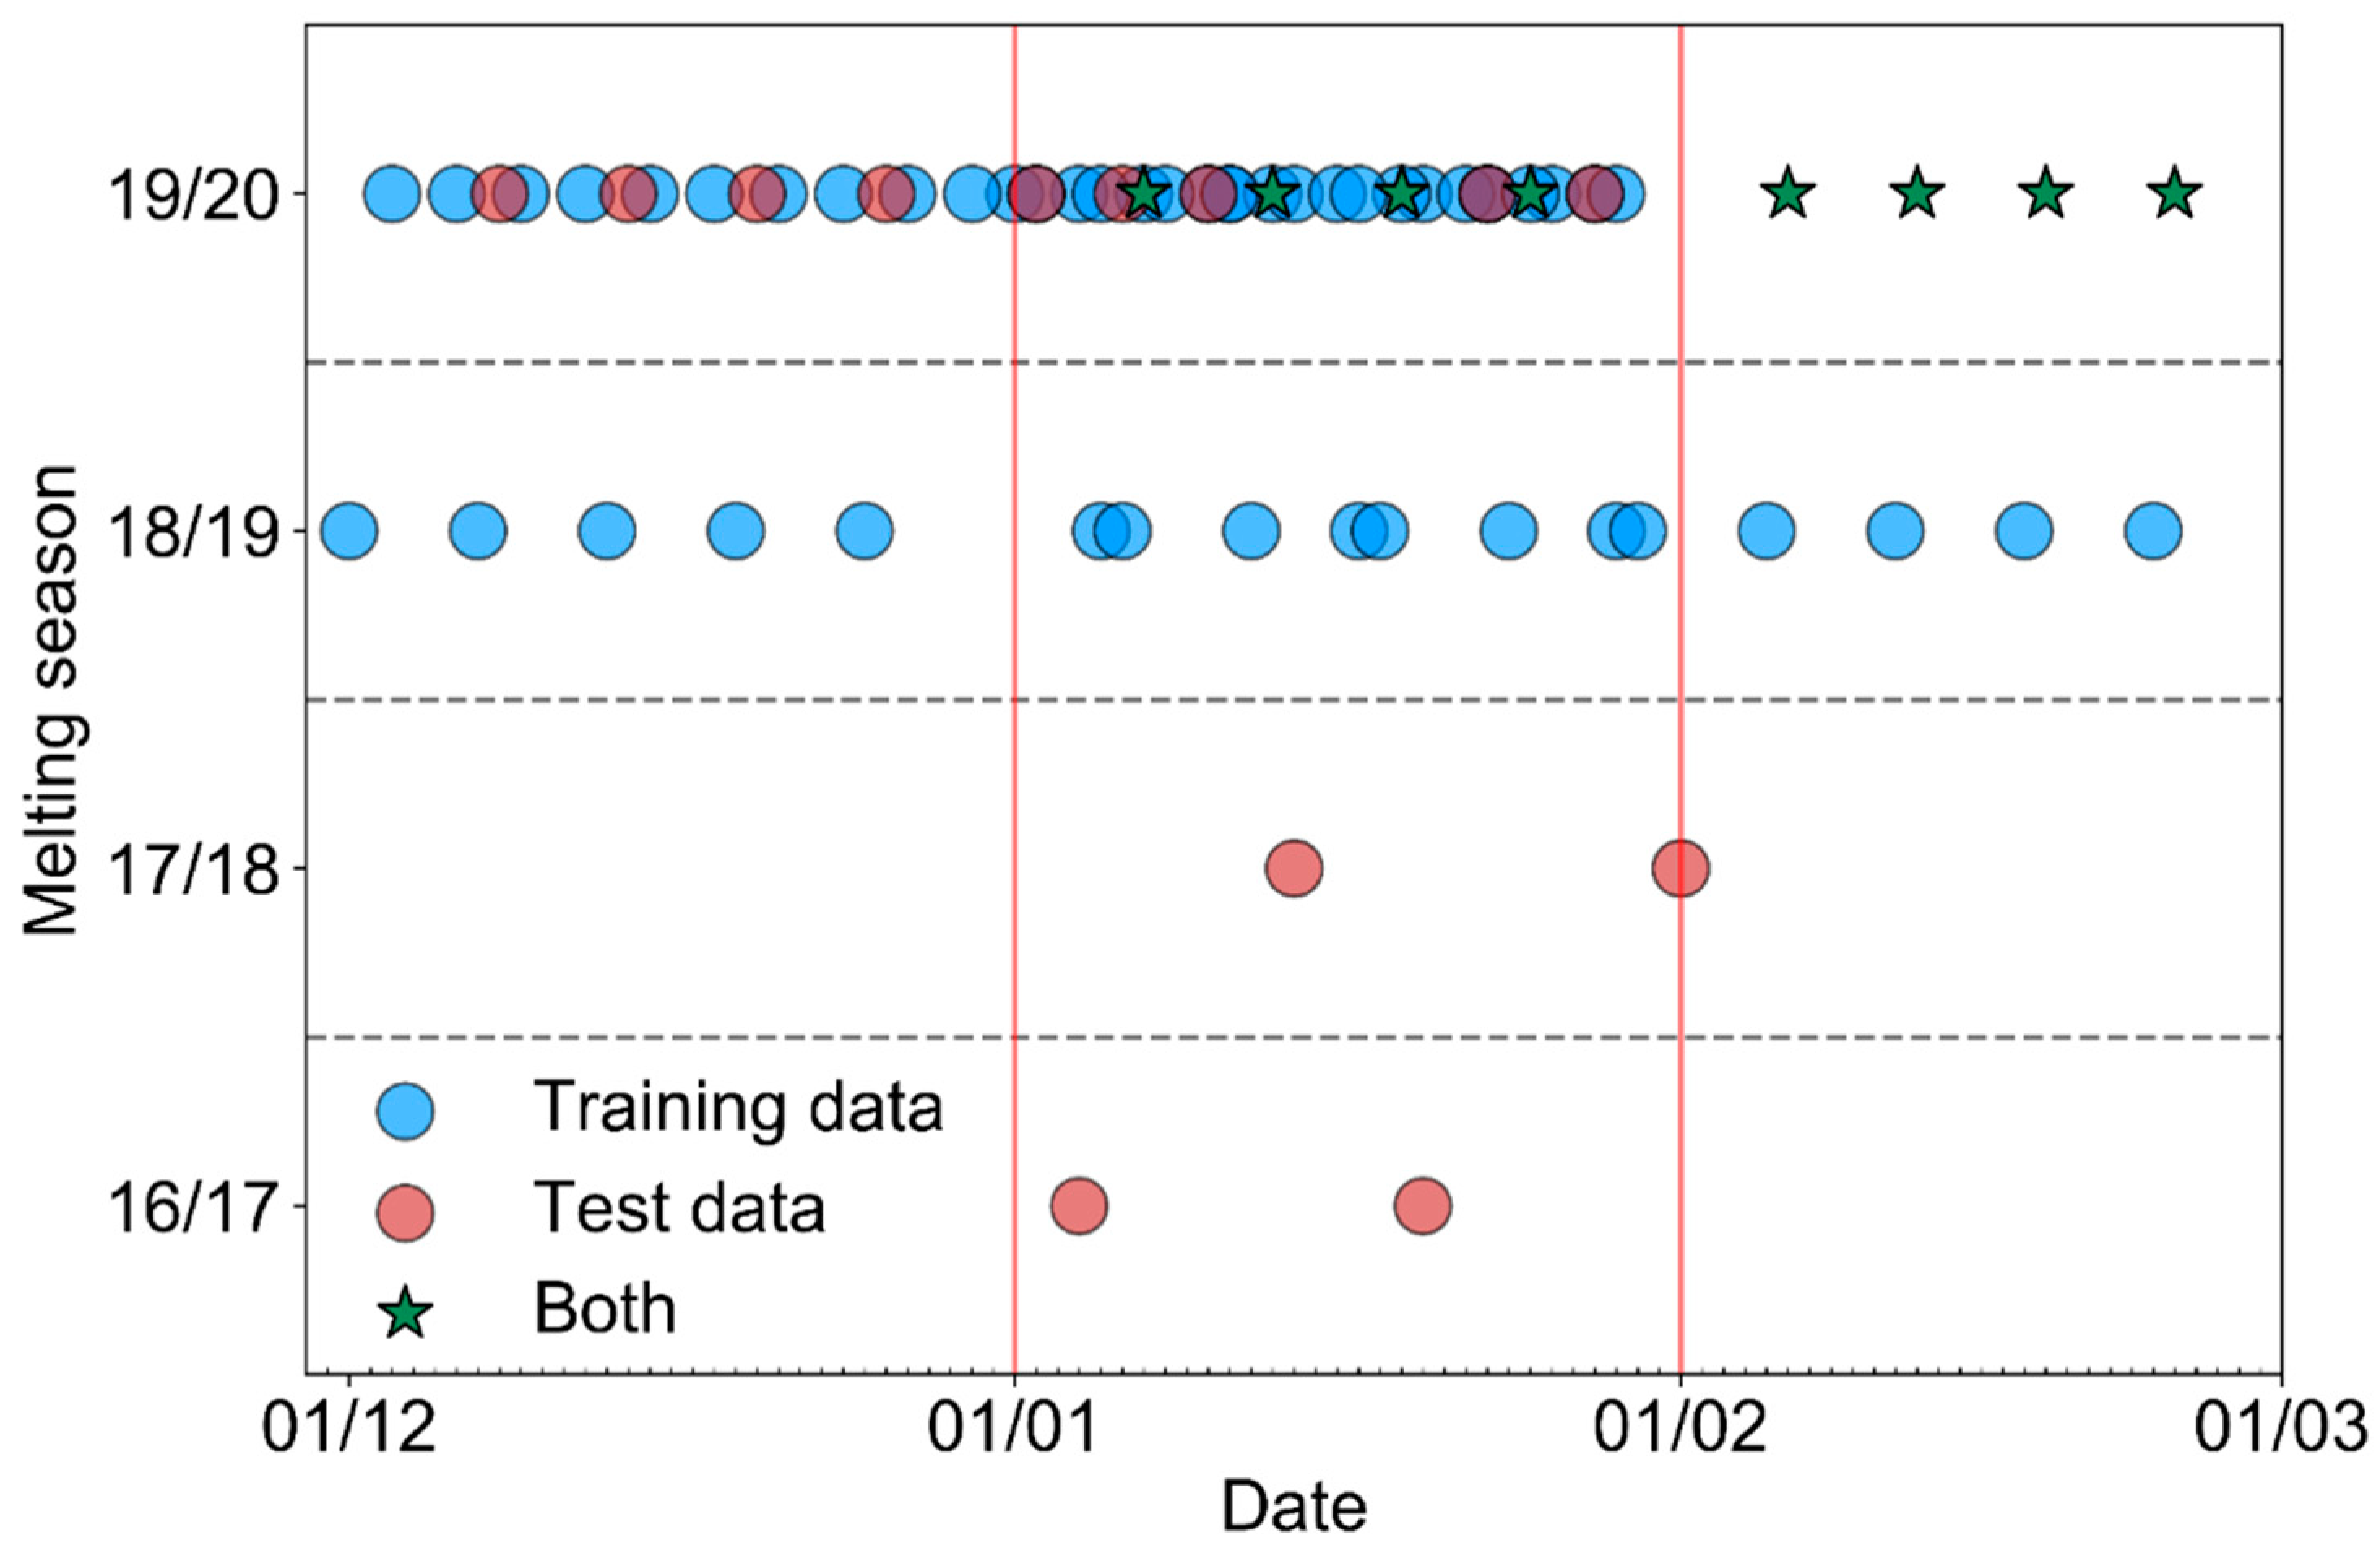
The study sites used for training and testing the implemented supraglacial lake detection algorithm are evenly distributed across the Antarctic continent (Figure 4) and were selected based on known supraglacial lake locations (e.g., [18,28,44,45,46]), as described in Dirscherl et al. [28]. To ensure the spatial as well as temporal transferability of our method, training and test sites were chosen to cover (1) all different types of environments and surface features occurring in Antarctica (e.g., bare ice, blue ice, slushy snow, wet snow, dry snow, supraglacial lakes, rock outcrop, and crevasse fields) and (2) various dates throughout austral summer (1 December to 1 March); thus, the melting season of a given year allowing to include supraglacial lake features with varying appearances. In detail, the selected training and test sites cover dates during the 2016/2017, 2017/2018, 2018/2019, and 2019/2020 summer seasons (see Figure 5). In agreement with their spatial location, these dates were chosen due to particularly strong surface melting during these years, e.g., over West Antarctica and the Antarctic Peninsula in January 2020 and over East Antarctica in January 2017 and 2019 (e.g., [28]). In total, eight of the Sentinel-1 training sites covered regions on the East Antarctic ice sheet (EAIS), two were located on the West Antarctic ice sheet (WAIS) and three on the API. Regarding the ten independent test sites, one was situated on the WAIS and three and six on the API and EAIS, respectively. To investigate the functionality of our workflow, the test sites were chosen to include supraglacial lake features of different appearances as well as features that are difficult to discriminate from lakes in single-polarized Sentinel-1 SAR imagery. At this point it has to be noted, that one of the test regions on the API covered George VI Ice Shelf which was analyzed for intra-annual lake dynamics throughout austral summer 2019/2020 to highlight the potential of our method for time series analyses. Additionally, the test site of George VI Ice Shelf was used to reveal the importance of fused Sentinel-1 SAR and optical Sentinel-2 classification products. Furthermore, one additional study region covering supraglacial lakes in southwestern Greenland was added in order to test the spatio-temporal transferability of our algorithm to regions beyond Antarctica.

2.2. Datasets

2.2.1. Sentinel-1 Data

The Sentinel-1 data used in this study were acquired in IW swath mode delivering single-polarized (HH) data products at 10 m pixel spacing in Ground Range Detected High Resolution (GRDH) format. Despite the availability of dual-polarized HH-HV 40 m EW data over the Antarctic coastline, single-polarized IW products were preferred over dual-polarized EW products due to their higher spatial resolution thus a considerably improved visibility of even small or elongated surface lakes. IW data products are acquired at a swath width of 250 km where incidence angles range from 29° to 46° [48]. In detail, each IW image product is created from three sub-swaths captured using the Terrain Observation with Progressive Scans SAR (TOPSAR) technique. In turn, each sub-swath consists of a series of individual bursts. For IW GRDH product retrieval, all bursts and sub-swaths are merged [48].
As can be seen in Table 1 and Table S1, a total of 70 Sentinel-1 image products was selected (Figure 5) and consequently split into training and testing acquisitions covering the study sites described in Section 2.1. For training regions, 57 Sentinel-1 IW GRDH HH image products were chosen for melting seasons 2018/2019 and 2019/2020 (Table S1; Figure 5). In detail, the training acquisitions were filtered to include the maximum number of available acquisitions in either ascending or descending orbit for a given study region and month (Table S1) in order to compute the monthly backscattering minimum for each selected region in the following (see Section 2.3.1). On the other hand, nine Sentinel-1 acquisitions were selected exclusively for testing the algorithm in spatially and temporally varying environments for evaluation of spatio-temporal transferability. In detail, the test data covered acquisitions during austral summers 2016/2017, 2017/2018, and 2019/2020 (Table 1; Figure 5). As mentioned, lakes on George VI Ice Shelf were additionally analyzed for their evolution during austral summer 2019/2020 and particularly January, the peak of the melting season. Here, the eight individual training acquisitions covering January and February 2020 (Table S1) as well as four additional scenes of December 2019 (Table S1) were used. In addition, for further testing of the spatio-temporal transferability of our algorithm beyond Antarctica, we classify a Sentinel-1 IW GRDH scene covering supraglacial lakes in southwest Greenland on 28 July 2018. Figure 5 illustrates the temporal distribution of all Sentinel-1 training and testing acquisitions covering Antarctica.

2.2.2. Topographic Data

In order to orthorectify the Sentinel-1 ground range data (Section 2.2.1) as well as to remove potentially false lake classifications in high altitudes during post-processing (Section 2.3.3), an edited version of the 90-m Antarctic TanDEM-X DEM was integrated in our workflow. The SAR data used for DEM generation were acquired between April 2013 and November 2014 and cover entire Antarctica.

2.2.3. Coastline Data

For removal of false lake classifications seaward of the Antarctic coastline, a Sentinel-1 coastline product [34,49] was additionally integrated into post-classification. The circum-Antarctic coastline was derived from Sentinel-1 data covering the period June to August 2018 using an automated processing pipeline specifically developed for semantic segmentation of the Antarctic calving front based on a modified U-Net [34]. In detail, the coastline product represents the average coastline position over the given period. For improvement of the Sentinel-1 coastline, remaining minor errors were corrected manually.

2.3. Methods

2.3.1. Pre-Processing and Data Preparation

Following selection of Sentinel-1 data (Section 2.2.1), each acquisition was pre-processed using sensor-specific processing tools implemented in the open source Sentinel Application Platform (SNAP). At first, the orbit metadata was updated using restituted orbit files and thermal noise was removed in all sub-swaths. Next, the data were radiometrically calibrated to retrieve the backscattering coefficient sigma naught ( σ 0 ) and speckle filtering was performed to remove noise. Finally, orthorectification corrected for terrain distortions and converted the data from ground range geometry using the edited 90-m Antarctic TanDEM-X DEM (see Section 2.2.2).
Pre-processing was followed by calculation of monthly backscattering minimum products. In agreement with the number of available acquisitions in either ascending or descending orbit for a given training region and month, 13 backscattering minimum products were calculated (Table 1; Figure 4). This reinforced the training of the deep learning network, e.g., on wet snow or topographically induced shadow patches which might be difficult to discriminate from supraglacial meltwater in radar imagery (Figure 2) while maintaining a comparatively low amount of data thus workload for data labeling and training.
Subsequently, subsections of the monthly minimum rasters were selected to be included in model training and their data range was normalized. Z-score normalization was necessary to standardize all data to the same range and was performed by subtracting the mean of the entire dataset from each training product (or test scene) and by dividing it by the standard deviation of the full training dataset. Before feeding the data to the implemented deep learning pipeline (see Section 2.3.2), each of the raster layers was tiled into 480 × 480-pixel patches with a 200-pixel overlap. Tiling with overlap is an established method to increase training data as well as to reduce border effects during scene prediction. The corresponding patch size was determined in agreement with the largest surface lakes appearing in the training images and sufficient spatial context to be included. In addition, the processing of larger image patches is restricted by GPU memory potentially requiring a reduction of image resolution [43]. To provide the deep learning network with an even larger dataset during training, most Sentinel-1 training patches were augmented by flipping, rotating and shifting. Since surface lakes oftentimes cover a comparatively small share of the 480 × 480-pixel patches as well as to reinforce model training on the “water” class, image patches containing particularly numerous lake pixels were augmented 12 times. Here, tile flipping was performed down- as well as sideward, rotating was implemented at 45-degree steps for angles in the range 45–315 degrees and shifting was achieved by moving the image either 100 pixels down- or sideward with the created empty space filled by reflecting adjacent image pixels. Image patches with fewer lake pixels were augmented only eight times by reducing the rotational augmentation to angles of 90, 180, and 270 degrees. In this study, patches with numerous lake pixels are defined as the upper quartile of all patches sorted by their overall count of lake pixels. Similarly, patches with fewer lake pixels represent the remaining three quarters of all patches. This augmentation strategy particularly helped in addressing class imbalance which particularly affected the less representative “water” class. On the other hand, tiles covering non-water features and are easy to discriminate from surface lakes were included at a comparatively low random selection rate without performing data augmentation and tiles covering more difficult non-water features such as regions in shadow, open fractures or wet snow patches were augmented eight times with the same augmentation steps as for patches with fewer lake pixels. Overall, a total of 21,200 Sentinel-1 image patches was obtained and, together with the corresponding ground truth labels, forms the input dataset used for model training. Of the input patches, ~64% included the “water” class and ~36% covered features of the “non-water” class only. For model calibration (Section 2.3.2), the training dataset was further split into a random training and validation subset accounting for 80% and 20% of all training patches respectively. In this regard, the validation subset supports the model in updating its parameters and prevents the overfitting of the model to the training data. Ground truth labels were created manually for each of the Sentinel-1 monthly minimum raster layers considering the classes “water” and “non-water” only. Where possible, Sentinel-2 supraglacial lake extent mapping products were used to support data labelling. These products were created by training a RF classifier on optical Sentinel-2 and TanDEM-X topographic data (see [28]). Comparing the Sentinel-2 monthly lake extent mapping products to Sentinel-1 monthly minimum rasters, we yet observed partly large differences in lake extents. These differences most likely result from different acquisition times and days thus data availability but also from lakes that are severely roughened by wind or frozen over to the extent where they appear bright in SAR imagery while still being visible in optical imagery as well as very shallow slushy lakes being well recognizable in optical imagery but partly disappearing in SAR imagery.

2.3.2. Deep Learning Model Training

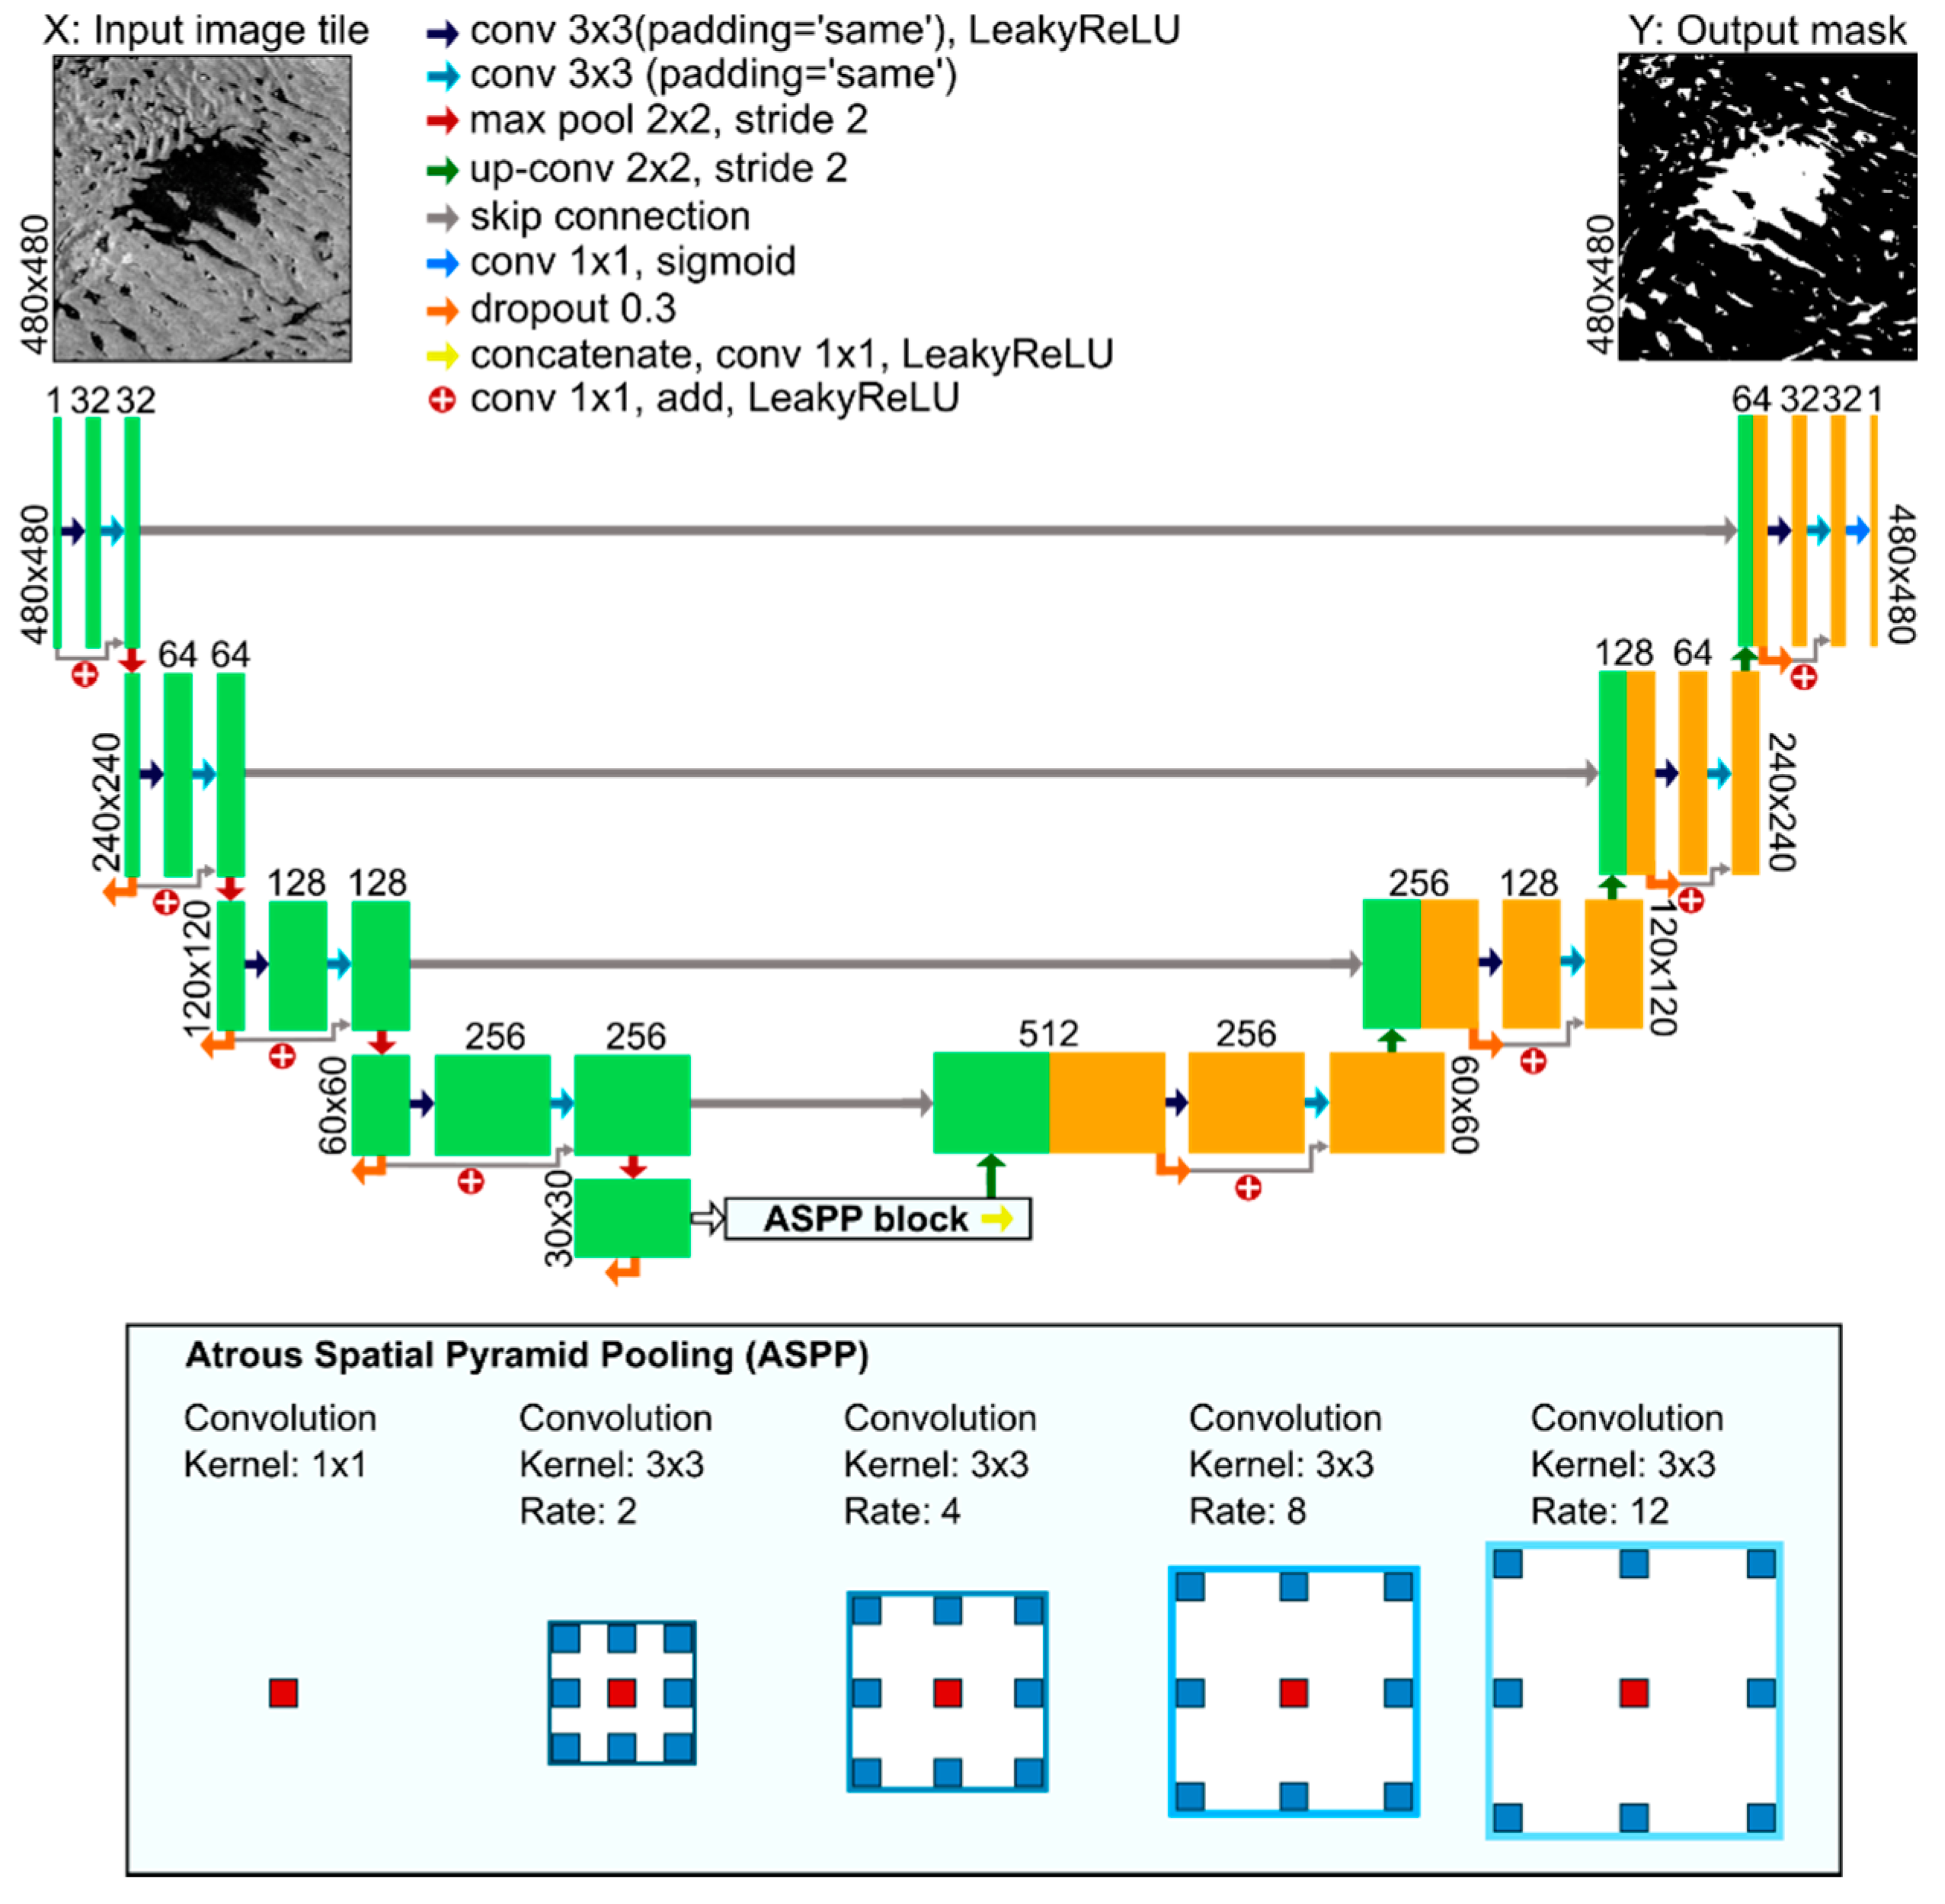
For image classification, we implemented a modified U-Net originally developed for biomedical image segmentation [43]. The concept of U-Net is based upon a “fully convolutional network” [50] which was adapted in order to obtain increased segmentation accuracies with only few training samples [43]. In detail, the U-Net architecture consists of a contracting path, the encoder, where successive image convolutions are followed by pooling operations, as well as an expansive path, the decoder, usually built of upsampling as well as convolution operators (Figure 6). In addition, so-called skip connections combine feature maps from the encoder with the corresponding operations in the decoder during upsampling, allowing the successive convolution operation in the upsampling block to obtain more precise results and maintain fine-grained details [43]. In addition to the possibility of achieving high classification accuracies with only few training samples, the main advantages of the U-Net are the low training time of the network as well as the consideration of the spatial image context particularly when extended with suitable modules [31,43]. Due to the mentioned advantages and particularly the preservation of fine-grained details, encoder-decoder designs such as U-Net are most frequently used in Earth Observation [31] and were therefore also chosen in this study.
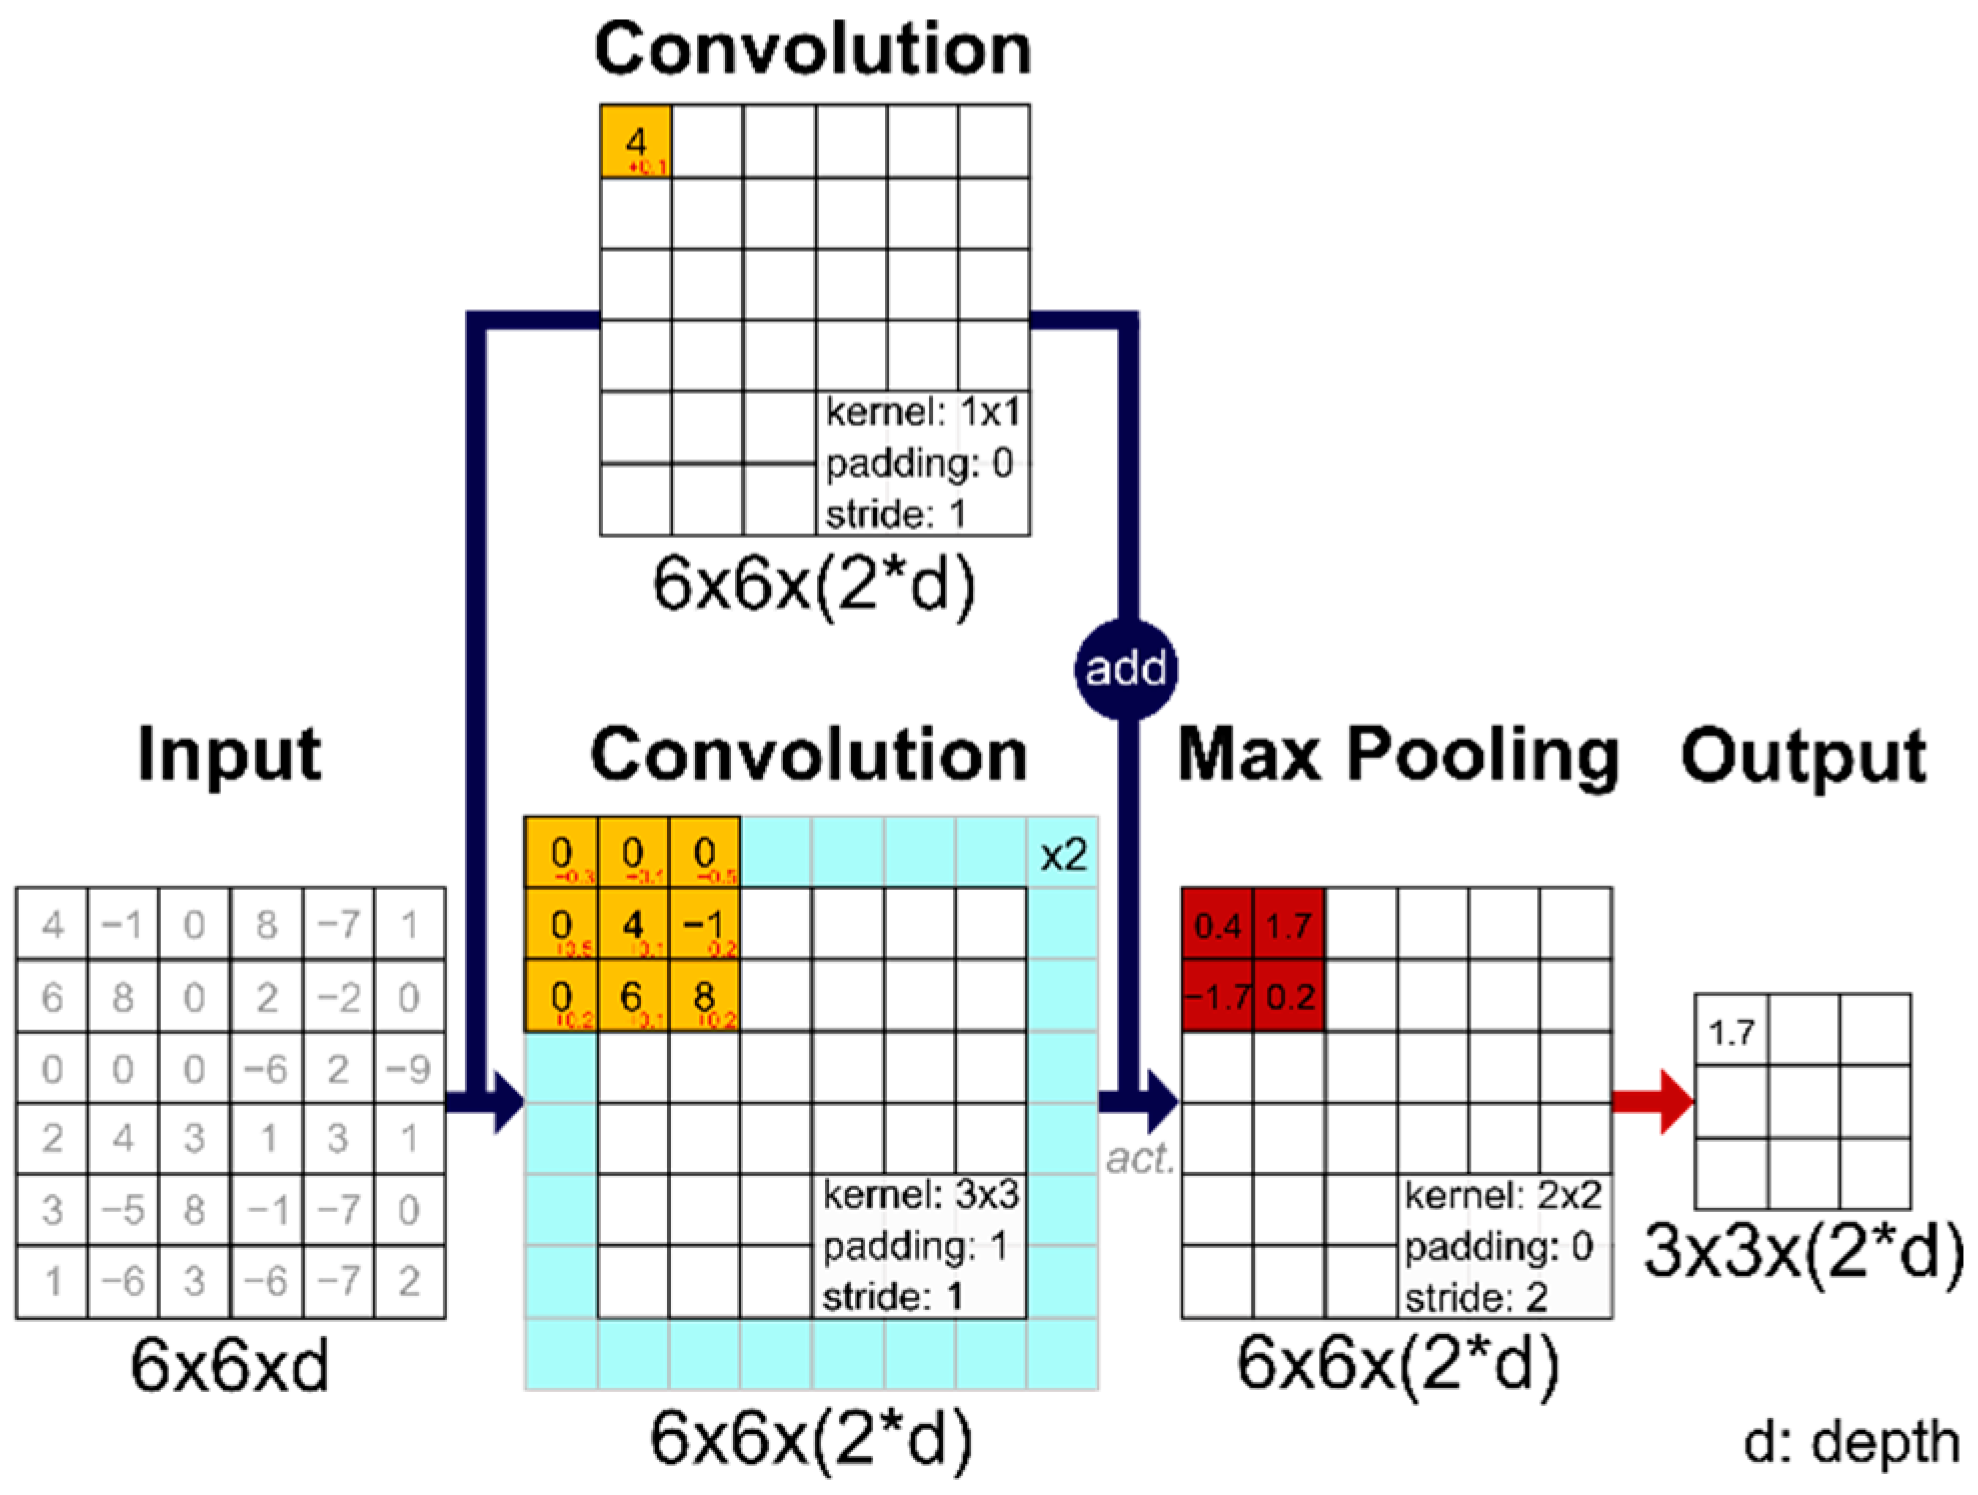
The modified U-Net designed in this study is composed of four downsampling blocks in the encoder and four upsampling blocks with convolutions in the decoder (Figure 6). Each downsampling block consists of two 3 × 3 image convolutions with one-pixel-width padding for patch size conservation, a residual connection to the input layers, a max pooling operation as well as a random dropout of input features (Figure 6 and Figure 7). The 3 × 3 image convolutions are performed in order to create a defined number of feature maps starting with 32 in the first block and reaching a maximum of 512 in the deepest block (see Figure S1). In each downsampling block in the encoder, the number of feature channels is thus doubled. In contrast to the conventional U-Net architecture, both, down- and upsampling blocks are implemented as ResNet blocks where so-called residual connections connect the output of the 3 × 3 image convolutions with the original input features of a respective block [51]. In order to obtain the same number of feature channels before adding the input channel to the convoluted output, the channel depth of the input is increased by convolution, then added to the output of the 3 × 3 convolutions and activated with the Leaky non-linear Rectified Linear Unit (LeakyReLU) activation function (Figure 6 and Figure 7). Residual connections were originally introduced with the ResNet architecture [51] and were frequently incorporated into CNN architectures as ResNet models converge better thus enable deeper networks to perform considerably better than their shallow counterparts [31,51]. U-Net architectures with residual connections were designed, e.g., for road extraction from aerial remote sensing imagery [42], for urban land cover classification in aerial and satellite imagery [52,53], for sea-land segmentation [54,55], for tree species classification in airborne imagery [56], for semantic segmentation of ships in optical remote sensing imagery [57], and also for biomedical image segmentation [58] (also see [31]). The subsequent max pooling operation is performed by taking the maximum value over a 2 × 2 window in order to halve the image size before entering the next downsampling block. After max pooling, a 0.3 dropout of input units is performed to prevent the overfitting of the model to the training dataset. In detail, dropout is a regularization technique where weights are dropped randomly during each training step. This allows training the model by means of various reduced versions of the original CNN, thus making it more robust to different input data. The dropout rate of 0.3 outperformed lower and higher dropout rates.
As can be seen in Figure 6, the bottleneck of the presented architecture is not a conventional convolutional block but an Atrous Spatial Pyramid Pooling (ASPP) module, first introduced with the DeepLab family [59]. ASPP uses atrous (or dilated) convolution kernels in order to increase the receptive field of the convolution operation thus captures multiscale information at different rates while maintaining resolution [60,61]. This is achieved by dilating the 3 × 3 kernel with defined numbers of blank pixel rows and columns and extracting the multiscale feature maps in parallel before concatenating, convoluting and passing them to the next building block or the first decoder block in the case of U-Net (Figure 6). Atrous convolutions have frequently been incorporated into CNN architectures and U-Net in particular (e.g., [53,62,63,64]) and are of major advantage for better consideration of the spatial image context, e.g., for segmentation of image objects with strongly varying sizes thus support attention to detail and result in less blobby segmentation results [31]. This is particularly helpful given the strongly varying appearance of Antarctic supraglacial lakes in Sentinel-1 SAR imagery, as shown in Figure 2. In this study, we used atrous rates of 2, 4, 8, and 12 (Figure 6) for better detection of objects of varying sizes and high density [64] compared to the originally proposed rates of 6, 12, and 18 in DeepLabV3+ [65]. In addition, a 1 × 1 convolution is performed alongside the atrous convolutions (Figure 6).
The decoder of the network is designed symmetrical with respect to the encoder. In its 4 upsampling blocks, a sequence of 2 × 2 up-convolutions restores the original patch size whereby each up-convolution is followed by a concatenation with the corresponding high-resolution feature maps from the downsampling block via skip connections, a 0.3 dropout as well as a residual block activated with the LeakyReLU activation function (Figure 6). Finally, a 1 × 1 image convolution is used to combine the last 32 feature maps into a prediction probability map for the “supraglacial lake” class, provided at the original 480 × 480 pixels patch size. For activation of the output layer, the sigmoid activation function was used. The model was compiled using the “binary crossentropy” loss function, the Adamax optimizer and an initial learning rate of 0.001. As the learning rate is one of the most crucial hyperparameters, we set an additional callback to automatically reduce the learning rate by a factor of 0.1 if the validation loss did not improve over the course of 3 epochs. In fact, the validation loss did not reduce between epochs 8 and 11 as well as between epochs 15 and 18 and the learning rate was reduced to 0.0001 after epoch 11 and to 0.00001 after epoch 18. Finally, the model converged after 30 epochs. We also trained a shallow counterpart of the network as well as shallow and deep representations of the basic U-Net without ASPP or residual connections but found best classification results with the architecture presented above.
Overall, the modified U-Net consists of 10.6 million trainable parameters and was trained on a GeForce GTX 1080 GPU. For implementation, we used the Keras API built on top of TensorFlow 2.2. Prediction of a single Sentinel-1 scene takes ~5 to 6 minutes before post-classification (see Section 2.3.3). Figure 6 shows the modified U-Net architecture and Figure 7 illustrates a simplified sketch of a single downsampling unit at image level.

2.3.3. Post-Processing

After model training and tile prediction, the obtained segmentation results were further refined by means of four main post-processing steps (Figure 3). At first, the original image shape had to be reconstructed from the prediction patches. In overlap regions, prediction results were calculated as the mean of all prediction probabilities. Next, each reshaped probability map was thresholded for conversion into a binary classification product. In detail, all pixels above a threshold of 0.5 were accepted as lake pixels while pixels below that value were set to zero. Higher threshold values were also tested but resulted in a slight underestimation of lake areas in some test regions. In a third step, we masked lake pixels in high altitudes (>1500 m), in particularly steep terrain (>5%) as well as seaward of the coastline. For topographic masking, we used the 90-m Antarctic TanDEM-X DEM (Section 2.2.2) and thereof derived slope maps. The elevation and slope thresholds were chosen in agreement with the analysis in Dirscherl et al. [28] and in Stokes et al. [18] and aided in removing false lake classifications in regions, where supraglacial lakes cannot accumulate or where surface slopes greater than the radar look angle and oriented away from the side-looking radar imaging system cause the corresponding image region to appear in shadow thus with very low backscatter values similar to water (see Figure 2o). For coastline masking, we used a buffered version of the 2018 Sentinel-1 coastline (Section 2.2.3). In detail, a buffer of 150 pixels was introduced in landward direction in order to allow a better masking of potential ocean pixels also in test scenes with fluctuating or retreating coastal sections compared to 2018. Finally, we performed morphological erosion in order to eliminate lake areas <300 m2 as well as to close small holes of the same size within lake boundaries. The resulting lake classification raster products are provided at 10-m pixel resolution in the WGS 1984 Antarctic Polar Stereographic projected coordinate reference system.
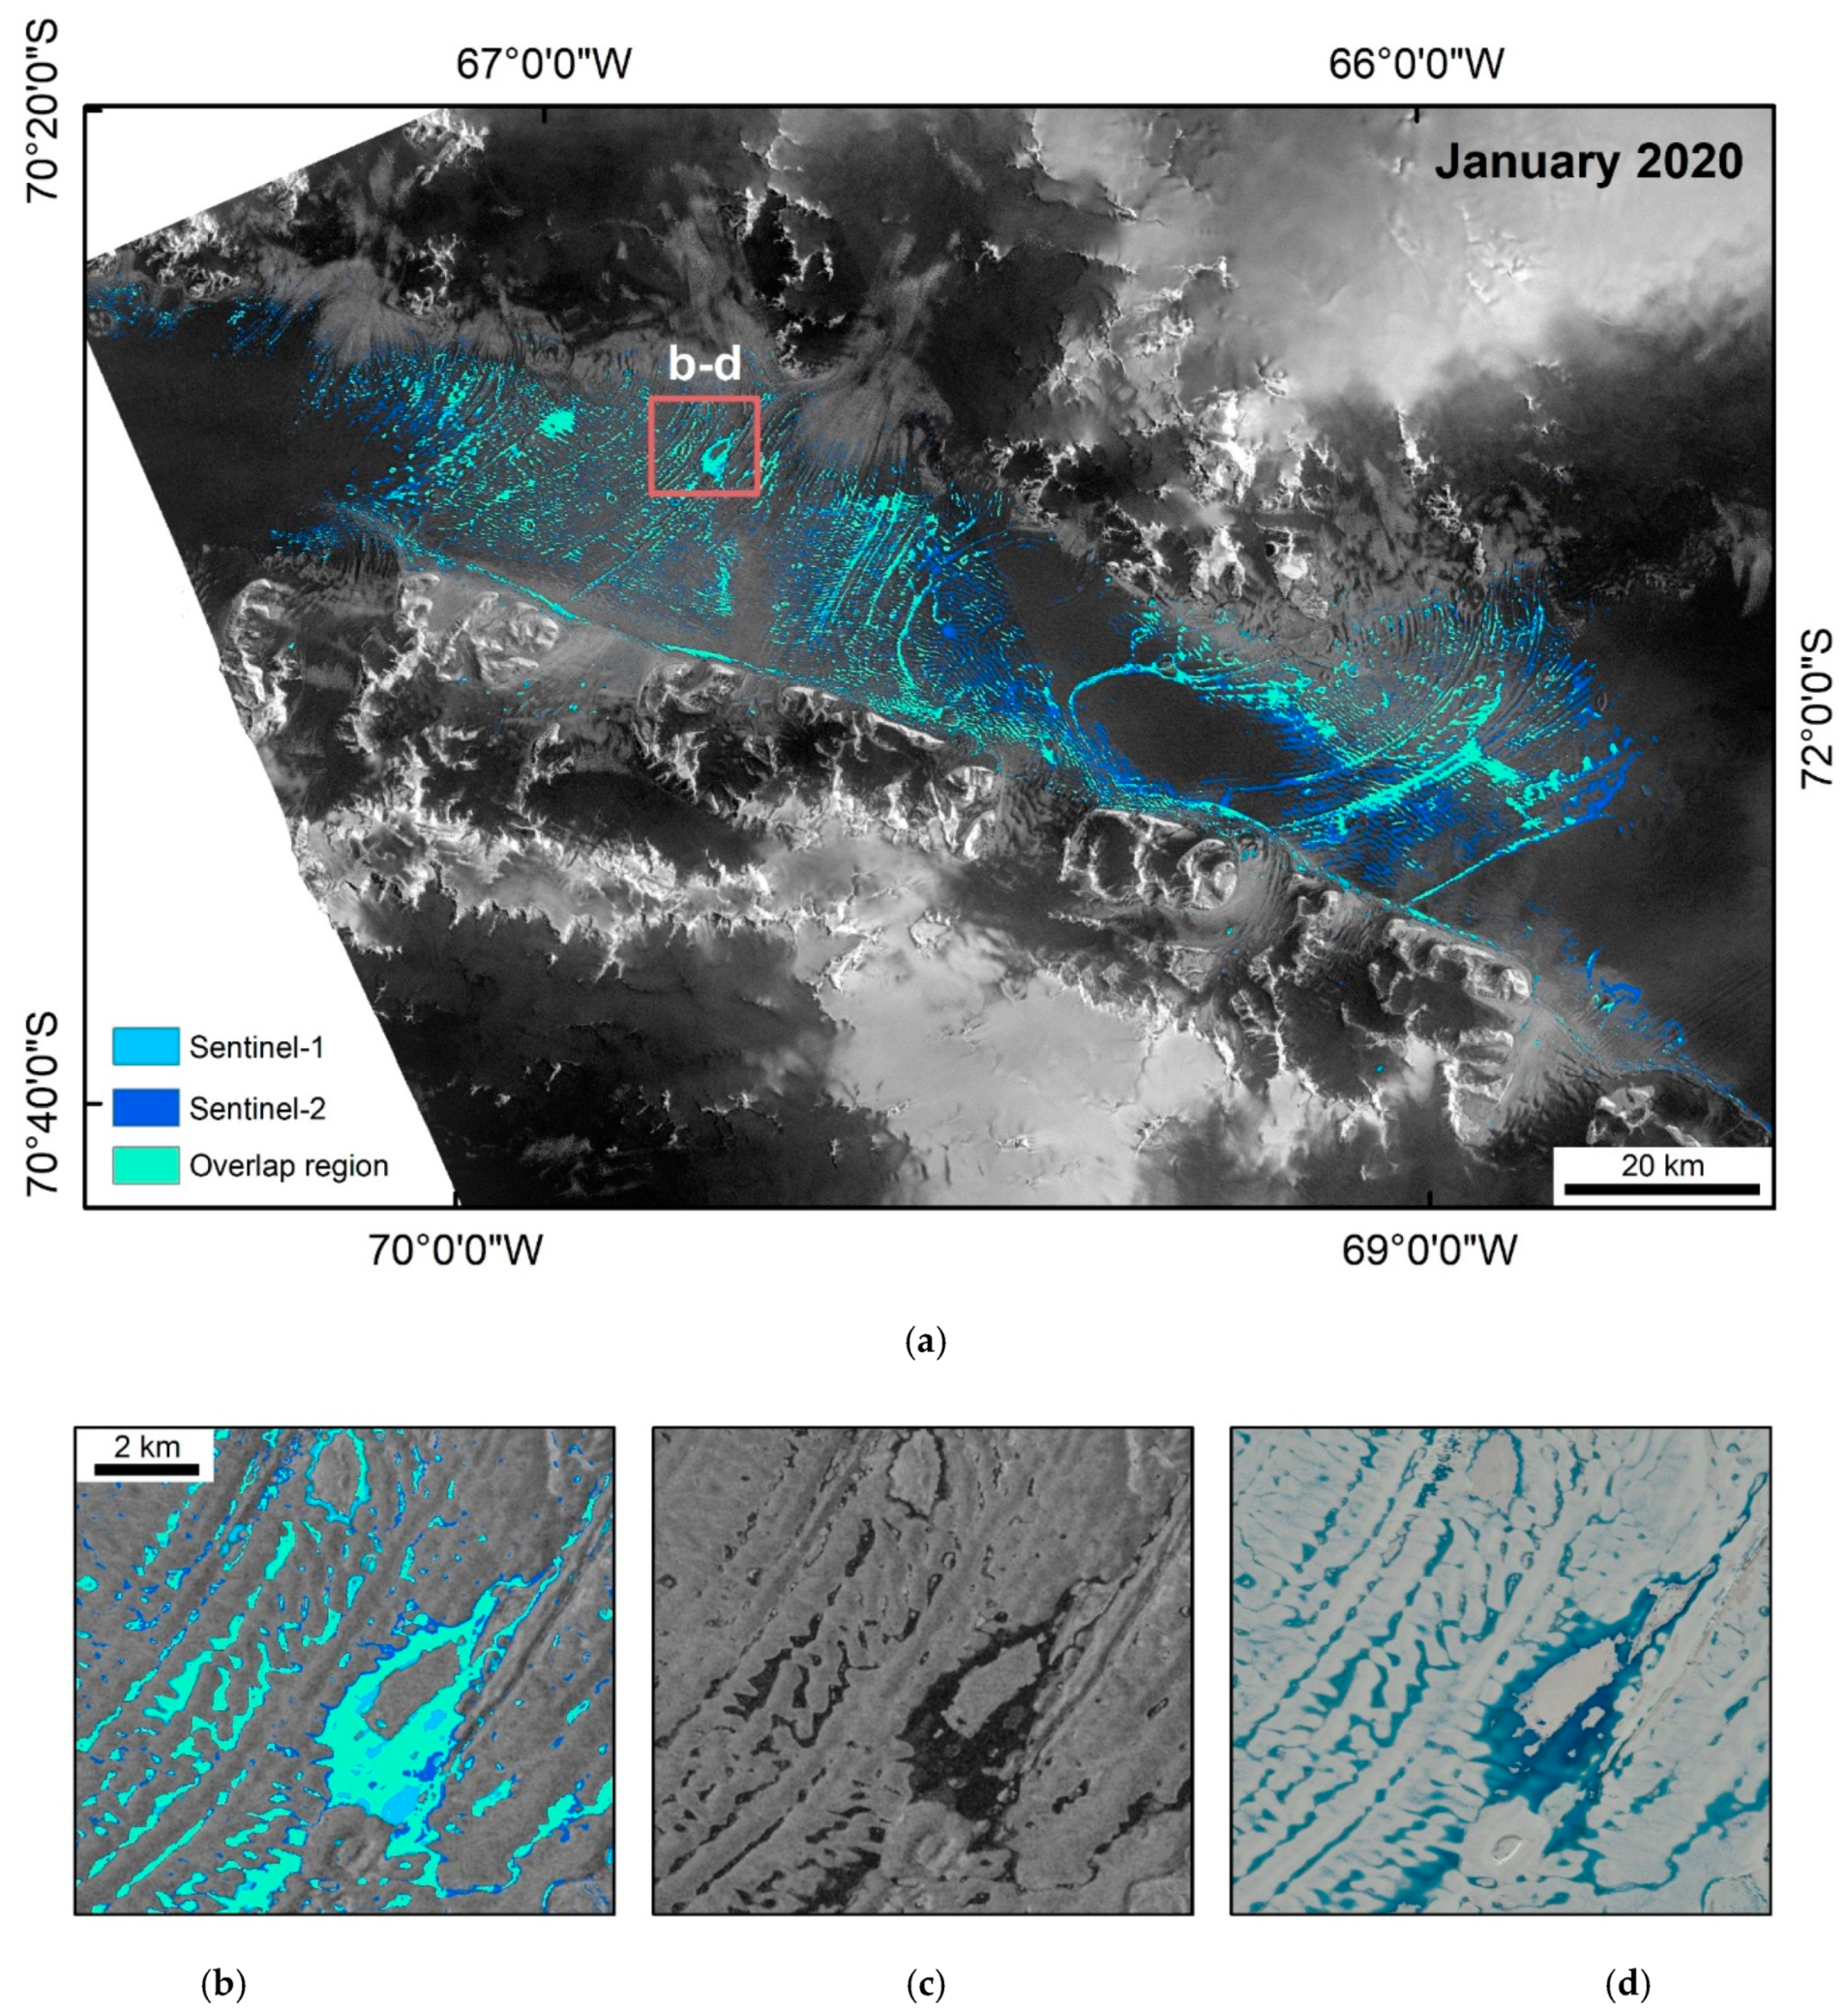
For the test region covering George VI Ice Shelf, additional post-processing steps were required and involved (1) the merging of the individual December 2019 as well as January and February 2020 classification products to monthly classification products and (2) the decision-level fusion of the individual Sentinel-1 classification products covering January 2020 with a Sentinel-2 derived maximum lake extent mapping product of January 2020 [28].

2.3.4. Accuracy Assessment

As no circum-Antarctic lake inventory exists to date and as Sentinel-1 lake extents may differ from classification products derived with other remote sensing techniques (e.g., optical instruments), random point samples were created in order to perform the accuracy assessment using the underlying Sentinel-1 images as ground truth. In detail, we buffered the water class within all nine obtained classification maps as well as in the 13 January 2020 classification map over George VI Ice Shelf by 25 pixels and randomly sampled a total of 18,000 points in the buffered water class of all test images as well as additional 5000 points for George VI Ice Shelf, where most supraglacial lakes were located. For test scenes, the number of points to be sampled per scene was determined with respect to the areal share of lake pixels compared to all other testing scenes. Buffering around detected lake pixels enables the evaluation of areas particularly prone to misclassifications [28]. Following point sampling, we visually compared the classification points to the underlying Sentinel-1 imagery as well as Sentinel-2 maximum lake extent mapping products [28] and documented the rate of true and false positives and negatives within the confusion matrix of all test scenes. Since some of the test scenes covered only few small lakes with respect to the background class, the accuracy assessment was performed for all test scenes conjointly. Given the differences between Sentinel-1 and Sentinel-2 lake extents, the Sentinel-2 mapping products were only used as indicator for potential supraglacial lake occurrence.
The confusion matrix was evaluated by means of common statistical accuracy metrics including Recall (R) and Precision (P), F-score ( F 1 ), errors of commission (EC) and omission (EO) as well as Cohen’s Kappa (K) [66,67]. Recall and Precision were derived dividing the number of true positive pixels (TP) of a given class by the total number of true class samples or the total number of overall predicted class pixels respectively [66,67]:
R =   TP TP + FN
P =   TP TP + FP
where FN and FP are the false negatives and false positives, respectively. Next, the F-measure was calculated as the harmonic mean of both, Recall and Precision:
F 1 =   2   ×   ( R   ×   P ) ( R + P )
The errors of commission and omission were computed to capture the rate of false positives with respect to all class predictions and the rate of false negatives with respect to all true class samples respectively. Finally, Cohen’s Kappa was calculated as an overall quality measure by dividing the subtraction of overall (OA) and expected accuracy (EA) by the negative expected accuracy [68,69]:
K = OA EA 1 EA
where the OA is computed dividing the sum of all true positives and negatives (TN) by the total number of sampled points (TS) and the EA is derived using the expression in (6):
OA =   TP + TN TS
EA = ( TN   +   FP )   ×   ( TN   +   FN ) + ( FN   +   TP )   ×   ( FP   +   TP ) TS   ×   TS
Kappa thus measures the similarity between classification results and ground truth where values approaching one represent better agreement than values close to zero [69].

3. Results

3.1. Classification Results

3.1.1. Test Regions

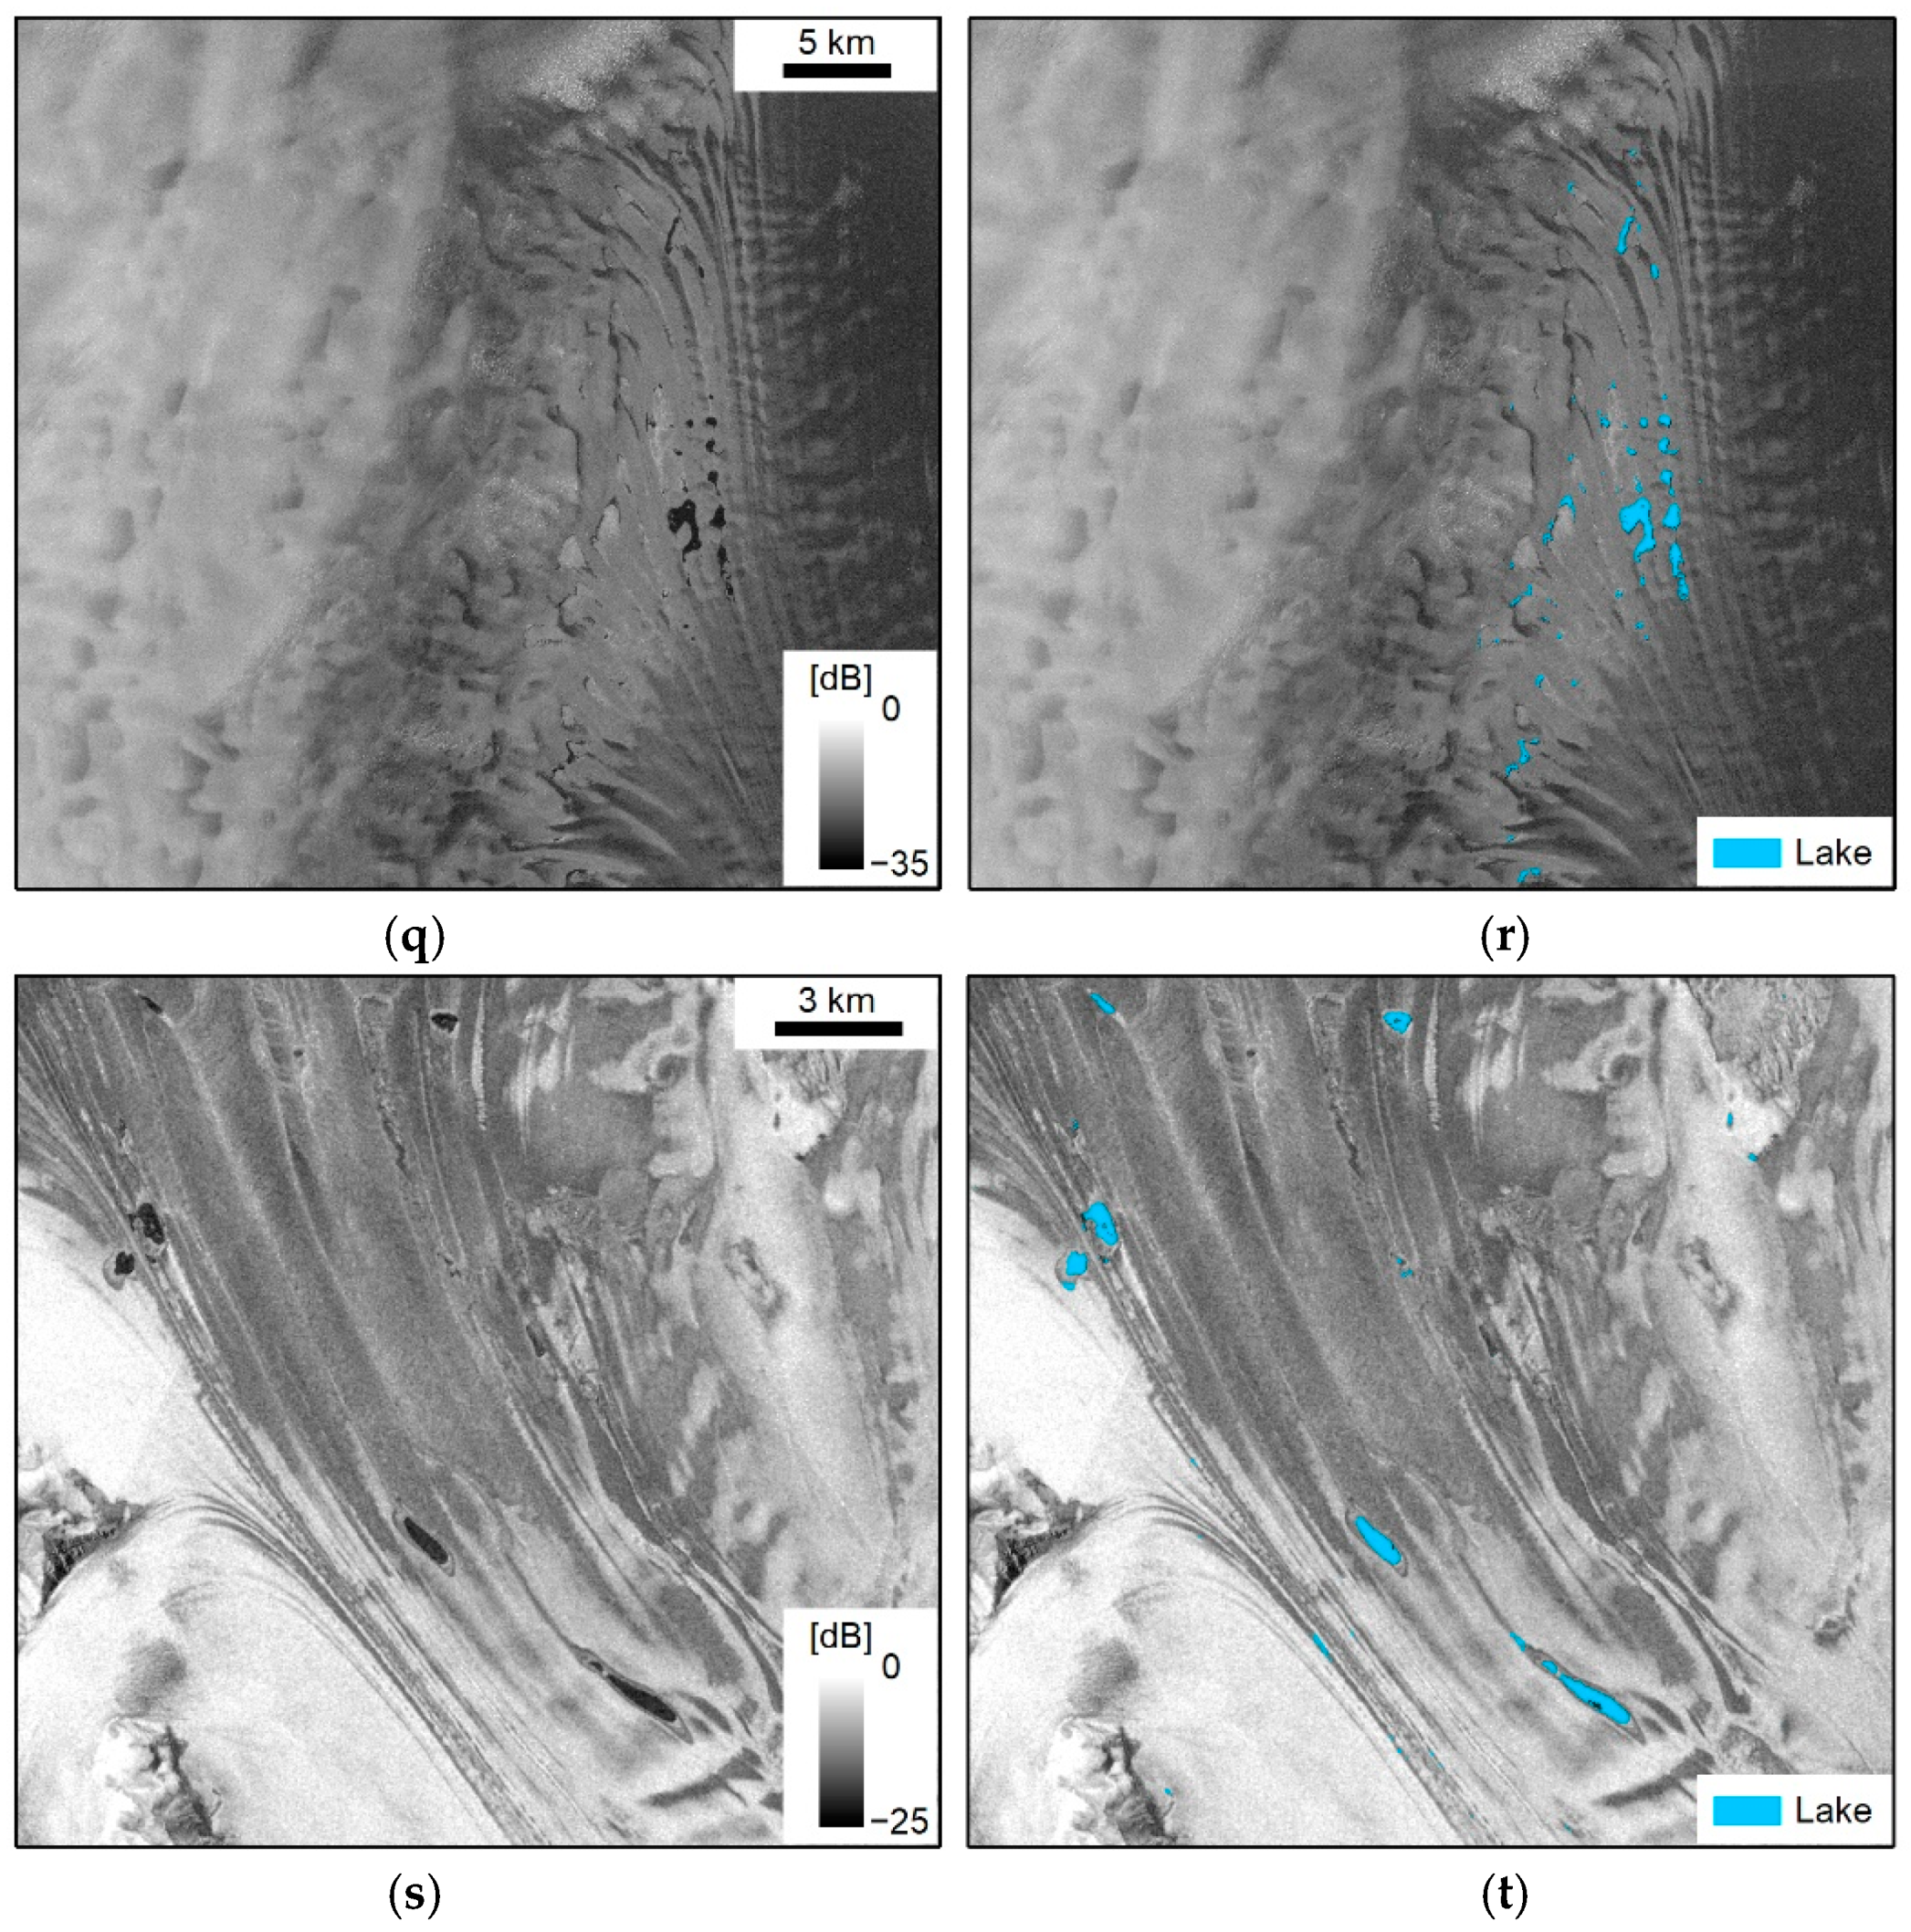
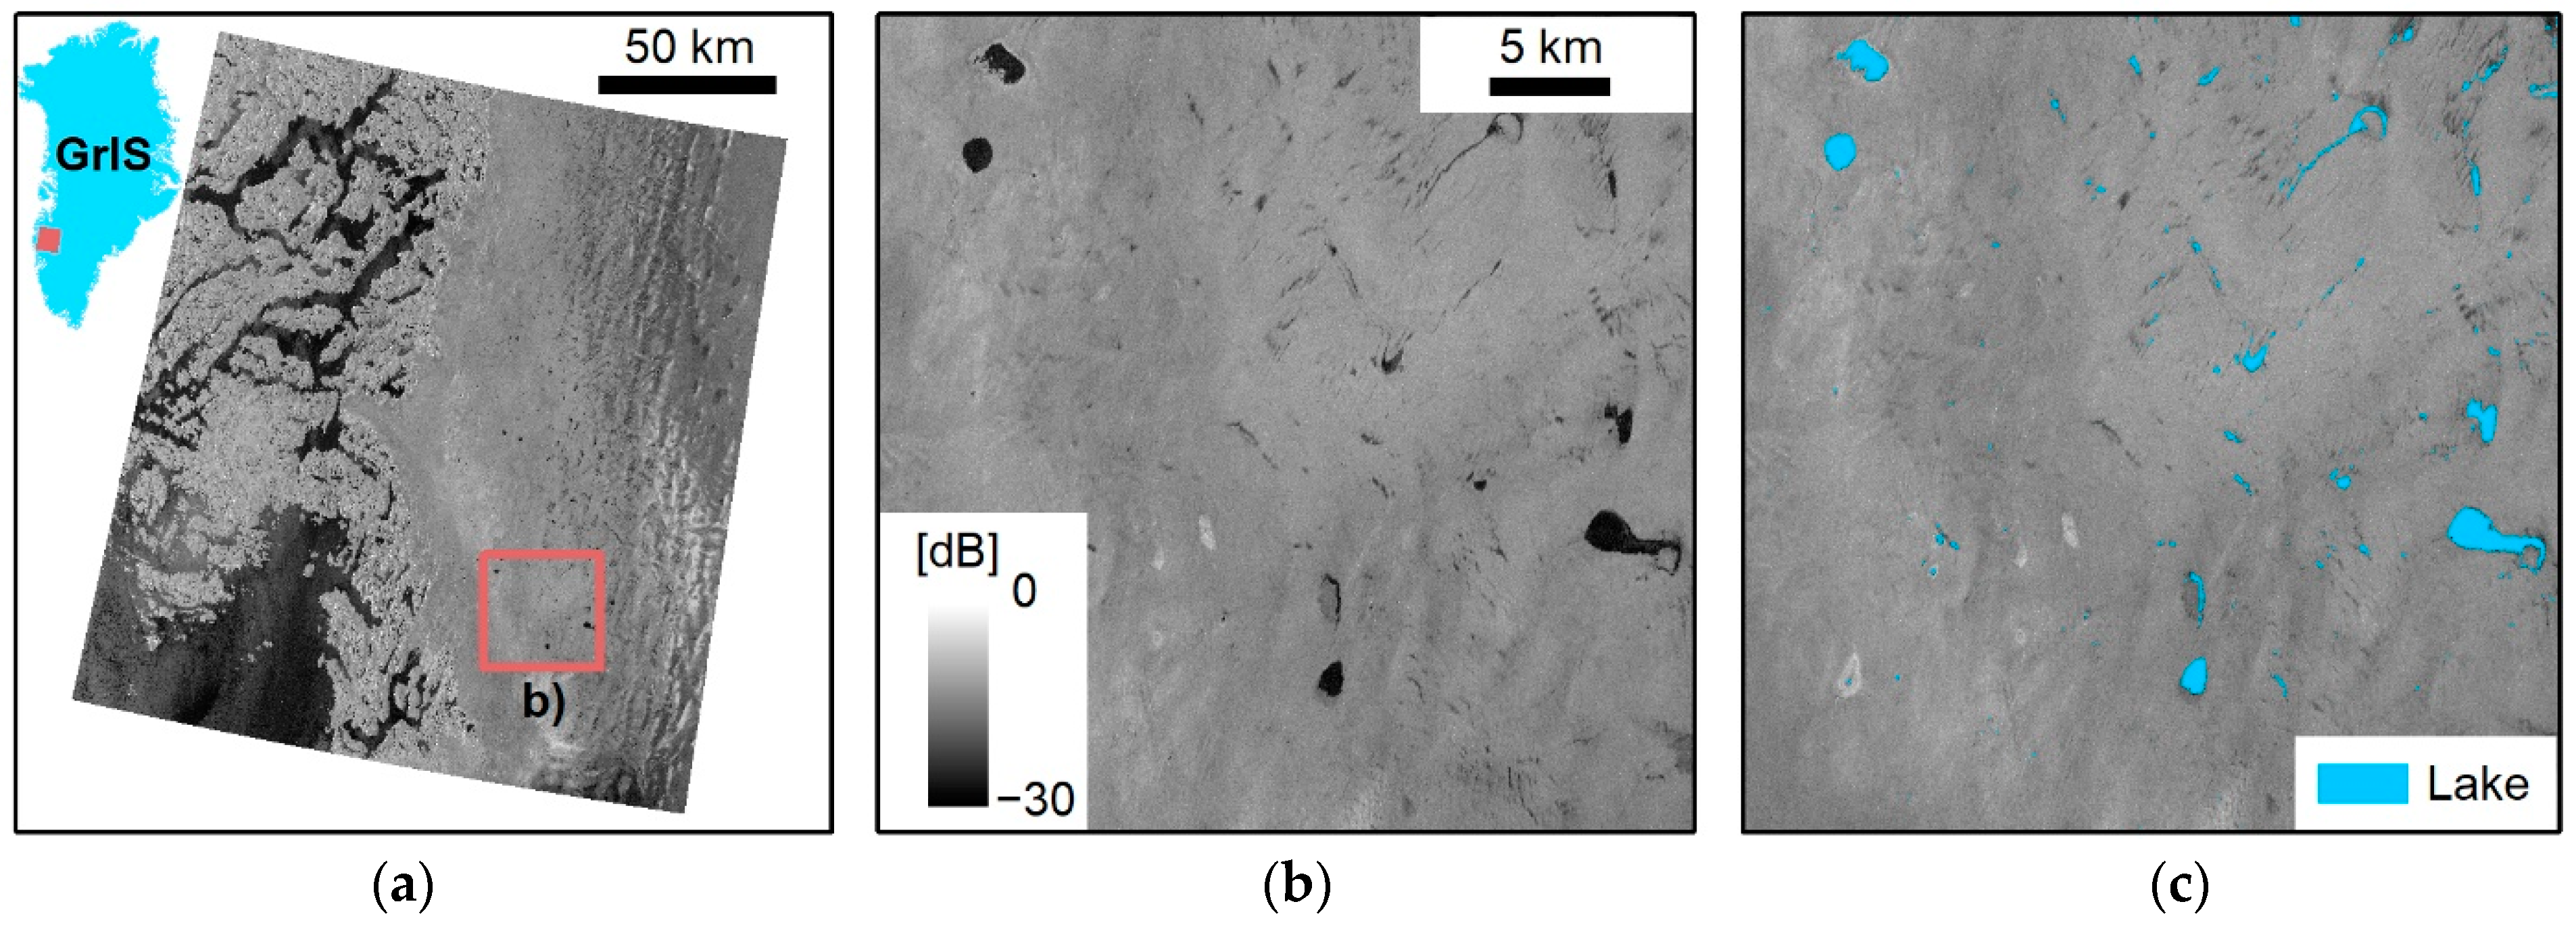
Figure 8 shows the automatically derived classification results for extracts of all Sentinel-1 test scenes (Table 1). As can be seen, numerous supraglacial lake features were detected with their sizes, shapes, and appearances varying strongly among the test regions. Comparatively few surface lakes were detected on Cosgrove (Figure 8b), Abbot (Figure 8d), Larsen C (Figure 8h), and Shackleton (Figure 8p) ice shelves as well as in Enderby Land (Figure 8l). More numerous and larger melt ponds with diameters or lengths 1 km were found on Bach (Figure 8f), Riiser-Larsen (Figure 8j), Amery (Figure 8n), Moscow University (Figure 8r) as well as Rennick Ice Shelf (Figure 8t). Figure 8 also shows that lakes with partly fuzzy lake edges (Figure 8d), low visual contrast or noise (Figure 8d,f,h) as well as comparatively small surface lakes with diameters <1 km (Figure 8b,p) were classified correctly. In addition, difficult surface features such as radar shadow (Figure 8h,l,n), wet snow patches (Figure 8d,l) or open ocean (Figure 8f,l) were correctly differentiated or masked in the presented classification extracts. In some regions (e.g., Figure 8j,t), small lake parts of particularly large, elongated lakes were yet missed in the classification. Furthermore, Figure 9 shows the automatically derived supraglacial lake classification result for southwest Greenland on 28 July 2018. Here, comparatively large and well-defined surface lakes were mapped.

3.1.2. Spatio-Temporal Lake Dynamics on George VI Ice Shelf

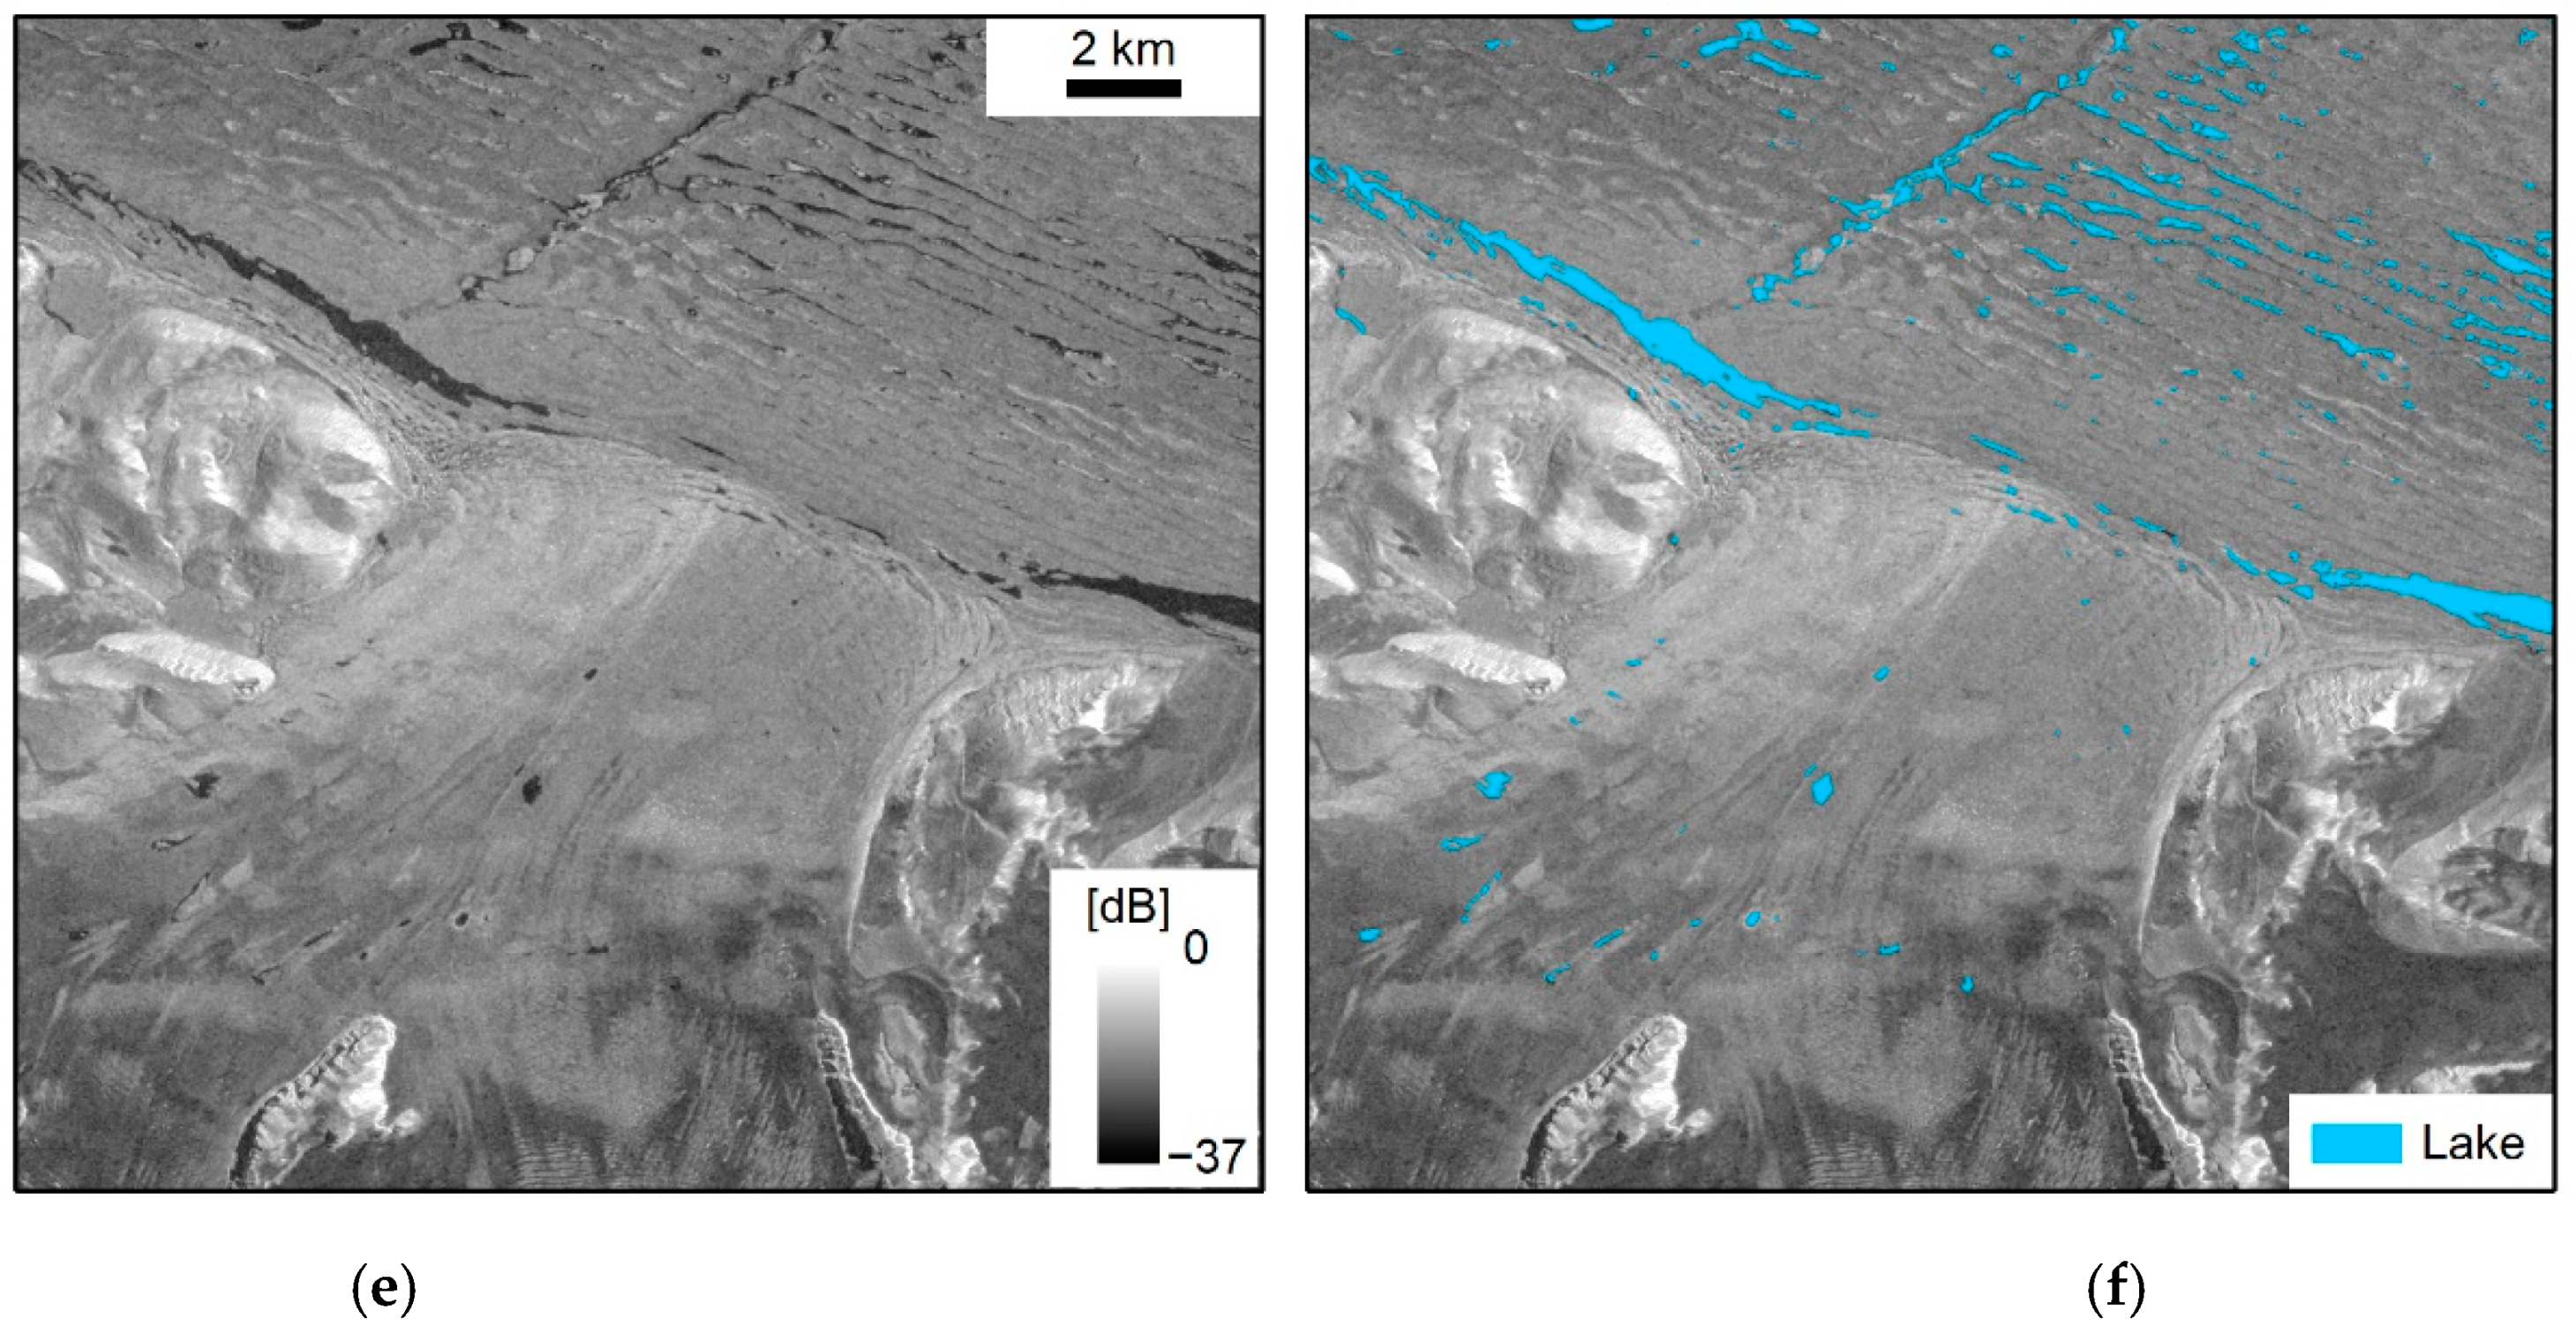
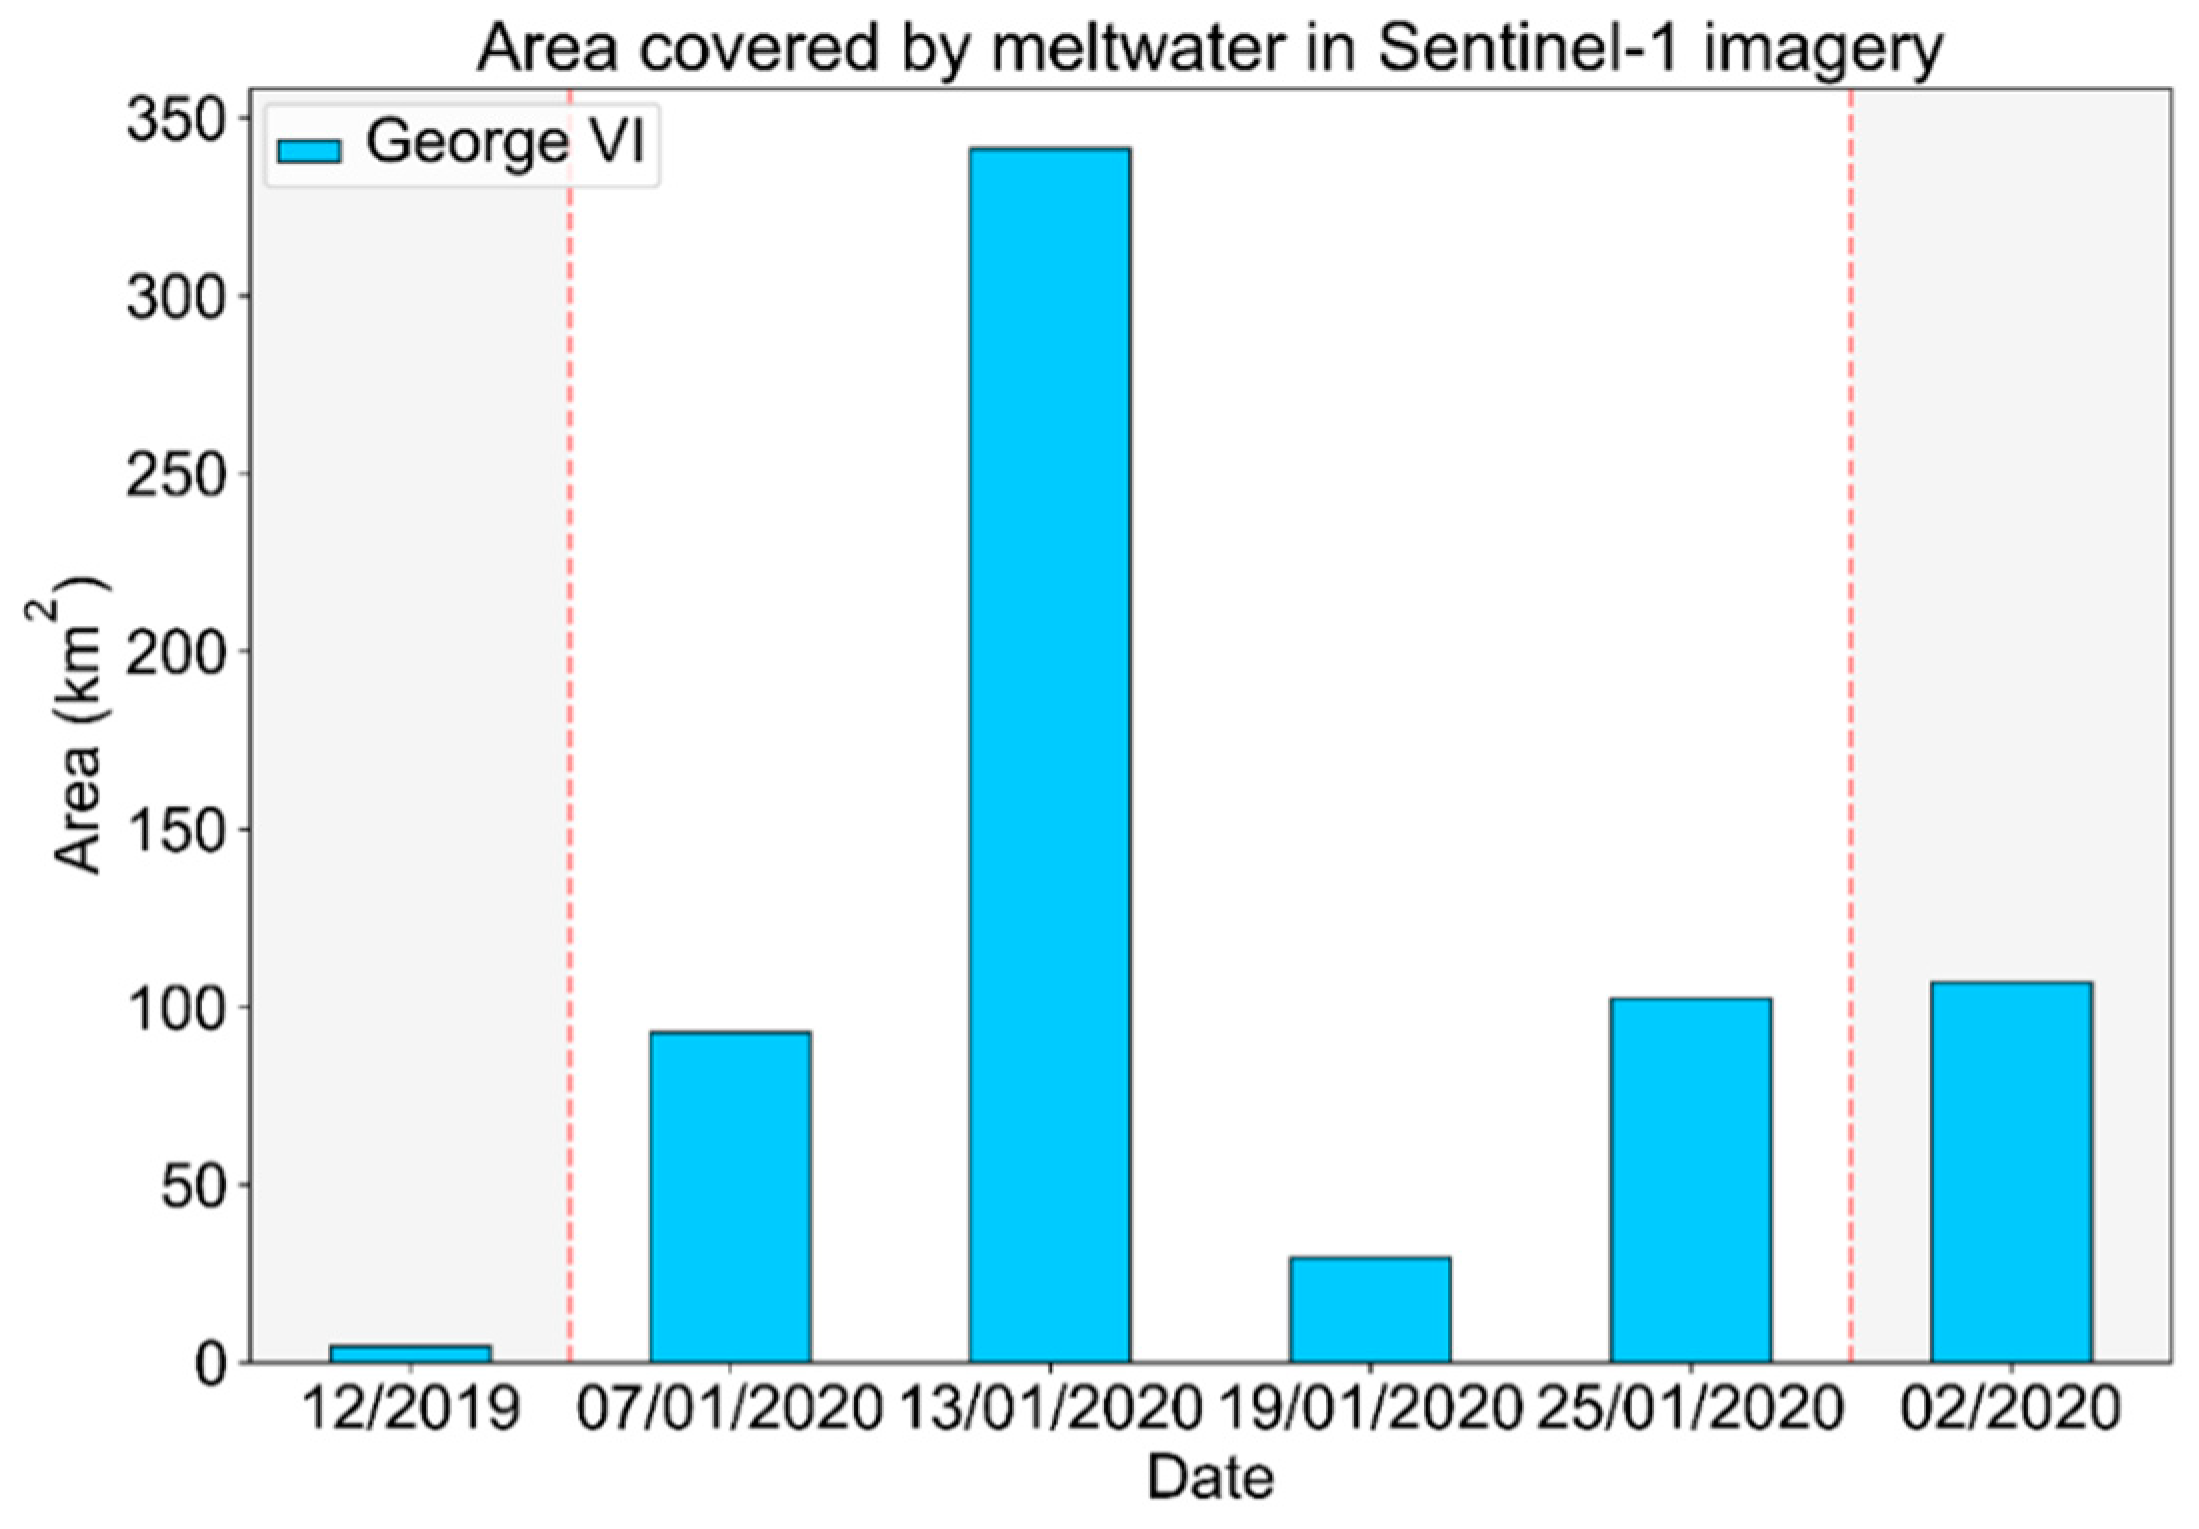
By far the largest and most numerous surface lakes were detected on George VI ice shelf (Figure 10). Here, surface lakes range from small to large lake features with diameters oftentimes well beyond 1 km as well as from round to elongated ponds (Figure 10a,c,e). Furthermore, Figure 10c,d also shows that lakes that were partly frozen over with a thin layer of ice were still classified correctly. As described in Section 2.2.1, the individual December 2019 as well as January and February 2020 acquisitions covering George VI Ice Shelf were classified with our modified U-Net in order to track temporal lake extent dynamics throughout austral summer and especially January (Figure 11). To begin with, supraglacial lake coverage in December 2019 was with 4.6 km2 only minor (Figure 11). In January 2020, an overall maximum supraglacial lake extent of ~385 km2 was detected of which most lakes formed between 7 and 13 January 2020. In fact, the Sentinel-1 acquisition of 13 January 2020 (Figure 10a) revealed a total supraglacial lake coverage of ~341 km2 across the whole ice shelf (Figure 10b and Figure 11). Another peak was detected on 25 January 2020 (~102 km2) following a comparatively low coverage in the Sentinel-1 scene of 19 January 2020 (~30 km2) (Figure 11). In February 2020, the classification of Sentinel-1 acquisitions revealed comparatively few lakes with their full coverage equaling to ~107 km2 for the entire month (Figure 11). We also mapped the January 2020 maximum lake extent in optical Sentinel-2 imagery using a RF machine learning classifier [28] and fused the mapping product with the Sentinel-1 classification results of January 2020 (Figure 12) at decision-level. As can be seen in Figure 12, the combination of both classification products enabled a more complete and detailed mapping of supraglacial lake coverage during the given month. In fact, ~385 km2 of the surface hydrological network were detected in Sentinel-2 optical imagery only, ~39 km2 were mapped using Sentinel-1 SAR imagery only and ~346 km2 of surface meltwater were present in both data products resulting in a total supraglacial lake extent of ~770 km2 for January 2020 in the fused classification product.

3.2. Accuracy Assessment

Table 2 shows the results of the accuracy assessment for the “water” and the “non-water” class across all test scenes. As can be seen, the EO across all test sites was detected to be slightly higher for the water class (1.17%) than for the non-water class (0.83%) while being low overall. Similarly, the EC was found to be higher for the water class (11.1%) compared to the non-water class (0.14%). The comparatively high EC of the water class is also reflected in a reduced value for the average P (88.9%) as well as F 1 (93.0%) while the low EO is reflected in a high value for the average R (98.83%). On the other hand, the low error rates for the non-water class raised high values for R (99.17%), P (99.86%), and F 1 (99.51%), respectively. Finally, the average Kappa across all test sites and classes was computed at 0.925.

4. Discussion

4.1. Classification Results

As revealed in Section 3.1.1, numerous supraglacial lakes were detected in the Sentinel-1 test scenes distributed across the Antarctic continent. The presence of supraglacial lakes on Abbot, Cosgrove, George VI, Riiser-Larsen, Amery, and Shackleton ice shelves as well as in Enderby Land is in good agreement with reported supraglacial lake occurrences in Sentinel-2 imagery [28] as well as in other independent studies (e.g., [18,25]). As can be seen in Figure 8, Figure 9, Figure 10 and Figure 12, lake extent delineations are reliable for all test scenes as well as the additional study region in southwest Greenland which indicates the good functionality and potential for spatio-temporal transferability of our supraglacial lake classification method.
In Section 3.1.2, we presented for the first time a Sentinel-1 based intra-annual analysis of supraglacial lake coverage on northern George VI Ice Shelf during the 2020 melting season (Figure 11) as well as a fused Sentinel-1 and Sentinel-2 maximum lake extent mapping product covering northern George VI Ice Shelf in January 2020 (Figure 12). The results in Figure 11 suggest that Sentinel-1 SAR imagery as well as our workflow is very suitable for multi-temporal analyses of the Antarctic surface hydrological network. At the same time, fused classification products were identified to be particularly important in order to obtain a more complete picture of monthly supraglacial lake extents at full ice shelf coverage (Figure 12) and greatly aid in overcoming the limitations of single-sensor classification products. At this point, it has to be noted that calculations of maximum lake extent mapping products, e.g., from Sentinel-1 composites over longer periods and in ice shelf regions where particularly fast ice flow prevails should consider the movement of lakes with ice flow in order to avoid an overestimation of maximum lake extents. This could be achieved with support of ice flow velocity maps and will be considered in future work on large-scale derivation of supraglacial lake extent mapping products.

4.2. Accuracy Assessment

The results of the accuracy assessment in Table 2 further confirm the good functionality and spatio-temporal transferability of our CNN for supraglacial lake detection in Antarctica. In fact, our deep learning algorithm enabled the detection of both, large (Figure 8f,j,r,t, Figure 10 and Figure 12) and small (Figure 8b,d,p) lake features as well as of slightly frozen (Figure 10c,d and Figure 12b,c), slushy and fuzzy supraglacial lakes (Figure 8c,d and Figure 10e,f). Yet, the slightly increased EC and reduced P and F 1 of the water class reflect some remaining error sources due to false positive lake classifications. To start with, the use of the 2018 Sentinel-1 coastline for ocean masking led to misclassifications where the calving front retreated widely since 2018. This particularly applied to regions where open ocean between floating sea ice or icebergs appeared in similar shapes and sizes as supraglacial lakes or where open rifts and fractures formed at the front of the glacier. For instance, this was observed for the test scenes covering Riiser-Larsen and Rennick ice shelves as well as in Enderby Land. Another remaining source for false positive lake classifications is associated with radar shadow around rock outcrop as well as with round blue ice or wet snow patches oftentimes appearing similar to Antarctic lake features particularly when they are slightly frozen, slushy or roughened by wind. Analyzing the full classification maps of the test scenes, we found that misclassifications due to round blue ice or wet snow patches as well as topographically induced shadow occurred over small regions in Enderby Land as well as near Riiser-Larsen, Moscow University, and Rennick ice shelves despite being successfully masked in the image extracts shown in Figure 8. For Rennick and Moscow University Ice Shelf, one reason for the slightly higher error rates could be their spatial locations furthest from training regions (Figure 4). Finally, some false negative lake classifications were detected over particularly large, elongated lakes, e.g., on Riiser-Larsen (Figure 8j), George (Figure 10b), or Rennick (Figure 8t) Ice Shelf.

4.3. Future Requirements

To further refine the proposed classification algorithm, the most important measure would be to increase the training dataset with more training patches covering supraglacial lakes of different shapes and sizes as well as surface features that are oftentimes misclassified as supraglacial lakes. In particular, data covering large supraglacial lakes were slightly underrepresented in our training dataset requiring extensive data augmentation. This in turn might have introduced a slight overfitting of the model towards the training lakes. Since large lakes are not particularly widespread in Antarctica to date, Sentinel-1 imagery covering large supraglacial lakes on the GrIS (e.g., Figure 9b) could be included in the training of the deep learning network which would further support the applicability of the algorithm for detection of supraglacial lakes also in Greenland. In addition, due to the misclassification of open ocean patches between floating sea ice as surface lakes, ocean pixels are currently masked using a buffered Sentinel-1 derived coastline of 2018 [34]. In order to reduce the computational load during post-processing as well as to overcome potential errors where the coastline retreated since 2018 (see Section 4.2), future efforts could therefore include the integration of training patches covering open ocean or the use of even more up-to-date coastline data, e.g., derived from the test scenes themselves. In addition, more training patches covering small blue ice and wet snow patches or topographically induced shadow, e.g., in Victoria or Wilkes Land on the EAIS, should be integrated into model training. In this regard, another measure for masking of misclassifications could be the integration of more high-resolution DEM data or of Sentinel-1 derived temporal image metrics during post-classification. At the same time, this would drastically increase computational load. Moreover, for better and more representative evaluation of the obtained classification results, ground truth data, or comparable data products from flight campaigns would be particularly beneficial but were not available within this study.
Regarding the model architecture and training parameters, the use of a weighted loss function (e.g., [57,70]) or the integration of sample weights for each training mask could be tested. However, as the current model setting returned good results, weighted loss functions were not considered as part of this analysis. One reason for the good functionality of our network even without weighing the loss certainly is the implementation of the augmentation strategy with respect to the number of lake pixels per training patch resulting in a more equal division of training pixels among the “water” and the “non-water” class. Another aspect to consider in future efforts could be the integration of additional bands during training. Even though the sole use of single-polarized Sentinel-1 data returned good classification results, the use of dual-polarized Sentinel-1 data or the integration of temporal image information or of high-resolution DEM data, such as the 8-m Reference Elevation Model of Antarctica (REMA) [71], during training could further enhance classification accuracy. As the current version of the REMA DEM still contains gaps and as its use would drastically increase computational load, an integration of the REMA DEM was not considered at this point. Furthermore, dual-polarized Sentinel-1 data over Antarctica are currently available at 40-m resolution only which would greatly reduce the visibility of small or elongated melt ponds if integrated into model training. However, the consideration of additional image information would be particularly beneficial for better discrimination, e.g., between wet snow patches and supraglacial meltwater being particularly difficult to differentiate. In addition, for detection of lakes that are frozen over with a thicker layer of ice (subsurface lakes) or are severely roughened by wind, another complementary mapping method could be developed in the future but would most likely require image information beyond single-polarized SAR backscattering products.
In order to obtain more detailed insight into the drivers of increased meltwater production, e.g., over George VI Ice Shelf (Figure 11), as well as the impacts of the Antarctic surface hydrological network on ice dynamics and mass balance, future analyses should also include data on surface air temperatures and wind as well as on surface elevation, calving front, grounding line or ice motion change. In addition, the development of circum-Antarctic and intra-annual mapping strategies using the proposed algorithm and fusion of classification products is particularly important in order to support an improved representation of meltwater transport across Antarctic ice shelves in modelling efforts, e.g., on surface mass balance using RACMO (Regional Atmospheric Climate Model) [72]. This is particularly crucial given that Antarctic surface melting is projected to double by 2050 [73]. An increased presence of supraglacial meltwater features in the future could then result in a further connection of the surface and basal hydrological systems ultimately leading to enhanced basal sliding and accelerated ice discharge (A, Figure 1) [5]. Additionally, with increasing surface melting and potentially hydrofracturing, the buttressing effects of floating ice [74] would be reduced which again highlights the importance of providing a more detailed mapping of the Antarctic surface hydrological network in the future.

5. Conclusions

This study for the first time performed an automated mapping of Antarctic supraglacial lake extents in single-polarized Sentinel-1 SAR imagery using a convolutional neural network. In detail, we modified a U-Net with atrous convolutions and residual connections for semantic segmentation of supraglacial lake features. The main aim during algorithm development was the spatio-temporal transferability of the classification method in order to enable automated circum-Antarctic mapping efforts in the future as well as to provide complementary mapping products for optical supraglacial lake extent classifications. The deep learning network was trained on 57 Sentinel-1 acquisitions covering 13 training regions and evaluated by means of ten spatially and temporally independent testing regions as well as one additional region over the Greenland ice sheet. Post-classification mainly involved the masking of false lake classifications using a Sentinel-1 derived coastline as well as TanDEM-X topographic data.
The mapping results reveal the good functionality of our workflow with reliable lake classifications for all test data where supraglacial lakes were found to vary strongly with respect to sizes, shapes and appearances. Additionally, testing our supraglacial lake detection method in a study region in Southwest Greenland highlighted its potential for spatio-temporal transferability. An intra-annual analysis of supraglacial lake dynamics over the course of the 2019/2020 melting season at northern George VI Ice Shelf, Antarctic Peninsula, moreover revealed that supraglacial lake coverage peaked in mid-January and fluctuated on lower levels in the month before and thereafter. In addition, we present the first supraglacial lake extent mapping product for January 2020 over northern George VI Ice Shelf. The mapping product was computed by fusing automatically derived Sentinel-1 lake classification maps with the corresponding Sentinel-2 maximum lake extent classification, generated as part of our companion paper, and highlights the importance of considering both, SAR and optical data in order to capture the most complete picture of supraglacial lake formation. Overall, the fused classification product revealed a total supraglacial meltwater coverage of ~770 km2 for January 2020. Finally, the accuracy assessment returned an average Kappa coefficient of 0.925 as well as a F 1 of 93.0% for the water class across all Antarctic test sites. In this context, the main remaining limitations of our workflow were identified to be (1) the lack of high-resolution topographic as well as up-to-date coastline data, e.g., resulting in few misclassifications over open ocean, (2) misclassifications over radar shadow and small blue ice and wet snow patches, and (3) the lack of ground truth data for improved evaluation of classification products.
Overall, the results of this analysis highlight the suitability of the developed modified U-Net for supraglacial lake classification in single-polarized Sentinel-1 SAR imagery. Future developments mainly involve the integration of more training data covering open ocean as well as blue ice and wet snow patches, the circum-Antarctic and intra-annual mapping of supraglacial lake extents using the proposed method as well as an integrated analysis with data on ice dynamics and climate parameters. This will be crucial in order to assess the impact of the Antarctic surface hydrological network on ice dynamics and mass balance; thus, global sea-level-rise as well as to analyze effects of albedo changes that may trigger further surface melting. Lake extent mapping products will be generated for intra-annual analyses at both, sub-monthly and monthly resolution. For derivation of monthly supraglacial lake extents, the fusion of optical Sentinel-2 and Sentinel-1 SAR supraglacial lake extent mapping products will aid in obtaining a more complete picture of meltwater ponding. On the other hand, analyses at sub-monthly resolution will provide important insight into the spatio-temporal behavior of supraglacial lakes and enable conclusions about their refreezing or draining, e.g., at the onset of Antarctic winter.

Supplementary Materials

The following are available online at https://www.mdpi.com/2072-4292/13/2/197/s1, Figure S1. Exemplary feature maps over a supraglacial lake and surrounding area after activation of the first convolution within each of the four downsampling blocks. Table S1. Sentinel-1 training acquisitions covering selected regions during the 2018/2019 and 2019/2020 Antarctic summer melt seasons and additional Sentinel-1 test scenes covering George VI Ice Shelf during December 2019, January 2020, and February 2020. Table S2. List of acronyms introduced throughout the paper.

Author Contributions

Study design: M.D., A.J.D., and C.K. (Claudia Kuenzer); methodological developments and data analysis: M.D.; draft preparation: M.D.; draft review: A.J.D., C.K. (Christof Kneisel), and C.K. (Claudia Kuenzer). All authors have read and agreed to the published version of the manuscript.

Funding

This research received no external funding.

Institutional Review Board Statement

Not applicable.

Informed Consent Statement

Not applicable.

Data Availability Statement

Data available on request.

Acknowledgments

Authors would like to thank the European Union Copernicus programme for providing Sentinel-1 data through the Copernicus Open Access Hub and the NASA Alaska Satellite Facility (ASF). Moreover, we thank Celia Baumhoer, German Aerospace Center (DLR), for providing the Sentinel-1 coastline and the SCAR for providing the ADD coastline and grounding line data. We also thank Martin Huber (DLR) for providing the edited version of the Antarctic TanDEM-X DEM and Thorsten Höser (DLR) for helpful discussions and comments on deep learning. Finally, we thank three anonymous reviewers for their valuable comments and suggestions that helped to improve this paper over all aspects.

Conflicts of Interest

The authors declare no conflict of interest.

References

  1. Shepherd, A.; Ivins, E.; Rignot, E.; Smith, B.; van Den Broeke, M.; Velicogna, I.; Whitehouse, P.; Briggs, K.; Joughin, I.; Krinner, G.; et al. Mass Balance of the Greenland Ice Sheet from 1992 to 2018. Nature 2020, 579, 233–239. [Google Scholar] [CrossRef]
  2. Shepherd, A.; Ivins, E.; Rignot, E.; Smith, B.; Van den Broeke, M.; Velicogna, I.; Whitehouse, P.; Briggs, K.; Joughin, I.; Krinner, G.; et al. Mass Balance of the Antarctic Ice Sheet from 1992 to 2017. Nature 2018, 558, 219–222. [Google Scholar] [CrossRef] [Green Version]
  3. Enderlin, E.M.; Howat, I.M.; Jeong, S.; Noh, M.-J.; van Angelen, J.H.; van den Broeke, M.R. An Improved Mass Budget for the Greenland Ice Sheet. Geophys. Res. Lett. 2014, 41, 866–872. [Google Scholar] [CrossRef] [Green Version]
  4. Mouginot, J.; Rignot, E.; Bjørk, A.A.; van den Broeke, M.; Millan, R.; Morlighem, M.; Noël, B.; Scheuchl, B.; Wood, M. Forty-Six Years of Greenland Ice Sheet Mass Balance from 1972 to 2018. Proc. Natl. Acad. Sci. USA 2019, 116, 9239–9244. [Google Scholar] [CrossRef] [PubMed] [Green Version]
  5. Bell, R.E.; Banwell, A.F.; Trusel, L.D.; Kingslake, J. Antarctic Surface Hydrology and Impacts on Ice-Sheet Mass Balance. Nat. Clim. Chang. 2018, 8, 1044. [Google Scholar] [CrossRef]
  6. Das, S.B.; Joughin, I.; Behn, M.D.; Howat, I.M.; King, M.A.; Lizarralde, D.; Bhatia, M.P. Fracture Propagation to the Base of the Greenland Ice Sheet During Supraglacial Lake Drainage. Science 2008, 320, 778–781. [Google Scholar] [CrossRef] [Green Version]
  7. Shepherd, A.; Hubbard, A.; Nienow, P.; King, M.; McMillan, M.; Joughin, I. Greenland Ice Sheet Motion Coupled with Daily Melting in Late Summer. Geophys. Res. Lett. 2009, 36. [Google Scholar] [CrossRef] [Green Version]
  8. Tedesco, M.; Willis, I.C.; Hoffman, M.J.; Banwell, A.F.; Alexander, P.; Arnold, N.S. Ice Dynamic Response to Two Modes of Surface Lake Drainage on the Greenland Ice Sheet. Environ. Res. Lett. 2013, 8, 034007. [Google Scholar] [CrossRef]
  9. Zwally, H.J.; Abdalati, W.; Herring, T.; Larson, K.; Saba, J.; Steffen, K. Surface Melt-Induced Acceleration of Greenland Ice-Sheet Flow. Science 2002, 297, 218–222. [Google Scholar] [CrossRef]
  10. Bartholomew, I.; Nienow, P.; Mair, D.; Hubbard, A.; King, M.A.; Sole, A. Seasonal Evolution of Subglacial Drainage and Acceleration in a Greenland Outlet Glacier. Nat. Geosci. 2010, 3, 408–411. [Google Scholar] [CrossRef]
  11. Banwell, A.F.; Macayeal, D.R. Ice-Shelf Fracture Due to Viscoelastic Flexure Stress Induced by Fill/Drain Cycles of Supraglacial Lakes. Antarct. Sci. 2015, 27, 587–597. [Google Scholar] [CrossRef] [Green Version]
  12. Banwell, A.F.; MacAyeal, D.R.; Sergienko, O.V. Breakup of the Larsen B Ice Shelf Triggered by Chain Reaction Drainage of Supraglacial Lakes. Geophys. Res. Lett. 2013, 40, 5872–5876. [Google Scholar] [CrossRef] [Green Version]
  13. Rignot, E.; Casassa, G.; Gogineni, P.; Krabill, W.; Rivera, A.; Thomas, R. Accelerated Ice Discharge from the Antarctic Peninsula Following the Collapse of Larsen B Ice Shelf. Geophys. Res. Lett. 2004, 31. [Google Scholar] [CrossRef] [Green Version]
  14. Rott, H.; Abdel Jaber, W.; Wuite, J.; Scheiblauer, S.; Floricioiu, D.; Van Wessem, J.M.; Nagler, T.; Miranda, N.; Van den Broeke, M.R. Changing Pattern of Ice Flow and Mass Balance for Glaciers Discharging into the Larsen A and B Embayments, Antarctic Peninsula, 2011 to 2016. Cryosphere 2018, 12, 1273–1291. [Google Scholar] [CrossRef] [Green Version]
  15. Scambos, T.A.; Bohlander, J.A.; Shuman, C.A.; Skvarca, P. Glacier Acceleration and Thinning after Ice Shelf Collapse in the Larsen B Embayment, Antarctica. Geophys. Res. Lett. 2004, 31. [Google Scholar] [CrossRef] [Green Version]
  16. Tedesco, M.; Lüthje, M.; Steffen, K.; Steiner, N.; Fettweis, X.; Willis, I.; Bayou, N.; Banwell, A. Measurement and Modeling of Ablation of the Bottom of Supraglacial Lakes in Western Greenland. Geophys. Res. Lett. 2012, 39. [Google Scholar] [CrossRef]
  17. Lüthje, M.; Pedersen, L.T.; Reeh, N.; Greuell, W. Modelling the Evolution of Supraglacial Lakes on the West Greenland Ice-Sheet Margin. J. Glaciol. 2006, 52, 608–618. [Google Scholar] [CrossRef] [Green Version]
  18. Stokes, C.R.; Sanderson, J.E.; Miles, B.W.J.; Jamieson, S.S.R.; Leeson, A.A. Widespread Distribution of Supraglacial Lakes around the Margin of the East Antarctic Ice Sheet. Sci. Rep. 2019, 9, 13823. [Google Scholar] [CrossRef] [Green Version]
  19. Kingslake, J.; Ely, J.C.; Das, I.; Bell, R.E. Widespread Movement of Meltwater onto and across Antarctic Ice Shelves. Nature 2017, 544, 349–352. [Google Scholar] [CrossRef] [Green Version]
  20. Tuckett, P.A.; Ely, J.C.; Sole, A.J.; Livingstone, S.J.; Davison, B.J.; van Wessem, J.M.; Howard, J. Rapid Accelerations of Antarctic Peninsula Outlet Glaciers Driven by Surface Melt. Nat. Commun. 2019, 10, 1–8. [Google Scholar] [CrossRef] [Green Version]
  21. Langley, E.S.; Leeson, A.A.; Stokes, C.R.; Jamieson, S.S.R. Seasonal Evolution of Supraglacial Lakes on an East Antarctic Outlet Glacier. Geophys. Res. Lett. 2016, 43, 8563–8571. [Google Scholar] [CrossRef]
  22. Leeson, A.A.; Forster, E.; Rice, A.; Gourmelen, N.; Van Wessem, J.M. Evolution of Supraglacial Lakes on the Larsen B Ice Shelf in the Decades before It Collapsed. Geophys. Res. Lett. 2020, 47. [Google Scholar] [CrossRef] [Green Version]
  23. Arthur, J.F.; Stokes, C.R.; Jamieson, S.S.R.; Carr, J.R.; Leeson, A.A. Distribution and Seasonal Evolution of Supraglacial Lakes on Shackleton Ice Shelf, East Antarctica. Cryosphere Discuss. 2020, 1–36. [Google Scholar] [CrossRef]
  24. Dell, R.; Arnold, N.; Willis, I.; Banwell, A.; Williamson, A.; Pritchard, H.; Orr, A. Lateral Meltwater Transfer across an Antarctic Ice Shelf. Cryosphere 2020, 14, 2313–2330. [Google Scholar] [CrossRef]
  25. Moussavi, M.; Pope, A.; Halberstadt, A.R.W.; Trusel, L.D.; Cioffi, L.; Abdalati, W. Antarctic Supraglacial Lake Detection Using Landsat 8 and Sentinel-2 Imagery: Towards Continental Generation of Lake Volumes. Remote Sens. 2020, 12, 134. [Google Scholar] [CrossRef] [Green Version]
  26. Halberstadt, A.R.W.; Gleason, C.J.; Moussavi, M.S.; Pope, A.; Trusel, L.D.; DeConto, R.M. Antarctic Supraglacial Lake Identification Using Landsat-8 Image Classification. Remote Sens. 2020, 12, 1327. [Google Scholar] [CrossRef] [Green Version]
  27. Williamson, A.G.; Arnold, N.S.; Banwell, A.F.; Willis, I.C. A Fully Automated Supraglacial Lake Area and Volume Tracking (“FAST”) Algorithm: Development and Application Using MODIS Imagery of West Greenland. Remote Sens. Environ. 2017, 196, 113–133. [Google Scholar] [CrossRef]
  28. Dirscherl, M.; Dietz, A.J.; Kneisel, C.; Kuenzer, C. Automated Mapping of Antarctic Supraglacial Lakes Using a Machine Learning Approach. Remote Sens. 2020, 12, 1203. [Google Scholar] [CrossRef] [Green Version]
  29. Munneke, P.K.; Luckman, A.J.; Bevan, S.L.; Smeets, C.J.P.P.; Gilbert, E.; van den Broeke, M.R.; Wang, W.; Zender, C.; Hubbard, B.; Ashmore, D.; et al. Intense Winter Surface Melt on an Antarctic Ice Shelf. Available online: https://agupubs.onlinelibrary.wiley.com/doi/abs/10.1029/2018GL077899 (accessed on 12 July 2019).
  30. ESA Sentinel Online. Sentinel-1 SAR User Guide Introduction. Available online: https://sentinel.esa.int/web/sentinel/user-guides/sentinel-1-sar/ (accessed on 26 October 2020).
  31. Hoeser, T.; Bachofer, F.; Kuenzer, C. Object Detection and Image Segmentation with Deep Learning on Earth Observation Data: A Review—Part II: Applications. Remote Sens. 2020, 12, 3053. [Google Scholar] [CrossRef]
  32. Hoeser, T.; Kuenzer, C. Object Detection and Image Segmentation with Deep Learning on Earth Observation Data: A Review—Part I: Evolution and Recent Trends. Remote Sens. 2020, 12, 1667. [Google Scholar] [CrossRef]
  33. Mohajerani, Y.; Wood, M.; Velicogna, I.; Rignot, E. Detection of Glacier Calving Margins with Convolutional Neural Networks: A Case Study. Remote Sens. 2019, 11, 74. [Google Scholar] [CrossRef] [Green Version]
  34. Baumhoer, C.A.; Dietz, A.J.; Kneisel, C.; Kuenzer, C. Automated Extraction of Antarctic Glacier and Ice Shelf Fronts from Sentinel-1 Imagery Using Deep Learning. Remote Sens. 2019, 11, 2529. [Google Scholar] [CrossRef] [Green Version]
  35. Zhang, E.; Liu, L.; Huang, L. Automatically Delineating the Calving Front of Jakobshavn Isbræ from Multitemporal TerraSAR-X Images: A Deep Learning Approach. Cryosphere 2019, 13, 1729–1741. [Google Scholar] [CrossRef] [Green Version]
  36. Li, R.; Liu, W.; Yang, L.; Sun, S.; Hu, W.; Zhang, F.; Li, W. DeepUNet: A Deep Fully Convolutional Network for Pixel-Level Sea-Land Segmentation. IEEE J. Sel. Top. Appl. Earth Obs. Remote Sens. 2018, 11, 3954–3962. [Google Scholar] [CrossRef] [Green Version]
  37. Zhong, L.; Hu, L.; Zhou, H. Deep Learning Based Multi-Temporal Crop Classification. Remote Sens. Environ. 2019, 221, 430–443. [Google Scholar] [CrossRef]
  38. Wang, L.; Scott, K.A.; Xu, L.; Clausi, D.A. Sea Ice Concentration Estimation During Melt From Dual-Pol SAR Scenes Using Deep Convolutional Neural Networks: A Case Study. IEEE Trans. Geosci. Remote Sens. 2016, 54, 4524–4533. [Google Scholar] [CrossRef]
  39. Bhuiyan, M.A.E.; Witharana, C.; Liljedahl, A.K. Use of Very High Spatial Resolution Commercial Satellite Imagery and Deep Learning to Automatically Map Ice-Wedge Polygons across Tundra Vegetation Types. J. Imaging 2020, 6, 137. [Google Scholar] [CrossRef]
  40. Zhang, W.; Liljedahl, A.K.; Kanevskiy, M.; Epstein, H.E.; Jones, B.M.; Jorgenson, M.T.; Kent, K. Transferability of the Deep Learning Mask R-CNN Model for Automated Mapping of Ice-Wedge Polygons in High-Resolution Satellite and UAV Images. Remote Sens. 2020, 12, 1085. [Google Scholar] [CrossRef] [Green Version]
  41. Ji, S.; Wei, S.; Lu, M. Fully Convolutional Networks for Multisource Building Extraction From an Open Aerial and Satellite Imagery Data Set. IEEE Trans. Geosci. Remote Sens. 2019, 57, 574–586. [Google Scholar] [CrossRef]
  42. Zhang, Z.; Liu, Q.; Wang, Y. Road Extraction by Deep Residual U-Net. IEEE Geosci. Remote Sens. Lett. 2018, 15, 749–753. [Google Scholar] [CrossRef] [Green Version]
  43. Ronneberger, O.; Fischer, P.; Brox, T. U-Net: Convolutional Networks for Biomedical Image Segmentation. In Medical Image Computing and Computer-Assisted Intervention—MICCAI 2015; Navab, N., Hornegger, J., Wells, W.M., Frangi, A.F., Eds.; Springer International Publishing: Cham, Switzerland, 2015; Volume 9351, pp. 234–241. ISBN 978-3-319-24573-7. [Google Scholar]
  44. Kingslake, J.; Martín, C.; Arthern, R.J.; Corr, H.F.J.; King, E.C. Ice-Flow Reorganization in West Antarctica 2.5 Kyr Ago Dated Using Radar-Derived Englacial Flow Velocities. Geophys. Res. Lett. 2016, 43, 9103–9112. [Google Scholar] [CrossRef] [Green Version]
  45. Lenaerts, J.T.M.; Lhermitte, S.; Drews, R.; Ligtenberg, S.R.M.; Berger, S.; Helm, V.; Smeets, C.J.P.P.; van den Broeke, M.R.; van de Berg, W.J.; van Meijgaard, E.; et al. Meltwater Produced by Wind–Albedo Interaction Stored in an East Antarctic Ice Shelf. Nat. Clim. Chang. 2017, 7, 58–62. [Google Scholar] [CrossRef] [Green Version]
  46. Zheng, L.; Zhou, C. Comparisons of Snowmelt Detected by Microwave Sensors on the Shackleton Ice Shelf, East Antarctica. Int. J. Remote Sens. 2019, 41, 1338–1348. [Google Scholar] [CrossRef]
  47. SCAR. SCAR Antarctic Digital Database (ADD). Available online: https://www.add.scar.org/ (accessed on 13 November 2020).
  48. ESA. Sentinel-1 Product Definition. 2016. Available online: https://sentinel.esa.int/web/sentinel/user-guides/sentinel-1-sar/document-library (accessed on 15 September 2020).
  49. Baumhoer, C.A.; Dietz, A.J.; Kneisel, C.; Paeth, H.; Kuenzer, C. Driving Forces of Circum-Antarctic Glacier and Ice Shelf Front Retreat over the Last Two Decades. Cryosphere Discuss. 2020, 1–30. [Google Scholar] [CrossRef]
  50. Long, J.; Shelhamer, E.; Darrell, T. Fully Convolutional Networks for Semantic Segmentation. In Proceedings of the 2015 IEEE Conference on Computer Vision and Pattern Recognition (CVPR), Boston, MA, USA, 7–12 June 2015; pp. 3431–3440. [Google Scholar]
  51. He, K.; Zhang, X.; Ren, S.; Sun, J. Deep Residual Learning for Image Recognition. In Proceedings of the 2016 IEEE Conference on Computer Vision and Pattern Recognition (CVPR), Las Vegas, NV, USA, 27–30 June 2016; pp. 770–778. [Google Scholar]
  52. Diakogiannis, F.I.; Waldner, F.; Caccetta, P.; Wu, C. ResUNet-a: A Deep Learning Framework for Semantic Segmentation of Remotely Sensed Data. ISPRS J. Photogramm. Remote Sens. 2020, 162, 94–114. [Google Scholar] [CrossRef] [Green Version]
  53. Zhang, P.; Ke, Y.; Zhang, Z.; Wang, M.; Li, P.; Zhang, S. Urban Land Use and Land Cover Classification Using Novel Deep Learning Models Based on High Spatial Resolution Satellite Imagery. Sensors 2018, 18, 3717. [Google Scholar] [CrossRef] [Green Version]
  54. Chu, Z.; Tian, T.; Feng, R.; Wang, L. Sea-Land Segmentation With Res-UNet And Fully Connected CRF. In Proceedings of the IGARSS 2019—2019 IEEE International Geoscience and Remote Sensing Symposium, Yokohama, Japan, 28 July–2 August 2019; pp. 3840–3843. [Google Scholar]
  55. Miao, Z.; Fu, K.; Sun, H.; Sun, X.; Yan, M. Automatic Water-Body Segmentation From High-Resolution Satellite Images via Deep Networks. IEEE Geosci. Remote Sens. Lett. 2018, 15, 602–606. [Google Scholar] [CrossRef]
  56. Cao, K.; Zhang, X. An Improved Res-UNet Model for Tree Species Classification Using Airborne High-Resolution Images. Remote Sens. 2020, 12, 1128. [Google Scholar] [CrossRef] [Green Version]
  57. Sun, S.; Lu, Z.; Liu, W.; Hu, W.; Li, R. Shipnet for Semantic Segmentation on VHR Maritime Imagery. In Proceedings of the IGARSS 2018—2018 IEEE International Geoscience and Remote Sensing Symposium, Valencia, Spain, 22–27 July 2018; pp. 6911–6914. [Google Scholar]
  58. Khanna, A.; Londhe, N.D.; Gupta, S.; Semwal, A. A Deep Residual U-Net Convolutional Neural Network for Automated Lung Segmentation in Computed Tomography Images. Biocybern. Biomed. Eng. 2020, 40, 1314–1327. [Google Scholar] [CrossRef]
  59. Chen, L.-C.; Papandreou, G.; Kokkinos, I.; Murphy, K.; Yuille, A.L. Semantic Image Segmentation with Deep Convolutional Nets and Fully Connected CRFs. arXiv 2016, arXiv:1412.7062. [Google Scholar]
  60. Chen, L.-C.; Papandreou, G.; Schroff, F.; Adam, H. Rethinking Atrous Convolution for Semantic Image Segmentation. arXiv 2017, arXiv:1706.05587. [Google Scholar]
  61. Chen, L.; Papandreou, G.; Kokkinos, I.; Murphy, K.; Yuille, A.L. DeepLab: Semantic Image Segmentation with Deep Convolutional Nets, Atrous Convolution, and Fully Connected CRFs. IEEE Trans. Pattern Anal. Mach. Intell. 2018, 40, 834–848. [Google Scholar] [CrossRef] [PubMed]
  62. He, H.; Yang, D.; Wang, S.; Wang, S.; Li, Y. Road Extraction by Using Atrous Spatial Pyramid Pooling Integrated Encoder-Decoder Network and Structural Similarity Loss. Remote Sens. 2019, 11, 1015. [Google Scholar] [CrossRef] [Green Version]
  63. Liu, Y.; Gross, L.; Li, Z.; Li, X.; Fan, X.; Qi, W. Automatic Building Extraction on High-Resolution Remote Sens. Imagery Using Deep Convolutional Encoder-Decoder With Spatial Pyramid Pooling. IEEE Access 2019, 7, 128774–128786. [Google Scholar] [CrossRef]
  64. Baheti, B.; Innani, S.; Gajre, S.; Talbar, S. Semantic Scene Segmentation in Unstructured Environment with Modified DeepLabV3+. Pattern Recognit. Lett. 2020, 138, 223–229. [Google Scholar] [CrossRef]
  65. Chen, L.-C.; Zhu, Y.; Papandreou, G.; Schroff, F.; Adam, H. Encoder-Decoder with Atrous Separable Convolution for Semantic Image Segmentation. arXiv 2018, arXiv:1802.02611. [Google Scholar]
  66. Jolly, K. Machine Learning with Scikit-Learn. Quick Start Guide; Packt Publishing Ltd.: Birmingham, UK, 2018; ISBN 978-1-78934-370-0. [Google Scholar]
  67. Müller, C.; Guido, S. Introduction to Machine Learning with Python: A Guide for Data Scientists; O’Reilly Media Inc.: Sebastopol, CA, USA, 2016; Volume 1, ISBN 978-1-4493-6990-3. [Google Scholar]
  68. Cohen, J. A Coefficient of Agreement for Nominal Scales. Educat. Psychol. Meas. 1960, 20, 37–46. [Google Scholar] [CrossRef]
  69. Landis, J.R.; Koch, G.G. The Measurement of Observer Agreement for Categorical Data. Biometrics 1977, 33, 159. [Google Scholar] [CrossRef] [Green Version]
  70. Lu, X.; Zhong, Y.; Zheng, Z.; Liu, Y.; Zhao, J.; Ma, A.; Yang, J. Multi-Scale and Multi-Task Deep Learning Framework for Automatic Road Extraction. IEEE Trans. Geosci. Remote Sens. 2019, 57, 9362–9377. [Google Scholar] [CrossRef]
  71. Howat, I.M.; Porter, C.; Smith, B.E.; Noh, M.-J.; Morin, P. The Reference Elevation Model of Antarctica. Cryosphere 2019, 13, 665–674. [Google Scholar] [CrossRef] [Green Version]
  72. Van Wessem, J.M.; van de Berg, W.J.; Noël, B.P.Y.; van Meijgaard, E.; Amory, C.; Birnbaum, G.; Jakobs, C.L.; Krüger, K.; Lenaerts, J.T.M.; Lhermitte, S.; et al. Modelling the Climate and Surface Mass Balance of Polar Ice Sheets Using RACMO2—Part 2: Antarctica (1979–2016). Cryosphere 2018, 12, 1479–1498. [Google Scholar] [CrossRef] [Green Version]
  73. Trusel, L.D.; Frey, K.E.; Das, S.B.; Karnauskas, K.B.; Kuipers Munneke, P.; van Meijgaard, E.; van den Broeke, M.R. Divergent Trajectories of Antarctic Surface Melt under Two Twenty-First-Century Climate Scenarios. Nat. Geosci. 2015, 8, 927–932. [Google Scholar] [CrossRef]
  74. Fürst, J.J.; Durand, G.; Gillet-Chaulet, F.; Tavard, L.; Rankl, M.; Braun, M.; Gagliardini, O. The Safety Band of Antarctic Ice Shelves. Nat. Clim. Chang. 2016, 6, 479–482. [Google Scholar] [CrossRef]
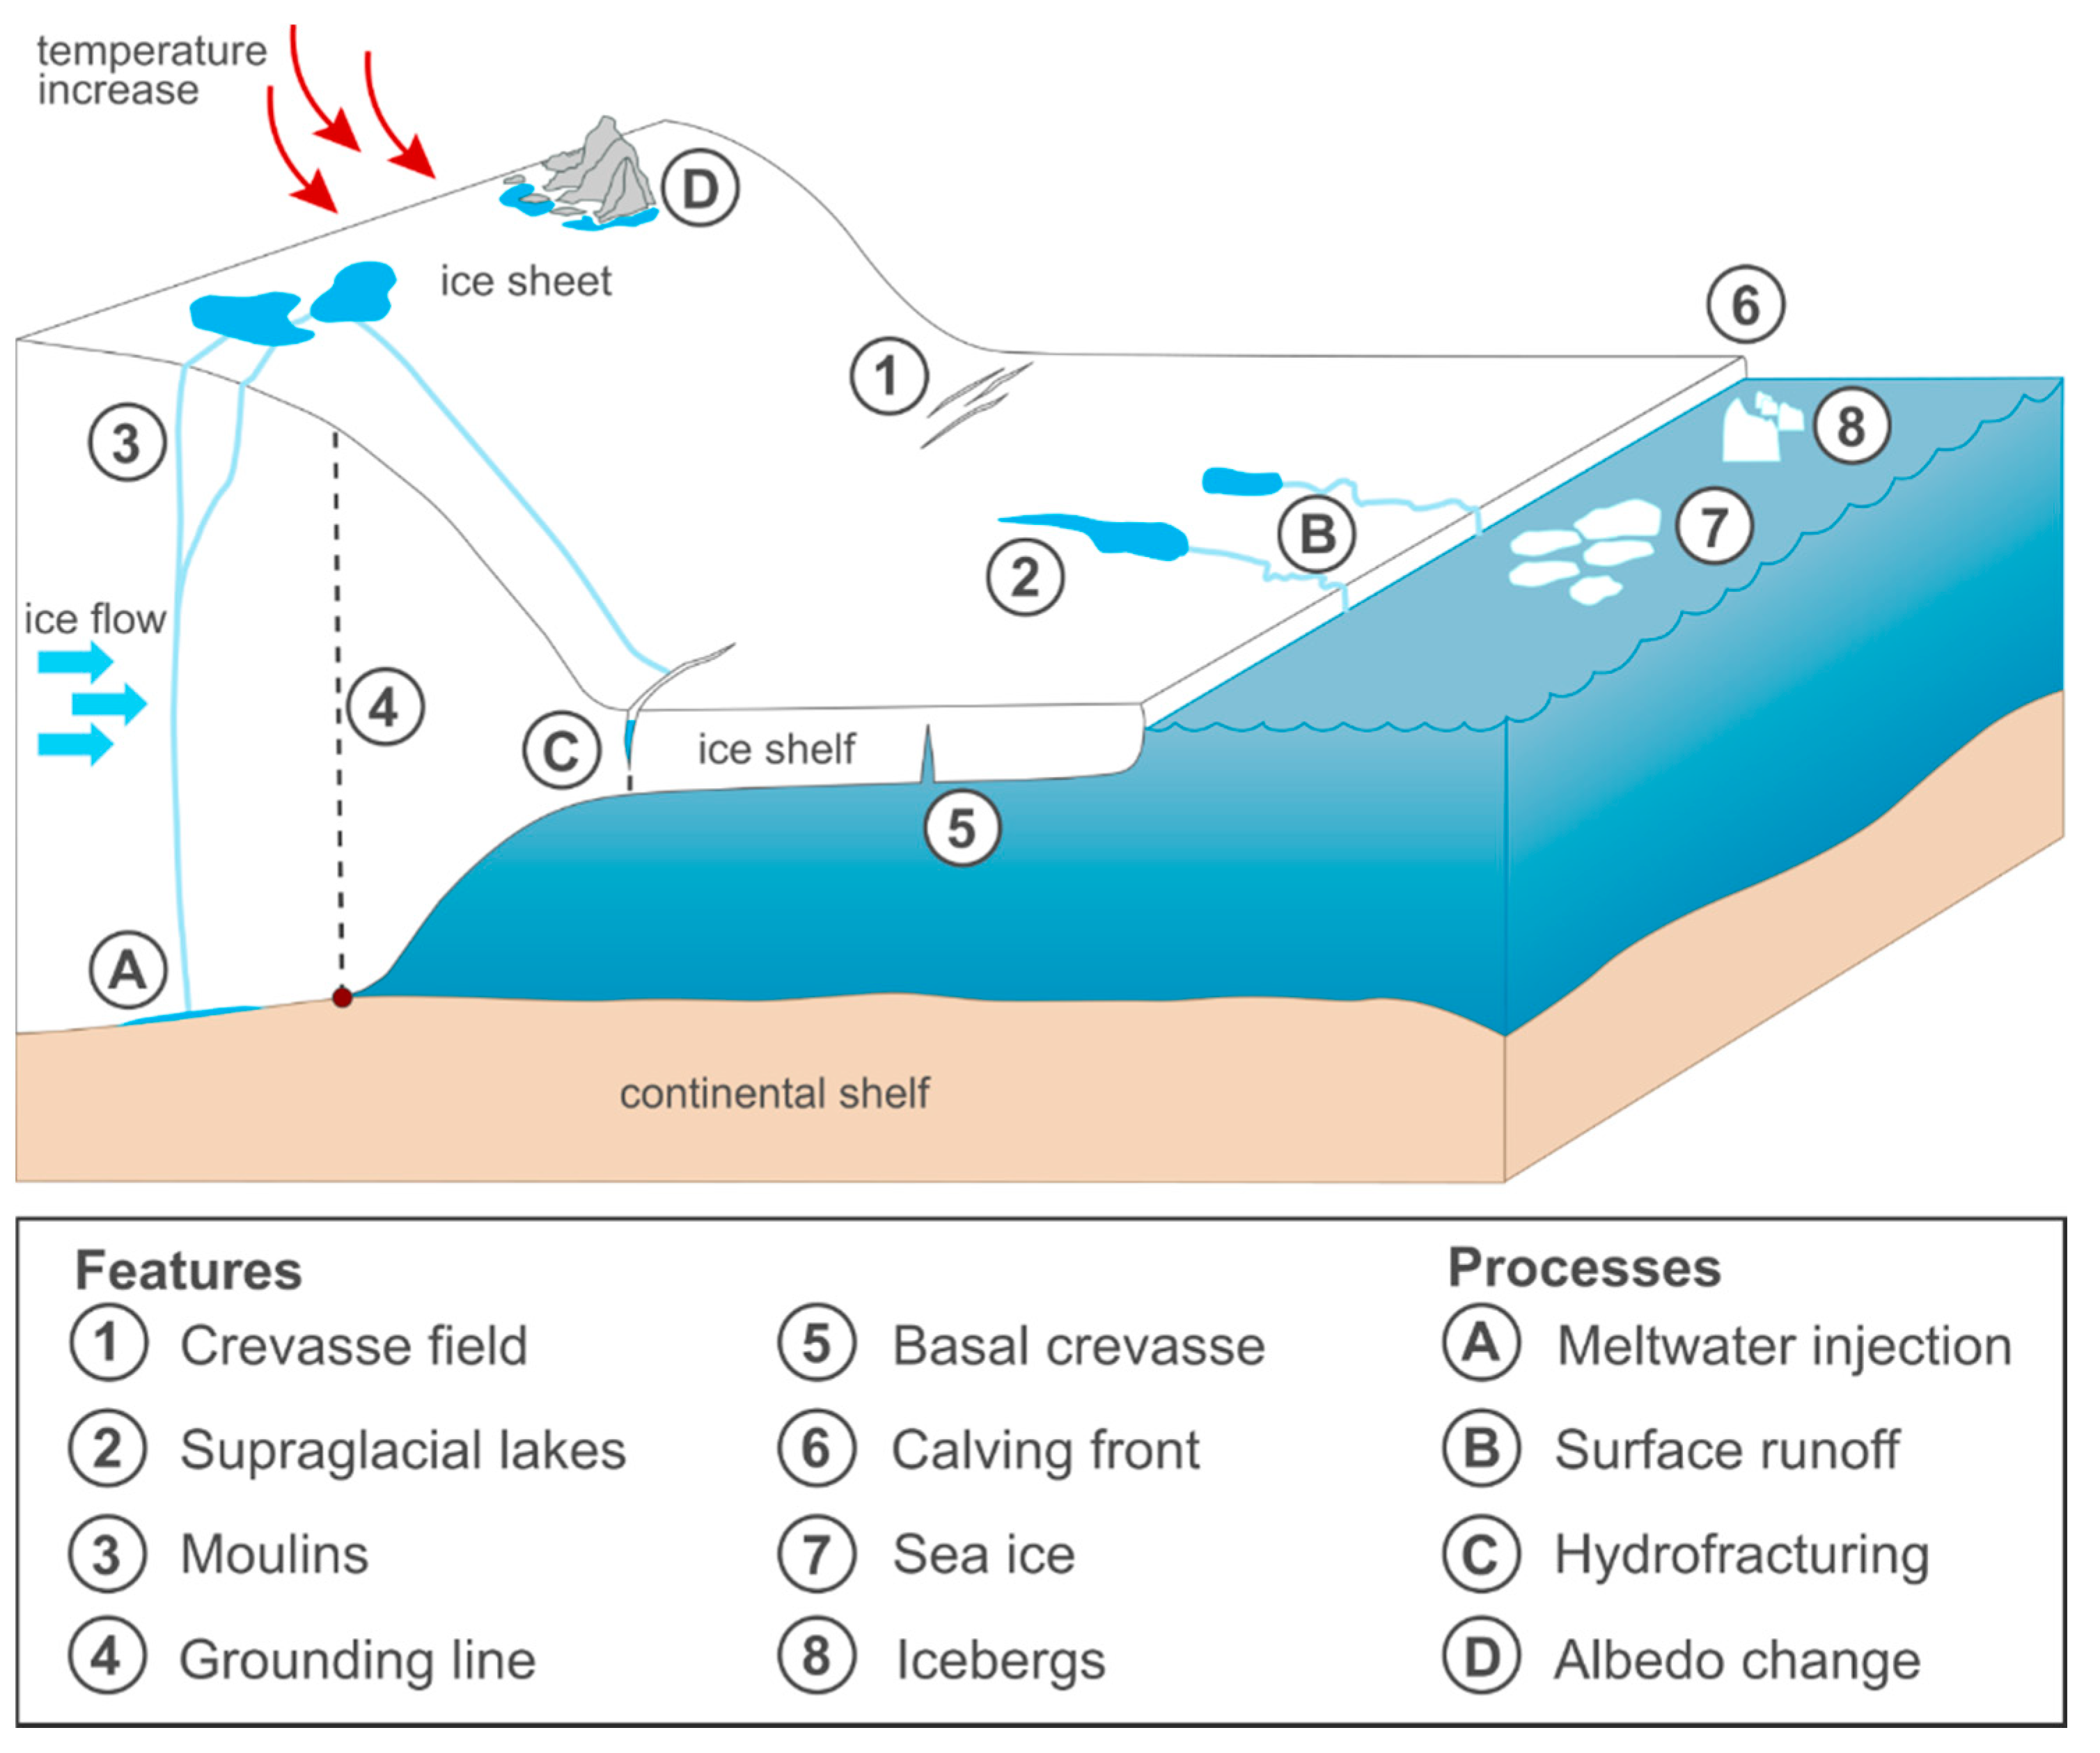
Figure 1. Sketch of supraglacial meltwater features at an ocean-terminating outlet glacier in Antarctica. The three main processes impacting Antarctic ice dynamics and mass balance through surface hydrological processes are illustrated in A–C: (A) Meltwater injection to the glacier bed. (B) Surface melting and runoff. (C) Hydrofracturing. The process in D reflects albedo changes caused by the increased presence of surface lakes and rock outcrop.
Remotesensing 13 00197 g001
Figure 2. Appearance of supraglacial lakes and resembling surface features in single-polarized Sentinel-1 imagery over Antarctica. (a) Lakes with sharp edges on George VI Ice Shelf. (b) Lakes with fuzzy edges on Amery Ice Shelf. (c) Lakes with low visual contrast on Amery Ice Shelf. (d,e) Slightly frozen lakes on Amery Ice Shelf. (f,g) Partly slushy and frozen lakes on George VI Ice Shelf. (h) Wet snow patches next to open lakes on George VI Ice Shelf. (i,j) Shallow and partly frozen lakes on George VI Ice Shelf. (k) Blue ice patches near Rennick Ice Shelf. (l) Open fractures near Shackleton Ice Shelf. (m) Blue ice patches close to Nivlisen Ice Shelf. (n) Crevassed ice tongue with wet snow patches near Larsen C Ice Shelf. (o) Topographically induced radar shadow next to Larsen C Ice Shelf. (p) Crevasse field near George VI Ice Shelf.
Remotesensing 13 00197 g002
Figure 3. Worfklow for automated supraglacial lake mapping in Sentinel-1 synthetic aperture radar (SAR) imagery over Antarctica using a deep learning approach. The star implies that Sentinel-2 lake extents were only used where available.
Remotesensing 13 00197 g003
Figure 4. Spatial distribution of training (blue) and test (red) sites across the Antarctic continent. Stars denote regions where both, training and testing data were available thus where tile outlines were overlapping. The coastline data were downloaded from the Scientific Committee on Antarctic Research (SCAR) Antarctic Digital Database (ADD) [47].
Remotesensing 13 00197 g004
Figure 5. Temporal distribution of Sentinel-1 training (blue) and testing (red) acquisitions selected for automated supraglacial lake mapping in Antarctica. Green stars denote acquisitions that were used for both, training and testing whereat training acquisitions were used as aggregated monthly backscattering minimum products (see Section 2.3.1).
Remotesensing 13 00197 g005
Figure 6. Architecture used for training the modified U-Net for supraglacial lake detection in Sentinel-1 imagery over Antarctica.
Remotesensing 13 00197 g006
Figure 7. Schematic sketch of a single downsampling block with residual connections at image level. For simplification, no activation function is applied in this example. The 3 × 3 convolution operation is performed twice.
Remotesensing 13 00197 g007
Figure 8. Automated mapping results (b,d,f,h,j,l,n,p,r,t) for extracts of the Sentinel-1 test scenes (a,c,e,g,i,k,m,o,q,s). (a,b) Cosgrove Ice Shelf, West Antarctica. (c,d) Abbot Ice Shelf, West Antarctica. (e,f) Bach Ice Shelf, Antarctic Peninsula. (g,h) Larsen C Ice Shelf, Antarctic Peninsula. (i,j) Riiser-Larsen Ice Shelf, East Antarctica. (k,l) Enderby Land, East Antarctica. (m,n) Amery Ice Shelf, East Antarctica. (o,p) Shackleton Ice Shelf, East Antarctica. (q,r) Moscow University Ice Shelf, East Antarctica. (s,t) Rennick Ice Shelf, East Antarctica.
Remotesensing 13 00197 g008aRemotesensing 13 00197 g008bRemotesensing 13 00197 g008c
Figure 9. Automated supraglacial lake mapping results (c) for southwest Greenland. The background image in (ac) is a Sentinel-1A IW GRDH image product of 28 July 2018.
Remotesensing 13 00197 g009
Figure 10. (af) Exemplary Sentinel-1 supraglacial lake mapping results for 13 January 2020 over George VI Ice Shelf, Antarctic Peninsula.
Remotesensing 13 00197 g010aRemotesensing 13 00197 g010b
Figure 11. Temporal development of supraglacial lake extents over George VI Ice Shelf throughout the 2020 melting season, as detected with Sentinel-1 (December 2019, January 2020, February 2020).
Remotesensing 13 00197 g011
Figure 12. Decision-level fusion of automatically generated Sentinel-1 and Sentinel-2 maximum lake extent classification products covering the full month of January 2020, over George VI Ice Shelf, Antarctic Peninsula. Light blue color represents regions where only Sentinel-1 lake classifications are present, dark blue color illustrates regions with only Sentinel-2 lake classifications and green color denotes overlapping lake mappings. The SAR image in (ac) is a Sentinel-1 monthly minimum backscattering product computed from all Sentinel-1 acquisitions covering George VI Ice Shelf in January 2020. The map in (d) shows a corresponding Sentinel-2 RGB image of George VI Ice Shelf in January 2020.
Remotesensing 13 00197 g012
Table 1. Sentinel-1 training and test regions covering the Antarctic continent. Each training region corresponds to a single Sentinel-1 monthly minimum raster and each test region corresponds to one Sentinel-1 acquisition except for region 3, where multiple data products were evaluated (see Table S1).
IDTime Period/DateRelative OrbitStudy AreaStudy RegionOrbit Direction
Training Regions
1December 201953Pine Island BayWAISDescending
2January 202053Pine Island BayWAISDescending
3January 2020169George VI Ice ShelfAPIDescending
4February 2020169George VI Ice ShelfAPIDescending
5January 202038Larsen Ice ShelfAPIDescending
6December 201993Nivlisen Ice ShelfEAISDescending
7January 202093Nivlisen Ice ShelfEAISDescending
8January 202059Roi Baudouin Ice ShelfEAISAscending
9January 201972Mawson CoastEAISAscending
10December 20183Amery Ice ShelfEAISDescending
11January 20193Amery Ice ShelfEAISDescending
12February 20193Amery Ice ShelfEAISDescending
13January 202085Shackleton Ice ShelfEAISAscending
Test regions
16 January 202068Abbot and Cosgrove Ice ShelfWAISDescending
228 January 202038Bach Ice Shelf APIDescending
3December/January/February 2019/2020 1169George VI Ice ShelfAPIDescending
414 January 201838Larsen C Ice ShelfAPIDescending
520 January 201750Riiser-Larsen Ice ShelfEAISDescending
62 January 202014Enderby Land EAISAscending
74 January 20173Amery Ice ShelfEAISDescending
81 February 201841Shackleton Ice Shelf EastEAISAscending
923 January 202055Moscow University Ice Shelf EAISAscending
1010 January 202043Rennick Ice ShelfEAISDescending
Table 2. Results of the accuracy assessment for the Sentinel-1 test scenes. From left to right, the columns represent EO, EC, R, P, F 1 as well as K averaged for all test sites.
Metrics
ClassEO (%)EC (%)R (%)P (%) F 1   ( % ) K
Water1.1711.198.8388.9093.00.925
Non-water0.830.1499.1799.8699.510.925
Publisher’s Note: MDPI stays neutral with regard to jurisdictional claims in published maps and institutional affiliations.