1. Introduction
Object-based image analysis (OBIA) has been widely used in the past two decades, such as in urban-land-cover mapping [
1,
2,
3], ecological monitoring [
4,
5,
6], disaster evaluation [
7,
8,
9], and crop-type identification [
10,
11,
12]. In recent years, OBIA has also been incorporated into the deep learning model to capture the precise outlines of ground objects and model spatial-context relationships [
13,
14,
15]. The most intriguing feature of OBIA is that homogeneous pixels are merged into one segment, and the segment serves as the smallest unit for image analysis [
16,
17]. The application of OBIA both avoids the salt and pepper noise in the pixel-level classification method, and enables the utilization of geometric and spatial contextual features of segments, which is conducive to the classification of human-affected areas, where most geographic objects have regular shapes [
18].
The accuracy of segmentation is essential because if segmentation errors appear, misclassification tends to occur [
19]. There are two types of segmentation error: over-segmentation error (OSE) and under-segmentation error (USE) [
20]. OSE means that a geo-object is partitioned into more than one segment, and USE indicates that a segment covers more than one geo-object [
19]. Therefore, many different segmentation models were established to improve the accuracy of segmentation, and the most popular ones include watershed [
21,
22,
23], mean-shift [
24,
25,
26], Markov random field [
27,
28,
29,
30], conditional random field [
31,
32,
33], and region merging [
18,
19,
34,
35,
36,
37,
38]. Although there exist many image segmentation algorithms, no sole segmentation algorithm can assuredly produce error-free segmentation results [
39].
For the same image, different segmentation algorithms lead to different segmentation results. Although for any evaluation method, the global optimal segmentation result among these segmentation results is unique, the optimal segmentation of each part of the image most likely comes from different segmentation results. Therefore, compared to redesigning or improving the existing segmentation algorithm, it is worth combining the local advantages of different segmentation results. However, it is very difficult to realize this idea. First, for the same ground object, segmentation results generated by different algorithms may greatly differ. Especially for remote sensing images with fuzzy edges, the unstable segment line near the edge of the ground object may produce many pixel-level differences. Second, the evaluation method of local segmentation quality should fully consider the problem of segmentation scale [
40,
41]. Since there is more than one segmentation result involved in this method, the designed local evaluation strategy should unify the scale. Before designing a specific optimization strategy, these two problems need to be solved.
Among all segmentation algorithms, the region-merging segmentation model (RMSM) is relatively appropriate for our research. The RMSM is a bottom-up segmentation model that is widely used in OBIA and integrated into the commercial software eCognition [
42]. In RMSM, the MC are used to control the sequence of region merging, thereby directly determining the accuracy of the segmentation result [
18]. There are now a large number of MC designed on the basis of different features, such as the band-mean square error model (BQEM) [
43], spectral angle model (SAM) [
44], weighted color-texture model (CTM) [
45], and spectral-shape heterogeneity model (SSHM) [
42]. Different segmentation results can be obtained on the basis of different MC, which makes it easy to control variables. RMSM has another important advantage: to improve the efficiency of region merging, RMSM often uses super-pixels generated by the initial segmentation as the starting point of region merging [
35]. This process can effectively solve the problem of pixel-level differences because the smallest unit of difference between segments is no longer a pixel but a super-pixel; thus, the stability of segmentation at the fuzzy edge is greatly enhanced.
Regarding the scale problem in local evaluation, most unsupervised-evaluation algorithms comprehensively evaluate the performance of segmentation results from both OSE and USE [
46]. Among them, the USE is reduced by the encouragement item which measures the homogeneity of global segments, and the OSE is reduced by the penalty item, which is often the total number of segments. Different evaluation algorithms have different definitions of segment homogeneity, such as band mean square error [
47], entropy [
48], and texture consistency [
49]. Therefore, to solve the scale problem in local evaluation, it is necessary to ensure that penalty items are the same or the relative change is small, which also means that the total number of segments participating in the evaluation is the same or the relative difference is extremely small. Accordingly, an equal-scale strategy for local evaluation was designed and is shown in
Section 2.5.
After determining the solution strategies for the two problems, an iteration approach was designed to achieve sufficient optimization. Each iteration is divided into four steps. First, the optimized segmentation result and the segmentation result used for optimization are generated on the basis of two different MC. Second, region matching is performed on the two sets of segmentation results, and conflicts that can be used for optimization are extracted. Third, the equal-scale local evaluation strategy is used to evaluate the optimization potential of each conflict. Fourth, the segmentation results are optimized on the basis of conflicts with sufficient optimization potential. Optimization potential is quantified by the local evaluation algorithm, so the optimization direction is consistent with that of the local evaluation algorithm. The strategy to record the optimization results of each iteration is also included in this approach.
This paper is structured as follows:
Section 2 delineates the principle of the proposed algorithm. Experiment results are presented in
Section 3, followed by a discussion in
Section 4. Conclusions are given
Section 5.
2. Methods
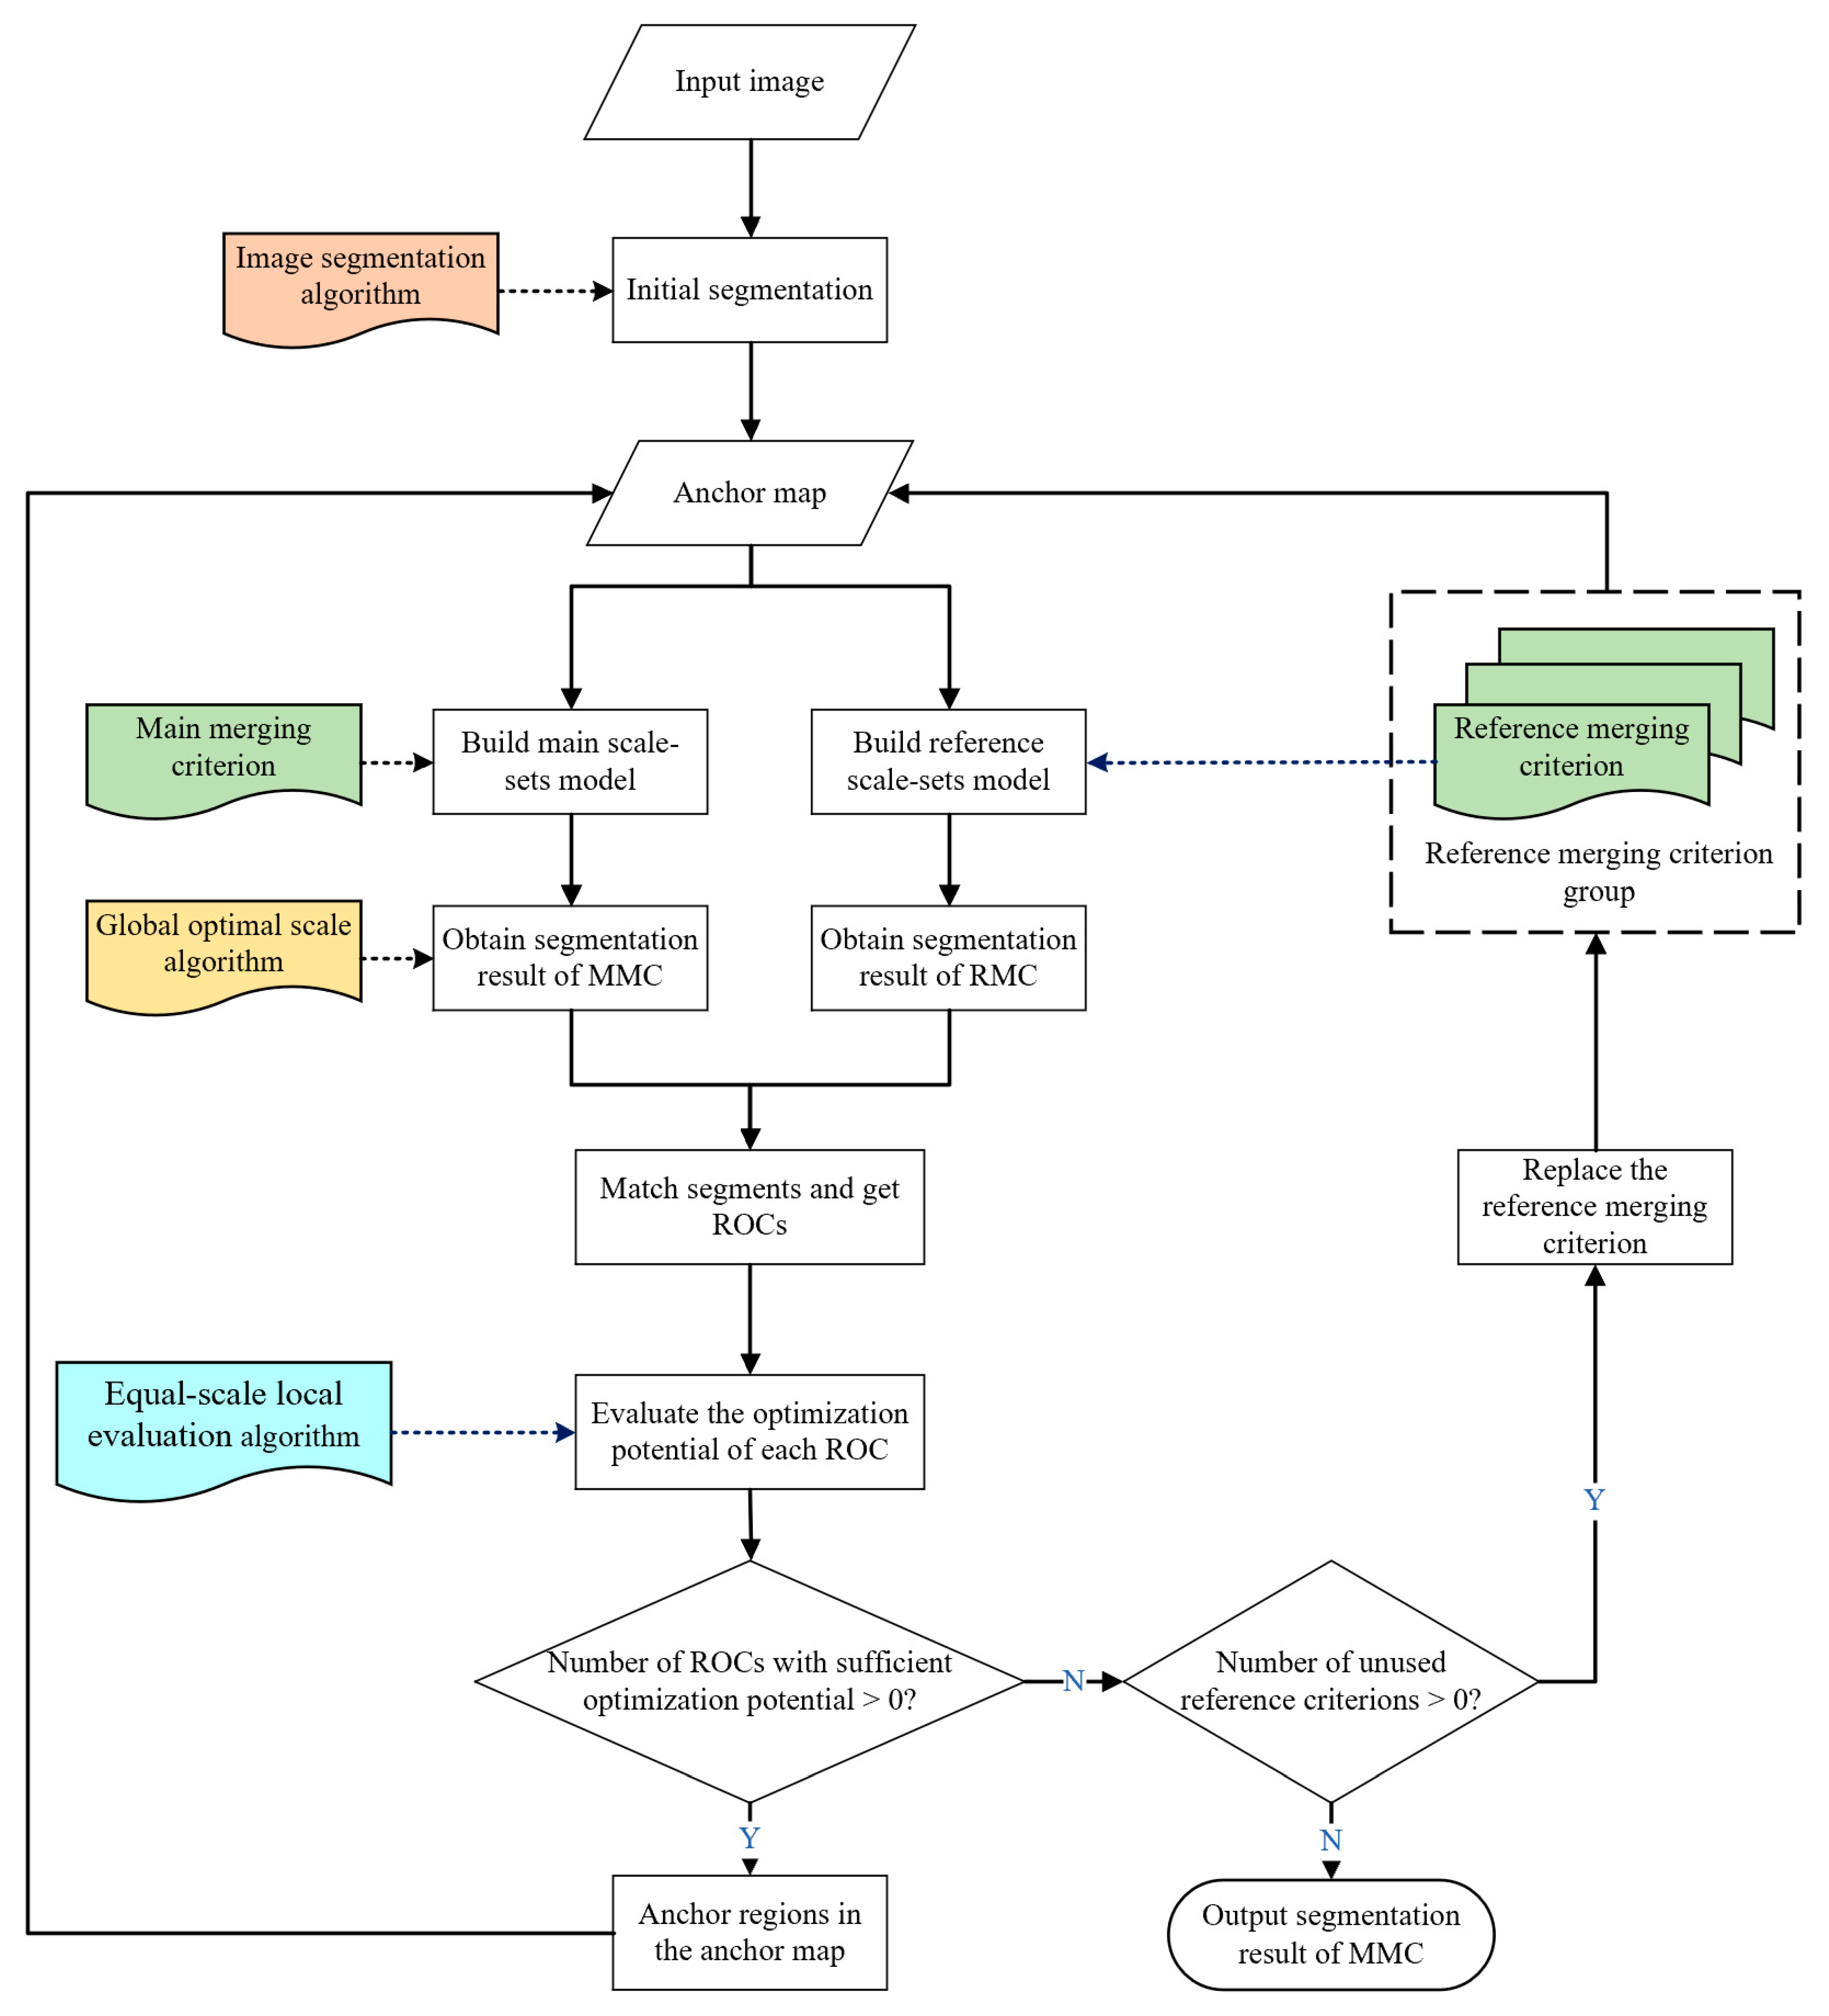
The proposed approach is a framework model which could partially optimize the results of region-merging segmentation from referring segmentation results. The algorithm flowchart (
Figure 1) is attached below. This algorithm is based on iteration. During the iteration process, regions are merged according to two different merging criteria: the main merging criteria (MMC) and the reference merging criteria (RMC). After the region-merging process, the identical optimal scale selection algorithm is conducted, and then, under the optimal scale, the segmentation results based on MMC will be further optimized by the segmentation results based on RMC. Without considering the time complexity of the region-merging algorithm, the optimal time complexity of the proposed approach is
with
segments.
The key part of our method is to optimize the MMC results based on the RMC results. Firstly, the MMC segments and RMC segments are fully matched, and then, according to the type of the intersection regions, there are two conflict types existing in matching segment pairs: SEC and ROC. Secondly, the matching segment pairs afflicted by ROC are evaluated, and the intersection regions of MMC segments are retained or separated according to the evaluation results. Finally, the MMC segments in matching segment pairs are anchored in an anchor map (AP) according to evaluation results. In this method, AP is the starting point of the region merging. AP is updated every time the iteration optimization is conducted. The regions in AP are divided into anchored regions and unanchored regions. The anchored regions are not involved in all subsequent region-merging processes if any adjacent unanchored region pair exists.
The proposed method is compatible with various image segmentation algorithms, global optimal scale selection algorithms, MC, and segmentation evaluation algorithms, which are highlighted in
Figure 1. Among them, the evaluation algorithm should be carefully selected because of its guiding aptitude in the direction of segmentation optimization.
2.1. Scale-Sets Model
The scale-sets model is a region-merging image segmentation model proposed by Guigues [
50]. It represents the hierarchical relationship between regions using a scale-indexed binary partition tree [
51], and it contains the complete segmentation modes of the image. As a mature and robust region-merging image segmentation model [
35], the main advantages of the scale-sets model are as follows: First, the scale-sets model separates the region-merging and scale-selection processes, so that these two processes, which are often coupled in other algorithms, can be separately conducted. Second, the scale-sets model based on the nearest neighbor graph (NNG) [
52] can achieve the highest accuracy of region merging, where the dissimilarity between adjacent regions in each merge ought to reach the global minimum, so the region-merging order is only determined by the MC.
In the proposed method, the scale-sets model based on the NNG is used as the region-merging model. The algorithm of the scale-sets model based on NNG is described in
Table 1.
Figure 2 illustrates an example of a scale-sets model. Since regions are strictly merged into pairs, for an image with
N over-segmented initial regions,
N−1 new regions are generated by region merging after the implementation of the scale-sets model. Thus, the binary partition tree (
Figure 2c) can be horizontally cut into
N−1 sections using the parameter
, and each result is called the
section of the scale-sets model [
34]. The
section is considered to be the segmentation result of scale
. The section sequence is dense and contains the global optimal segmentation results at all scales. The binary partition tree contains numerous potential segmentation results that can be calculated by the following recursive formulas:
where
represents the number of potential segmentation results of the binary partition tree with
as the root node;
and
represent the left and right children of node
, respectively; and
represents the leaf node of the binary-partition tree. For a balanced binary-partition tree constructed from 64 initial regions, the number of potential segmentation results exceeds
. Therefore, instead of finding a suitable starting point in numerous potential segmentation results, it is more reasonable and time-saving to use the segmentation results in the section sequence as the starting point for optimization.
2.2. Merging Criteria
When applying a scale-sets model, MC are necessary to determine the order of region merging, which determines the segmentation result [
18]. Many MC exist to conduct region-merging-based image segmentation. They have different characteristics and advantages and are appropriate in situations with different spatial resolutions and land-cover types. In our method, several MC are used to construct different scale-sets models. MMC and RMC are used to regulate the main and reference scale-sets models, respectively.
The segmentation result of MMC is the focus of optimization; although any MC can be used as MMC, it is more effective to choose widely used and well-performing MC as MMC. In this paper, SSHM was used as the MMC, which is the most popular criteria in the field of remote sensing image segmentation [
35]. It is defined as the synthesis of spectral and spatial heterogeneities.
RMC are used to find potentially optimizable regions in the segments of MMC. The process of finding optimizable regions is tentative, so any reasonable MC can be used as an RMC, or even MMC with different parameters. Multiple RMC are used in the optimization process, and all RMC contribute to form a reference merging criteria group (RMCG). Each RMC in RMCG is replaced when there is no optimization in an iteration. To ensure the efficiency of optimization, in this study, three widely used MC were applied to form RMCG: BQEM, CTM, and SAM. For details of these RMC, the readers can refer to the corresponding studies [
43,
44,
45].
2.3. Global Optimal Scale Selection
According to the number of merged regions, the binary partition tree of the scale-sets model can be cut into N−1 sections horizontally using a parameter
, and the
section can be regarded as the global optimal segmentation result of scale
. As the scale parameter
increases, the segmentation state of the
section gradually converts from over-segmented to under-segmented. In this method, all sections of the scale-sets model form a dense scale sequence, and the global optimal scale selection algorithm is used to select a section with the global optimal scale from the scale sequence as the starting point for optimization. The global optimal scale means that the global segmentation state of the scale tends to be neither over- nor under-segmented, but the global optimal scale often contains local over- and under-segmentation. Since local under-segmentation results in a more serious negative influence on segmentation quality than local over-segmentation does [
34], in practice, the scale, which is slightly inclined towards over-segmentation, is often selected as the global optimal scale. The global optimal scale selection algorithm remains unchanged during the entire iteration process to ensure that the global scale before and after optimization of the image segmentation result remains unchanged.
In this paper, the improved minimum risk decision model (MRDM) [
34] was employed to select the global optimal scale, because this model is simple and effective with good intelligibility. The MRDM considers the significant relationships between segmentation statuses (over- and under-segmentation), and global homogeneity and heterogeneity. After quantifying global homogeneity and heterogeneity with global variance [
54] and the Moran index [
55], the global homogeneity and heterogeneity are transformed into over- and under-segmentation risk, respectively, and the optimal scale is the scale with the smallest total risk. The total risk of scale
is defined as
where
represents the total risk;
i is the index of a section;
N represents the number of segments in this scale;
represents the penalty factor for under-segmentation, which should usually be larger than 1; and
and
denote the probability function of under- and over-segmentation, respectively:
where
and
are the maximum and minimum of global variance, and
and
are the maximum and minimum of the global Moran index. For details of
and
, the readers can refer to the corresponding pieces of literature [
54,
55].
2.4. Segment Conflict Types
There are differences between the segmentation results of MMC and RMC: the same local of the image is segmented by different segments; for instance, there are conflicts between segments of MMC and RMC. Segment conflicts could contain potential segmentation-optimization modes, so segment conflicts should first be classified. In region-merging image segmentation, the essence of a segment is a set of regions. Therefore, segment conflict types are determined on the basis of set theory.
Consider that is the set of initial regions and each initial region . and are segments obtained at the global optimal scale on the basis of MMC and RMC, respectively, and they are subsets of . If , there might be a conflict between and , where:
- (1)
If , there is no conflict between and .
- (2)
If , there is a conflict between and , and the conflict type is local SEC.
- (3)
If , there is a conflict between and , and the conflict type is ROC.
In the SEC, one of the two conflicting segments is a proper subset of the other. Through local scale adjustment in the binary-partition tree, both segments can convert into each other. The essence of the SEC is that the local segmentation scales of MMC and RMC are different. In ROC, these two conflicting segments intersect and do not have an inclusion relation. The two conflicting segments cannot convert into each other through local scale adjustment. The essence of ROC lies in the ownership of the intersection regions.
Figure 3 is an illustration of the two different segment-conflict types.
Figure 3a shows an image containing two abstract ground-truth objects represented by blue and yellow blocks. After initial over-segmentation, the image was segmented into six regions from
to
. Then, through region merging, the initial over-segmented regions generated two different image segmentation results based on MMC and RMC, respectively. Specifically, the segmentation result of MMC contained two segments
and
, colored in red; the segmentation result of RMC contained segments
and
, in blue. Different MC are the only reason that leads to different segmentation results. In this case, it is obvious that there was a merge error in the segmentation result of MMC:
belonging to ground-truth object A was mistakenly merged with
to
belonging to ground truth-object B. While the segmentation result of RMC was error-free, regions belonging to different ground-truth objects were merged correctly. To optimize the segmentation result of MMC by referring to the segmentation result of RMC, the segments of MMC and RMC were fully matched first, and the conflicting segment pairs are shown in
Figure 3b,c according to conflict type. The conflict type in
Figure 3b is SEC, and the type in
Figure 3c is ROC.
2.5. Optimization Method
Before introducing the method of optimizing segmentation quality on the basis of ROC, it is necessary to introduce the AP in detail, which is used as the starting point for each region-merging process, and to record the results of each iteration. The AP is functionally the same as in the initial segmentation map, which is the smallest scale section of the scale-sets model. Different from the initial segmentation map, regions in the AP include anchored and unanchored regions. If unanchored regions are adjacent to each other, anchored regions do not participate in region merging but do participate in updating the RAG and NNG. The initial state of the AP is equivalent to the initial segmentation map, and the AP is updated after each iteration optimization.
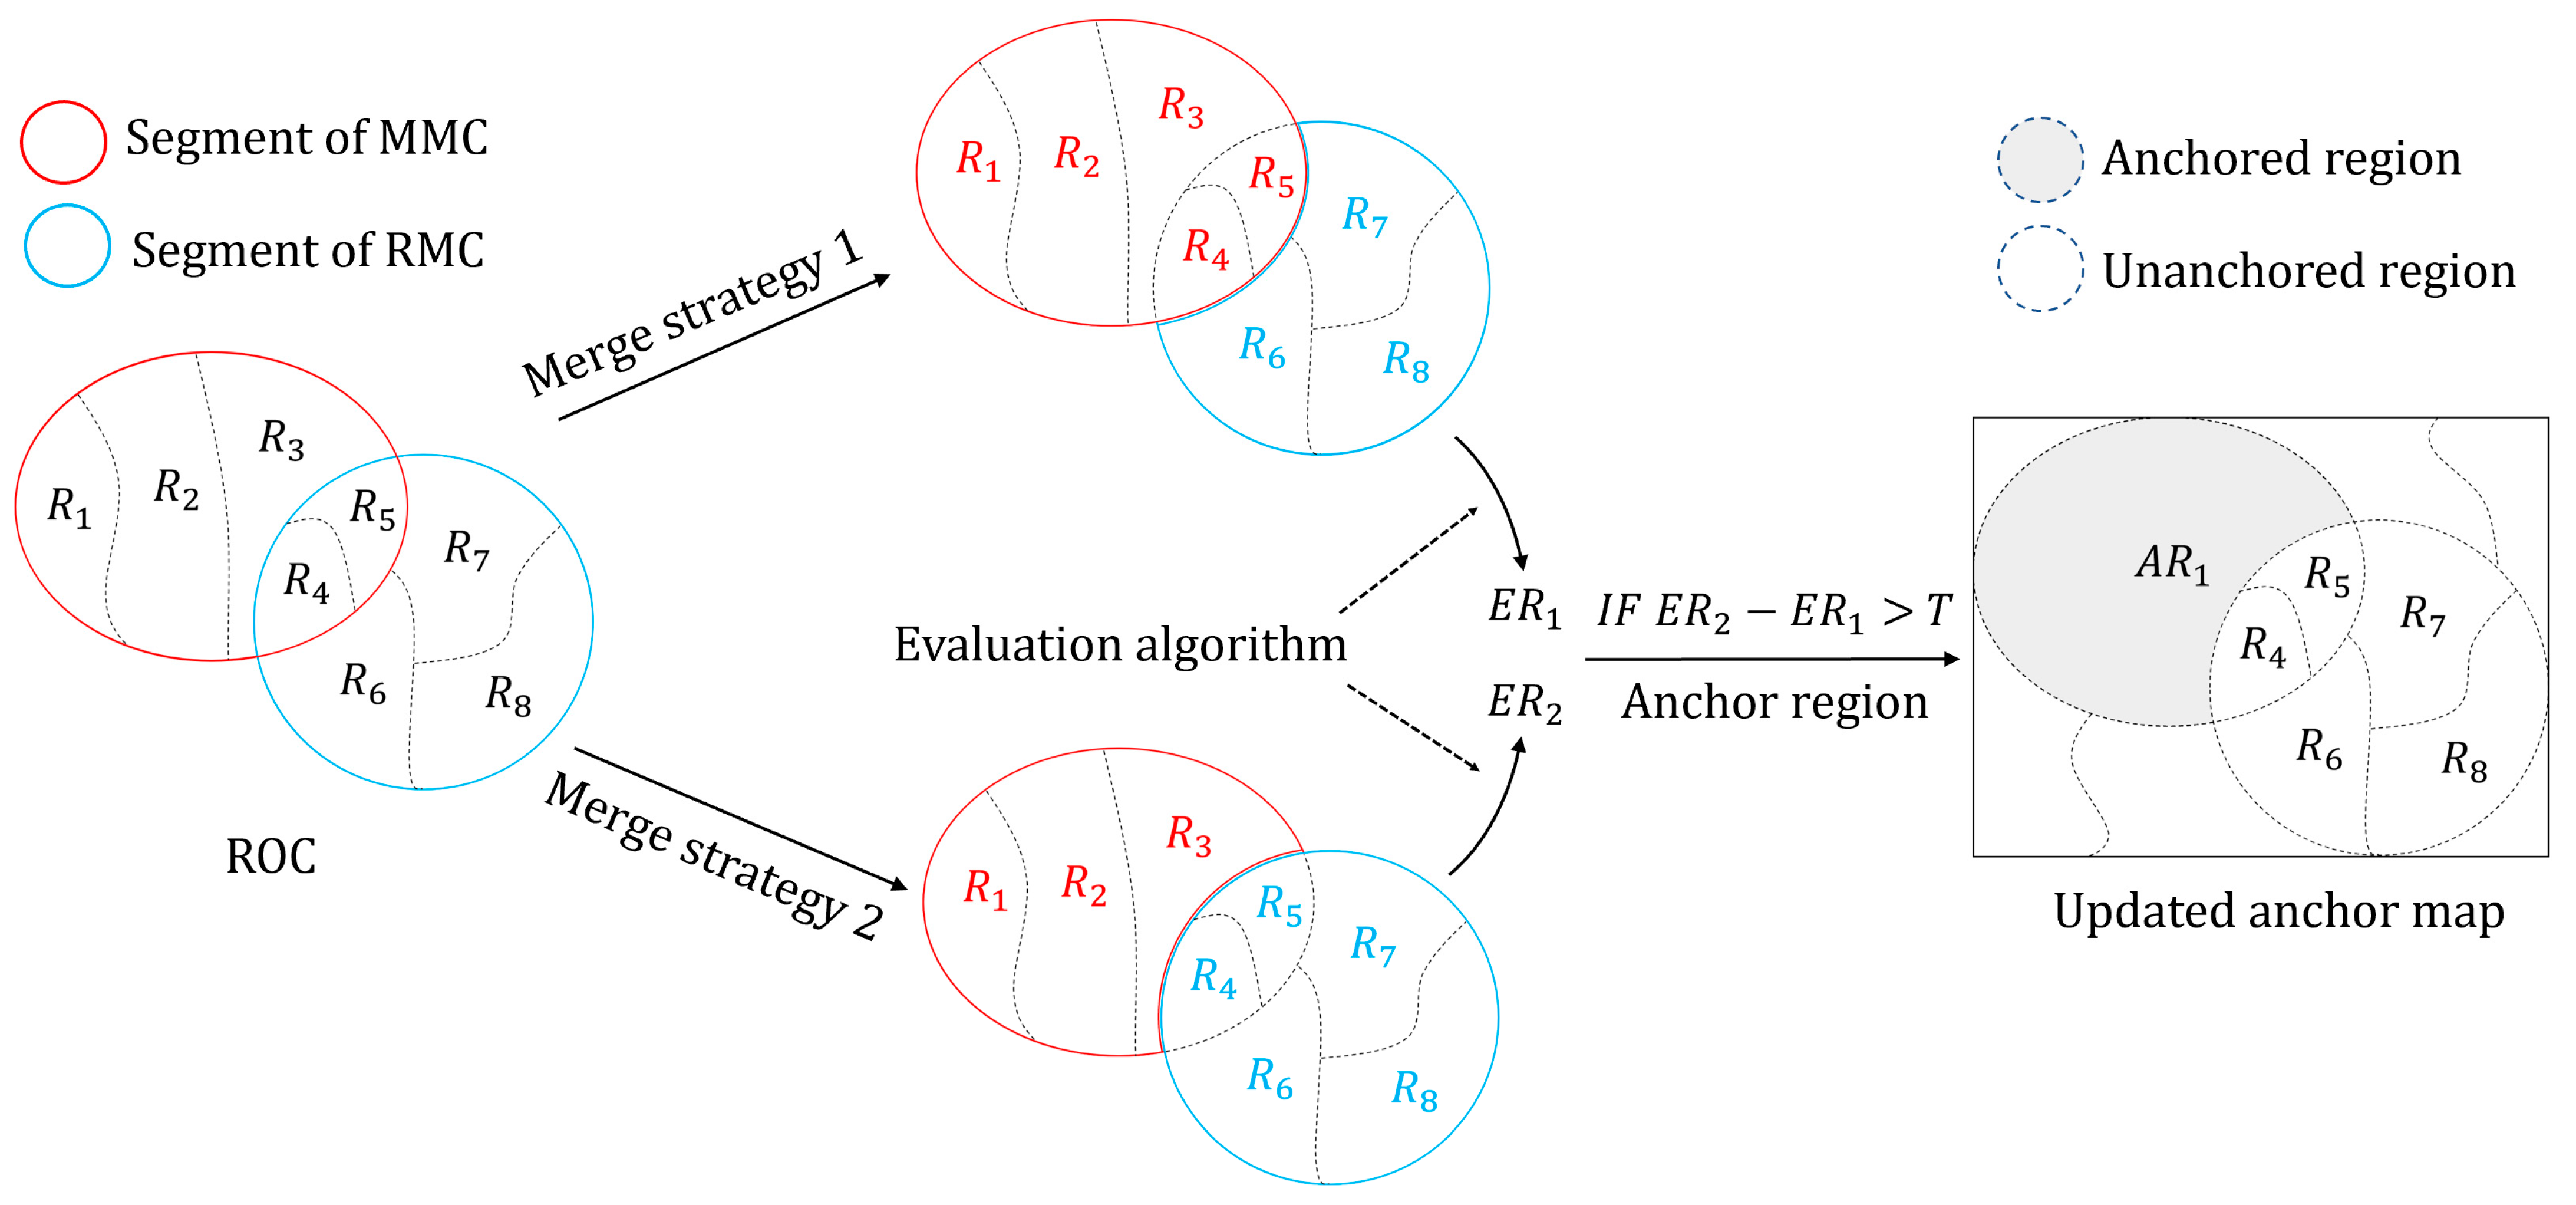
Figure 4 illustrates an example of using ROC to optimize segmentation quality. Since the two segments of ROC come from different segmentation results, and the essence of ROC lies in the ownership of the intersection regions, a special strategy is needed to integrate the two segments for evaluation. The specific method is to keep the non-ROC regions unchanged in the initial segmentation map, and merge the ROC regions according to the two following strategies:
- (1)
Merge the ROC regions to generate the complete segment of MMC and the segment of RMC without intersection regions.
- (2)
Merge the ROC regions to generate the complete segment of RMC and the segment of MMC without intersection regions.
After region merging based on Strategy 1 and 2 is completed, the unsupervised-evaluation algorithm is used to quantify the segmentation quality of the two segmentation results. The number of regions of the two segmentation results is equal, so the evaluation is carried out on an equal scale.
The purpose of the evaluation is to objectively determine whether there is a better segmentation mode for the intersection regions of MMC. Releasing intersection regions with insufficient optimization potential from the segments of MMC negatively affects segmentation quality. Therefore, Equation (6) is used for filtering ROC with insufficient optimization potential:
where
and
represent the segments of MMC and RMC, respectively, in the ROC;
is an indicator, and a value of 1 indicates that the ROC has sufficient optimization potential;
and
are the evaluation results for the segmentation results based on merge strategies 1 and 2, respectively;
is an abstract indicator that is determined by the unsupervised-evaluation algorithm;
is a threshold with a default numerical range of
the higher this is, the fewer ROCs tend to be considered to have sufficient optimization potential.
In the ROC that has sufficient optimization potential, intersection regions are released from the segments of MMC, and the remaining segment is anchored in the anchor map. In the next iteration, the released intersection regions can be freely merged with adjacent unanchored regions. Since one segment of MMC may have ROCs with multiple segments of RMC, we adopted the following anchor strategy:
- (1)
Evaluate all ROCs related to the same segment of MMC.
- (2)
Release all the intersection regions that need to be released from the segment of MMC.
- (3)
Merge the regions corresponding to the remaining segment of MMC in the AP, and then add the anchored labels.
3. Experiment Results
3.1. Dataset
To validate the proposed approach, three scenes of high spatial resolution images were chosen. The three scenes were all captured by a remote sensing satellite, QuickBird, with three spectral bands (red, green, and blue) and 0.6-meter spatial resolution.
Figure 5a,d,g present the dataset. The three images are represented by T1, T2, and T3. Central geographic coordinates for T1, T2, and T3 were (115°54′38″ E, 38°25′59″ N), (116°16′14″ E, 38°43′17″ N), and (117°4′7″ E, 38°48′49″ N). Image sizes for the three scenes were 1000 × 1000 pixels. T1 and T2 were of a rural landscape, which covers farmland, woodland, and scattered buildings. T3 captured a well-developed industrial landscape with many warehouses and workshops. These three images were sufficient for validating the proposed approach.
Since supervised evaluation requires reference geo-objects (RG), such RG maps are produced by using expert-manual digitization and are shown in
Figure 5b,e,h.
Table 2 provides detailed information about the RGs. It is obvious that the number of RGs was comparatively higher for T3 than for T1 and T2. To improve the construction speed of the scale-sets model and avoid the generation of fragmented pixel-level conflicts, the experimental images were first fully over-segmented using the simple linear iterative cluster (SLIC) superpixel segmentation algorithm [
56]. Initial over-segmentation results are shown in
Figure 5c,f,i.
3.2. Parameter Analysis
There was only one key parameter in the proposed approach,
T, as explained in
Section 2.5. Other parameters, including those of initial segmentation, global optimal scale selection, merging criteria, and unsupervised evaluation, were beyond the scope of this study. The non-core parameter settings are shown in
Table 3. The unsupervised evaluation method of H. Zhang [
48] with indicator
E was used to evaluate the segmentation result, which was the same as in the local evaluation algorithm in
Section 3.3. For convenience, we only memorized the optimal
E in each experiment, which was recorded as
.
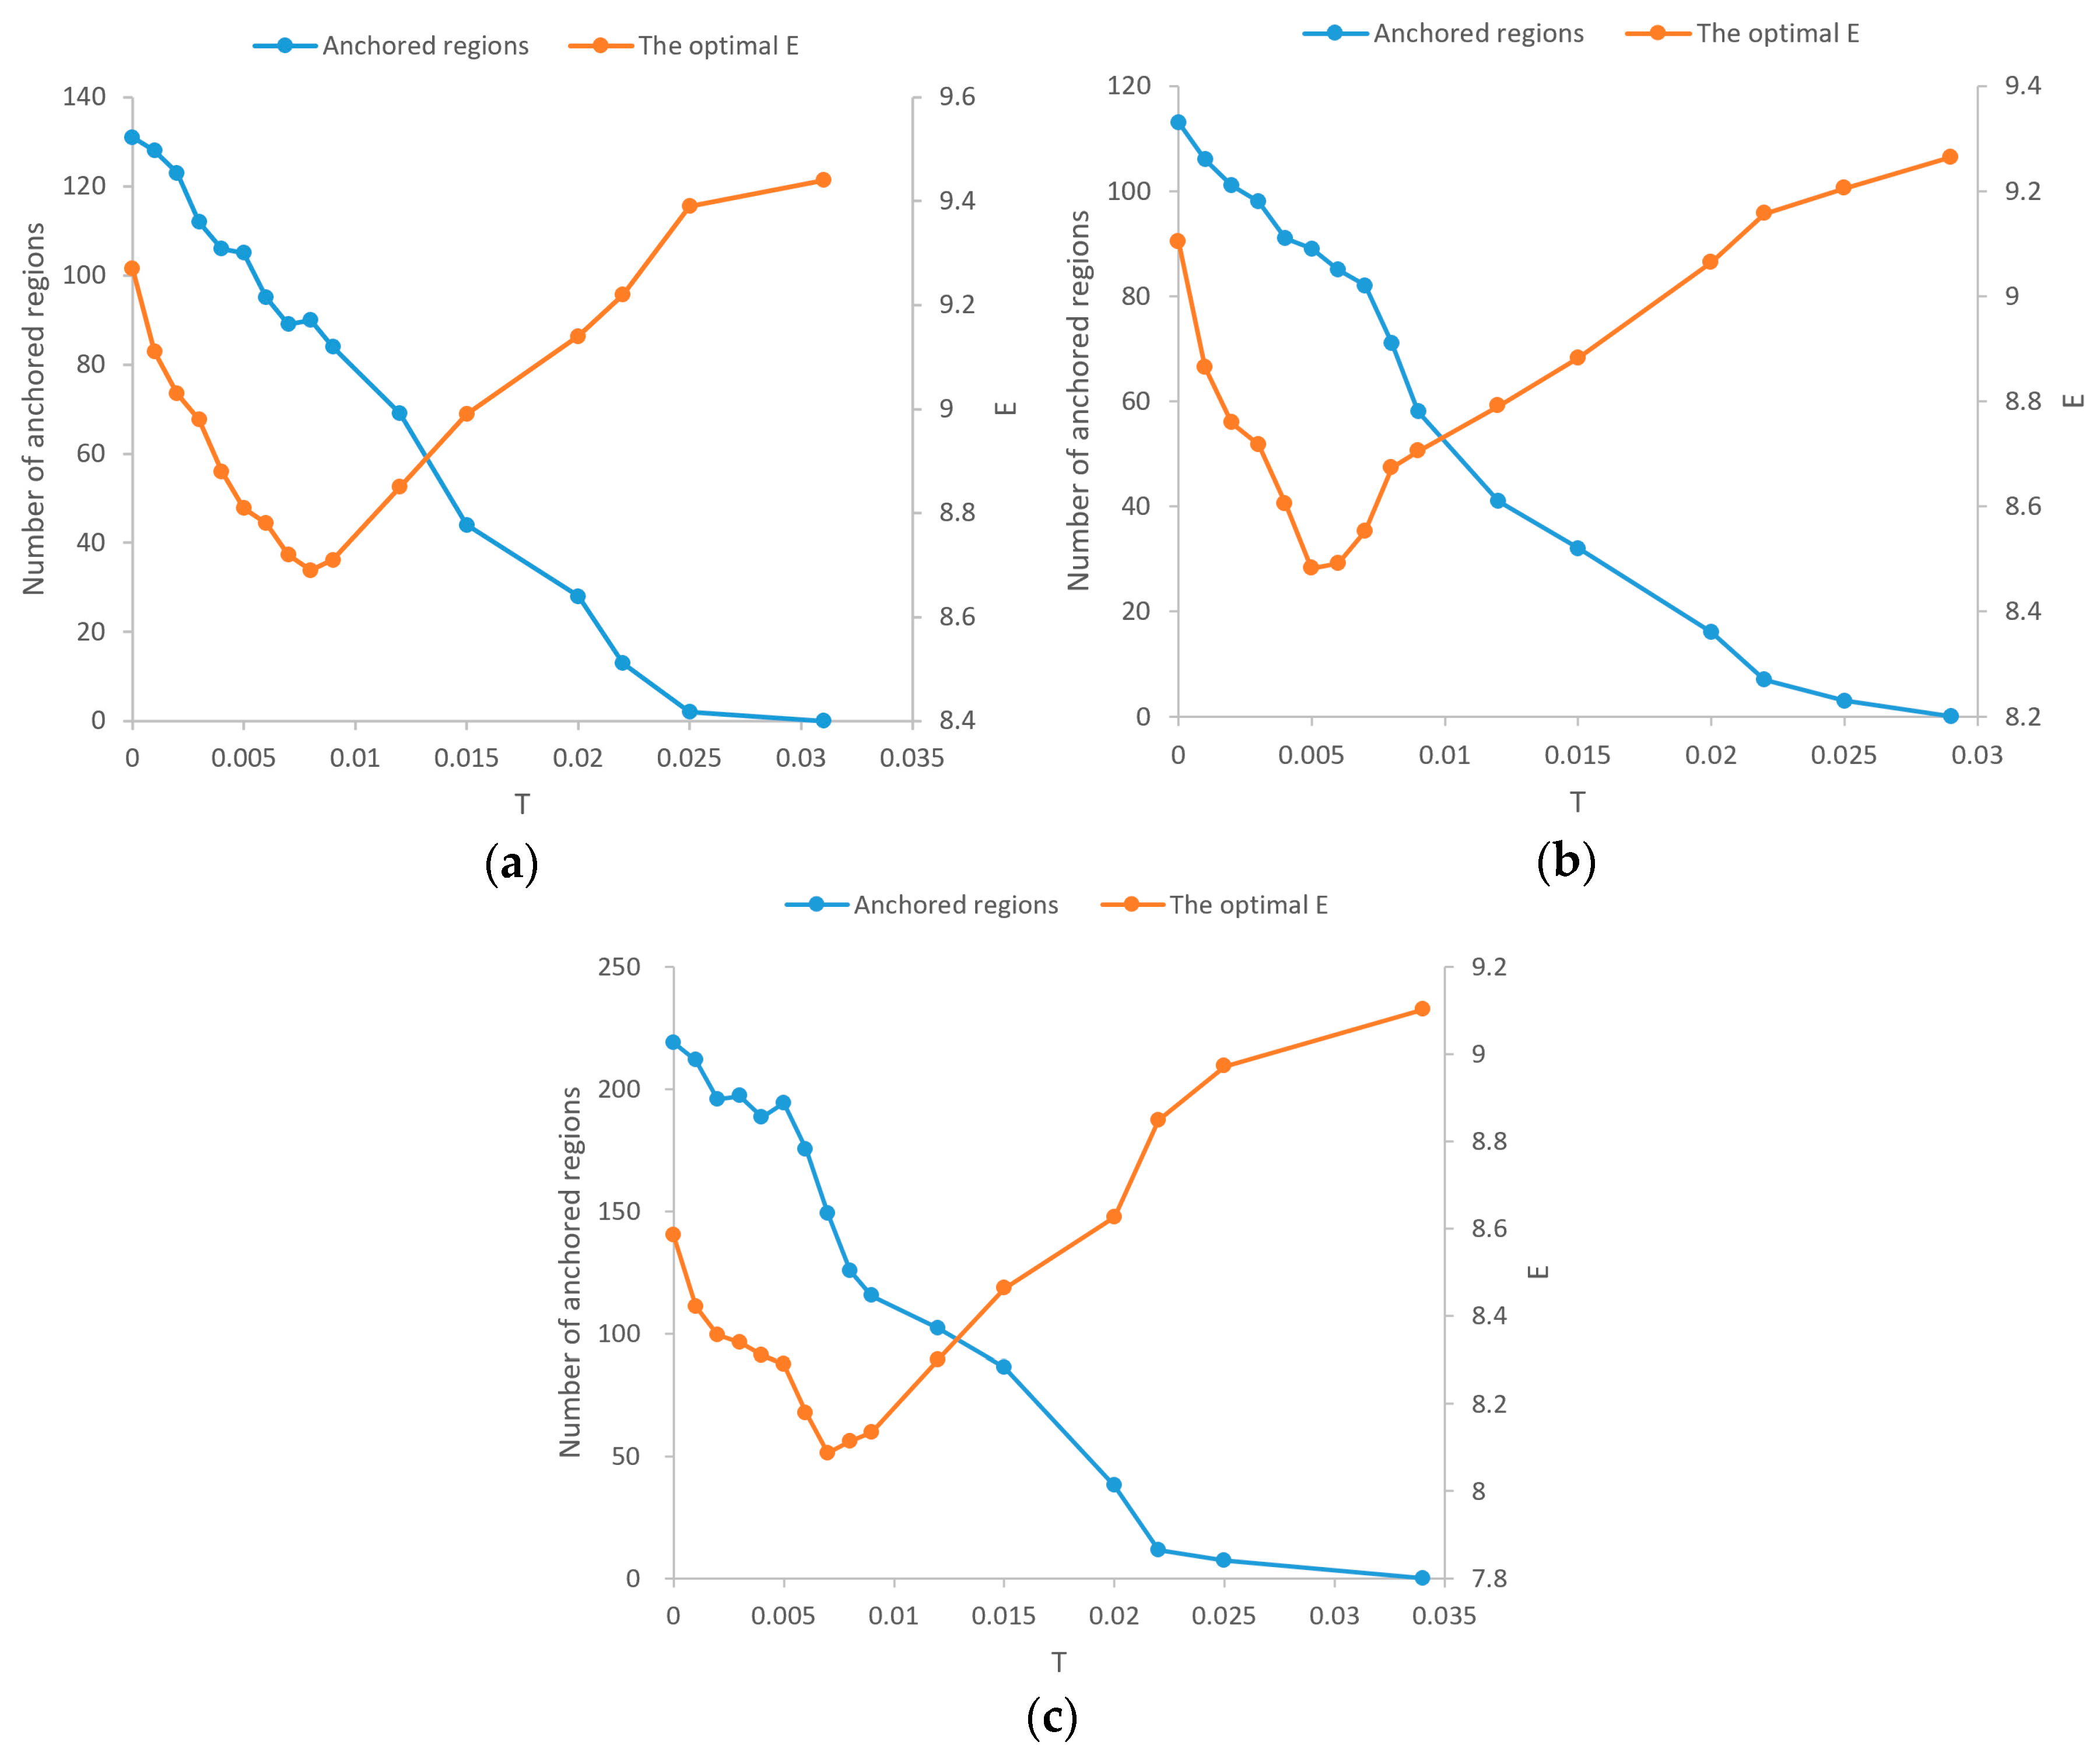
Analytical results of core parameter
T are shown in
Figure 6.
Figure 6a–c correspond to the analytical results of experimental images T1, T2, and T3 respectively. With the increase in
T, the number of anchored regions (NAR) of the three experimental images showed a downward trend, and the general tendency of
of the three experimental images was to decrease and then rise. A smaller
means higher segmentation quality. The change in the NAR and the
can be divided into three stages:
First, the NAR slowly decreased in fluctuation, while rapidly decreased because the value of T at this stage was too small, so a large number of ROCs with insufficient optimization potential were adopted and a large number of derivative conflicts were generated in the iteration, which negatively affected the optimization effect. Such ROCs generate a large number of derivative ROCs in the iteration, which harms optimization.
Second, the total number of anchored areas rapidly dropped, and the tendency of was to decrease and then rise. In this stage, ROCs with insufficient optimization potential were filtered, and the number of new derived ROCs was significantly reduced. The main negative factor affecting gradually changed from the use of ROCs with insufficient optimization potential to the loss of ROCs with sufficient optimization potential.
Third, the NAR slowly decreased, and slowly rose. When T increased to make NAR drop to 0, reached its maximum, which was equivalent to no optimization.
The value of T should have led to its lowest point, which means that ROCs with insufficient optimization potential were filtered, and ROCs with sufficient optimization potential were retained as much as possible. Depending on the image and evaluation method, the value range of T may be very different, so the value of T generally needs to be selected through preliminary experiments. In this paper, according to the results of parameter analysis, the T of experimental images T1, T2, and T3 was set to be 0.008, 0.005, and 0.007, respectively.
3.3. Unsupervised Evaluation
The segmentation results of three scenes before and after optimization are shown in
Figure 7, and the relevant information is provided in
Table 4. Note that segmentation results before optimization are deliberately designed to have enough segmentation errors, in order to test the proposed method.
The number of segments of T1 and T2 decreased after optimization, while that of T3 increased. Therefore, the effect of the proposed method on the global optimal scale is random.
Table 4 also illustrates the results of the unsupervised evaluation. The unsupervised-evaluation method with indicator
E is a classical entropy-based evaluation method [
48], which is the same as the local evaluation algorithm for evaluating the optimization potential of ROCs. A smaller
E refers to better segmentation quality. This method is used to verify that local optimization contributes to global optimization. After optimization, indicators
E of the three segmentation results were significantly reduced, thereby proving that the proposed method could effectively optimize global segmentation quality.
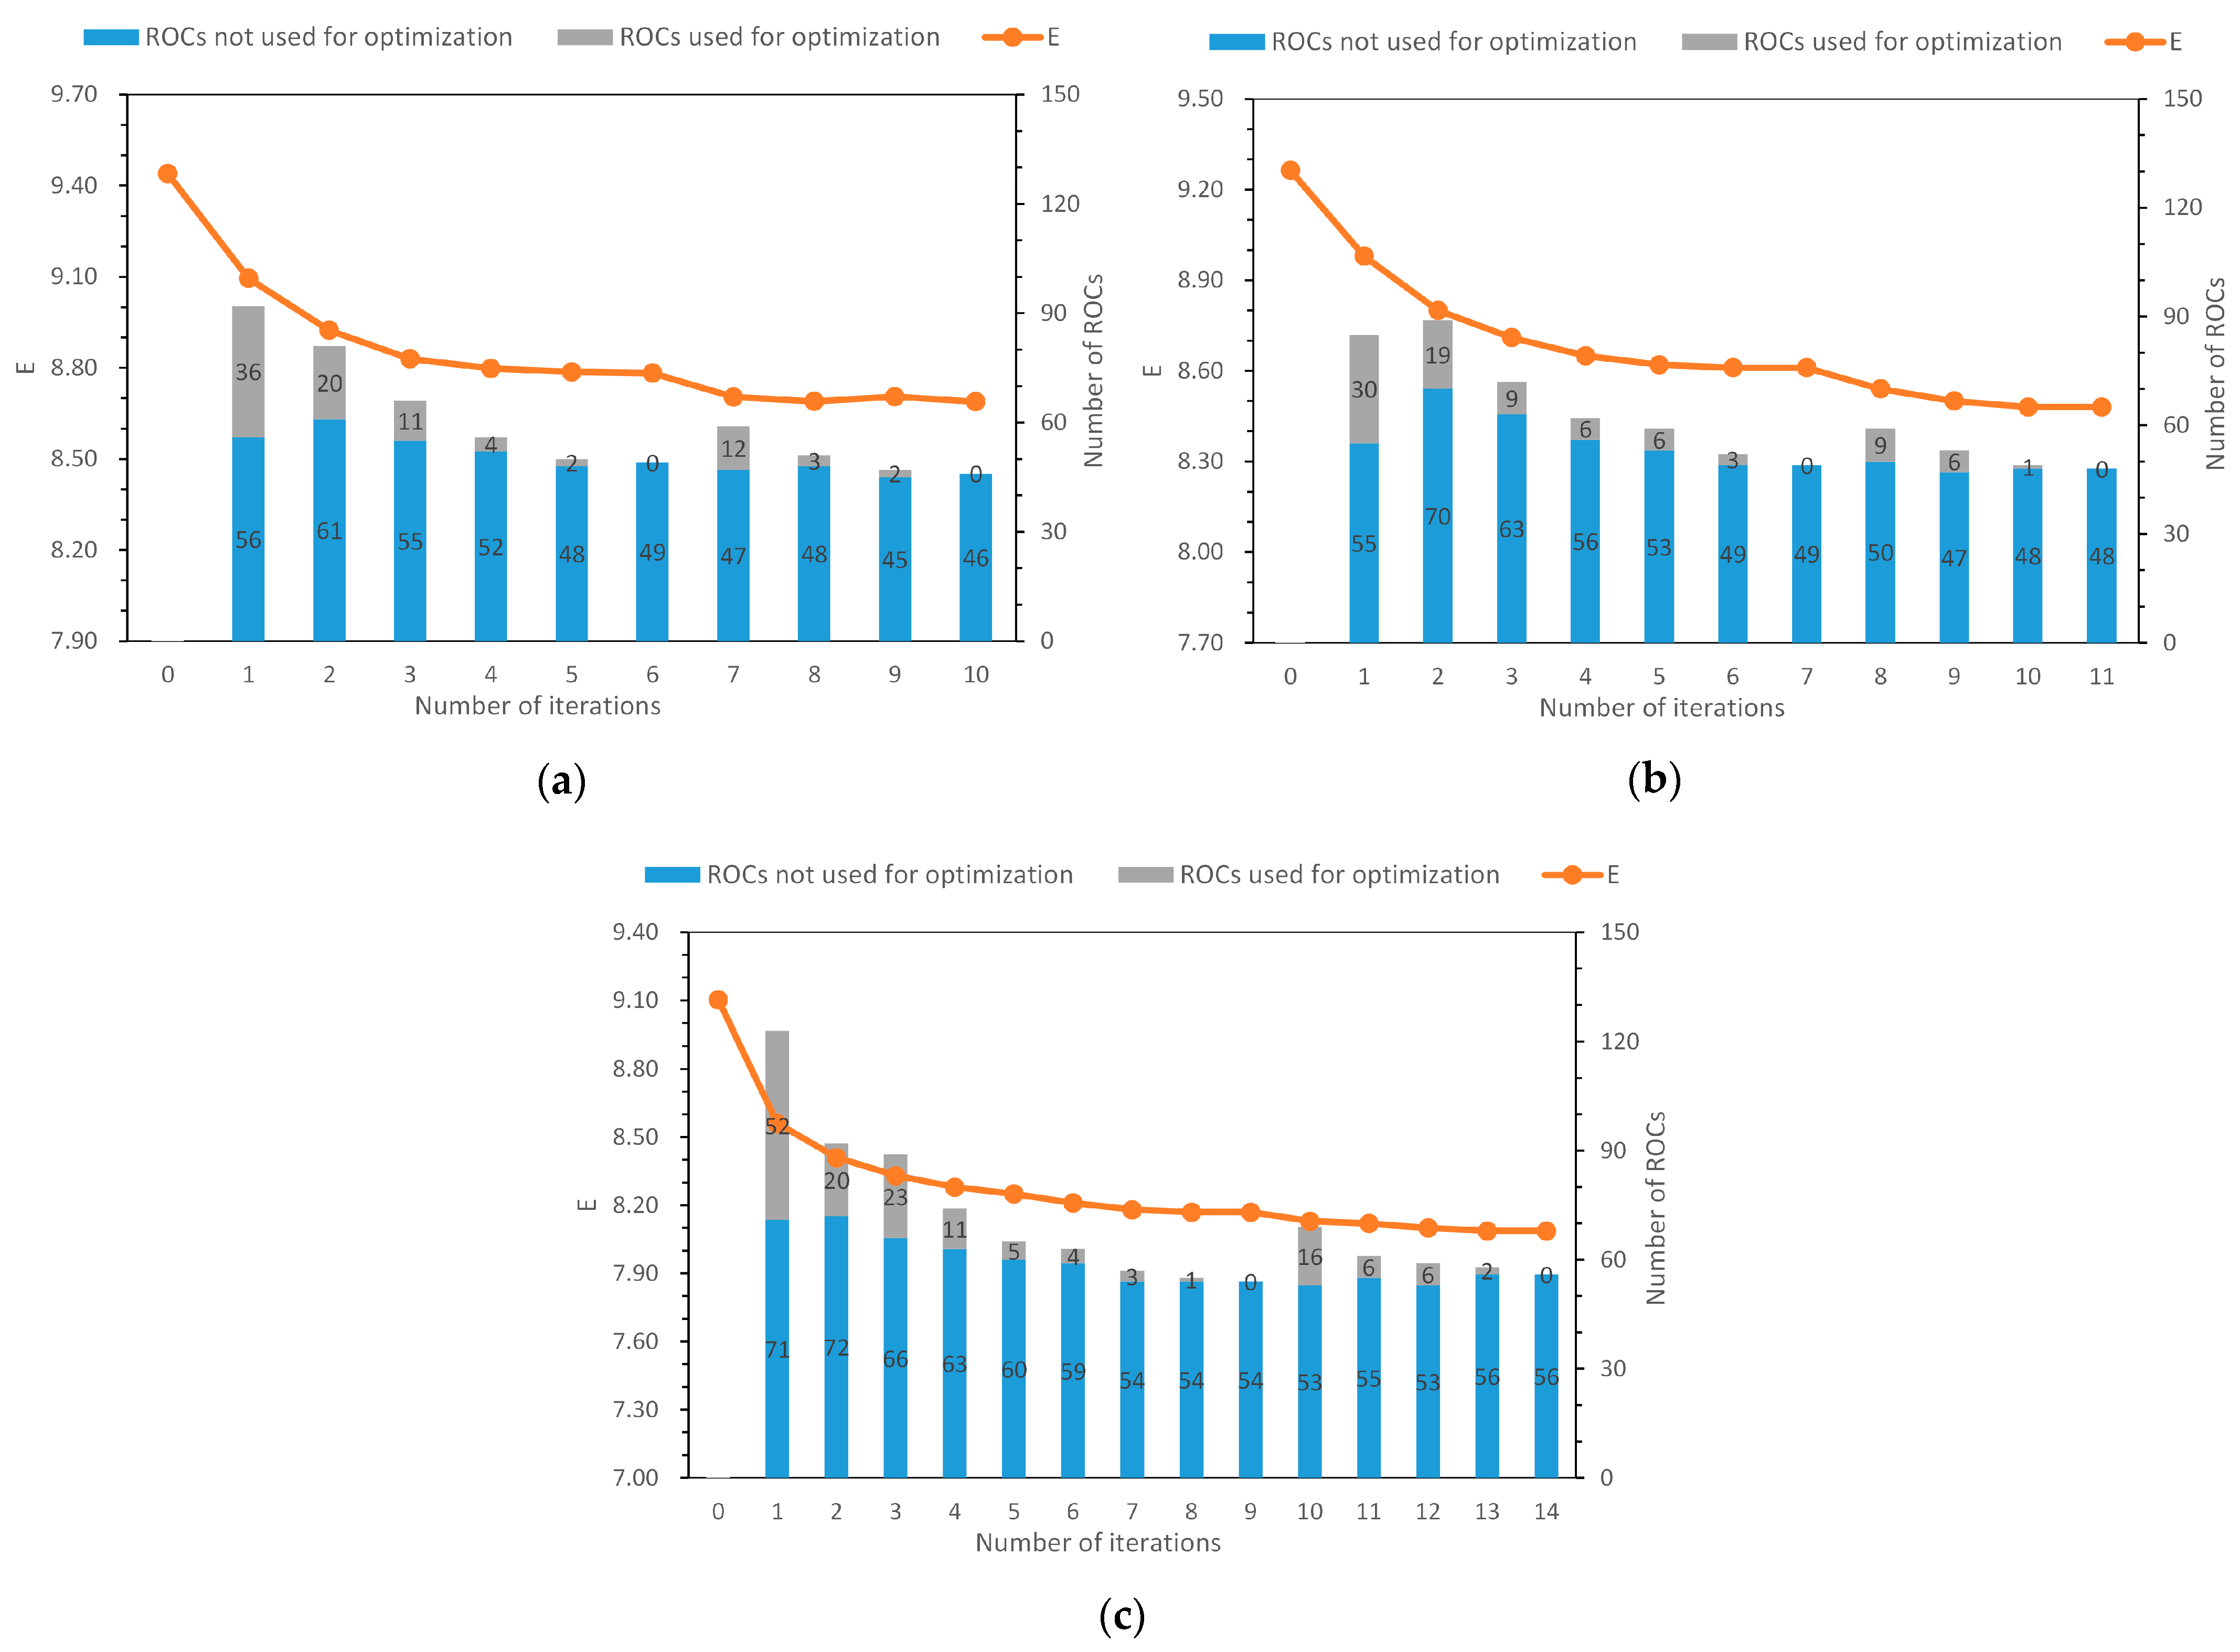
To further analyze the proposed method, the change in indicator
E and the use of ROCs during the iteration process are shown in
Figure 8. With optimal parameter
T, the used ROCs for optimization accounted for a small part of total ROCs. In the preliminary experiment, the optimization effect of the third and more RMC is negligible, so these three experiments all chose two RMC to form the RMCG on the basis of the optimal result criteria. The MC used in the experiment are shown in
Table 5, and their details are shown in
Section 2.2.
represents the
RMC that was used in the optimization of experimental image
. The number of ROCs used in an iteration was 0, which indicates that the optimization based on the RMC was completed. Other unsupervised evaluation algorithms were not used because they contribute little to objective evaluation. A more objective supervised-evaluation algorithm is used to evaluate the optimization effect in the next section.
3.4. Supervised Evaluation
The unsupervised evaluation results prove the overall effectiveness of the proposed method, but the effectiveness lies in the unsupervised evaluation algorithm itself, and it is difficult to explore the effect of the proposed method from the perspective of features. To further analyze the effectiveness of the proposed technique, the method of supervised evaluation is required. The approach of T. Su and S. Zhang [
57] was used for the implementation of the supervised evaluation. This scheme is based on a region-overlapping criteria, and one OSE and one USE were calculated for each RG. When OSE/USE = 0, it indicates that the RG has no over-/under-segmentation error. When OSE/USE = 1, it indicates that the over-/under-segmentation error of the RG has reached its maximum. The global OSE (GOSE) and global USE (GUSE) indicators used to measure the quality of global segmentation are shown in
Table 6. GOSE/GUSE is defined as the area-weighted mean value of OSE/USE of all RGs. A smaller GOSE/GUSE indicates that the global over-/under-segmentation error is smaller.
As shown in
Table 6, after optimization, the GOSE/GUSE of all experimental images was reduced, indicating that the proposed method could effectively globally reduce over-/under-segmentation error. The decline in GUSE of T1 and T2 was significantly greater than that of GOSE. Although the decline in GUSE of T3 was similar to that of GOSE, Figure 11e,f show that a large number of small-area USE of RG has been corrected.
It is necessary to clarify the details of optimization. Therefore, the proposed method is analyzed in detail from the perspectives of positive and negative optimization through representative RGs marked by circles in
Figure 7.
3.4.1. Positive Optimization
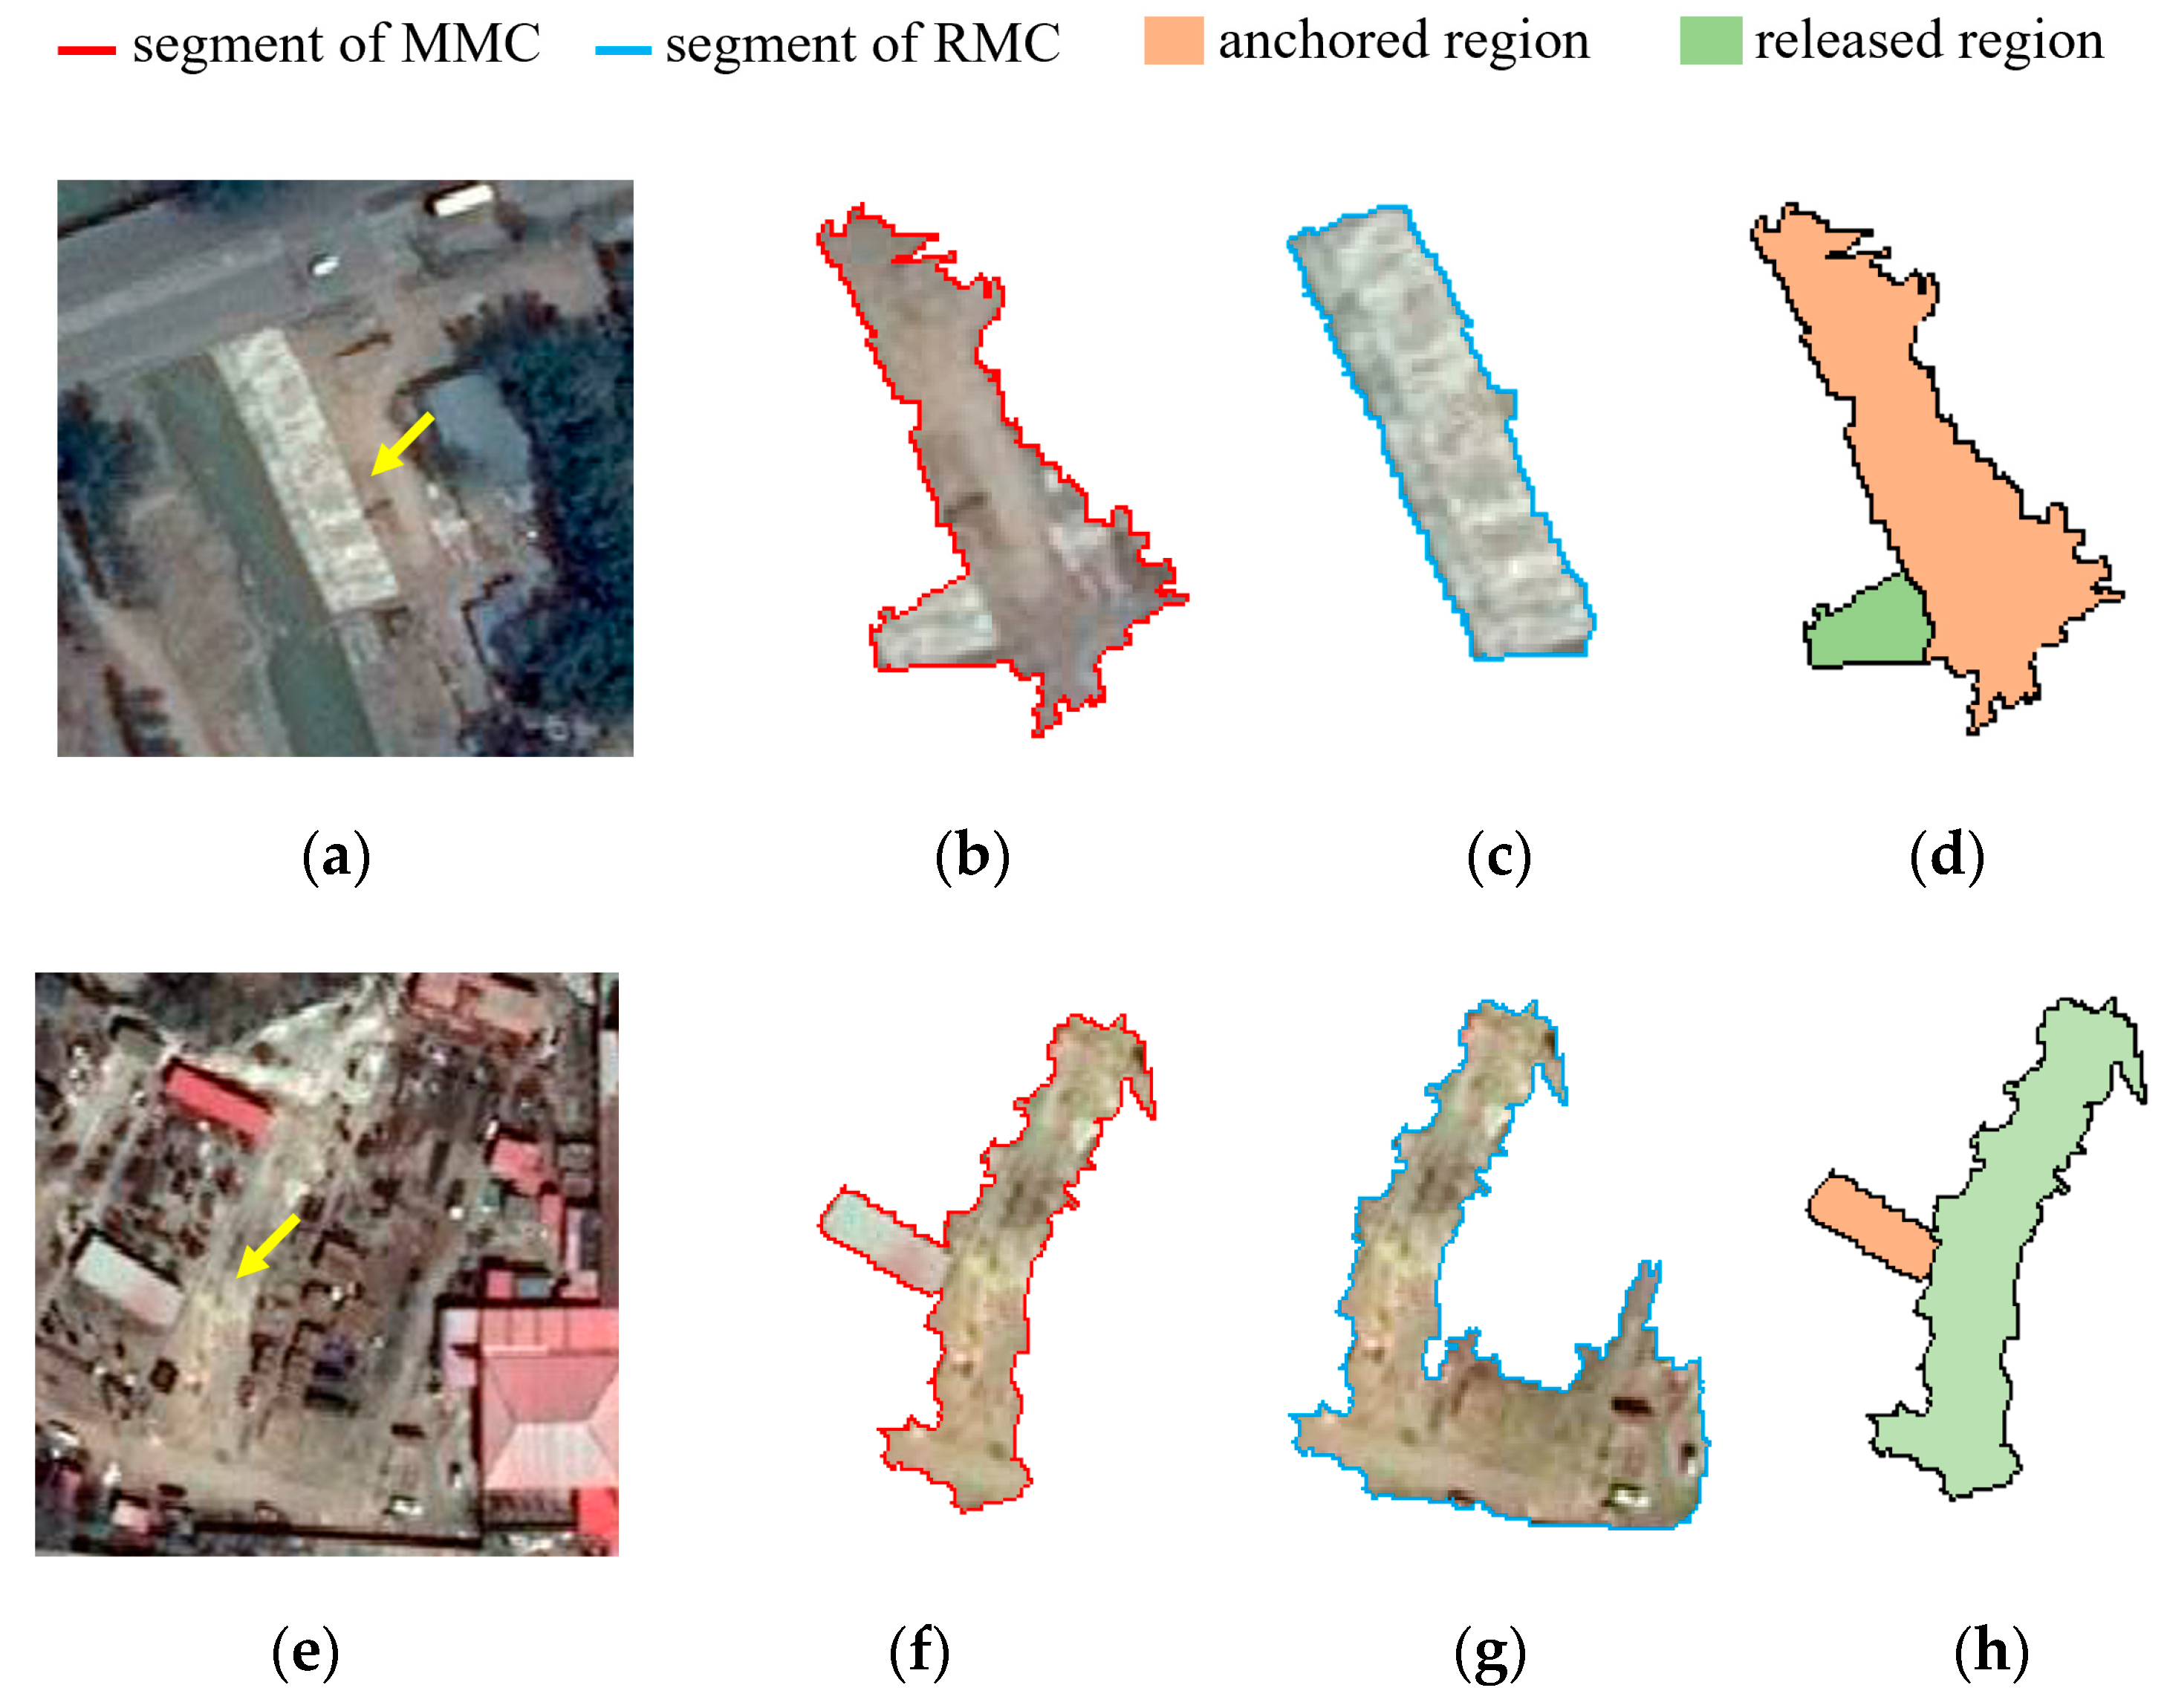
Previous global evaluations have proven that the proposed method can effectively correct OSE and USE. There are two types of direct correction for USE. The first type is to release regions belonging to other features by anchoring. In the new region merging, the released regions are merged with the correct regions to correct USE.
Taking patch A in T1 (marked with a circle in
Figure 7) as an example, the lower part of the off-white building was mistakenly merged with the adjacent bare land, which conflicted with the segmentation result of RMC. After local evaluation, the regions of buildings were released, and the remaining segments were anchored. In the next merger, the released regions belonging to the building were correctly merged, thus successfully reducing the USE of the corresponding RG. The second type is similar to the first, but the anchored part is an independent feature, so the USE could be directly corrected without a new merging process.
Taking patch F in T2 as an example, before optimization, the segment of the building was confused with bare land. After evaluation, the regions of bare land were released, and the remaining segment was anchored as an independent building, which directly reduces the USE of the corresponding RG.
To directly understand the difference, the two examples are demonstrated in
Figure 9, which includes segments of MMC and RMC in the ROC and the results of region anchoring and releasing. The segment of MMC in
Figure 9d is different from patch F in
Figure 7c because it came from the intermediate result of the iteration optimization. Examples of the first type can also be seen in patch C in T1, patch K in T3, and patch J in T3; examples of the second type can also be seen in patch D in T2, patch I in T3, and patch M in T3.
The proposed method could also indirectly correct OSE. When there were heterogeneous regions within the RG, the segmentation result was unstable due to the cumulative effect of errors. After removing the heterogeneous regions by anchoring, the homogeneity of the remaining segments was improved. For example, after the highlighted region of the building inside patch L in T3 was anchored, the OSE of the building was corrected. Examples of the same type also are shown in patch E in T2 and patch G in T2. Some RGs did not have related anchored regions, but the OSE within the RGs was still corrected. This phenomenon reveals the potential impact from other anchored regions.
3.4.2. Negative Optimization
The proposed method may also cause negative optimization even though the optimization is globally positive. When the internal texture of the RG is heterogeneous, the region merging results of MMC and RMC are quite different, and a large number of fragmented anchoring segments are generated, which may lead to the increase in the OSE of the RG. Typical examples can be seen in patch H in T3 and patch B in T1. The region-anchoring strategy changes the region-merging order and global optimal scale in each iteration, which may lead to negative optimization in the local region, especially when the optimization potential of ROC is insufficient. This also explains why T was used to filter the conflicts with insufficient optimization potential.
Figure 10 and
Figure 11 are the visualization results of the OSE and USE of RG for the experimental images, respectively. The deeper the color is, the larger the OSE/USE of the RG. Some obvious optimized RGs are marked in yellow circles.
4. Discussion
In
Section 3, both unsupervised and supervised evaluation results prove that the proposed method can effectively improve segmentation accuracy. The optimization modes of the proposed method are also concluded, which further illustrates its stability. However, there were still some problems. The first is negative optimization. As mentioned in
Section 3.4, this method is sensitive to texture inside the ground truth. If the texture inside the ground truth is heterogeneous, it is prone to producing fine anchored regions inside the ground truth, which increases the OSE. The region-anchoring strategy leads to a different initial state for each merger, and region-merging segmentation is very sensitive to the starting state, so implicit local negative optimization may occur. This is a point of concern for us, but experiments showed that most implicit optimizations were positive, and it was possible that the wrong correction could improve the global quality of segmentation. We thus speculate that the correction of local region-merging errors could improve the global quality of segmentation. Second, since ROCs with insufficient optimization potential harm optimization, parameter
T was used to filter conflicts with insufficient optimization potential. However, the optimal value of the
T parameter is affected by many factors including image size, segmentation, and unsupervised-evaluation algorithm, which complicates parameter selection for the proposed method. Third, in our first attempt, multiple RMC were needed to complete the full optimization, but the experiment results revealed that the optimization effect of the third and subsequent RMC was negligible. According to analysis, each segment could only be optimized once due to the region-anchoring strategy, so the upper limit of the optimization number had two parts: the number of segments with sufficient optimization potential in the MMC segmentation result, and the number of derived segments with sufficient optimization potential generated by anchoring regions. When the upper bound of the optimization number is reached, it is meaningless to add more RMC.
5. Conclusions
In this paper, a novel image segmentation quality optimization approach in the framework of hierarchical region merging was proposed. Experiments showed that the proposed approach could effectively optimize region-merging image segmentation results by detecting and correcting segmentation errors. Besides this, two explicit and one implicit optimization mode are summarized. Accordingly, it is expected that the proposed method would strengthen the OBIA performance.
The highlights of the proposed approach are as follows:
- (1)
Regional conflicts among segmentation results of different MC are distinguished into SEC and ROC.
- (2)
ROC can be utilized to optimize segmentation quality, and an equal-scale local evaluation method for quantifying the ROC optimization potential is proposed.
- (3)
A region-anchoring strategy is proposed to record the optimization results of each iteration.
On the basis of the proposed method, three potential research directions worth further studying. First, there is potential for solving scale expression errors in SEC. This requires incorporating some novel strategies into the proposed approach. Second, the proposed approach is an iteration process. Although it could quickly converge, operating efficiency still has room for improvement, especially in the process of conflict detection. Third, the proposed approach is a framework model with strong compatibility. Therefore, incorporating more algorithms into the model for experimentation is conducive to finding a way for further improvement.


 ,
, 


