Abstract
Oil pollution is one of the major critical risks to the Egypt’s marine environment due to the heavy traffic caused by shipping in the Suez Canal and the exploration and production of crude oil. Indeed, such frequent oil pollution cases harm to the marine ecosystem and creates pressure on the socio-economic activities within the coastal economic zone of Egypt. Limited data availability creates obstacles to the precise monitoring of oil pollution and the ability to alert the environment agency to take any necessary actions. This research explored the potentiality of developing an open-source model with the use of open-access Sentinel 1 Synthetic Aperture Radar (SAR) data from the European Space Agency to operationally monitor oil pollution at near-real time. As such, early detection and quantification of the volume of pollution creates an early warning system that supports decision makers in clean-up operations and the prosecution of the polluter. The developed model uses an open-source GIS system and Sentinel-1 SAR data to robustly detect and map oil spills and create an a report to alert the appropriate agency of the spill. The model examined a large amount of data, nearly 2000 scenes from the Sentinel 1 SAR sensor, that cover the area of study from 2014 to 2020. The model detected approximately 218 oil pollution cases within this time frame, with about 35% occurring in 2017 alone. The statistical analysis and frequency of oil pollution is mapped near the entrance of Suez Canal and the city of Port Said. This area is known as the anchoring area for the maritime ships that travel via the Suez Canal, and there are also oil and gas production nearby. It was found that the drift direction of the oil spills near Port Said move southwards, which creates a hazard for local fishing activities, Port Said touristic beaches, and marine ports. This model is the scientific and practical solution for the city council and the environmental agency to continuously monitor and receive alerts regarding any oil pollution cases in order to protect the coastal and marine socio-economic ecosystem and maintain sustainability.
1. Introduction
1.1. Background
Oil pollution is the discharge of liquid petroleum hydrocarbons into the marine environment by means of man-made activities [1]. It represents a serious threat to the marine ecosystem and coastal infrastructure. In many oil pollution cases, waste oil, oily ballast water, and other refined petroleum products such as gasoline and their by-products are released from shipping vessels. Many research studies correlated the frequency of oil spills with main shipping routes, where they found that frequent spills happen along these routes [2]. The only accepted oil discharges are below 15 ppm to prevent spills but that is not enough to prevent the impact of pollution [3]. Light, volatile oil molecules evaporate quickly and oxidize, the product of which is highly toxic. Heavy oils are less toxic but remain in the eco-system for a long time, especially if they become mixed with the pebbles and sand along the beaches. Oil spills may severely reduce the populations of phytoplankton and aquatic organisms.
Remote sensing technologies provide an effective tool to map oil spills in the marine environment at a low cost [4]. Space-borne optical and Synthetic Aperture Radar (SAR) data can be used to scan large water mass areas for possible oil spills, and aircrafts can then verify the spill and polluter source [4]. While space-borne optical sensors are limited to daylight and clear weather conditions, SAR data can be used during both day and night and is unaffected by clouds [5]. Unfortunately, it is difficult to detect oil spills through fog and dark conditions, however, SAR resolves this problem since it emits and receives microwave radiation, which is not affected by weather conditions [2].
Egypt has a long coastal marine environment that extends for more than 3300 km that is at risk of oil pollution. While there is a challenge to meet the growth in shipping activities in the Mediterranean Sea, the monitoring tools developed by environmental policy makers and practitioners keep an eye on the possible risks from oil pollution and help them take necessary actions. The key limitation is the oil spills are dynamic and quick to disappear, so it is very difficult to confirm through field visits. Therefore, space-borne satellite images are an efficient solution that help safeguard the environment through fast detection, mapping, and reporting of the spills for quick action. The precise detection of oil spills is important in clean-up operations to reduce the negative impact on the environment and to prosecute the polluter. Employing satellite-based technologies and open-source software is a new approach that could efficiently support this challenge in developing countries. The study adopted this approach to use open-source and time-series Synthetic Aperture Radar data to map all possible oil spills that happened from 2014–2020 and on a daily basis within in the last 4 years along the Mediterranean coast. The development of an open- source toolkit able to map and monitor oil spills that could support local authorities and environmental agencies in Egypt is anticipated. This research introduces a scientific and practical solution for city council and the environment agency to robustly and operationally monitor and receive alerts of any oil pollution to protect the coastal and marine socio-economic ecosystem and to maintain sustainability.
1.2. Literature Review
Historically, oil spill emergency cases are managed by the Egyptian Environmental Affairs Agency (EEAA) in Egypt’s coastal environment at least four times a year [6]. For example, in 2004 at the Sidi Kerir Port Terminal, the Good Hope ship lost nearly 1000 tons of light crude oil while loading. In the same year, 9000 tons of Kuwait medium crude oil was lost in the Samidoon incident at the Suez Canal. The Suez Canal Authority took over the situation to recover the oil using booms and skimmers. During the period of 2004–2014, Petrosafe, an oil spill responder company, responded to more than 50 oil spill cases in Egypt. Despite the laws, conventions, and the national oil spill contingency plan, there is still no proper tool to monitor drilling activities and tanker transit pollution.
Previous research studies estimate that the total volume of oil discharge in the Mediterranean Sea ranges from 1600 to 1,000,000 tons per year [7]. In 2011, the Regional Marine Pollution Emergency Response Center for the Mediterranean Sea (REMPEC) reported that the oil released in the Mediterranean Sea for the period 1977–2010 was greater than 100 tons and was geographically distributed as follows: Greece (30%), Italy (18%), and Spain (14%) as the main countries followed by Egypt (8%), Algeria (6%), Lebanon (6%), and others (12%) [8]. When correlated with maritime traffic, it is consistently correlated. Most of the reported accidents are grounding (21%), collisions (17%), explosions (14%), cargo transfer failure (11%), and sinking (9%). CleanSeaNet is an oil spill and vessel detection service provided by the European Maritime Safety Agency (EMSA)that analyzes available Synthetic Aperture Radar (SAR) images and the information retrieved, including spill location, area, length, possible source of pollution, and the confidence level of detection, particularly for European countries [9].
Figure 1 shows a map of pollution that occurred in the Mediterranean Sea, which was developed based on the database of the Mediterranean Integrated Geographical Information System on Marine Pollution Risk Assessment and Response (MEDGIS-MAR) [8]. Oil pollution is classified into three categories: less than 7 tons, from 7 to 700 tons, and more than 700 tons. The analysis of this database shows that many cases of oil pollution of the 7–700-ton size were near the Nile Delta during the period of 1990–2013, while only 5 cases were recorded between 60–350 tons and were related to tankers. Table 1 lists 24 incidents recorded for Egyptian waters extracted from the MEDGIS-MAR database.
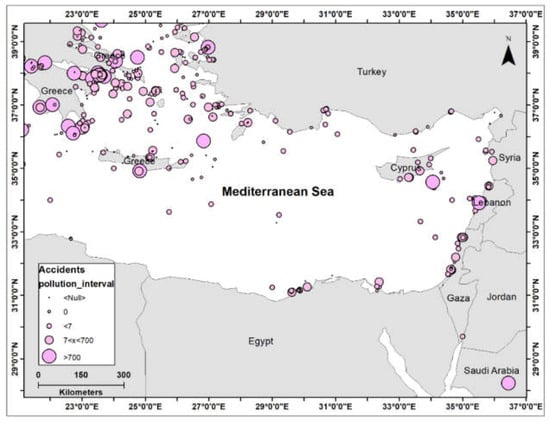
Figure 1.
Oil accidents in the eastern Mediterranean Sea during the period of 1990–2013 classified into 3 classes: less than 7 tons, from 7 to 700, and more than 700 tons [8].

Table 1.
24 large oil spills in the Mediterranean waters of Egypt [8].
Another comprehensive research study conducted by the Joint Research Center (JRC) [10], added more results to the REMPEC tool, as it included the small spills from ships, as shown in Figure 2 and Figure 3. From this JRC research study, nearly 19,000 SAR images were processed, and more than 9000 possible oil spills could be mapped in the waters of the Mediterranean Sea between 1999 and 2004. The results are consistent with the main ship navigation pathways in the Mediterranean Sea.
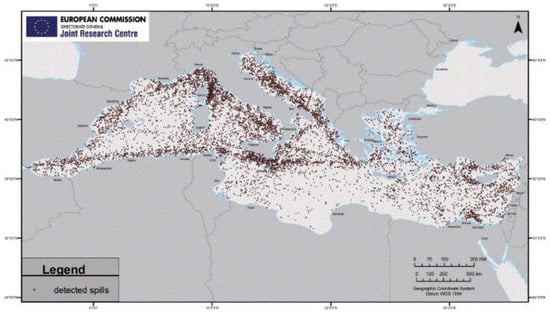
Figure 2.
Possible oil spills in the Mediterranean Sea detected between 1999 and 2004—[10].
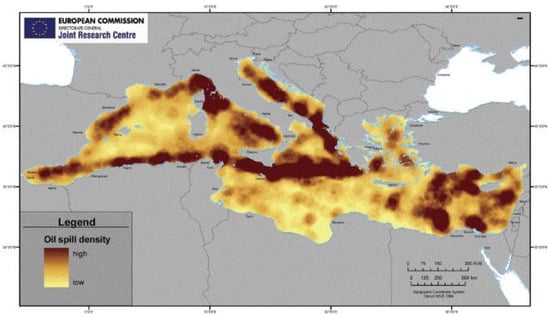
Figure 3.
Oil spill density in the Mediterranean Sea [10].
Moreover, a research study carried out by the Cyprus Oceanography Center to map oil spills around Cyprus in the period of 2007–2011 detected more than 1000 oil slicks that were related to ship navigation pathways (Figure 4) [11]. It is expected that Egyptian coastal waters might have had the same hazards during that period. Unfortunately, limited research studies are available on the oil spills in the coastal zone of Egypt along the Mediterranean Sea despite the high probability of pollution related to dense traffic and oil exploration and production. Therefore, this research was carried out to explore the potentiality of developing tool using SAR data and open-source software to support the environmental agency in monitoring oil pollution.
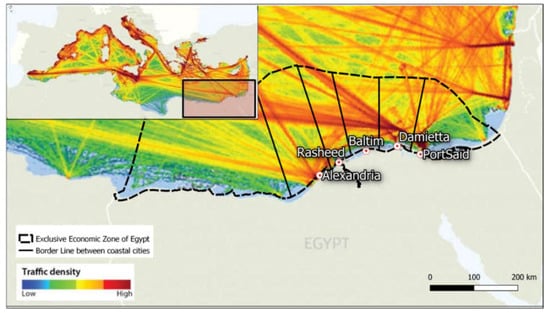
Figure 4.
Density of maritime traffic in the Mediterranean Sea in 2017 [12].
2. Materials and Methods
2.1. Study Area
The area of study is the Mediterranean Sea coastal waters of Egypt from Port Said and the Suez Canal to Marsa Matruh. This area is occupied by the five major cities of Alexandria, Rasheed, Baltim, Damietta, and Port Said together with the major sea ports at Damietta and Alexandria. This area is exposed to extensive marine shipping and both oil and gas exploration and production activities. The Mediterranean Sea is considered to be the busiest among the world seas in maritime traffic (Figure 4) [12].
2.2. Methodology
Radar sensor is the effective tool for oil detection, as it senses oil during both the day and night and under any weather condition. In fact, oil spills on the sea surface dampen the capillary waves making lower backscatter than the surrounding clean seawater surface [13]. This enables the oil to be detected as a dark spot surrounded by a bright background. The challenge is that there are many other sources that can also produce similar dark spots in the image, including calm water areas with no capillary waves, rain cells, seaweed that calms the water above it, freshwater slicks, and whale and fish sperm [14].
This research used the radar data captured in the C band at incidence angles around 20°, which is suitable for sea imaging. The magnitude of backscatter increases with the wind, as it is directly affects the number of capillary waves [15].
This research is building on the model developed by El-Magd et al. [1] and is improved to be integrated with open-source software and robustly uses the Sentinel Application Platform (SNAP) toolbox to initially process Sentinel-1 SAR data to detect and map oil spills as a raster image, as shown in Figure 5 (left), which is consequently masked to a separate raster celled area, Figure 5 (middle). Q-GIS is then used to convert the raster image into a vector layer for further spatial analysis, as shown in Figure 5 (right). This research developed the model to operate sequentially and robustly to implement these operations for the near real-time or real-time detection of oil spills and to create early warning alerts.
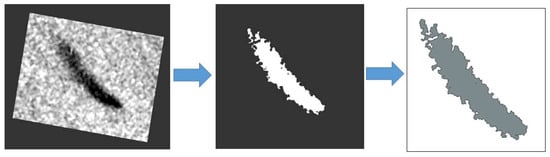
Figure 5.
Left—is the preprocessed raw data: result after speckle filtering and geometric correction. Middle—is the masked oil spill area after processing and clustering the SAR image based on a predefined threshold of 2 decibel. Right—is the vector conversion of the raster oil spill mask to be enable area and other geographical calculations.
3. Results
Since 2014, initial online exploration of nearly 2000 Sentinel-1 images covering the area of study was completed using the Sentinel hub EO browser and Google Earth Engine to visually check any dark spots. This step filtered the exploration to a set of 116 scenes that are suspected of probable oil spills. The model was then applied onto these 116 scenes to detect the actual oil spills. The model detected about 218 cases of dark spots that represent oil spills. The total area of these oil spill cases is 1964 km2, which is distributed near the coastal cities and marine ports. The model is capable of detecting any size of oil spill, from large oil spill cases, such as the spill on 8 June 2017 that covered nearly 94 km2, to the smallest oil spill case, such as the one on 25 September 2018 covering only 0.3 km2 (Figure 6). The largest oil spill case is near the anchoring area of the ships that travel through the Suez Canal, however it is also near four oil platforms for oil and gas production, and it might be any of them that are the source of pollution. However, the smallest oil spill is at the entrance of the Canal, and its detection is very important.
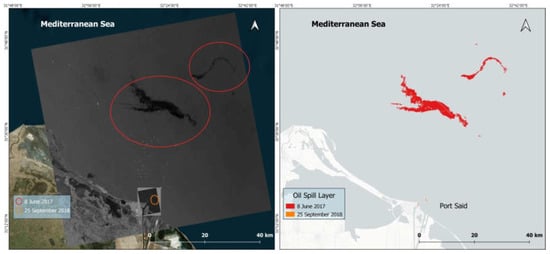
Figure 6.
The capability of the model to detect the largest oil spill event near the entrance of the Suez Canal at Port Said city, which happened on 8 June 2017, with an actual mask of the oil layer with an area equals 94 km2 and the smallest oil spill event detected, which happened on 25 September 2018, at the Canal entrance with an area of 0.3 km2.
The model enabled the development a spatial geodatabase of the recorded frequency of oil pollution cases. Figure 7 shows the location of the total cumulative 218 pollution cases within the time frame of 2014–2020. Nearly 187 out of the 218 cases occurred between 2017 and 2019. Table A1 lists all of the information about the 218 oil spill cases including their dates, the nearest city, their frequencies, and source of data. It can be clearly observed that the majority of these oil spill cases are near the city of Port Said and the entrance of Suez Canal. The location of these oil spill cases reflects that maritime shipping and the pathway to Suez Canal play key role in such oil pollution cases. Through geometrical analysis of these cases, it was found that most of the detected incidents have a longitudinal shape, whether horizontal, vertical, or in between, which indicates that the discharges occurred while the vessels were moving. That result confirms the literature, which indicates that discharge from ships represents the largest ratio of all pollution sources [2]. Horizontal spills that have an east-west orientation may refer to local ships moving near the coast, and vertical spills with a north-south orientation might indicate discharges from international ships.
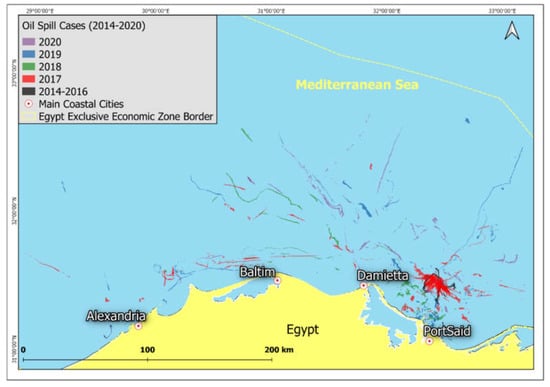
Figure 7.
Spatial distribution of the cumulative frequency of 218 oil spill cases detected along the Egypt Mediterranean coast in the period from 2014 to 2020.
In the analysis of spill coverage areas, there are many oil pollution cases (about 84) in the range of 0.3–10 km2, which are small and might give an indication that no attention should be paid to it. However, it is important that these small sized cases be monitored since they cover large areas, in total reaching 253 km2, and they appear frequently.
The model enabled the statistical analysis of the frequency of oil pollution cases in this period in total and on a yearly basis (Figure 8). It is obvious that 2017 has the highest frequency of repeated oil pollution cases in comparison to 2018, 2019, and 2020. The majority of high frquency cases are also near Port Said City, which is to ship anchoring area and the oil and gas platforms. This means that this area isat high risk of regular oil pollution and that it needs further attention and action plans to minimize the frequency.
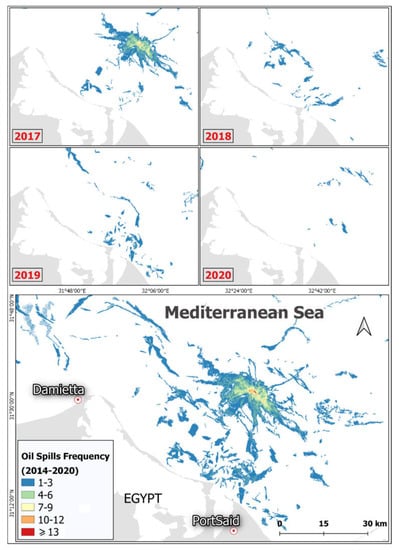
Figure 8.
Frequency of oil spills cases on locational dimension near Port Said on a yearly basis that shows the majority of oil spill cases are near Port Said between 2017 and 2019.
4. Validation
On 21 May 2019, a small spill was detected near the Alexandria Port with a bright spot at the tip of the longitudinal dark patch, as shown in Figure 9. The longitudinal pollution pattern and the bright spot are strong evidence that the pollution source is a mobile ship. When this dark spot was validated against the maritime shipping traffic database, it was confirmed with the pathway of an oil tanker that was in the area at the same time and along the same route as the dark spot. This database enabled the viewing of the movement location of the ship and the longitudinal shape of the dark spot. Therefore, the integration between the maritime shipping traffic database with oil spill model monitoring is important to identify manner whether the source of pollution is a ship or not in a timely.
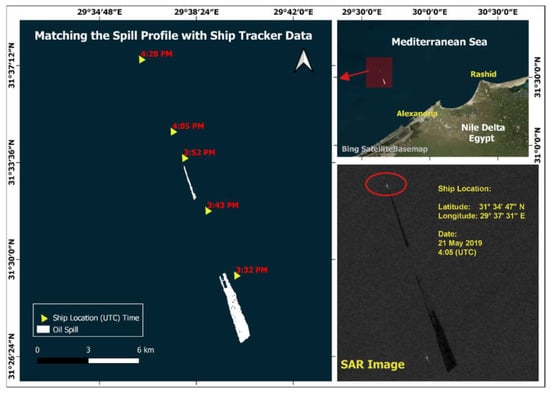
Figure 9.
Inter-correlation between longitudinal oil spill case detected by the model near Alexandria City on 21 May 2019 @ 4:05 UTC and the location and direction of the movement of a maritime ship. This enabled the identification of the source of the pollution as the ship.
5. Discussion
Limited research has been conducted on the oil spill monitoring of Egyptian waters using remote sensing despite being part of the most crowded seas in the world. For example, El-Magd et al., used hyperspectral imaging to define the spectral profile of oil spills in the Nile River [16]. Recently, Kostianoy et al., and Kostianaia et al., mapped part of the spills in the Mediterranean and Red Sea using SAR for the period of 2017 to 2019 [17,18]. This motivated us to develop a model on a scientific basis that was capable of detecting and mapping oil spill cases and analyzing them. Oil spills in the Mediterranean Sea of Egypt frequently occur and vary in size, from small to large oil coverage. Most of them are likely due to illegal ship discharges or/and oil and gas exploration and production. The frequency, shape, and pattern is more likely indicative of the source. To monitor such a large marine environment for oil pollution, there is a need of a regular source of information and an efficient tool to keep an eye on and record all oil spill cases. The developed model in this research provided an efficient tool to monitor the oil spills in the Mediterranean marine environment of the coastal zone of Egypt on a daily basis. Statistical distribution of the recorded 218 cases to explore the proximity to the coastal cities, and activities show that the majority of oil spills are near the marine ports. Port Said City and the entrance of the Suez Canal have the highest frequency of oil spills, with nearly 136 cases that are correlated with the anchoring area of the maritime traffic ships and at the proximity to for oil and gas platforms. Table 2 summarizes the number of oil pollution cases with proximity to the main coastal cities, which area mainly occupied by marine harbors. The number of oil pollution cases increase from west to east, with the minimum recorded cases being near Matrouh (this is not a traffic heavy harbor), the medium frequency cases near Alexandria, Baltim, and Damietta, with an exponential increase toward Port Said City and the entrance of Suez Canal. However, there is an obvious increase at the entrance of Suez Canal after the launch of the new canal in 2015, but this kind of correlation requires further long term study to understand if the launch of the new canal plays a role or not.
Table 2.
Number of oil spill accidents for Egypt’s main coastal cities.
The highest frequency of oil cases recorded are close to the maritime shipping route to the Suez Canal and is in agreement with the historical study done by JRC [10]. The shape and geometry of the oil spills are clearly indicative of shipping as a major source of oil pollution. This is also in agreement with the high shipping traffic in the Mediterranean Sea and the number of vessels that pass into the Suez Canal. Moreover, oil exploration and production plays another role in oil pollution, and the largest oil spill recorded in 2014 was close to four platforms of oil production. Therefore, the circular or the irregular shape of oil pollution is also an indication of the source of oil production.
6. Conclusions
In conclusion, historically and contemporarily, oil pollution in the Mediterranean Sea is very high, with multiple sources, including maritime shipping or oil and gas exploration and production. Monitoring such oil pollution cases is necessary to take action against the polluter and to respond quickly to remediate the environment. Egyptian coastal water is under a high risk of high pollution, however there is no regular near-real time or real-time monitoring system for oil pollution. The limited research in this area is the motivation of this research, which explored the development of an open- source model using Sentinel 1 SAR data to create an visual of the marine environment and is capable in detecting and mapping oil spill cases. The model detected about 218 oil pollution cases with nearly 2000 km2 of oil pollution areas within the area of study in the last few years. Geographically, the model mapped the frequency of oil pollution within the dimensions of time and space, which showed that the area near the north exit of the Suez Canal at Port Said City has the highest frequency of oil spills due to the proximity to the anchoring area for ships and platforms for oil and gas production. Due to the absence of aerial surveillance in most of developing countries, there is an inability to regularly monitor oil pollution and spot the polluter. The availability of Sentinel 1 SAR data due to free data access by the European Space Agency is an effective source of information that enables the model to continue looking at the marine environment on a daily basis. More efficiently, the integration with the maritime shipping traffic database could enable to correlate the source oil pollution with the source ships using the ship tracker database. This was validated with one oil pollution case detected on 21 May 2019. With the increasing load of petroleum activities in the Mediterranean waters of Egypt, an increase of the risk of serious incidents will occur, so environmental capabilities to monitor oil pollution in the economic water zone should be developed. The presence of a near real-time monitoring system will decrease the rate of pollution cases itself, as the polluter will be careful in order to avoid penalization in response to the Egyptian Environmental Act, which is the novelty of this research. Finally, the use of SAR and open-source data is an effective approach to detect oil spill incidents and approximate the covered area and to create a report for contingency plans and hazard mapping. This model could be adopted by the Environmental Agency for a warning system and alarm for oil spill cases as a near-real-time service, which can help to find the responsible ship or/and platform. The developed model might need a further validation mechanism at an acceptable level of confidence.
Author Contributions
Conceptualization, I.A.E.-M., M.Z., E.M.A., and A.M.A.; methodology, I.A.E.-M., M.Z.; software, I.A.E.-M. and M.Z.; validation, M.Z.; formal analysis, I.A.E.-M., M.Z., E.M.A., and A.M.A.; investigation, I.A.E.-M., M.Z., E.M.A., and A.M.A.; resources, I.A.E.-M.; data curation I.A.E.-M., M.Z., and E.M.A.; writing—original draft preparation, I.A.E.-M., M.Z., E.M.A., and A.M.A.; writing—review and editing, I.A.E.-M.; visualization, I.A.E.-M. and M.Z.; supervision, I.A.E.-M., A.M.A., and E.M.A.; project administration, I.A.E.-M.; funding acquisition, I.A.E.-M. All authors have read and agreed to the published version of the manuscript.
Funding
This research was funded by African Union Commission and European Union Commission through the GMES and Africa Program–Project NAfcoast. The APC was funded by the NAfcoast Project.
Institutional Review Board Statement
Not applicable.
Informed Consent Statement
Not applicable.
Acknowledgments
The authors acknowledge the African Union Commission and European Commission–GMES and Africa Program and their funding of the project, which supported this research. The authors acknowledge the European Space Agency for the open-data access and the availability of SAR data.
Conflicts of Interest
The authors declare no conflict of interest.
Appendix A
Table A1.
Detailed database generated from the model with all detected oil spills in the area of study from Sentinel-1 SAR data between 2014 and 2020.
Table A1.
Detailed database generated from the model with all detected oil spills in the area of study from Sentinel-1 SAR data between 2014 and 2020.
| ID | Date | Nearest City | Area (km2) | Frequency | Data Source |
|---|---|---|---|---|---|
| 1 | 4 October 2014 | Port Said | 26.41 | 1 | Sentinel-1 |
| 2 | 2 April 2015 | Port Said | 4.01 | 1 | Sentinel-1 |
| 3 | 19 April 2015 | Port Said | 24.15 | 1 | Sentinel-1 |
| 4 | 26 April 2015 | Port Said | 11.33 | 1 | Sentinel-1 |
| 5 | 19 July 2015 | Port Said | 6.22 | 1 | Sentinel-1 |
| 6 | 6 August 2016 | Port Said | 17.6 | 1 | Sentinel-1 |
| 7 | 3 January 2017 | Port Said | 7.83 | 1 | Sentinel-1 |
| 8 | 16 January 2017 | Baltim | 8.22 | 3 | Sentinel-1 |
| 9 | 20 January 2017 | Baltim | 25.02 | 2 | Sentinel-1 |
| 10 | 21 January 2017 | Port Said | 4.24 | 1 | Sentinel-1 |
| 11 | 2 February 2017 | Port Said | 13.01 | 1 | Sentinel-1 |
| 12 | 6 February 2017 | Alexandria | 6.95 | 1 | Sentinel-1 |
| 13 | 7 February 2017 | Port Said | 1.11 | 1 | Sentinel-1 |
| 14 | 8 February 2017 | Port Said | 2.51 | 1 | Sentinel-1 |
| 15 | 9 February 2017 | Port Said | 5.14 | 1 | Sentinel-1 |
| 16 | 19 February 2017 | Rasheed | 58.69 | 3 | Sentinel-1 |
| 17 | 20 February 2017 | Port Said | 2.67 | 1 | Sentinel-1 |
| 18 | 26 February 2017 | Port Said | 2.29 | 1 | Sentinel-1 |
| 19 | 4 March 2017 | Port Said | 12.35 | 3 | Sentinel-1 |
| 20 | 10 March 2017 | Port Said | 5.91 | 2 | Sentinel-1 |
| 21 | 29 March 2017 | Port Said | 10.89 | 1 | Sentinel-1 |
| 22 | 3 April 2017 | Port Said | 16.73 | 3 | Sentinel-1 |
| 23 | 8 April 2017 | Port Said | 26.19 | 2 | Sentinel-1 |
| 24 | 9 April 2017 | Port Said | 12.42 | 2 | Sentinel-1 |
| 25 | 15 April 2017 | Baltim | 10.05 | 1 | Sentinel-1 |
| 26 | 21 April 2017 | Port Said | 30.28 | 1 | Sentinel-1 |
| 27 | 22 April 2017 | Port Said | 17.12 | 3 | Sentinel-1 |
| 28 | 27 April 2017 | Port Said | 12.09 | 2 | Sentinel-1 |
| 29 | 2 May 2017 | Rasheed | 12.04 | 2 | Sentinel-1 |
| 30 | 3 May 2017 | Port Said | 19.88 | 1 | Sentinel-1 |
| 31 | 9 May 2017 | Port Said | 79.32 | 1 | Sentinel-1 |
| 32 | 16 May 2017 | Port Said | 64.65 | 3 | Sentinel-1 |
| 33 | 21 May 2017 | Port Said | 39.75 | 1 | Sentinel-1 |
| 34 | 26 May 2017 | Port Said | 28.22 | 1 | Sentinel-1 |
| 35 | 27 May 2017 | Port Said | 16.96 | 2 | Sentinel-1 |
| 36 | 1 June 2017 | Damietta | 22.53 | 2 | Sentinel-1 |
| 37 | 2 June 2017 | Port Said | 7.83 | 1 | Sentinel-1 |
| 38 | 8 June 2017 | Port Said | 93.98 | 2 | Sentinel-1 |
| 39 | 8 July 2017 | Port Said | 18.01 | 1 | Sentinel-1 |
| 40 | 9 July 2017 | Port Said | 5.11 | 1 | Sentinel-1 |
| 41 | 15 July 2017 | Port Said | 38.27 | 2 | Sentinel-1 |
| 42 | 20 July 2017 | Port Said | 21.16 | 1 | Sentinel-1 |
| 43 | 25 July 2017 | Baltim | 16.86 | 2 | Sentinel-1 |
| 44 | 26 July 2017 | Baltim | 12.28 | 1 | Sentinel-1 |
| 45 | 13 August 2017 | Baltim | 15.08 | 1 | Sentinel-1 |
| 46 | 26 August 2017 | Damietta | 6.56 | 2 | Sentinel-1 |
| 47 | 13 September 2017 | Baltim | 13.16 | 1 | Sentinel-1 |
| 48 | 29 September 2017 | Rasheed | 6.5 | 1 | Sentinel-1 |
| 49 | 1 October 2017 | Port Said | 3.71 | 3 | Sentinel-1 |
| 50 | 15 November 2017 | Alexandria | 19.53 | 2 | Sentinel-1 |
| 51 | 30 December 2017 | Port Said | 29.87 | 2 | Sentinel-1 |
| 52 | 9 January 2018 | Damietta | 45.22 | 3 | Sentinel-1 |
| 53 | 10 January 2018 | Port Said | 9.08 | 3 | Sentinel-1 |
| 54 | 28 January 2018 | Port Said | 20.73 | 3 | Sentinel-1 |
| 55 | 15 February 2018 | Baltim | 49.68 | 1 | Sentinel-1 |
| 56 | 28 February 2018 | Baltim | 18.06 | 3 | Sentinel-1 |
| 57 | 5 March 2018 | Port Said | 9.71 | 1 | Sentinel-1 |
| 58 | 17 March 2018 | Port Said | 3.36 | 3 | Sentinel-1 |
| 59 | 18 March 2018 | Port Said | 2.36 | 1 | Sentinel-1 |
| 60 | 23 March 2018 | Rasheed | 3.43 | 1 | Sentinel-1 |
| 61 | 28 April 2018 | Baltim | 16.3 | 2 | Sentinel-1 |
| 62 | 3 May 2018 | Port Said | 22 | 5 | Sentinel-1 |
| 63 | 21 May 2018 | Rasheed | 7.05 | 3 | Sentinel-1 |
| 64 | 22 May 2018 | Port Said | 7.59 | 3 | Sentinel-1 |
| 65 | 3 July 2018 | Port Said | 8.63 | 1 | Sentinel-1 |
| 66 | 27 August 2018 | Damietta | 11.25 | 2 | Sentinel-1 |
| 67 | 19 September 2018 | Baltim | 12.53 | 2 | Sentinel-1 |
| 68 | 20 September 2018 | Port Said | 1.8 | 2 | Sentinel-1 |
| 69 | 25 September 2018 | Port Said | 0.3 | 2 | Sentinel-1 |
| 70 | 18 November 2018 | Port Said | 3.42 | 3 | Sentinel-1 |
| 71 | 19 November 2018 | Port Said | 18.01 | 1 | Sentinel-1 |
| 72 | 10 January 2019 | Port Said | 2.46 | 1 | Sentinel-1 |
| 73 | 6 February 2019 | Alexandria | 20.46 | 3 | Sentinel-1 |
| 74 | 23 February 2019 | Port Said | 27.42 | 4 | Sentinel-1 |
| 75 | 18 March 2019 | Port Said | 4.61 | 1 | Sentinel-1 |
| 76 | 4 April 2019 | Rasheed | 21.02 | 1 | Sentinel-1 |
| 77 | 5 April 2019 | Port Said | 4.68 | 1 | Sentinel-1 |
| 78 | 6 April 2019 | Port Said | 4.42 | 2 | Sentinel-1 |
| 79 | 11 April 2019 | Port Said | 2.16 | 1 | Sentinel-1 |
| 80 | 18 May 2019 | Port Said | 2.05 | 1 | Sentinel-1 |
| 81 | 21 May 2019 | Alexandria | 4.64 | 1 | Sentinel-1 |
| 82 | 22 May 2019 | Port Said | 1.31 | 3 | Sentinel-1 |
| 83 | 23 May 2019 | Port Said | 19.86 | 2 | Sentinel-1 |
| 84 | 16 June 2019 | Rasheed | 6.08 | 2 | Sentinel-1 |
| 85 | 4 July 2019 | Port Said | 1.06 | 2 | Sentinel-1 |
| 86 | 11 July 2019 | Port Said | 12.12 | 3 | Sentinel-1 |
| 87 | 23 July 2019 | Port Said | 7.06 | 4 | Sentinel-1 |
| 88 | 4 August 2019 | Port Said | 19.28 | 2 | Sentinel-1 |
| 89 | 10 August 2019 | Port Said | 9.24 | 2 | Sentinel-1 |
| 90 | 21 August 2019 | Port Said | 24.92 | 4 | Sentinel-1 |
| 91 | 22 August 2019 | Damietta | 31.35 | 5 | Sentinel-1 |
| 92 | 27 August 2019 | Port Said | 1.83 | 2 | Sentinel-1 |
| 93 | 27 August 2019 | Alexandria | 7.79 | 2 | Sentinel-1 |
| 94 | 28 August 2019 | Damietta | 51.64 | 2 | Sentinel-1 |
| 95 | 21 September 2019 | Port Said | 41.33 | 1 | Sentinel-1 |
| 96 | 1 October 2019 | Rasheed | 15.88 | 4 | Sentinel-1 |
| 97 | 2 October 2019 | Port Said | 12.02 | 5 | Sentinel-1 |
| 98 | 8 October 2019 | Damietta | 17.73 | 2 | Sentinel-1 |
| 99 | 20 October 2019 | Port Said | 1.79 | 3 | Sentinel-1 |
| 100 | 1 November 2019 | Rasheed | 16.93 | 2 | Sentinel-1 |
| 101 | 7 November 2019 | Port Said | 0.69 | 1 | Sentinel-1 |
| 102 | 24 March 2020 | Damietta | 29.55 | 1 | Sentinel-1 |
| 103 | 30 March 2020 | Baltim | 8.11 | 1 | Sentinel-1 |
| 104 | 22 April 2020 | Alexandria | 12.16 | 2 | Sentinel-1 |
| 105 | 24 April 2020 | Damietta | 7.11 | 4 | Sentinel-1 |
| 106 | 29 May 2020 | Baltim | 8.05 | 1 | Sentinel-1 |
| 107 | 12 June 2020 | Baltim | 8.05 | 1 | Sentinel-1 |
| 108 | 17 June 2020 | Damietta | 9.1 | 1 | Sentinel-1 |
| 109 | 5 July 2020 | Baltim | 7.62 | 1 | Sentinel-1 |
| 110 | 28 July 2020 | Damietta | 19.05 | 1 | Sentinel-1 |
| 111 | 20 August 2020 | Marsa Matruh | 12.68 | 1 | Sentinel-1 |
| 112 | 26 August 2020 | Rasheed | 10.24 | 1 | Sentinel-1 |
| 113 | 27 September 2020 | Damietta | 69.42 | 1 | Sentinel-1 |
| 114 | 21 October 2020 | Damietta | 65.33 | 1 | Sentinel-1 |
| 115 | 26 October 2020 | Port said | 21.16 | 3 | Sentinel-1 |
| 116 | 27 October 2020 | Port Said | 39.59 | 5 | Sentinel-1 |
| Sum | 116 Dates | 1964 km2 | 218 Spill |
References
- Abou El-Magd, I.; Zakzouk, M.; Abdulaziz, A.M.; Ali, E.M. The Potentiality of Operational Mapping of Oil Pollution in the Mediterranean Sea near the Entrance of the Suez Canal Using Sentinel-1 SAR Data. Remote Sens. 2020, 12, 1352. [Google Scholar] [CrossRef] [Green Version]
- Fingas, M.F.; Charles, J. The Basics of Oil Spill Cleanup; Lewis Publishers: Boca Raton, FL, USA, 2001; ISBN 1566705371 9781566705370 9781420032598 1420032593. [Google Scholar]
- Becker, R. MARPOL 73/78: An Overview in International Environmental Enforcement. Geo. Int’l Envtl. L. Rev. 1997, 10, 625. [Google Scholar]
- Fingas, M.; Brown, C.E. A Review of Oil Spill Remote Sensing. Sensors 2018, 18, 91. [Google Scholar] [CrossRef] [PubMed] [Green Version]
- Simonett, D.S. Remote Sensing with Imaging Radar: A Review; Springer: Berlin/Heidelberg, Germany, 1970; Volume 2. [Google Scholar]
- Egypt’s Oil Spill Preparedness | Egypt Oil & Gas-Part 9968. Available online: https://egyptoil-gas.com/features/egypts-oil-spill-preparedness/9968/ (accessed on 28 March 2020).
- Kostianoy, A.G.; Carpenter, A. History, sources and volumes of oil pollution in the Mediterranean Sea. In Oil Pollution in the Mediterranean Sea: Part I; Springer: Berlin/Heidelberg, Germany, 2018; pp. 9–31. [Google Scholar]
- REMPEC-MEDESS-4MS. Available online: https://medgismar.rempec.org/# (accessed on 18 April 2020).
- Satellite Based Services-CleanSeaNet Service-EMSA-European Maritime Safety Agency. Available online: http://www.emsa.europa.eu/csn-menu.html (accessed on 10 June 2021).
- Ferraro, G.; Bernardini, A.; David, M.; Meyer-Roux, S.; Muellenhoff, O.; Perkovic, M.; Tarchi, D.; Topouzelis, K. Towards an operational use of space imagery for oil pollution monitoring in the Mediterranean basin: A demonstration in the Adriatic Sea. Mar. Pollut. Bull. 2007, 54, 403–422. [Google Scholar] [CrossRef] [PubMed]
- Zodiatis, G.; Coppini, G.; Perivoliotis, L.; Lardner, R.; Alves, T.; Pinardi, N.; Liubartseva, S.; De Dominicis, M.; Bourma, E.; Sepp Neves, A.A. Numerical modeling of oil pollution in the eastern mediterranean sea. In Handbook of Environmental Chemistry; Springer: Berlin/Heidelberg, Germany, 2018; Volume 83, pp. 215–254. [Google Scholar]
- Mediterranean 2017 Quality Status Report. Available online: https://www.medqsr.org/background-ci19 (accessed on 30 December 2020).
- Nunziata, F.; Gambardella, A.; Migliaccio, M. On the Mueller scattering matrix for SAR sea oil slick observation. IEEE Geosci. Remote Sens. Lett. 2008, 5, 691–695. [Google Scholar] [CrossRef]
- Gens, R. Oceanographic applications of SAR remote sensing. GIScience Remote Sens. 2008, 45, 275–305. [Google Scholar] [CrossRef]
- Richards, J.A. Remote Sensing with Imaging Radar; Springer: Berlin/Heidelberg, Germany, 2009; Volume 1, ISBN 9783642020193. [Google Scholar]
- El-Magd, I.A.; El Kafrawy, S.; Farag, I. Detecting oil spill contamination using airborne hyperspectral data in the River Nile, Egypt. Open J. Mar. Sci. 2014, 4, 140. [Google Scholar] [CrossRef] [Green Version]
- Kostianoy, A.G.; Carpenter, A. Oil and gas exploration and production in the mediterranean sea. In Handbook of Environmental Chemistry; Springer: Berlin/Heidelberg, Germany, 2018; Volume 83, pp. 53–77. [Google Scholar]
- Kostianaia, E.A.; Kostianoy, A.; Lavrova, O.Y.; Soloviev, D.M. Oil pollution in the Northern Red Sea: A threat to the marine environment and tourism development. In Environmental Remote Sensing in Egypt; Springer: Berlin/Heidelberg, Germany, 2020; pp. 329–362. [Google Scholar]
Publisher’s Note: MDPI stays neutral with regard to jurisdictional claims in published maps and institutional affiliations. |
© 2021 by the authors. Licensee MDPI, Basel, Switzerland. This article is an open access article distributed under the terms and conditions of the Creative Commons Attribution (CC BY) license (https://creativecommons.org/licenses/by/4.0/).