Abstract
Conducting archaeological site surveys is time consuming, and large sites may have many small features or structures that are difficult to locate and interpret. Vegetation cover and dense forest hide small structures, like cairns, while at the same time forest cover can cause problems for LiDAR tools. In this case study, drone-based ALS (airborne laser scanning) was tested as an archaeological site survey tool. The research site was complex and located partially in a forested area, which made it possible to evaluate how forest cover affects data. The survey methods used were rather simple: visual analysis, point density calculations in the forest area, and, for site interpretation purposes, digitizing observations and viewshed analysis. Using straightforward methods allowed us to evaluate the minimum time and skills needed for this type of survey. Drone-based ALS provided good results and increased knowledge of the site and its structures. Estimates of the number of cairns interpreted as graves more than doubled as a result of the high-accuracy ALS data. Based on the results of this study, drone-based ALS could be a suitable high-accuracy survey method for large archaeological sites. However, forest cover affects the accuracy, and more research is needed.
1. Introduction
Based on several earlier studies, LiDAR has become an important tool for many archaeologists, especially when combined with archaeological surveys. Risbøl et al. summarized its technological developments and adaptations in the Fenno-Scandinavian area during the last 15 years [1]. They concluded that drone-based airborne laser scanning (ALS) will expand the field of research in the future. In Finland, research concerning the use of ALS in archaeology has been conducted in the last decade [2,3,4], and it has become an important tool for many archaeologists and authorities working with cultural heritage management sites. The National Land Survey of Finland (NLS) performed laser scanning in Finland in 2008–2019, and the point density of their data was, at minimum, 0.5 points per square metre [5]. Their laser scanning data sets, as well as digital elevation model (DEM) data sets derived from the ALS data, are openly available on the NLS website [6]. Viewing DEM data sets processed using the hillshade tool has been made very easy because such data sets are, for example, available at the Paikkatietoikkuna (national geoportal presenting spatial data and related services’ website) [7]. In 2020, NLS started collecting new data sets with a density of 5 points per square metre, but those data sets will only be available with a user license [8]. New data sets with higher point densities will improve accuracy from the archaeological point of view. The University of Oulu started a new project called ‘Automatic detection of archaeological sites in airborne laser scanning data, LIDARK’ at the beginning of February 2021 [9]. The first archaeological survey results with the new improved NLS data sets were introduced in February 2021 at a Finnish Heritage Agency event (arkeologisten kenttätöiden esittelypäivät) and then published [10]. ALS and drones are research topics of high interest and, hence, the inspiration for this case study.
The first aim of this study was to evaluate drone-based ALS as an archaeological site survey tool. Drones are often used for photography purposes in archaeological research, but no earlier research has inspected the potential of drone-based ALS as a site survey method in Finland. Conducting archaeological field surveys is often quite time consuming and, thus, it can be quite expensive, especially if the area is large and contains many different features, like small structures. The Finnish Heritage Agency has published quality guidelines for archaeological fieldwork in Finland [11], and those guidelines state that the purpose of the survey is to create an overview of cultural heritage in the area and provide information on the number, location, types, and extent of archaeological sites in the survey area. They also divide survey methods into a general survey, theme survey, and ‘high-accuracy survey’. A high-accuracy survey aims to define and extend the archaeological site or area as reliably as possible via mostly non-destructive techniques, such as geophysical or remote sensing methods. Only one previous study with drone-based ALS has been conducted in Finland, although the results have not yet been published [12]. However, the LiDAR data used in the present study have already been introduced in another article [1]. Drone-based ALS was tested, for example, in Norway in 2018 with promising results [13] and in Italy in 2021 [14]. However, more research is needed on drone-based ALS in archaeology.
The second aim of this study was to evaluate how different forest types and the density of vegetation affect the detection of archaeological sites. Some of the major challenges of using LiDAR in archaeology have been studied before, especially in forested areas. Problems with dense vegetation cover, small and insignificant cultural remains, and interpretation were noted already in 2006 [15] and 2007 [16]. Archaeological sites in forested areas were also discussed in a paper by Finnish archaeologists in 2012 [17], with the research finding that cairns especially are difficult to identify. Research conducted in 2018 revealed that using LiDAR as a survey tool at an Iron Age cairn site is quite problematic [18]. In that study, researchers compared two different laser scanning data sets to the excavation results and concluded that only approximately 5% of cairns in the dense, forested area could be recognized from the LiDAR data sets. Forest cover in Finland is very high, about 75% [19], and that poses one challenge for the use of LiDAR in archaeology in the future, even with data sets using improved point densities. At the same time, archaeological sites in a forested area are also at risk of being destroyed or damaged by forest usage, like felling or reforestation. Between the years 2010 and 2019, forest use accounted for most of the damage done to protected archaeological sites in Finland. In total, 72 sites were damaged during that period because of forestry operations [20].
The third aim of the present article was to study how drone-based ALS data sets can be used for interpreting archaeological sites. Detecting archaeological sites and their structures is, of course, very important. To protect cultural heritage we need to know the exact location of an archaeological site. The next question is, what constitutes an archaeological site? According to the Finnish Heritage Agency’s guidelines [11], every archaeological site needs a definition or a type. Sometimes interpretations can be very difficult to perform if, for example, the site’s date is uncertain or if the site is large or contains many different types of structures. It is also good to keep in mind that everyone sees and interprets landscapes differently, including digital data like ALS data used at archaeological sites [21]. In this case study, the site was very complex and there were many uncertainties, so we wanted to test the available ALS and other GIS data also for site interpretation purposes. In Finland, the current status of open access GIS materials is quite good, and all types of background maps, orthophotos, data sets about the environment, geological records, and historical maps are available.
2. Materials and Methods
2.1. Materials
The research site for the case study was Nuuttilanmäki 1–4 (called just Nuuttilanmäki in this paper). It is located in Hartola, in the Itä-Häme region of southern Finland (Figure 1). It was first discovered in 1997 by archaeologist Timo Sepänmaa [22]. In the first survey, four different areas were discovered: area 1 contains cairns, area 2 is a settlement site, area 3 has a cup-marked stone, and area 4 a cup-marked rock. At the time of discovery, archaeologists interpreted the site as a possible Stone Age settlement area since it contained some quartz flakes and other objects. Additionally, some Iron Age pottery was discovered, so the dating of the possible settlement area is uncertain. The next surveys at the site were done in 2003 by Hannu Poutiainen [23] and in 2004 by Timo Jussila and Hannu Poutiainen [24]. They estimated that the site contained 30–40 cairns with a diameter of between 3 and 10 m and a height of 20–100 cm. Burnt clay, iron slag, cremated bones, and an iron knife were found in the settlement area in the 2003 survey. In 2012, the Lahti City Museum conducted archival research on the historical sites in the region and pinpointed a possible new historical settlement site, Kalho, in the same area as Nuuttilanmäki [25]. The village of Kalho was first mentioned in the year 1405, and records show that in the year 1560 it contained 10 houses [26].
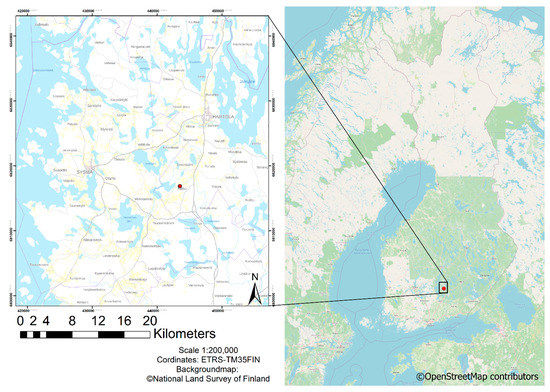
Figure 1.
Nuuttilanmäki site location in the lake area of southern Finland, in the municipality of Hartola.
A new archaeological site survey was conducted at the Nuuttilanmäki and Kalho sites and the areas near them in spring 2019. The survey aimed to establish whether the site might be suitable for the purposes of this case study and for drone-based ALS in general. The survey resulted in the conclusion that Nuuttilanmäki is a much larger and more complex archaeological site than previously known. More cairns were discovered in a forested area south of the field. In addition, Iron Age pottery and cremated bone pieces were discovered on the northern side of the river. Furthermore, a possible medieval village area was discovered. One new archaeological site (Peltola) was discovered closer to the lake. The site includes a cup-marked stone, cairns, and a settlement dating back to the historical period. The survey report included new interpretations of the site: The site includes a possible Iron Age settlement area and the cairns in the forested area seem to be different than those in the field areas. The cairns in the southern part of the forested area could be related to slash and burn agriculture, and they differ from the cairns in the field by size, shape, and structure (Figure 2 and Figure 3). The survey concluded that the Nuuttilanmäki site needs more research and that precise interpretations are difficult when just conducting visual inspections. As part of the 2019 field study, the exact coordinates of the 32 structures interpreted as cairns were measured with a GNSS surveyor (model Trimble R10) for the reference purpose of this study. The GNSS system could not be used in the forested area because of the density of the forest cover; thus, only a few cairn locations were measured inside the forest with a mobile phone GPS so that the protected area could be digitized. The survey report [27] can be found at the Finnish Heritage Agency’s website (Muinaisjäännösrekisteri). The results of the field survey and cairn locations are illustrated in Figure 4. Nuuttilanmäki was chosen for this case study because of its complexity and location. Cairns at the site are located partially in an open field and partially in two different forest types (a very dense, mature, spruce forest and a young, pine forest with some spruces covered with dense undergrowth), which are difficult types to study from an archaeological and ALS point of view.
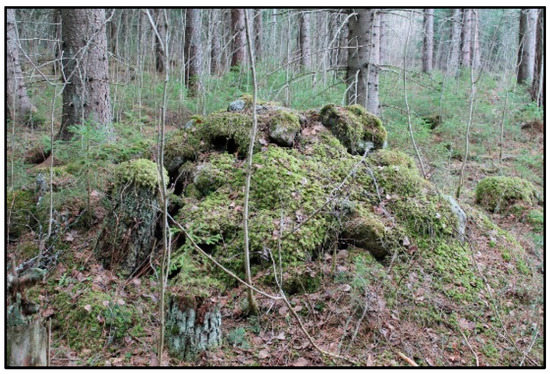
Figure 2.
(Low-quality version for peer review) Cairn type in the forested area that could be related to the type of agriculture.
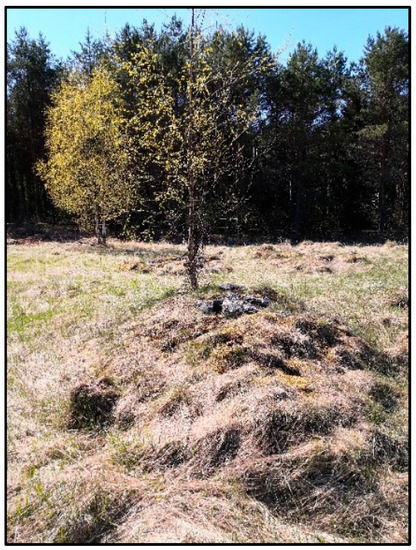
Figure 3.
Cairn type evident in the field area, interpreted as an Iron Age grave.
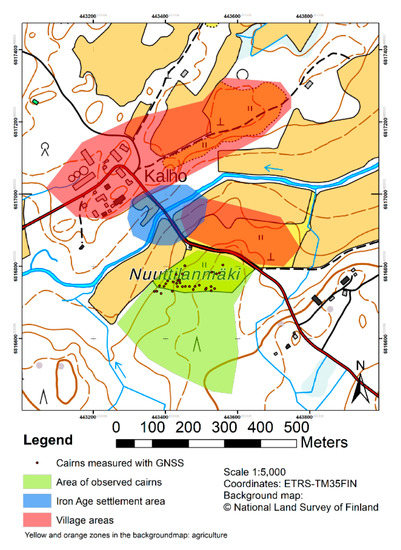
Figure 4.
The results of the 2019 site survey.
The commercial company Geotrim Oy conducted laser scanning at Nuuttilanmäki on 30 October 2019. A late-autumn day was chosen so that the leaf cover and vegetation level would be minimized. Weather conditions were good; but, unfortunately, the night before the temperature dropped below 0 °C. At the time of the survey, there was still frost cover everywhere, which affected the orthophoto quality of the scans. The survey was done with a GeoDrone X4L multicopter and YellowScan Surveyor LiDAR sensor (Figure 5): detailed product specifications can be found at Geotrim’s website [28]. The YellowScan Surveyor was chosen because of its high accuracy that made it suitable for this type of research. The YellowScan surveyor can produce point cloud data at even 100 points per square metre with an absolute accuracy of 5 cm. The first ALS flight was done at a flight altitude of 50 m and the second ALS flight was done at a flying altitude of 70 m. The gap between the flight lanes was 50 m. The third flight was done with a camera (Model: Sony RX1 RII): more information and product specifics can be found at, for example, Geotrim’s website [29]. The size of the study area was approximately 23 ha, and each flying tour took about 25 min. The flight plan and settings for the flight were done just before the start.
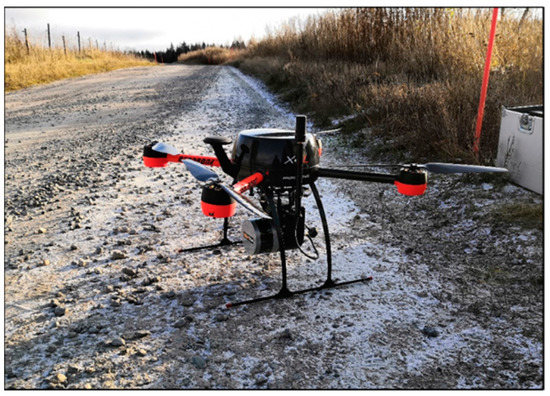
Figure 5.
(Low-quality version for peer review) GeoDrone X4L multicopter and YellowScan Surveyor LiDAR sensor.
After the field study, a Geotrim Oy engineer preprocessed the ALS data and produced the orthophoto from the images. Preprocessing the data was also fast, and readymade LAZ files were delivered and ready to use after three working days. Basic data processing and map production was done using the ArcMap 10.3.1 program. Data set number 1 (from 50 m above) contained 68,068,480 points, with 3,188,602 points classified as ground points and 22,264,284 as low vegetation points. Data set number 2 (from 70 m above) contained 60,394,154 points, with 2,901,152 points classified as ground points and 22,943,911 as low vegetation points. Details about the data set classifications are shown in Table 1.

Table 1.
Data set point classifications from ArcMap.
2.2. Methods
Visual data inspection was chosen as the high-accuracy site survey method. The study area (one archaeological site) was limited, so visual inspection and digitising the features with ArcMap program did not take much time. By keeping the data processing as simple as possible, we also evaluated the minimum time and effort needed for this process. After using the ArcMap program for point cloud comparison, ground points were then transformed into DEMs using a LAS data set to raster conversion tool. Data set one was converted to a 0.2 × 0.2 m DEM and then to a 0.1 × 0.1 m DEM with the same basic settings. There were only minor visual differences between the two raster data sets. Then, the same process was repeated for data set two. Using visual comparison, the 0.1 × 0.1 raster made from data set one was chosen for further data processing. Comparing the various data visualisation methods was beyond the scope of this study. LiDAR data visualisation methods for archaeology use have been discussed and compared in many papers previously [30]. The basic ArcMap hillshade tool yielded quite good results, but the best visual result was achieved with the Relief Visualization Toolbox 2.2.1 program [31] and with a tool measuring hillshade from multiple directions (number of directions 16 and sun elevation angle 35), which was then used in the ArcMap program.
Point density calculations were chosen as a simple method for evaluating forest and vegetation effect. Archaeological features like small structures are usually at ground level or very close to ground level; if the point density from the ground is very low, then the results can be unreliable from an archaeological standpoint. To assess the impact of different forests and vegetation on the point density, three different vegetation areas were identified from the orthophoto (Figure 6). The southern area (stand 1) was a very dense, mature, spruce forest and classified as forest with grass-herb vegetation type. The middle area (stand 2) was a young, pine forest with some spruces in the middle belonging to the grass-herb vegetation forest type. Information about forest resources and types were collected from the Karttaselain web page [32]. The northern area between the road and the forest (stand 3) was open grassland that had been used as pasture area, and it was defined as a threatened, seminatural grasslands and grazed woodlands habitat type. All three areas were digitized as polygons. Point densities were determined using the LAStools toolbox (rapidlasso GmbH, Gilching, Germany). First, laser points representing the ground were extracted from the point cloud using the lasground tool of the LAStools toolbox. The tool detects ground points using a slightly tuned version of Axelsson [33]. A digital terrain model (DTM) was then formed using the ground points. Next, the height above ground was calculated for each non-ground point by subtracting the corresponding DTM value from the height of the point. Points located within 1 metre of the ground were classified as low vegetation points. Point densities were calculated separately for the two forest stands and grassland areas, the two flying altitudes and two point classes, ground class and low vegetation class. Thus, 12 different point densities were acquired as a result. The point densities were calculated by simply determining the number of points within the stands and dividing the number of points by the area of the stand.
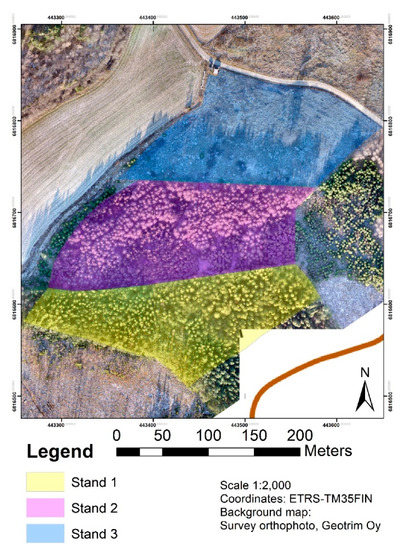
Figure 6.
Research area included three different vegetation types: stand 1 was an old spruce forest, stand 2 was a young pine forest with spruce, and stand 3 was an open pasture area with high-grown grass.
Visual data evaluation continued with site interpretations. Cairns that were spotted using the hillshade map and orthophotos were divided into two classes based on their shape, size, and appearance: as possible graves or cairns that are related to agriculture. Cairns that were interpreted as graves were digitized as polygons. Other interesting structures, such as pits in the old village area, were also digitized. The largest cairn proved interesting, and that location was chosen for testing visibility using the viewshed analyzing tool in ArcMap. The largest cairn differed from others due to its size and location, which gave the impression that it is meant to be very visible, unlike those other smaller cairns. During the field survey, the current vegetation made it difficult to evaluate how visible the largest cairn could be from the river or lake direction.Visibility analysis is a quite common GIS method in archaeology and it can yield interesting results; however, such results are often also subject to the interpretations made by various researchers [34].
3. Results
The results for the high-accuracy survey were good. Together, LiDAR and orthophotos provided much new, detailed information about the Nuuttilanmäki site. Based on the visualisations (coloured DEM and multihillshade) and orthophotos, we identified a total of 150 possible cairns and digitized each of them into point format (Figure 7 and Figure 8). Some of the cairns were more difficult to interpret than others. Especially cairns that could be related to agriculture in the possible old cultivation area were more difficult to spot, as they did not have such a clear form or shape as possible graves. We made the same observation about cairn types in the field. Possible graves include mounds carefully constructed with stones of the same size and consisting of low and symmetric structures, whereas cairns in the deep, forested area consisted of all sizes of stones that had been thrown into a single mound.
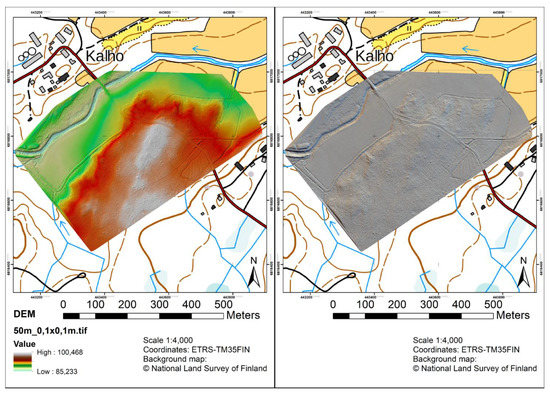
Figure 7.
A DEM as a shaded relief, made from data set 1 (50 m above), cell size 0.1 × 0.1 m (left), and the hillshade from multiple directions produced with the Relief Visualization Toolbox 2.2.1 program (right).
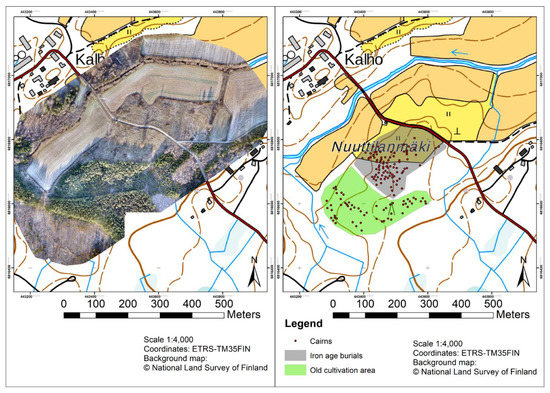
Figure 8.
The orthophoto of the area and interpretations about the locations of the cairns in Iron Age burial and old cultivation areas.
Forest cover and dense vegetation clearly affected the ground point density, as was expected. Especially one area with dense, young spruce was problematic. The stand 2 area was also very difficult to access and interpret in the field survey because of dense undergrowth (Figure 9). One of the most problematic areas with young spruces can be spotted already from the point clouds (Figure 10), and those same spots proved problematic when using the hillshade tool. Point density calculations showed the significant effect of those spots on different forested areas (Figure 11 and Figure 12). In the open field area, the point density from the ground was very good, with data set 1 having an average of 69.22 points per square metre and data set 2 an average of 52.15 points per square metre. In the forested areas, the ground point density dropped on average to 12–18 points per square metre.
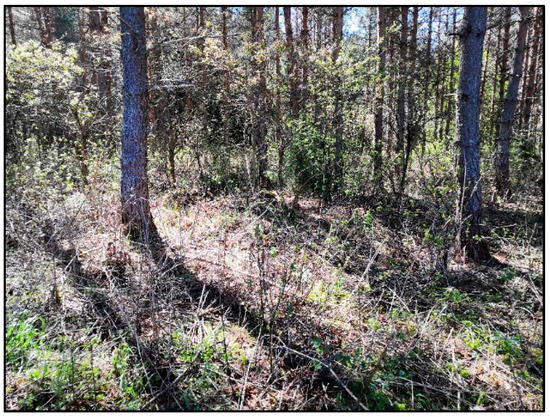
Figure 9.
Cairns in the dense undergrowth area were very difficult to spot.
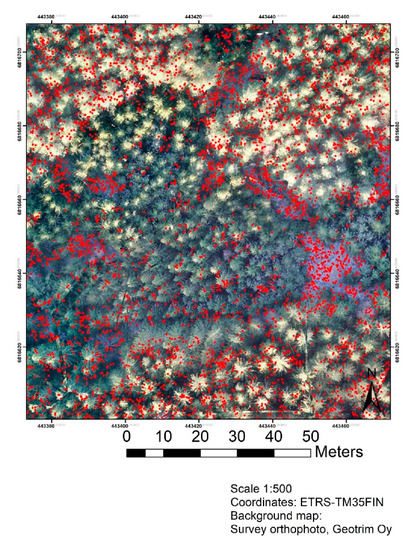
Figure 10.
Ground points from data set 1 and orthophoto; problematic areas with young spruces can be spotted in the middle of the photo.
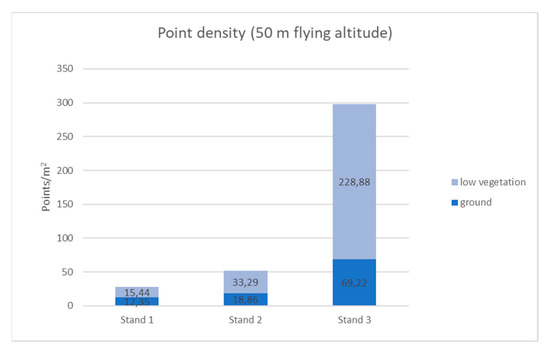
Figure 11.
Point density from data set 1 (50 m flying altitude).
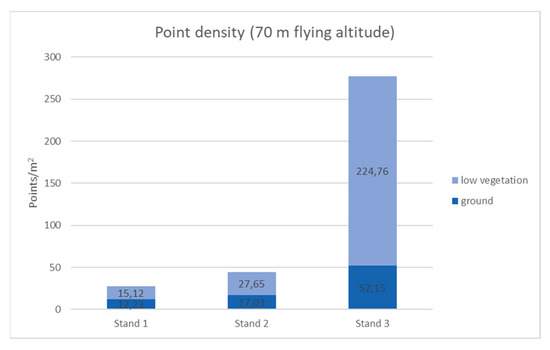
Figure 12.
Point density from data set 2 (70-m flying altitude).
We visually interpreted the sites based on the data and then confirmed them afterwards through a field survey. The number of cairns interpreted as graves more than doubled: The original estimation was 30–40 graves, while the new estimation, based on the visualisations and orthophoto, was 89 graves. On the north side of the road, we spotted and digitized 10 clear pits. On the eastern side of the pits, we discovered an interesting oval-shaped, low hillock or mound, which could be the foundation of a larger building. From the current road toward the hillock was a flattened area, which was also interesting and could be the traces of an earlier road or path (Figure 13). A new, one-day field survey was conducted in May 2020 just to confirm the findings in the LiDAR data. The new site survey confirmed our interpretations of the cairn types and their locations. Comparison with the previously GNSS-measured cairn locations revealed some differences in interpretations (Figure 14), but without full excavations it was impossible to confirm any of them. Making interpretations in the field was also difficult, so cairn locations measured with GNSS may also contain mistakes. Orthophoto was also used to separate possible cairns from the stones in the open field area. There were some big stones that looked very similar to cairns in the hillshade data. The grave cairns seemed to be located in a cluster, and it was possible to calculate their area based on the polygons. Altogether, the cairns covered an area of 1199 square metres, with the mean value being 13.5 square metres and the largest cairn alone covering approximately 45.5 square metres. The viewshed analysis from the location of the largest cairn showed that it may have been visible from the lake direction if the vegetation level had been low (Figure 15). LiDAR data from the drone survey only covered a very limited area, so the viewshed analysis utilized a 2 × 2 m DEM made by the National Land Survey of Finland. The lake direction is important because one significant west-to-east water route traversed the lake and one route to the village was via the lake and the smaller Kalho river.
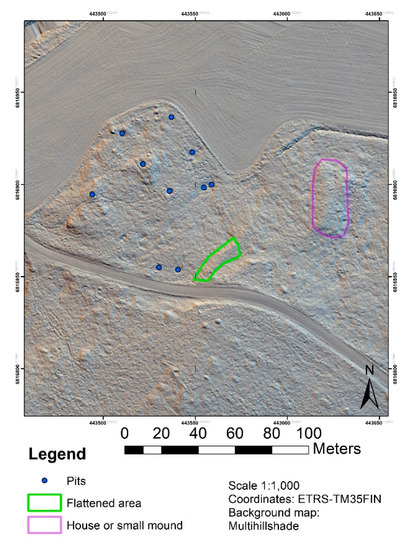
Figure 13.
Pits, flattened area and mound were digitized on the north side of the road.
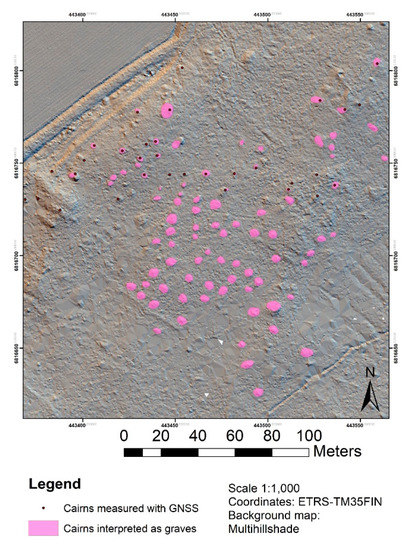
Figure 14.
89 cairns were interpreted as graves on the south side of the road. Only cairns that were located in the field area could be measured with GNSS while most of the possible cairns were located under the forest cover.
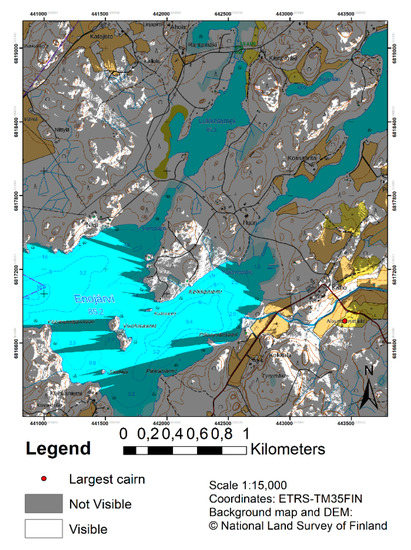
Figure 15.
Viewshed analysis from the location of the largest cairn.
4. Discussion
One important factor limiting the use of drone-based ALS in archaeology is the high price of the instruments and the skills required to use them and perform data processing. In this case study, we accomplished the survey work by cooperating with a commercial company that conducted the ALS with a drone and preprocessed the data. It is possible to buy a professional survey service, like a drone-based ALS survey. In Finland, most archaeological surveys are done by commercial archaeology companies [35,36]. For this reason, it is also good to evaluate the survey process from that perspective. If the desire is to utilize drone-based ALS as an archaeological site survey method, it must be fast and simple to perform. Not all archaeologists are familiar with GIS, and so it may be difficult to utilize such a method for commercial archaeology if it requires special skills or expensive tools. This research project was conducted as simply as possible, and the same process could be followed in commercial archaeology. If the study area is large and contains many small details that need to be spotted and documented, drone-based ALS could be a suitable method for such cases. For smaller archaeological sites, the benefits of saving time would be smaller and other methods like TLS or MLS should be also considered [37]. The LiDAR data processing part of this study was fast. The process introduced in the previous sections takes only about 1–2 working days, depending on how familiar the researcher is with the GIS programs. In the future, drone-based ALS data from the archaeological sites could be also visualized in 3D and, for example, in virtual reality. With virtual reality, places can be experienced from an egocentric and stereoscopic perspective [38]. The first-person view could provide understanding about the archaeological site landscapes. Today Finnish Heritage Agency only accepts small-size PDF files as survey reports and the reports can be, for example, found via Kulttuuriympäristön palveluikkuna web page [39]. Digital archaeological data, like 3D models, are not collected, stored, or archived in Finland yet. Improving archaeological survey methods and producing high-accuracy data are not enough if the data are not archived for the future in any way. Solutions for digital archiving should be found soon [40]. Besides simple maps in a PDF report, other options to visualize archaeological spatial data could be considered as well.
As a non-destructive site survey method, drone-based ALS produced new, useful information about the research site and the research complemented previous knowledge about the Nuuttilanmäki site. One of the biggest advantages of this method is that it saves time. Fieldwork with the drone was done smoothly and quickly. In the field, the three separate flying rounds and several settings between them took only about two working hours. Surveying the same large and complex area with other methods, like using a total station or TLS, would have taken many days or even weeks to obtain the same high-accuracy survey data and coordinates for all the structures. Using drone-based ALS before the actual field survey in the future would help researchers focus on and identify those features or structures inside the larger area that need more visual inspection. Visual evaluation and interpretation of the data was fast, and digitising those observations was simple. Soon, other high-accuracy LiDAR data sets will be available for Finland [41]. Since this data set is actually the first such high-accuracy data set, in the future it could serve as reference material for many other corresponding research projects. The data are also suitable for more complex analyses that could yield even more detailed information about the site or its structures. In the future, when more data are available, automatic detection of the cairns or pits could provide a different point of view. Overall, the research area is challenging and the site is complex, so more research is needed for more reliable interpretations. Estimations of the number of possible graves more than doubled, but it is possible that plenty more cairns remain hidden in the ground. Previous studies have shown that Iron Age graves are difficult to locate precisely because structures can also be more underground [18].
Forest and dense vegetation affect the drone-based ALS results from an archaeological standpoint. This should be considered when using other LiDAR data sets in archaeological surveys. To evaluate data accuracy, orthophotos could provide useful information about the vegetation cover. The National Land Survey of Finland provides orthophotos for all of Finland in open access format, and the data sets can be downloaded together with the DEMs [42]. Detailed information about the forest types can be found via the karttaselain application. For cultural heritage protection, we need more information and monitoring especially of those sites that are in forested areas and possibly at risk of damage because of forestry operations [20]. First, we should evaluate just what sites are most critical or require more research. The role of remote sensing in that respect can be significant. Remote sensing data and especially high-accuracy data, like in the present case study, could also help researchers monitor the sites after such forestry operations as thinning, clearcutting, or afforestation. The Nuuttilanmäki research site is partly located in the forest, and research could continue in the future after forestry operations with a new, high-accuracy survey, thereby making it possible to evaluate the effects of such operations. However, to best protect the archaeological sites from forestry operations we need to first know what kind of information is required from the forest management perspective. For example, how accurate should knowledge be about the structures at the site in order to protect them? The Finnish Heritage Agency has published some guidelines about forestry and cultural heritage [43]. Forestry operations are allowed in archaeological sites but damaging or covering the site is prohibited. For instance, driving over the site structures, like cairns, is prohibited. Furthermore, protected areas should be marked on the field beforehand. Detailed information about the locations of the archaeological site structures is not always easy to find or access, though. Harvester drivers or loggers particularly could benefit from high-accuracy archaeological data in their work plan and maps. In the future, cooperation between archaeologists and forestry professionals could benefit both sectors. One study about that type of cooperation was done between 2011 and 2013 with good results [44].
From a site interpretation perspective, high-accuracy data expanded previous knowledge on the hidden cairns at Nuuttilanmäki. Large areas like in this study are difficult to observe and outline. Mapping all the structures helps us understand the complexity of the site. In this case study, one problem encountered when making interpretations was a lack of reference material or suitable reference sites. As said before, no high-accuracy remote sensing data sets exist from sites that could be suitable for comparison. Current open access DEM data sets are not accurate enough, and these types of Iron Age cemetery sites are not visible enough in the data. Overall, archaeological research has been quite limited and minimal in this part of Finland. One site, Kotisalo, which is located in the same municipality, about 14 km to the northeast, could be a similar Iron Age cemetery with cup-marked stones and a possible settlement site. One of the cairns at the Kotisalo site was excavated in 2003, with the cairn type proving quite mysterious and not allowing for any clear conclusions after the excavations [45]. It could be interesting to compare cairns at different possible Iron Age cemeteries based on their spatiality, sizes, shapes, and other features in the future. This high-accuracy survey supported the hypothesis that some of the cairns are Iron Age graves. Those cairns appear in a cluster form and cover such a large area that no space is available for cultivation in that part of the research site. In that area, the soil is very rocky and not suitable for basic agriculture. During the field survey, a metal detector was used in a non-destructive manner, and it gave off metal signals for those possible graves. It is also possible that those cairns are not graves at all and the purpose is not yet known; without excavations, it is difficult to confirm their purpose. Pits in the village area were easy to spot during the survey, but the oval-shaped mound was not so visible when the field survey was done. The largest cairn was perhaps built to be seen, as the top of it is one big stone that can be seen from a distance. The location of that cairn, on the edge of the slope, is optimal if it is meant to be visible and not hidden. If the site area had been free of vegetation or forest cover, then the village could have been spotted from the lake and the water route.
5. Conclusions
Drone-based ALS provided much detailed information about a difficult, complex, and large-scale archaeological site. Compared to previous field studies done at the site, knowledge about the structures and site type increased a great deal after just a minimum amount of time and effort using this method. Drone-based ALS was also a fast way to collect very precise survey data. Collecting the same data with other methods, such as total station or TLS, would take much longer at a research site like the one assessed in this case study. Drone-based ALS is a useful method for conducting an archaeological site survey if the research site is large and contains many small structures, like in this case study. However, vegetation and its effect on the data quality from an archaeological standpoint should be considered in future research. As shown in this study, a very dense forest can diminish data quality. From a cultural heritage and management point of view, drone-based ALS could provide quite useful information and support archaeological interpretations.
Author Contributions
Conceptualization, J.R. and M.H.; methodology, J.R., E.H., and M.H.; validation, J.R.; formal analysis, J.R. and E.H.; investigation, J.R. and E.H.; resources, J.R. and M.H.; data curation, J.R.; writing—original draft preparation, J.R.; writing—review and editing, J.R., E.H., and M.H.; visualization, J.R. and E.H.; supervision, M.H.; project administration, J.R. and M.H.; funding acquisition, J.R. and M.H. All authors have read and agreed to the published version of the manuscript.
Funding
This research was funded by Kone Foundation, grant number 202006680. Open access funding provided by University of Helsinki.
Institutional Review Board Statement
Not applicable.
Informed Consent Statement
Not applicable.
Data Availability Statement
Third-party data restrictions apply to the availability of the data. Data were obtained from Geotrim Oy and are available from the author [Johanna Roiha] with the permission of Geotrim Oy. The results will be reported to the Finnish Heritage Agency following their guidelines.
Acknowledgments
A huge thank you to Geotrim Oy, Sakari Mäenpää, and Tom Steffansson, for all the ALS data and support. Thank you also to the cooperating Aarne Carlsson. Thanks to archaeologists Timo Sepänmaa, Tanja Ranta, Inka Sallinen, and Jenna Savolainen for assisting with the field surveys.
Conflicts of Interest
The authors declare no conflict of interest. The funders had no role in the design of the study; in the collection, analyses, or interpretation of data; in the writing of the manuscript; or in the decision to publish the results.
References
- Risbøl, O.; Langhammer, D.; Schlosser Mauritsen, E.; Seitsonen, O. Employment, Utilization, and Development of Airborne Laser Scanning in Fenno-Scandinavian Archaeology—A Review. Remote Sens. 2020, 12, 1411. [Google Scholar] [CrossRef]
- Kurri, I.; Haimila, M. Metsää syvemmältä—Lidar-aineisto arkeologian apuvälineenä. Muinaistutkija 2010, 1, 63–68. [Google Scholar]
- Seitsonen, O. Juoksuhautoja ja asumuspainanteita: Kokemuksia lidarlaserkeilausaineiston käytöstä kenttäarkeologiassa. Muinaistutkija 2011, 2, 36–44. [Google Scholar]
- Seitsonen, O. LiDAR-kaukokartoitusaineistojen visualisointi ja analysointi: Paikkatietoalgoritmeja arkeologeille. Muinaistutkija 2013, 1, 2–16. [Google Scholar]
- National Land Survey of Finland. Laser Scanning Data 2008–2019. Available online: https://www.maanmittauslaitos.fi/en/maps-and-spatial-data/expert-users/product-descriptions/laser-scanning-data (accessed on 2 March 2021).
- National Land Survey of Finland. File Service for Open Data. Available online: https://tiedostopalvelu.maanmittauslaitos.fi/tp/kartta?lang=en (accessed on 2 March 2021).
- Paikkatietoikkuna. Available online: https://kartta.paikkatietoikkuna.fi/?lang=en (accessed on 5 March 2021).
- National Land Survey of Finland. Laser Scanning. Available online: https://www.maanmittauslaitos.fi/laserkeilausaineistot (accessed on 2 March 2021).
- University of Oulu. Automatic Detection of Archaeological Sites in Airborne Laser Scanning Data. Available online: https://www.oulu.fi/archaeology/node/208932 (accessed on 2 March 2021).
- Seitsonen, O.; Ikäheimo, J. Detecting Archaeological Features with Airborne Laser Scanning in the Alpine tundra of Sápmi, Northern Finland. Remote Sens. 2021, 13, 1599. [Google Scholar] [CrossRef]
- Museovirasto. Arkeologisten Kenttätöiden Laatuohjeet 2020. Available online: https://www.museovirasto.fi/uploads/Kulttuuriymparisto/arkeologisten_kenttatoiden_laatuohje_2020.pdf (accessed on 5 March 2021).
- Lavento, M.; (email to Roiha, Helsinki, Finland). Personal communication, 2021.
- Risbøl, O.; Gustavsen, L. LiDAR from drones employed for mapping archaeology—Potential, benefits and challenges. Archaeol. Prospect. 2018, 1–10. [Google Scholar] [CrossRef]
- Balsi, M.; Esposito, S.; Fallavollita, P.; Melis, M.G.; Milanese, M. Preliminary Archeological Site Survey by UAV-Borne Lidar: A Case Study. Remote Sens. 2021, 13, 332. [Google Scholar] [CrossRef]
- Risbøl, O. Airborne laser scanning of cultural remains in forests: Some preliminary results from a Norwegian project. Br. Archaeol. Rev. Int. Ser. 2016, 1568, 107–112. [Google Scholar]
- Crow, P.; Benham, S.; Devereux, B.J.; Amable, G.S. Woodland vegetation and its implications for archaeological survey using LiDAR. For. Int. J. For. Res. 2007, 80, 241–252. [Google Scholar] [CrossRef]
- Koivisto, S.; Laulumaa, V. 2012: Pistepilvessä—Metsien arkeologiset kohteet LiDAR ilmalaserkeilausaineistossa. Arkeologipäivät 2012, 51–67. Available online: http://www.sarks.fi/ap/ap2012/ap2012_10_koivisto_laulumaa.pdf (accessed on 19 May 2021).
- Lehto, H. Using Aerial Laser Scanning as a Survey Tool at the Pre-Roman Iron Age Cairn-Site of Ellinniitty, Rauma. Master’s Thesis, University of Helsinki, Helsinki, Finland, 20 March 2018. [Google Scholar]
- Ministry of Agriculture and Forestry of Finland. Forest Resources in Finland. Available online: https://mmm.fi/en/forests/forestry/forest-resources (accessed on 5 March 2021).
- Maaranen, P. Muinaismuistojen vaurioituminen 2010-luvulla. Ihmistoiminnan vaikutus Muinaismuistolailla Rauhoitettujen Kiinteiden Muinaisjäännösten Säilymiseen Suomen Alueella. 2020. Museovirasto. Final Report. Available online: https://asiat.museovirasto.fi/case/MV/43/05.01.03/2020 (accessed on 19 May 2021).
- Halliday, S. I Walked, I Saw, I Surveyed, but what did I see?...and what did I survey? In Interpreting Archaeological Topography Airborne Laser Scanning, 3D Data and Ground Observation, 1st ed.; Opitz, R., Cowley, D., Eds.; Oxbow Books: Oxford, UK, 2013; pp. 63–75. [Google Scholar]
- Sepänmaa, T. Hartola, Nuuttilanmäki 1-4. Röykkiöalueen, Asuinpaikan, Kuppikiven ja kallion Tarkastus 1997. Survey Report. Available online: https://www.kyppi.fi/palveluikkuna/raportti/read/asp/r_raportti_det.aspx?RAPORTTI_ID=124001 (accessed on 19 May 2021).
- Poutiainen, H. Hartola, Arkeologinen Täydennysinventointi 2003, Lahden Kaupunginmuseo, Päijät-Hämeen Maakuntamuseo. Survey Report. Available online: https://www.kyppi.fi/palveluikkuna/raportti/read/asp/r_raportti_det.aspx?RAPORTTI_ID=125498 (accessed on 19 May 2021).
- Jussila, T.; Poutiainen, H. Hartola, Etelä-Hartolan ranta-ja Yleiskaava-alueen Muinaisjäännösinventointi 2004. Mikroliitti Oy. Survey Report. Available online: https://www.kyppi.fi/palveluikkuna/raportti/read/asp/r_raportti_det.aspx?RAPORTTI_ID=126109 (accessed on 19 May 2021).
- Tikkala, E.; Taipale, P.; Sorvali, E. Päijät-Hämeen Maakuntakaava, Historiallisen ajan Muinaisjäännösten Inventointi 2012. Lahden Kaupunginmuseo. Survey Report. Available online: https://www.kyppi.fi/palveluikkuna/mjhanke/read/asp/r_hanke_det.aspx?HANKE_ID=10673 (accessed on 19 May 2021).
- Juvelius, E. Sysmän Pitäjän Historia, Ensimmäinen osa Aika n. Vuoteen 1700; Etelä-Suomen sanomain kirjapaino O.Y.: Lahti, Finland, 1924; pp. 62–78. [Google Scholar]
- Roiha, J. Tutkimusraportti, Nuuttilanmäki 1–6, Kalho ja Peltola 1-3 arkeologinen Tarkkuusinventointi 04-05.05.2019. Survey Report. Available online: https://www.academia.edu/39406370/INVENTOINTIRAPORTTI_HARTOLA_NUUTTILANM%C3%84KI_1_6_KALHO_JA_PELTOLA_1_3 (accessed on 19 May 2021).
- Geotrim Oy, Geodrone X4L and Yellowscan. Available online: https://geotrim.fi/tuotteet/uas/geodrone/; https://geotrim.fi/tuotteet/uas/yellowscan/ (accessed on 17 March 2021).
- Geotrim Oy, Kamerasensorit. Available online: https://geotrim.fi/tuotteet/uas/kamerat/ (accessed on 17 March 2021).
- Štular, B.; Kokalj, Ž.; Oštir, K.; Nuninger, L. Visualization of lidar-derived relief models for detection of archaeological features. J. Archaeol. Sci. 2012, 39, 3354–3360. [Google Scholar] [CrossRef]
- Zakšek, K.; Oštir, K.; Kokalj, Ž. Sky-View Factor as a Relief Visualization Technique. Remote Sens. 2011, 3, 398–415. [Google Scholar] [CrossRef]
- Karttaselain, Metsävaratieto, Koekäyttö. Available online: https://www.karttaselain.fi/metsavara (accessed on 8 April 2021).
- Axelsson, P. DEM Generation from Laser Scanner Data using Adaptive TIN Models. Int. Arch. Photogramm. Remote Sens. 2000, 33, 110–117. [Google Scholar]
- Gupta, N.; Devillers, R. Geographic visualization in archaeology. J. Archaeol. Method Theory 2016, 24, 1–34. [Google Scholar] [CrossRef]
- Museovirasto, Arkeologisten Kenttätöiden Tilaaminen. Available online: https://www.museovirasto.fi/fi/kulttuuriymparisto/arkeologinen-kulttuuriperinto/arkeologisen-kulttuuriperinnon-tutkimus/arkeologisten-kenttatoiden-tilaaminen (accessed on 12 May 2021).
- Kalmistopiiri, Mikroliitti Oy:n Arkeologisia Tutkimuksia Vuodelta 2020. Available online: https://kalmistopiiri.fi/2021/05/10/mikroliitti-oyn-arkeologisia-tutkimuksia-vuodelta-2020/ (accessed on 12 May 2021).
- Aalto Yliopisto, Kun Kulttuurikohde Tuhoutuu, 3D-Digiarkisto Auttaa Jälleenrakentamisessa. Available online: https://www.aalto.fi/fi/uutiset/kun-kulttuurikohde-tuhoutuu-3d-digiarkisto-auttaa-jalleenrakentamisessa (accessed on 12 May 2021).
- Keil, J.; Edler, D.; Schmitt, T.; Dickmann, F. Creating Immersive Virtual Environments Based on Open Geospatial Data and Game Engines. KN J. Cartogr. Geogr. Inf. 2021, 71, 53–65. [Google Scholar] [CrossRef]
- Kulttuuriympäristön Palveluikkuna. Available online: https://www.kyppi.fi/palveluikkuna/portti/read/asp/default.aspx (accessed on 13 May 2021).
- Roiha, J. Digitaaliset Aineistot arkeologisissa Kenttätutkimuksissa—Nykytila ja Kehittämistarpeet. 2020. Museovirasto. Available online: https://www.academia.edu/43933177/Digitaaliset_aineistot_arkeologisissa_kentt%C3%A4tutkimuksissa_nykytila_ja_kehitt%C3%A4mistarpeet (accessed on 19 May 2021).
- Maanmittauslaitos, Laserkeilausaineisto 5p. Available online: https://www.maanmittauslaitos.fi/kartat-ja-paikkatieto/asiantuntevalle-kayttajalle/tuotekuvaukset/laser-scanning-data-5-p (accessed on 12 May 2021).
- Maanmittauslaitos, Maanmittauslaitoksen Ilmakuvat. Available online: https://www.maanmittauslaitos.fi/kartat-ja-paikkatieto/asiantuntevalle-kayttajalle/tuotekuvaukset/ilmakuva (accessed on 12 May 2021).
- Museovirasto, Metsänkäyttö ja Arkeologiset Kohteet. Available online: https://www.museovirasto.fi/fi/kulttuuriymparisto/arkeologinen-kulttuuriperinto/arkeologisen-kulttuuriperinnon-suojelu/metsankaytto-ja-arkeologiset-kohteet (accessed on 14 April 2021).
- Koivisto, S.; Laulumaa, V. Skogens kulturarv i Kvarkenregionen 2, Loppuraportti. 2014. Museovirasto. Final Report. Available online: https://www.kyppi.fi/palveluikkuna/raportti/read/asp/r_raportti_det.aspx?RAPORTTI_ID=141245 (accessed on 19 May 2021).
- Lahelma, A. Hartola Kotisalo, röykkiö n:o 13, Arkeologinen Kaivaus rautakautisella Muinaisjäännösalueella 2003. Lahden Kaupunginmuseo, Päijät-Hämeen Maakuntamuseo. Excavation Report. Available online: https://www.kyppi.fi/palveluikkuna/raportti/read/asp/r_raportti_det.aspx?RAPORTTI_ID=125545 (accessed on 19 May 2021).
Publisher’s Note: MDPI stays neutral with regard to jurisdictional claims in published maps and institutional affiliations. |
© 2021 by the authors. Licensee MDPI, Basel, Switzerland. This article is an open access article distributed under the terms and conditions of the Creative Commons Attribution (CC BY) license (https://creativecommons.org/licenses/by/4.0/).