Abstract
Interpretations of the tectonic setting of the Nile Delta of Egypt and its offshore extension are challenged by the thick sedimentary cover that conceals the underlying structures and by the paucity of deep seismic data and boreholes. A crustal thickness model, constrained by available seismic and geological data, was constructed for the Nile Delta by inversion of satellite gravity data (GOCO06s), and a two-dimensional (2D) forward density model was generated along the Delta’s entire length. Modelling results reveal the following: (1) the Nile Delta is formed of two distinctive crustal units: the Southern Delta Block (SDB) and the Northern Delta Basin (NDB) separated by a hinge zone, a feature widely reported from passive margin settings; (2) the SDB is characterized by an east–west-trending low-gravity (~−40 mGal) anomaly indicative of continental crust characteristics (depth to Moho (DTM): 36–38 km); (3) the NDB and its offshore extension are characterized by high gravity anomalies (hinge zone: ~10 mGal; Delta shore line: >40 mGal; south Herodotus Basin: ~140 mGal) that are here attributed to crustal thinning and stretching and decrease in DTM, which is ~35 km at the hinge zone, 30–32 km at the shoreline, and 22–20 km south of the Herodotus Basin; and (4) an apparent continuation of the east-northeast–west-southwest transitional crust of the Nile Delta towards the north-northeast–south-southwest-trending Levant margin in the east. These observations together with the reported extensional tectonics along the hinge zone, NDB and its offshore, the low to moderate seismic activity, and the absence of volcanic eruptions in the Nile Delta are all consistent with the NDB being a non-volcanic passive margin transition zone between the North African continental crust (SDB) and the Mediterranean oceanic crust (Herodotus Basin), with the NDB representing a westward extension of the Levant margin extensional transition zone.
Keywords:
Nile Delta; satellite gravity; seismic; inversion; Moho depth; hinge zone; passive margin; transition zone 1. Introduction
The Nile Delta of Egypt in northeast Africa is one of the world’s largest river delta systems (onshore area: 22,000 km2, coastline length: 225 km, [1,2]). Its width increases progressively northward, forming an extensive offshore deep sea fan (area: 100,000 km2; width: 600 km; length: 300 km; [3,4]) in the Mediterranean Sea that extends between the Herodotus abyssal plain and the Mediterranean Ridge (west) and the Levant basin and Eratosthenes Seamount (east; Figure 1). The Nile fan comprises the largest sedimentary clastic accumulation within the eastern Mediterranean Sea [4,5] and exhibits a classical morphology for a mud-rich turbidite system [6]. The Delta is fed by sediments carried by the Nile River, the longest and one of the oldest river systems; it has apparently been active for 30 million years or more [7,8,9,10]. The size and longevity of the Nile drainage system introduced extensive sedimentary fluxes to the Delta throughout its prolonged history.
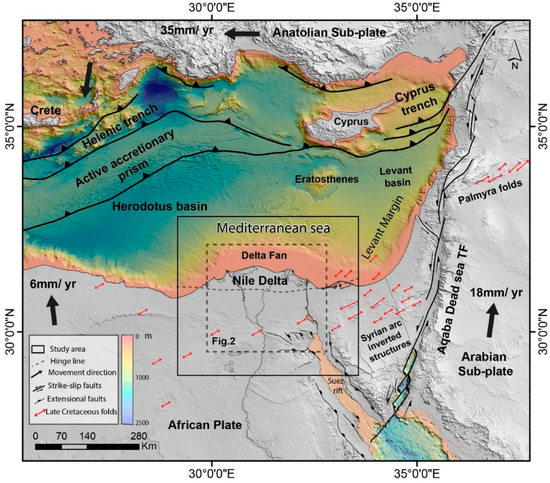
Figure 1.
Shaded relief topography and bathymetry for the study area (Nile Delta and its offshore fan) and the surrounding major structural elements. The African Plate is moving towards the Eurasian Plate with a rate of ∼6 mm/year, the Arabian Plate towards the Anatolian sub-plate at a rate of ∼18 mm/year, and the Anatolian sub-plate is being squeezed and is rapidly (∼35 mm/year) rotating counterclockwise toward the Hellenic trench. The Late Cretaceous folds are modified after [31] and the hinge line after [7]. The solid box outlines the area for which the gravity data were modeled.
The Nile Delta is located at least in part on a passive continental margin [11,12,13,14,15]. The passive margins are areas associated with continental rifting and subsequent formation of ocean basin [13,16], in our case the formation of the Neo-Tethys ocean [12,17,18,19,20,21]. These margins are often associated with large river systems (e.g. Amazon, Mississippi, Congo, Ganges, and Nile) [22,23] and fluvial processes, while their continental shelves are dominated by deltaic depositions. Passive margins consist of three segments: continental, transitional or thinned continental crust, and oceanic crust [13,24]. Transform margins have variable width ranging from tens to several hundred kilometers, and are characterized by a ridge, steep uniform slope, large sedimentary deposits, and abrupt transition between continental and oceanic crust [25,26]. The demarcation of continental-oceanic crustal boundaries or transition zones within the continental passive margins is important in plate boundary reconstructions and for hydrocarbon exploration programs because of the potential of these areas to host major oil and gas reservoirs [22,27,28,29,30].
The Nile Delta at its present-day location is proximal to three main active tectonic plate boundaries: (1) the collision/subduction boundary between the African and Eurasian Plates, (2) the Gulf of Suez–Red Sea rift margin, and (3) the Gulf of Aqaba–Dead Sea transform fault (DST) boundary (Figure 1). The African Plate is subducting (∼6 mm/year; Figure 1) under the Anatolian Plate along the Cyprus and Hellenic Arcs [32,33]. The Arabian Plate is moving northward (∼18 mm/year, Figure 1) with respect to the eastern part of the Anatolian sub-plate along the left-lateral DST boundary [32,33]. The Anatolian Plate is escaping (∼35 mm/year, Figure 1) and rotating counterclockwise toward the Hellenic trench [32,33] as it is being pushed westwards by the Arabian Plate and impeded from moving northwards by the Eurasian Plate [34].
Efforts to investigate the tectonic setting, the continental-ocean boundary, and the crustal nature of the eastern Mediterranean Basin in general and the Nile Delta in particular are hindered by a number of factors. These include: (1) the proximity of the Delta to active tectonic boundaries, which introduces complexities related to interactions between the adjoining plates (Figure 1) [35,36,37]; (2) the thick sedimentary cover of the Nile Delta and fan (4–6 km in northern Delta, >9 km along coastal parts, and up to 14 km towards Levant Basin) [7,38,39,40,41,42,43,44] that conceals the underlying structures and magnetic anomalies indicative of oceanic crust, if present [37,45]; (3) thick evaporitic layers that could hinder the acquisition of seismic reflection from the underlying layers [37,46]; (4) uncertainties in the extracted crustal and mantle velocities introduced by the limited number of seismic stations [47,48]; (5) non-uniqueness of gravity interpretations given the lack of adequate seismic constraints [49,50]; and (6) limited rock outcrops and deep wells for proper characterization of subsurface lithologies. Given these limitations, integration of deep geophysical methods (seismic, gravity, and magnetic) could be effective in estimating depth to basement and depth to the Mohorovicic discontinuity (DTM) (Moho) [51,52,53], which ultimately could assist in identifying crustal thicknesses and types, including the transition zones.
Previous geophysical (e.g., seismic and gravity) investigations over the Nile Delta, with very few exceptions (e.g., [54]), targeted the offshore or onshore sections of the Delta. The former studies investigated the crustal structures of the eastern Mediterranean Basin including the offshore sections of the Delta [47,50,55,56,57,58,59,60], and the latter included the onshore Delta sections as part of the crustal thickness evaluation for the entire country of Egypt [49,61,62,63]. In this study, we develop a crustal model for the entire Delta (onshore and offshore) with emphasis on identifying the continental-oceanic boundary, a topic that received less attention in previous geophysical investigations.
The variations in crustal thickness over Egypt was estimated at large from seismic reflection and refraction applications and from receiver functions. These studies were based mainly on seismic signals from natural and controlled sources using travel time inversions for local earthquakes [62], seismic profiles [61,64], deep seismic sounding [65], or modeling P-wave receiver functions [63]. Findings from these investigations were compromised by the limited and sparse distribution of seismic stations in Egypt and North Africa [47,48,49]. Terrestrial and/or airborne gravity data constrained by seismic interpretations (2D gravity modelling and 2D power spectrum analysis) were also used to estimate crustal thicknesses along selected profiles in Egypt [66,67]. The few that were conducted over the Delta were restricted to its onshore sections (e.g., [68]).
Satellite gravity data cover the onshore and offshore sections of the Delta with the same observational parameters and have a better spatial coverage than the terrestrial gravity and seismic datasets. In addition, the geodetic satellite improves the medium-long wavelength of the gravity spectrum components, providing more information about deep Earth structures [69,70]. Thus, satellite gravity data can potentially yield reliable interpretations of crustal thicknesses and structures for the entire Delta, especially when combined with other geophysical data sources (e.g., seismic data). Such studies were conducted on a regional scale over Egypt [49,54]; the earlier study [54] covered the onshore and offshore sections of the Delta, whereas the later one [49] covered the onshore section only. However, deciphering the Delta’s structures, tectonic setting, and crustal thickness variations within the transition zone was not the prime target of these studies. Moreover, some of these earlier interpretations (e.g., [49,68]) are inconsistent with subsurface data and modern analogue settings.
In the present study, we generate a detailed crustal thickness model for the Nile Delta (onshore and offshore) by integrating both satellite gravity (from the GOCO06s model) and seismic data using the modified Bott’s equation [71,72]. The inversion is followed by two-dimensional (2D) forward gravity modeling constrained by seismic data and available geologic information (e.g., sediment thickness and densities). We integrate observations from the crustal model, and geophysical and geologic data (e.g., distribution of earthquakes, faults, and sediment thickness) to accomplish the following: (1) map DTM, extract crustal thicknesses, and identify lithospheric variations throughout the Delta (onshore and offshore); (2) provide a comprehensive crustal model for the Nile Delta that accounts for the geophysical and geological constraints; (3) understand and identify the structural setting of the Nile Delta in relation to the African passive margin in northeast Africa and the Levant Basin in the southeastern Mediterranean Sea; and (4) demarcate the transition zone within the North African passive margin and highlight its economic value.
2. Nile Delta Geological and Tectonic Settings
The Nile Delta has been the subject of numerous geological studies, yet to date its age and evolution continue to be subjects of debate, in part because of the thick sedimentary sequences that cover the underlying Delta structures (e.g., [7,11,73,74,75,76,77,78,79,80,81,82,83]). The proposed ages for the Delta are as old as the Upper Cretaceous and as young as the Pleistocene-Recent [84,85] (Figure 2); the Delta’s Neogene history is better known than its presumed Cretaceous, Paleocene, and Eocene history given that deposits laid down during these periods are deep and have not been reached, or are absent, in many of the Nile Delta wells [11].
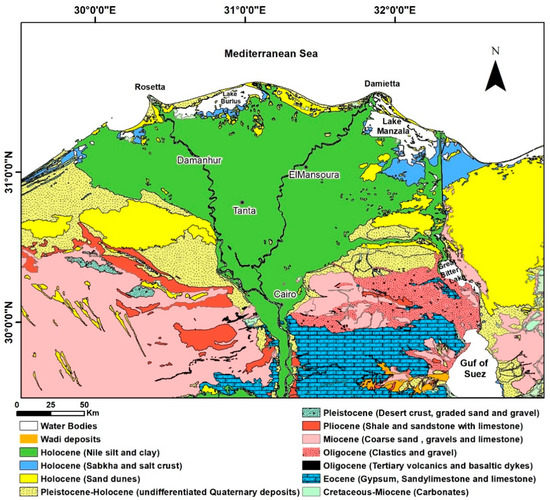
Figure 2.
Geologic map of the Nile River Delta, modified after [86]. It covers the dashed box in Figure 1.
The Nile Delta can be subdivided into two provinces: the Southern Delta Block (SDB), with a 1–1.5 km thick section of post-Eocene clastics, and the Northern Delta Basin (NDB), with a 4–6 km thick section of Neogene sediments separated by an east–west-trending “hinge zone” or “hinge line’’ (Figure 1) [4,7,18,38,41,87,88]. Seismic and well data along the hinge zone reveal a complex of normal listiric, slumping, and growth faults [7,11,39,41,88,89] along which extensive displacements (up to 4–6 km; [7,38,39,42]) and progressive northward thickening of sediments (up to 9 km) along the coastal sections of the Nile Delta and its fan [40,89] have occurred.
Rock units within the Nile Delta can be lumped into two main geological units (Figure 2): (1) Quaternary deposits, including Pleistocene (desert crusts, graded sand, and gravels) and Holocene sediments (sand dunes, coastal deposits, sabkha deposits, calcareous, and silty clay sediments); and (2) Paleogene and Neogene deposits, including Pliocene, Miocene, Oligocene, and Eocene sediments.
The Nile Delta was affected by the opening and closure of the Neo-Tethyan Ocean around the margins of African–Arabian Plates. The extensional tectonics associated with the opening of Neo-Tethys in the Eastern Mediterranean region, in the late Triassic–early Jurassic [90,91] led to the development of a major rift basin and a passive continental margin in northeast Africa, including northern Egypt [12]. The regional extension was followed by a compressional phase related to the movement of Eurasia to the southeast relative to Africa [92] that led to the closure of the Neo-Tethys basin and the formation of the Syrian Arc Fold system. The belt is a complex of asymmetric doubly plunging anticlines with reverse or thrust faults along their southern flanks [31,93,94,95,96,97]. The belt consists of three segments. The first, in Egypt, extends from the Western Desert towards Sinai, passing south of the Delta, and continues into the Eastern Desert [31]. The second is the Levant segment in the Levant Basin. The third, the Palmyra segment, is in Syria [98,99] (Figure 1).
3. Data and Methods
3.1. Data
Four datasets were used in this research: (1) gravity data derived from the European Space Agency’s (ESA’s) Gravity Field and Steady-State Ocean Circulation Explorer (GOCE) mission’s GOCO06s model [100]; (2) high-resolution topographic heights of the study area derived from ETOPO-1 model [101]; (3) sedimentary thickness extracted from Crust1.0 model [102]; and (4) DTM from seismic profiles [59,103] and receiver function [63] to constrain gravity inversion.
3.1.1. Gravity Data (GOCO06s Model)
We used the latest release (GOCO06s [100] of the Gravity Observation Combination (GOCO)) data generated by GOCE. The mission was launched in 2009 to measure the gravity field and geoid with high spatial resolution and precision [104]. GOCO06s is a satellite-only, global gravity field model with a spectral resolution complete to the spherical harmonic degree 300. GOCO06s (spatial resolution: 66 km; grid interval: 0.1°; interpolation method: kriging) synthesizes the gravity disturbance signal at an altitude of 50 km above the ellipsoid, a representation that provides a high signal to noise ratio [105]. GOCO06s was selected for its high accuracy and spatial resolution and its ability to capture the long wavelength anomalies related to deep-seated crustal and upper mantle structures. The model is available via the International Center for Global Earth Models (ICGEM) Service (retrieved from http:icgem.gfz-potsdam.de/ICGEM/) (accessed on 10 March 2020) [106,107]. The synthesized gravity disturbance signal was corrected (free air, topography, bathymetry, and density) to extract a Bouguer anomaly map. The latter (Bouguer anomaly map) was inverted to extract initial estimates for the Moho depths, then used to construct a 2D density model for the Delta along a north–south-trending profile.
3.1.2. Topographic Data
A high-resolution (1 arc-minute global relief model) topographic and bathymetric dataset (ETOPO-1; [101]) was used to correct the gravity disturbance for topographic effects. The correction was applied to gridded gravity data and extended beyond the study area by as much as 5° to mitigate border effect-related errors [108,109]. The model is provided by the National Geophysical Data Center (NGDC) and available via the National Oceanic and Atmospheric Administration (NOAA) (retrieved from http://dx.doi.org/10.7289/V5C8276M) (accessed on 10 March 2020).
3.1.3. Sediments Thickness Data
A global crustal model (CRUST1.0; grid cell size: 1° × 1°; [102]) was updated with global sediment thicknesses (Exxon Tectonic Map of the World; [110]) and used to correct the gravitational field for sediment thickness. The sediment layers are divided into three categories: a top layer (top 2 km of sediments), a middle layer (5 km beneath top sediment layer), and a lower layer (sediments below the top and middle sediment layers) [102]. The accuracy of the CRUST1.0 model in northern Africa is compromised by the lack of active seismic sources and receiver function points [102]. The sediment thickness model is available at (retrieved from https://igppweb.ucsd.edu/~gabi/crust1.html) (accessed on 20 March 2020).
3.1.4. Seismic Constraints
Because seismic stations in Egypt are sparse and irregularly distributed [49], available seismic refraction/wide-angle reflection profiles acquired by British Petroleum Company “BP” and P-wave receiver functions were used to extract DTM in 24 locations [38,59,63,111]. Seismic-inferred Moho values were used as prior information to determine the optimized parameters (the reference depth, Moho depth, and density contrast) by searching for the maximum correlation coefficient between the gravity-inverted Moho results and Moho depth from seismic estimates. Moreover, they were used to validate the final gravity inversion results and to constrain the 2D forward gravity modelling across the Nile Delta.
3.2. Methodology
3.2.1. Moho Depth Inversion from Gravity
Two major tasks were conducted. The first was calculating the Moho depth, which involved reduction of gravity data and inversion of corrected gravity anomalies. The second was conducting 2D modelling with IGMAS+ to estimate the thickness of the sedimentary cover and the distribution of crustal layers within it, identifying the approximate location of the transition and hinge zones, and refining the extracted depths to the Moho.
- Data Reduction
Using the closed-form solution [112], the scalar gravity of the ellipsoidal reference Earth (normal Earth) was removed from the raw gravity data (absolute gravity values) to produce the gravity disturbance. The following steps were applied to correct the gravity disturbance data for elevation, terrain, density, and sediments. First, the topographic and bathymetric effects were removed using an ETOPO-1 global topography model (resolution: 1 arc-min; [101]) and applying open-source software (Tesseroids [113]). Sediment thickness data and topographic data were re-gridded to a spatial resolution of 0.1° to make them comparable with gravity data. Then, the study area was discretized into tesseroids (spherical prisms), and their gravitational fields were calculated using the Gauss–Legendre quadrature [114]. A 5° padding was applied in all directions, extending the topography/bathymetry model outside of the study area to avoid edge effects even for the far-field topography [108]. Given the general lack of detailed information on the topographic density distribution across North Africa, the topographic gravity correction was computed assuming a homogenous density distribution. Density values typically used for onshore (2670 kg/m3; [115,116]) and offshore (1030 kg/m3; [115]) settings were adopted in this study. These density values were also used in earlier investigations over the Nile Delta and its surroundings [49,54,68].
Three sediment layers of CRUST1.0 [102], with varying densities and density contrast with Earth’s crust, were used to calculate the individual and overall contributions of the three layers and to produce a Bouguer anomaly corrected for sediments. The contributions of other crustal sources and mantle sources were considered to be negligible, leaving the Moho relief as the only viable source for the anomalies on the corrected Bouguer gravity data [71]. The corrected gravity data together with the seismic constraints were used as input in the inversion process.
- Gravity Inversion for Moho Depth
Several methods have been developed over the years to solve the gravity inverse problem for delineating depths of interfaces separating two media such as basement relief (sediments–crust interface) and Moho relief (crust–mantle interface) [72,117,118,119,120,121,122]. Inversion of gravity data to Moho depth (the desired interface from the inversion process through this study) is non-unique in the sense that the observed gravity anomalies can be explained by a variety of density contrasts between crust and upper mantle and variations in DTM and in flexural rigidity (resistance of bending of the lithosphere) values as well. Thus, constraining the gravity inversion with measured and/or extracted Moho depths retrieved from seismic data could potentially help minimize the ambiguities in the gravity inversion solutions.
The inversion of a Bouguer satellite anomaly map extracted from satellite gravity data (GOCO06; spatial resolution: up to 66 km) corrected for free-air, topography, bathymetry, and density was carried out using the open-source Fatiando Python code package (retrieved from https://www.fatiando.org/) (accessed on 15 April 2020) [123]. The regularized, non-linear gravity inversion process [71] (Equation (1)) was implemented by enhancing the highly efficient Bott’s method [72] by (1) applying tesseroids instead of the rectangular prisms to account for the Earth’s curvature [113] and (2) introducing a Tikhonov regularization parameter (μ) [124] to the ill-posed gravity inversion to stabilize and smooth the computed solutions of DTM by a method of hold-out cross-validation [125].
where Ak is a Jacobian matrix, R is a L×M finite-difference matrix representing L-first order differences between the depths of adjacent tesseroids, μ is a regularization matrix, pk is the M-dimensional parameter vector with the output dataset described as M-Moho geometry, go (xi) is the (stripping) gravity disturbance defined as input dataset, is the density contrast between the crust and upper mantle, and is the computed (stripping) gravity disturbance at a point calculated from the Moho depth model, with indicating a Moho reference.
The inversion results of the corrected Bouguer gravity signals were controlled by three hyper-parameters: (1) a regularization parameter (μ) (Equation (2)), which controls the smoothness of the model and provides regularized DTM solutions; (2) the reference depth (normal Earth Moho depth: Zref), around which the Moho interface undulates; and (3) the density contrast Δρ between the crust and the upper mantle. The optimal value of μ is independent of the values of Zref and Δρ [71].
where, Ʈ(p) is the goal function that is minimized by applying Tikhonov regularization and the Gauss–Newton method, ∅(p) is the cost function for smoothness regularization, μ is the regularization parameter that controls the balance between fitting the observed data and obeying the smoothness constraint imposed by the regularizing function θ(p).
The reference model is defined by estimating the optimal values for Zref and Δρ. The reference model parameters are not estimated during the inversion, but they influence the inversion solution. Determining both hyper-parameters of the reference model cannot be achieved from the gravity data alone, but they require information that is independent of gravity data, such as knowledge of the DTM at certain locations from sources other than gravity, such as seismic data [71].
The seismic data from receiver functions and deep refraction experiments [38,59,63,111] were used to develop the reference model (Zref and Δρ) based on a number of iterations through cross-validation with the known value of μ. Since the mean depth of the Moho and its density contrast are poorly constrained for Egypt [49], we set a wide range for both parameters; the depths to Moho were varied from 20 to 40 km using increments (steps) of 2.5 km, and the density contrast values were varied from 250 to 550 kg/m3 in increments of 25 kg/m3.
In the selection of the reference model (Zref and Δρ), the initial inversion results from gravity iteration were evaluated against Moho depths from available seismic data [38,59,63,111] (24 locations), and the model with the least mean square error (MSE) value was selected as a reference model (reference Moho depth and reference density contrast between crust and upper mantle). Because the 24 points were widely dispersed, interpolations were deemed not useful, and the differences in DTM from gravity and seismic data were calculated over each of the 24 points only. The final gravity iteration was run to extract Moho undulations around a reference Moho while holding the extracted reference density contrast fixed. Finally, the Moho depth undulations were compared and validated against the Moho depths from seismic data, and the differences and their standard deviation were computed, besides the residual gravity of the inversion process and its standard deviation.
3.2.2. 2D Modeling with IGMAS+
A 2D north–south-trending forward gravity model was conducted along AAʹ using the interactive software Interactive Gravity and Magnetic Analyzing System (retrieved from IGMAS+; www.gravity.uni.kiel.de/igmas and https://igmas.git-pages.gfz-potsdam.de/igmas-pages/documentation/) (accessed on 20 July 2020)
IGMAS+ allows users to calculate the gravity anomalies corresponding to a pre-defined density model and interactively compare the calculated/modeled fields to the observed anomalies through slicing into a number of 2D oriented sections. One of the advantages of this software is the use of triangulated polyhedrons and/or triangulated grids in the construction of models to enable realistic representation of geological structures [126,127]. The model included three layers (sediments, crust, and upper mantle) and its borders were extended to avoid edge effects. Forward modelling was achieved by trial and error (depths and densities of layers) to achieve the best fit between observed and calculated Bouguer gravity anomalies. The model was constrained by: (1) calculated Moho depth from gravity inversion within the range of uncertainties, (2) density values for sediments, crust, and upper mantle extracted from the P-wave seismic velocities [61,64,128,129], (3) estimated Moho depths over the study area derived from deep seismic profiles and receiver functions [59,103], (4) thickness of sedimentary units from drilled wells and seismic data [38,41,42,73,89] and from the CRUST1.0 model [102], and (5) the location of the Nile Delta hinge zone from earlier crustal models and well data [111]. Unfortunately, the available boreholes in the central and northern Delta were not deep enough (maximum borehole depth: up to 3–4 km at most; [73,89]) to reach the bottom of the thick sedimentary sequence that could be up to 7 km thick near the shoreline and exceeds 9 km offshore [40,41,42].
4. Findings and Results
4.1. Free-Air and Bouguer Anomalies Interpretation
The free-air gravity anomaly was successfully used to demark transitions from continental to oceanic crust in passive margin settings via the appearance of “edge effect” [24,130,131,132]. The extensive Nile fan sediments (Figure 3a) inhibited the identification of such a pattern (“edge effect” demarking the transitional crust). Thus, we explored the use of numerical modelling (inversion of Bouguer gravity to Moho depth followed by forward gravity modeling) to delineate the hinge zone and the transition zone from normal continental to oceanic crust. Inspection of the free-air gravity anomaly (source: GOCCO06s; grid size: 3° × 4°) over the Nile Delta reveals two major anomalies: (1) an east–west-trending negative (−ve) gravity anomaly (values: −10 to −40 mGal; 1 mGal = 10−5 m/s2) extending across the SDB, and (2) a positive (+ve) gravity anomaly (20 to 70 mGal) within the NDB that continues northwards with increasing intensity towards the offshore Nile Fan, forming an east–west-trending ellipsoid centered over an area some 100 km offshore of the Delta (Figure 3a). To a first order, the NDB and SDB extend to the north and south of latitude 31° N, respectively.
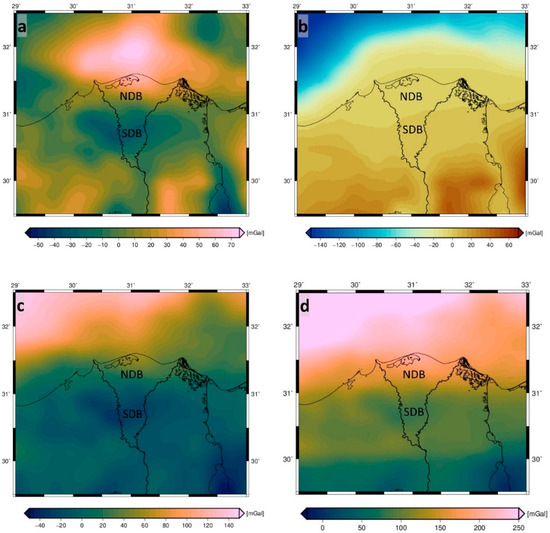
Figure 3.
Gravity anomaly maps (in mGals) for the Nile Delta and surroundings on 3° × 4° grids. (a) Free-air gravity anomaly map. (b) Topographic and bathymetric contributions. (c) Bouguer anomaly gravity map. (d) Sediment-free Bouguer anomaly map.
The topographic and bathymetric gravity corrections that were applied to the free-air gravity anomaly to calculate the Bouguer anomaly were found to be small (SDB: 0 to 5 mGal; NDB: 0 to −5 mGal; Figure 3b), given that the Nile Delta is a featureless plane; a general south-to-north gradual decrease in elevations is observed, 18 m near Cairo to ≤1 m near the coastline. The Bouguer gravity disturbances mainly reflect the effects of crustal density heterogeneities (sediments and crystalline crust), variations of the Moho boundary, and upper mantle density variations. Bouguer gravity anomaly maps remain one of the best geophysical tools for demarcating transitional zones within passive margin settings. They can provide evidence for lateral thickness variations associated with the thinning of continental crust within transition zones that separate continental from oceanic crust [24,130,131]. The Bouguer anomaly map (Figure 3c) shows a pronounced east–west-trending negative gravity anomaly (~−40 m Gal) across the Delta extending for some 50 to 100 km to its east and west with progressively decreasing amplitudes in the adjoining Eastern and Western deserts. The negative anomaly gives way to a positive gravity anomaly (~+10 mGal) in the NDB that progressively increases in magnitude towards the Delta’s shoreline (~≥+40 mGal), the offshore parts of the Nile Fan (~+40 to ~+140), and reaching towards the borders of the Herodotus Basin (~≥+140 mGal; Figure 3c). A sediment gravity correction (derived from the CRUST1.0 model) was then applied to the Bouguer gravity anomaly map to extract a sediment-free Bouguer anomaly map (Figure 3d) that displays the basement topography. The map shows patterns similar to those observed in the Bouguer anomaly map, yet different in magnitude, an observation that suggests that the observed east–west-trending anomaly is related to an anomalous feature in the crust or even in the deeper upper mantle.
4.2. Crustal Thickness Model and Moho Configuration
The optimum regularization parameter (μ) was attained at a value of 10−10, where the lowest MSE between 10−2 and 10−10 was obtained (Figure 4a). Using the calculated (μ) and the available seismological data (Figure 4c), the best reference model (lowest MSE between gravimetric and seismic solutions) was achieved at Zref = 32.5 km and Δρ = 400 kg m−3. The inversion residuals, the difference between the observed Bouguer and predicted data in mGal, are given in Figure 5a. The inversion residuals have a mean value of 0.85 mGal and a standard deviation of 5.29 mGal (Figure 5c). The differences between the Moho depths extracted from gravity and seismic data were found to be acceptable (standard deviation: ±5.58 km) (Figure 5b,d) indicating that the gravity-derived Moho (Figure 6) is in general agreement with that derived from the seismic and receiver function analysis. The final estimates for the DTM over the Nile Delta and its offshore are shown in Figure 6.
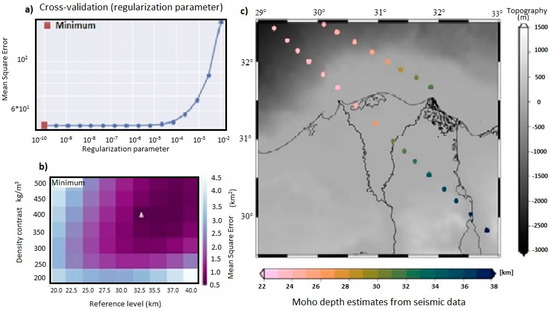
Figure 4.
Inversion results from GOCO06s gravity data. (a) Cross-validation curve used to determine the regularization parameter. The minimum MSE is found at μ = 10−10 (red rectangle). (b) Validation results used to determine the best fit reference model with minimum MSE (white triangle) between gravimetric and seismic solutions. The model yields solutions 32.5 km for reference DTM (Zref) and 400 kg m−3 for Moho density contrast between crust and upper mantle (∆ρ). (c) DTM (colored circles) plotted over a digital elevation map (DEM); the depths were extracted from seismic refraction and receiver functions and were used for the development of the reference model and validation of the gravity inversion.
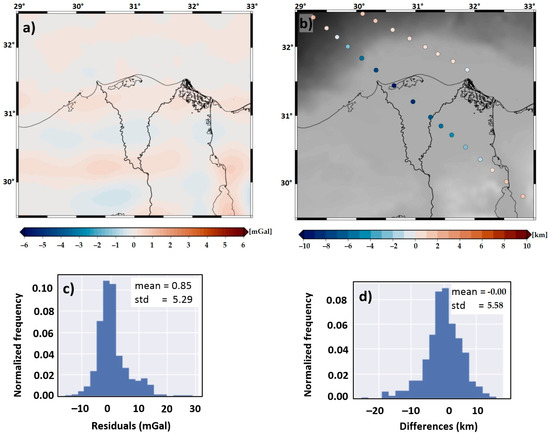
Figure 5.
(a) Residuals of gravity inversion (<±1 mGal) that represent the difference between the observed Bouguer and predicted data. (b) Differences between DTM from inverted Bouguer gravity and seismic refraction and receiver functions over 24 locations (marked by circles) plotted over a DEM. (c) Histogram for the inversion residual values, their mean (0.85 mGal), and standard deviation (5.29 mGal). (d) Histogram for the differences between the seismic and gravity DTM values, their mean (0.0), and standard deviation value (±5.58 km).
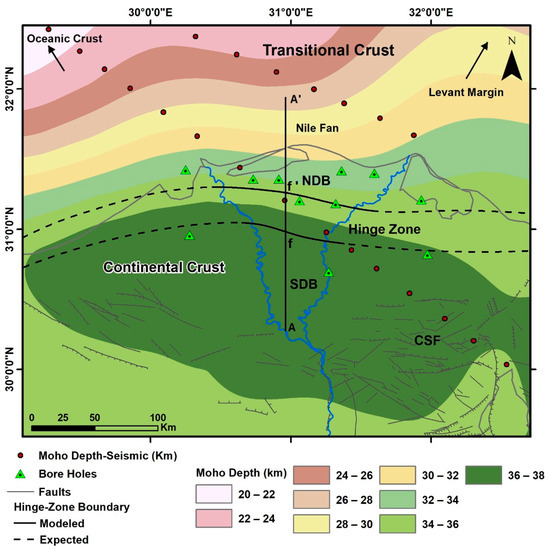
Figure 6.
Estimated DTM from regularized non-linear inversion of the Bouguer anomaly. The location of a north–south-trending profile (AAʹ) is also shown orthogonal to the main geological features along which a 2D forward gravity model was constructed and a geological cross section was sketched. The distribution of boreholes and seismic refraction and receiver function Moho depths used in the validation of the gravity inversion are also shown. The location of the hinge zone (ffʹ) was constrained by our forward gravity model output. A broad transition from thick to thin continental crust is observed along NDB and continues eastwards towards the Levant margin in contrast to the sharper transition along the western flank of the Nile Delta and fan.
The crustal thickness model (Figure 6) is consistent with the Nile Delta being formed of two distinctive crustal units (SDB and NDB) separated by a hinge zone, a setting that has been reported from many of the world’s passive margins [133]. Figure 3c and Figure 6 show that the SDB is characterized by a thick crust and is part of an east–west-trending low-gravity (~−40 mGal) anomalous body. The DTM in the SDB was found to vary from 36 to 38 km, and the crustal thickness ranged from 34 to 36 km after removal of the sedimentary cover (~2 km; [38,41,42]). The SDB is bounded by the Cairo–Suez normal fault arrays (CSF) from the south and by the hinge zone from the north. The NDB has a thick sedimentary cover (4–6 km), reaching 9 km or more at the shorelines [7,38,42,89], yet it is characterized by a high gravity anomaly (>~+40 mGal) (Figure 3c) that we here attribute to thinning and stretching of the crust and a shallow mantle. The DTM in NDB is ~35 km at the hinge zone, decreases northward reaching 30–32 km at the shoreline, and 20–22 km toward the southern borders of the Herodotus Basin (Figure 6). The free sediments crustal thickness is ~30 km at the hinge zone, 22–24 km at the shorelines, and gradually decreases to 10–12 km towards the southern borders of the Herodotus Basin (Figure 6). A model that is consistent with the above-mentioned spatial variations in the DTM and crustal thicknesses calls on the presence of continental crust proper in the SDB and transitional crust in the NDB and its offshore fan; the latter (NDB transitional crust) is sandwiched between the SDB continental crust and the oceanic crust of the Herodotus Basin [134,135,136]. Along the northern part of the Nile Delta and Nile Fan and their eastern flank, the model shows a broad transition from thick to thin continental crust, while the western flank of the Nile fan shows a sharper transition (Figure 6).
4.3. Forward Gravity Modeling
The 2D forward modelling was conducted (using the IGMAS+ software) along a north–south-trending, 185 km long profile (profile AAʹ; Figure 6), and the computed gravity signals were compared to the Bouguer gravity anomaly (corrected from GOCO06s data) in Figure 7. Five layers were considered, and their densities and depths were adjusted to achieve a satisfactory fit between the modeled and observed gravity signals. The DTM was constrained by the extracted depths obtained from the previous inversion process with a tolerance of up to 4 km, a value less than the uncertainty (up to ±5 km) in the estimated DTM values from the inversion. The use of the five layers was based on previously documented density values [61,64,128,129]. The optimum density values for the five layers (from top to bottom) were found to be 1030 kg/m3 for water, 2350 kg/m3 for sedimentary rocks, 2670 kg/m3 for upper crust, 2750 kg/m3 for middle crust, 2900 kg/m3 for lower crust, and 3300 kg/m3 for upper mantle. A standard deviation of 10–12 mGals was obtained between the observed and modeled gravity signals (Figure S1a,b in Supplementary Materials), a difference that is in part due to assigning a unified density value to each of the five layers.
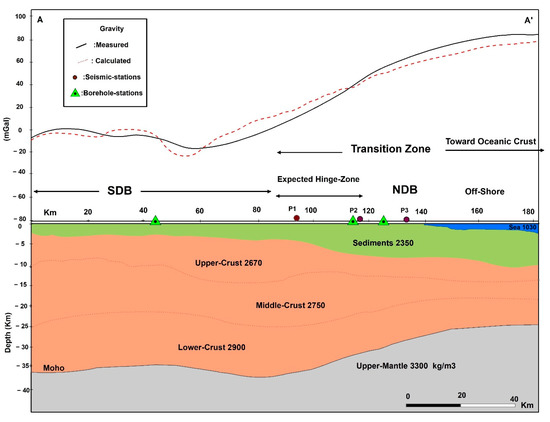
Figure 7.
A 2D north–south-trending density model for the Nile Delta along AA’ profile, where the upper part of the panel shows the Bouguer gravity along AA’ profile (Figure 5). Solid line indicates the observed gravity field and the dashed line indicates the modelled gravity. The lower panel shows the sedimentary, crustal, and upper mantle density structures. Red circles (P1, P2, and P3) mark the projected location of DTM inverted seismic points [59,111] along profile AA’, while green triangles mark the location of available wells [38,41]. The model shows a maximum misfit of 10–12 mGal between observed and modeled data. The model is here interpreted to indicate thick continental crust proper in the SDB and a transitional zone separating the continental from oceanic crust proper. The southern boundary of the transition zone is marked by the onset of sediment thickening and crustal necking and thinning associated with the hinge zone; the thinning continues seaward towards the oceanic crust proper in the Herodotus Basin.
Inspection of Figure 7 shows that the SDB is characterized by thin sedimentary cover (2–3 km), thick crust (DTM: 35–37 km), and low-gravity values (up to −20 mGal). The thick crust (33–35 km after removal of sedimentary cover) in the SDB is typical of continental crust thicknesses elsewhere [53,137]. Moving northward along the profile, some 90 km from the onset of the profile at point A and continuing northward for a distance of ~30 km, we observe a zone characterized by the following: (1) an abrupt and rapid necking and thinning in crustal thickness (from 31 to 27 km), (2) a progressive increase in sediment thickness (from 2–3 to 5–7 km), and (3) a progressive decrease in DTM (from 36 to 33 km). This zone is here interpreted as a hinge zone that separates the SDB from the NDB.
Moving northward from the hinge zone into the NDB towards the shoreline, the depth to basement increases reaching up to 8–9 km at the shoreline and the DTM is reduced (33 km north of hinge line and 29 km at the shoreline), resulting in crustal thinning (25 km north of hinge line to 21 km at the shoreline after removal of sedimentary thickness). Gravity values are high (30–60 mGal), where the negative gravity associated with the low-density sediments is apparently compensated by the crustal thinning and shallow mantle.
Moving northward from the shoreline (offshore) we observe patterns similar to those described for the NDB. We observe a progressive increase in sedimentary cover thickness reaching up to 10 km (at A’), decrease in crustal thickness (from 19 km north of shoreline to 16 km at Aʹ), decrease in DTM (from 29 km north of shoreline to 26 km at Aʹ), and high gravity values (60–90 mGal). The above-mentioned observations (over NDB and its offshore) do not support the presence of oceanic curst beneath the NDB or its offshore. Instead, these patterns are consistent with the presence of a transitional zone in a passive margin setting separating the proper continental crust in the SDB from the oceanic crust of the Mediterranean (towards the Herodotus Basin; [50,109]). The transitional zone appears to extend for more than 150 km, where its southern boundary is marked by the onset of sediment thickening and crustal necking associated with the hinge zone and thinning continues seaward towards the oceanic crust proper in the Herodotus Basin.
5. Discussion
5.1. Analysis of Results
We reported an east–west-trending, negative anomaly (~−40 mGal) in the SDB, and a high positive anomaly (>40 mGal) over the NDB and its offshore extension, as did earlier regional and local studies [49,67,68]. We proposed geologic settings that best account for the available geophysical and geological constraints in hand and which are different from those proposed by the earlier studies. The observed east–west-trending negative Bouguer anomaly (Figure 3c) was interpreted as representing a sedimentary basin or a semi-graben filled with thick sedimentary cover [49,68]. Such earlier interpretations are inconsistent with seismological studies and drilling data that indicate the presence of thin, post-Eocene sedimentary cover (~2 km) over the SDB [7,38,41]. Besides, the east–west-trending negative anomaly persisted even after the removal of the sedimentary cover effect (Figure 3d), an observation that suggests a crustal, or even deeper source. Thus, we are attributing the observed east–west-trending anomaly to crustal thickening and to an increase in depth to the upper mantle within the SDB (DTM: ~35–38 km; Figure 6, Figure 7 and Figure 8).
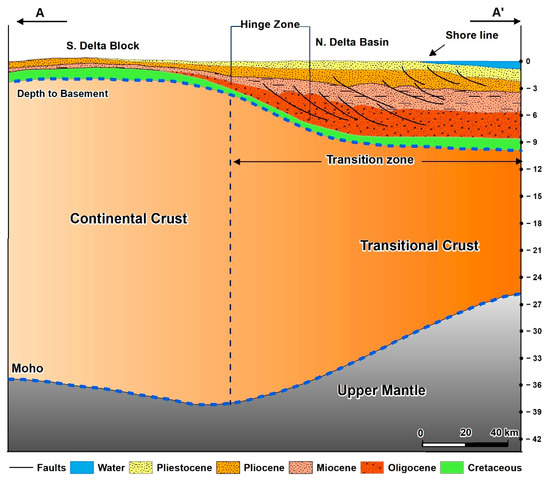
Figure 8.
Geological model along profile AA’ (Figure 6) for the Nile Delta, showing thick (36–38 km) continental crust and thin (~2–3 km) sedimentary cover in the SDB, extended continental crust (25–35 km) and thick sedimentary cover (up to 9 km at the shoreline) in the NDB, and a hinge zone within the latter (NDB) characterized by listiric normal faults that dip seaward. The NDB and its offshore component are here considered as representing a transition zone between the continental (SDB) and oceanic crust within the North African continental passive margin. The DTM was extracted from our geophysical models (inversion and forward modeling), the distribution and depths of sediments from our gravity forward modeling [102] and interpretations of seismic profiles [38,41,73,89], and the distribution of the listiric normal faults from interpretations of 2D seismic profiles [41].
Our crustal model indicates the thinning of the continental crust and a decrease in DTM northward to explain the observed high positive gravity anomaly over the NDB (Figure 6 and Figure 7); this interpretation is consistent with findings from earlier geophysical investigations (e.g., [48,49,54,68]), yet the mechanism of crustal thinning in NDB remains a subject of debate. The thinning was attributed to subduction of the African Plate under the Eurasian Plate (e.g., [49,62,68]), or related to rifting of the Neo-Tethyan Ocean in a passive margin setting in the late Triassic–early Jurassic [11,54,67,89,111,137,138].
Our model outputs favor the latter interpretation and are consistent with widely accepted concepts, namely, lithospheric extension and thinning in the evolution of passive continental margins [135] for the following reasons. First, the transition from continental crust (SDB), passing through transitional crust (NDB and offshore extension), and into oceanic crust in the southern Herodotus Abyssal plain [50,59,60,128] is reflected in the gradual variation in crustal thicknesses (SDB: 34–36 km; NDB: 30–24 km; southern Herodotus Abyssal plain: 10–12 km) and gravity Bouguer values (SDB: ~−40 mGal; NDB and Delta fan: +10 to ≥+40 mGal; southern Herodotus Abyssal plain: ~+140 mGal) (Figure 3c, Figure 6 and Figure 7). Second, the transition from thick to thin continental crust along the NDB and the Nile Fan is gentle and broad, occurs over a wide zone, and continues eastwards towards the Levant Basin, previously interpreted as representing extended continental crust within the Neo-Tethys rift regime [50,111] (Figure 6). Third, the cross section generated from our crustal model (Figure 8), is similar to those reported from modern passive continental margins [50,111,131,135,139,140]. Additional support for the advocated transitional zone within the passive margin model comes from the following observations: (1) presence of listiric faults, growth faults, and tilted fault blocks in the NDB and its offshore extension [7,38,41,42] (Figure 8), which are commonly reported from extensional regimes within continental-oceanic transition zones [134,135,141]; (2) thinning, extension, and bending phenomena reported from subducting slabs (outer swell) in areas proximal (75–150 km) to the trench—similar to those reported in the descending slabs under the Japan and Chile trenches [142,143,144]—do not apply to a location distant (NDB > 450 km) from the Hellenic trench (Figure 1); and (3) the low seismicity over the extended and thinned crust in the NDB [145,146] is inconsistent with models that call on active subduction.
The above-mentioned arguments, together with the absence of excessive thermal or volcanic eruptions associated with the Neo-Tethyan rift in northern Egypt [13,147], support the suggestion that the thinning in the NDB marks the transition of the African continental crust to the Mediterranean oceanic crust in a non-volcanic passive continental margin setting.
As described earlier, our gravity inversion results (Figure 6) reveal: (1) a broad transition from thick to thin continental crust over the NDB and the Delta fan and the extension of the transition zone eastwards towards the Levant margin, and (2) a sharp transition from thick to thin continental crust along the western flank of the Nile Delta and fan towards the oceanic Herodotus Basin and a transform margin to the western side of the Nile Delta [50,111,148]. The crustal patterns in the Delta and its fan appear to be analogous to the well-defined rifted continental margin in the eastern Mediterranean Basin along the Levant margin [50,111].
In passive margin settings, the term “hinge zone” is usually assigned to the outer marginal collapse around a pivot zone where crustal thinning occurs and where an accommodation space for a thick sedimentary wedge is created [149]. The hinge zone is marked by a major, seaward-facing, extensional listiric fault system that bounds a distinctive half-graben (in our case, NDB) displaying growth structures [149,150]. The spatial segmentation of extensional zones resulting from rifts could be responsible for the development of one or more hinge zones such as those reported from the West African passive margins (inner-onshore and outer-offshore hinge zones subparallel to the rift) [133].
The hinge zone (Figure 6, Figure 7 and Figure 8) in the Nile Delta has been recognized on a lithological and/or structural basis. It marks a facies change from Cretaceous–Eocene clastics (SDB) to thick basinal Neogene facies (NDB) [2,7,11,42]. Structurally, the zone encompasses east–west-trending incipient listiric and normal fault systems, along which sliding of sediment occurred seaward [11,38,41]. Based on our crustal model and forward gravity modeling (Figure 6 and Figure 7), the hinge zone is here defined as the area where abrupt and rapid necking and thinning of crustal thickness and progressive increase in sediment thickness occurs, a zone that marks the beginning of the transition from normal continental crust (SDB) to oceanic crust in the Herodotus Basin. The width and extension of the hinge zone are subjects of debate. Based on earlier seismological and stratigraphic studies, it could be as narrow as 4–8 km in width [73,151,152] and as wide as 30–40 km and up to 70 km [38,41,42]. Our forward gravity and crustal models suggest that the hinge zone is 30–40 km wide (Figure 6, Figure 7 and Figure 8) and represents an east to west continuation of the Levant hinge line [153,154] across the NDB.
5.2. Limitations and Uncertainties
The gravity inversion model over the study area was calibrated against a limited and unevenly distributed seismic station data set (24 stations). Additional seismic data and a more even distribution of the stations could minimize the non-uniqueness of gravity inversion. The deepest wells in the study area reached 4 km, whereas the sedimentary thicknesses exceeded 9 km at the shoreline. Not only were these wells shallow, but they were limited in numbers as well. Subsurface data from a larger network of deep wells in the study area could be instrumental in model calibration for optimum detection of depth to basement and sedimentary cover configuration. The same could be said about deep seismic sections or profiles: the more the profiles, the better the definition of depth to basement, DTM, and intra-crustal layers based on variation in seismic velocities.
Despite the limitations listed above, our models provide an overall distribution for the Nile Delta crustal structure and demarcation of the North African transitional zone along the Nile Delta and its offshore. The uncertainties associated with the estimated gravity-based Moho and the 2D density model could be related to a number of factors including: (1) uncertainties (up to 4 mGal) in the mean error of the ETOPO-1 model [48,155], (2) uncertainties introduced in the forward modelling by assuming a unified density across the study area for sediments and crust, (3) the paucity of seismological stations and the limited sedimentary thickness coverage of North Africa may have introduced uncertainties of up to ±3–5 km in the estimated DTM [48,59,63,102], and (4) potential errors in calculating the reference density contrast, where a deviation ± 50 kg/m3 from the true value might lead to 2–3 km variation in Moho depth [156].
5.3. Implications and Significance
Accurate crustal models for the continental-oceanic crustal boundary (transition zone) similar to the one presented here can provide guidance for identifying target areas for oil and gas exploration within passive margin settings. Six basins and tectonic settings comprise the world’s 877 giant oil and gas fields that host some 500 million barrel (bbl) of recoverable hydrocarbons and 3 trillion cubic feet of recoverable gas [157]. Continental passive margins fronting ocean basins account for 35% of total giant fields (304 fields), whereas continental rifts, which are likely to evolve passive margins with time (especially failed rifts at the edges or interiors of continents), form the second most common tectonic setting, which includes 31% of the world’s giant fields (271 fields) [157]. Transitional zones of continental passive margin settings, including the Mississippi River Delta, Niger Delta, and Nile Delta are important exploration targets for oil and gas because they are associated with favorable conditions for accumulation and maturation of organic matter [22,158,159].
In the Nile Delta and its offshore, the presence of large scale listiric and rotational block movement within the transition zone, together with significant Messinian evaporitic deep-sea fan sequence (up to 4000 m thick) and organic-rich shales, provided mature sources and efficient seals for hydrocarbons [38,42,89,160,161]. This setting made this area a hotspot for oil and gas exploration, as attested by the discoveries within the last two to three decades (e.g., Abu Madi, South Disouq, Baltim, and Shorouk concessions) [162,163,164,165,166]. The recently discovered offshore Zohr natural gas field, the largest gas field in the Mediterranean Sea, doubled Egypt’s gas reserves [167,168].
6. Conclusions
The delineation of the continental-oceanic crustal boundary, or transition zone, is important for plate tectonic reconstructions and for estimating heat flow through time, which has implications for hydrocarbon maturation and reservoir quality. An integrative gravity model constrained with seismic data was generated to estimate DTM across the Nile Delta region and its offshore. The model is based on inversion of satellite gravity data (GOCO06s model), applying the modified Bott’s method with the Tikhonov regularization followed by 2D forward gravity modeling using the IGMAS+ software package. The modeled spatial variations in crustal thicknesses across the Nile Delta and its offshore component, together with available geologic and subsurface data, were used to constrain the geological and tectonic setting of the study area, demarcate the Nile Delta transition zone along the North African continental passive margin, and address the location of the hinge zone and its approximate width.
Based on our crustal model, the Nile Delta can be divided into two main crustal units (SDB and NDB) separated by a hinge zone. The SBD is characterized by a continental crust (34–36 km), a DTM from 36 to 38 km, and a low-gravity anomaly (~−40 mGal). The DTM for NDB varies from ~35 km at its contact with the hinge zone, to 30–32 km at the shoreline, and decreases to 20–22 km south of the Herodotus Basin. The crustal thickness of the NDB is ~30 km at the hinge zone, 22–24 km at the shorelines, and decreases to 10–12 km at the southern borders of the Herodotus Basin (after removal of sedimentary cover). A high gravity anomaly (~10 mGal) is observed at the NDB/hinge zone boundary and increases northwards towards the shoreline (~40 mGal) and areas south of the Herodotus Basin (~140 mGal).
Based on our models, we define the Nile Delta hinge zone as the zone that marks the beginning of the transition from normal continental crust (SDB) to oceanic crust (Herodotus Basin), and where rapid necking and thinning of crustal thickness and progressive increase in sediment thickness occurs. Previously, it was referred to as a flexure zone that encompasses extensive east–west-trending, northward dipping, growth and listiric normal faults parallel to the Mediterranean, along which northward gravitational sliding of thick sediment accumulations is observed.
Finally, the east–northeast-trending transitional zone in the NDB and its Nile fan can be defined as the western continuation of the north–northeast-trending Levant Basin transitional zone within a passive margin setting between the North African continental crust and the Mediterranean oceanic crust (Herodotus Basin). This is evidenced by the broad transition from thick to thin continental crust along the NDB and the Nile Delta Fan, a transition similar to that observed in the Levant Basin, and the prevalence of extensional tectonics (listiric and growth faults) and excess sedimentation in both areas.
Supplementary Materials
The following are available online at https://www.mdpi.com/article/10.3390/rs13101934/s1, Figure S1: (a) The modeled (from the 2D forward model) Bouguer gravity map of the Nile Delta. (b) The gravity residuals, which represents the difference between the modeled (Figure S1a) and observed Bouguer data (Figure 3c).
Author Contributions
Conceptualization, S.H.; M.S. (Mohamed Sultan) and M.S.E.; Data curation, S.H. and M.S. (Mohamed Sobh); Formal analysis, S.H.; M.S. (Mohamed Sobh) and M.S.E.; Investigation, S.H., M.S. (Mohamed Sultan), and M.S.E.; Methodology, S.H. and M.S. (Mohamed Sobh); Software, S.H. and M.S. (Mohamed Sobh); Supervision, M.S. (Mohamed Sultan), K.Z., A.A., E.I. and S.K.; Validation, S.H. and M.S.E.; Visualization, S.H., M.S. (Mohamed Sultan); M.S.E. and M.S. (Mohamed Sobh); Writing—original draft, S.H.; Writing—review and editing, M.S. (Mohamed Sultan), M.S. (Mohamed Sobh), M.S.E., K.Z., A.A., E.I. and S.K. All authors have read and agreed to the published version of the manuscript.
Funding
This research is supported by a scholarship from the Egyptian Cultural and Educational Affairs Sector and by the Earth Sciences Remote Sensing facility at Western Michigan University. The contributions of Dr. Mohamed Sobh to this project has been partially funded by BMWi (Bundesministerium für Wirtschaft und Energie) within the joint project ’SYSEXPL–Systematische Exploration’, grant ref. 03EE4002B.
Data Availability Statement
Data cited in this manuscript is available in registries that are freely accessible to the public. All the grid files and maps were created using Generic Mapping Tools (GMT), version 5 [169], and ArcGIS, version 10.6.1 [170]. The scientific color map batlow was used in this study to prevent visual distortion of the data and exclusion of readers with color vision deficiencies [171].
Acknowledgments
The authors would like to thank Cynthia J. Ebinger, Tulane University, Louisiana, USA, for her valuable guidance and stimulating discussions. We would also like to thank Hans-Jürgen Götze and Sabine Schmidt, Institute of Geosciences, Christian-Albrechts-Universität Kiel, Germany, for the use of the IGMAS+ software for forward modeling.
Conflicts of Interest
The authors declare no conflict of interest.
References
- Haars, C.; Lönsjö, E.; Mogos, B.; Winkelaar, B. The Uncertain Future of the Nile Delta; NASA/GSFC: Greenbelt, MD, USA, 2016; 54p. [CrossRef]
- Stanley, D.J. Submergence and burial of ancient coastal sites on the subsiding Nile delta margin, Egypt. Méditerranée 2005, 65–73. [Google Scholar] [CrossRef]
- Ducassou, E.; Migeon, S.; Mulder, T.; Murat, A.; Capotondi, L.; Bernasconi, S.M.; Mascle, J. Evolution of the Nile deep-sea turbidite system during the late Quaternary: Influence of climate change on fan sedimentation. Sedimentology 2009, 56, 2061–2090. [Google Scholar] [CrossRef]
- Ross, D.; Uchupi, E. Structure and sedimentary history of northeastern Mediterranean Sea-Nile cone area. AAPG 1977, 872–902. [Google Scholar] [CrossRef]
- Newton, C.S.; Shipp, R.C.; Mosher, D.C.; Wach, G.D. Importance of mass transport complexes in the quaternary development of the Nile Fan, Egypt. In Proceedings of the Paper Presented at the Offshore Technology Conference, Houston, TX, USA, 3–6 May 2004; Volume 3, pp. 1909–1918. [Google Scholar] [CrossRef]
- Reading, H.G.; Richards, M. Turbidite systems in deep-water basin margins classified by grain size and feeder system. Am. Assoc. Pet. Geol. Bull. 1994, 78, 792–822. [Google Scholar] [CrossRef]
- Sestini, G. Nile Delta: A review of depositional environments and geological history. Geol. Soc. Spec. Publ. 1989, 41, 99–127. [Google Scholar] [CrossRef]
- Macgregor, D.S. The development of the Nile drainage system: Integration of onshore and offshore evidence. Pet. Geosci. 2012, 18, 417–431. [Google Scholar] [CrossRef]
- Abdelkareem, M.; Ghoneim, E.; El-Baz, F.; Askalany, M. New insight on paleoriver development in the Nile basin of the eastern Sahara. J. Afr. Earth Sci. 2012, 62, 35–40. [Google Scholar] [CrossRef]
- Faccenna, C.; Glišović, P.; Forte, A.; Becker, T.W.; Garzanti, E.; Sembroni, A.; Gvirtzman, Z. Role of dynamic topography in sustaining the Nile River over 30 million years. Nat. Geosci. 2019, 12, 1012–1017. [Google Scholar] [CrossRef]
- Harms, J.C.; Wray, J.L. Nile Delta. In Geology of Egypt; Said, R., Ed.; A.A.Balkema: Rotterdam, The Netherlands, 1990; pp. 329–344. [Google Scholar]
- Hussein, I.M.; Abd-Allah, A.M.A. Tectonic evolution of the northeastern part of the African continental margin, Egypt. J. Afr. Earth Sci. 2001, 33, 49–68. [Google Scholar] [CrossRef]
- Blenkinsop, T.; Moore, A. Tectonic Geomorphology of Passive Margins and Continental Hinterlands. Treatise Geomorphol. 2013, 5, 71–92. [Google Scholar] [CrossRef]
- Schattner, U.; Ben-Avraham, Z. Transform margin of the northern Levant, eastern Mediterranean: From formation to reactivation. Tectonics 2007, 26. [Google Scholar] [CrossRef]
- Robertson, A.H.F.; Dixon, J.E. Introduction: Aspects of the geological evolution of the Eastern Mediterranean. Geol. Soc. Spec. Publ. 1984, 17, 1–74. [Google Scholar] [CrossRef]
- Roberts, D.G.; Bally, A. From rifts to passive margins: A continuum of extension. In Regional Geology and Tectonics: Phanerozoic Rift Systems and Sedimentary Basins; Elsevier: New York, NY, USA, 2012; pp. 19–28. [Google Scholar]
- Scotese, C.R.; Wright, N. PALEOMAP Paleodigital Elevation Models (Paleo-DEMS) for the Phanerozoic PALEOMAP Project. 2018. Available online: https://www.earthbyte.org/paleodem-resource-scotese-and-wright-2018/ (accessed on 11 August 2020).
- Dolson, J.C.; Shann, M.V.; Matbouly, S.I.; Hammouda, H.; Rashed, R.M. Egypt in the twenty-first century: Petroleum potential in offshore trends. GeoArabia 2001, 6, 211–230. [Google Scholar]
- May, P.R. The eastern Mediterranean Mesozoic basin: Evolution and oil habitat. Am. Assoc. Pet. Geol. Bull. 1991, 75, 1215–1232. [Google Scholar] [CrossRef]
- Garfunkel, Z. Origin of the Eastern Mediterranean basin: A reevaluation. Tectonophysics 2004, 391, 11–34. [Google Scholar] [CrossRef]
- Garfunkel, Z. Constrains on the origin and history of the Eastern Mediterranean basin. Tectonophysics 1998, 298, 5–35. [Google Scholar] [CrossRef]
- Levell, B.; Argent, J.; Doré, A.G.; Fraser, S. Passive margins: Overview. Geol. Soc. Lond. Pet. Geol. Conf. Ser. 2010, 7, 823–830. [Google Scholar] [CrossRef]
- Watts, A.B. Models for the evolution of passive margins. Reg. Geol. Tectonics Phaneroz. Rift Syst. Sediment. Basins 2012, 32–57. [Google Scholar] [CrossRef]
- Pawlowski, R. The use of gravity anomaly data for offshore continental margin demarcation. Lead. Edge 2008, 27, 697–824. [Google Scholar] [CrossRef]
- Scrutton, R.A. On sheared passive continental margins. Tectonophysics 1979, 59, 293–305. [Google Scholar] [CrossRef]
- Bird, D. Shear margins: Continent-ocean transform and fracture zone boundaries. Lead. Edge 2001, 20, 150–159. [Google Scholar] [CrossRef]
- Watts, A.B. Gravity anomalies, flexure and crustal structure at the Mozambique rifted margin. Mar. Pet. Geol. 2001, 18, 445–455. [Google Scholar] [CrossRef]
- Welsink, H.J.; Dwyer, J.D.; Knight, R.J. Tectono-stratigraphy of the Passive Margin Off Nova Scotia: Chapter 14: North American Margins. In Extensional Tectonics and Stratigraphy of the North Atlantic Margins; Tankard, A.J., Balkwill, H.R., Eds.; American Association of Petroleum Geologists: Tulsa, OK, USA, 1989; Volume 46, pp. 215–231. [Google Scholar]
- Alves, T.; Fetter, M.; Busby, C.; Gontijo, R.; Cunha, T.A.; Mattos, N.H. A tectono-stratigraphic review of continental breakup on intraplate continental margins and its impact on resultant hydrocarbon systems. Mar. Pet. Geol. 2020, 117. [Google Scholar] [CrossRef]
- Peron-Pinvidic, G.; Manatschal, G.; Alves, T.; Andersen, T.; Andres-Martinez, M.; Autin, J.; Ball, P.; Brune, S.; Buiter, S.; Cadenas, P.; et al. Rifted Margins: State of the Art and Future Challenges. Front. Earth Sci. 2019, 7, 218. [Google Scholar] [CrossRef]
- Moustafa, A.R. Fold-related faults in the Syrian Arc belt of Northern Egypt. Mar. Pet. Geol. 2013, 48, 441–454. [Google Scholar] [CrossRef]
- McClusky, S.; Reilinger, R.; Mahmoud, S.; Ben Sari, D.; Tealeb, A. GPS constraints on Africa (Nubia) and Arabia plate motions. Geophys. J. Int. 2003, 155, 126–138. [Google Scholar] [CrossRef]
- McClusky, S.; Balassanian, S.; Barka, A.; Demir, C.; Ergintav, S.; Georgiev, I.; Gurkan, O.; Hamburger, M.; Hurst, K.; Kahle, H.; et al. Global Positioning System constraints on plate kinematics and dynamics in the eastern Mediterranean and Caucasus. J. Geophys. Res. Solid Earth 2000, 105, 5695–5719. [Google Scholar] [CrossRef]
- Reilinger, R.E.; McClusky, S.C.; Oral, M.B.; King, R.W.; Toksoz, M.N.; Barka, A.A.; Kinik, I.; Lenk, O.; Sanli, I. Global Positioning System measurements of present-day crustal movements in the Arabia-Africa-Eurasia plate collision zone. J. Geophys. Res. Solid Earth 1997, 102, 9983–9999. [Google Scholar] [CrossRef]
- Butler, R. A. H. F. Robertson & D. Mountrakis (eds) 2006. Tectonic Development of the Eastern Mediterranean Region. Geological Society Special Publication no. 260. vi + 717 pp. London, Bath: Geological Society of London. Price £100.00, US $180.00; GSL members’ price. Geol. Mag. 2008. [Google Scholar] [CrossRef]
- Faccenna, C.; Becker, T.W.; Jolivet, L.; Keskin, M. Mantle convection in the Middle East: Reconciling Afar upwelling, Arabia indentation and Aegean trench rollback. Earth Planet. Sci. Lett. 2013, 375, 254–269. [Google Scholar] [CrossRef]
- Woodside, J.M. Tectonic elements and crust of the eastern Mediterranean Sea. Mar. Geophys. Res. 1977, 3, 317–354. [Google Scholar] [CrossRef]
- Smith, C.M., Ed.; Schlumberger Geology of Egypt. In Proceedings of the Well Evaluation Conference; Schlumberger Middle East: Cairo, Egypt, 1984; pp. 1–64. [Google Scholar]
- Kamel, H.; Eita, T.; Sarhan, M. Nile delta hydrocarbon potentiality, Egypt. In Proceedings of the 14th Egyptian General Petroleum Corporation Exploration and Production Conference, Cairo, Egypt, November 1998; pp. 485–503. [Google Scholar]
- Mascle, J.; Sardou, O.; Loncke, L.; Migeon, S.; Caméra, L.; Gaullier, V. Morphostructure of the Egyptian continental margin: Insights from swath bathymetry surveys. Mar. Geophys. Res. 2006, 27, 49–59. [Google Scholar] [CrossRef]
- Barakat, M.K.A. Modern Geophysical Techniques for Constructing a 3D Geological Model on the Nile Delta, Egypt. Ph.D. Thesis, Berlin Institute of Technology, Berlin, Germany, 2010; p. 158. [Google Scholar]
- EGPC Nile Delta and North Sinia; Egyptian General Petroleum Corporation: Cairo, Egypt, 1994; p. 387.
- Netzeband, G.L.; Gohl, K.; Hübscher, C.P.; Ben-Avraham, Z.; Dehghani, G.A.; Gajewski, D.; Liersch, P. The Levantine Basin-crustal structure and origin. Tectonophysics 2006. [Google Scholar] [CrossRef]
- Bar, O.; Gvirtzman, Z.; Feinstein, S.; Zilberman, E. Accelerated subsidence and sedimentation in the Levant basin during the late Tertiary and concurrent uplift of the Arabian platform: Tectonic versus counteracting sedimentary loading effects. Tectonics 2013, 32, 334–350. [Google Scholar] [CrossRef]
- Rybakov, M.; Goldshmidt, V.; Hall, J.K.; Ben-Avraham, Z.; Lazar, M. New insights into the sources of magnetic anomalies in the Levant. Russ. Geol. Geophys. 2011, 52, 377–397. [Google Scholar] [CrossRef]
- Gvirtzman, Z.; Reshef, M.; Buch-Leviatan, O.; Ben-Avraham, Z. Intense salt deformation in the Levant Basin in the middle of the Messinian Salinity Crisis. Earth Planet. Sci. Lett. 2013, 379, 108–119. [Google Scholar] [CrossRef]
- Van der Meijde, M.; van der Lee, S.; Giardini, D. Crustal structure beneath broad-band seismic stations in the Mediterranean region. Geophys. J. Int. 2003, 152, 729–739. [Google Scholar] [CrossRef]
- Sobh, M.; Mansi, A.H.; Campbell, S.; Ebbing, J. Regional gravity field model of Egypt based on satellite and terrestrial data. Pure Appl. Geophys. 2019, 176, 767–786. [Google Scholar] [CrossRef]
- Sobh, M.; Ebbing, J.; Mansi, A.H.; Götze, H.J. Inverse and 3D forward gravity modelling for the estimation of the crustal thickness of Egypt. Tectonophysics 2019, 752, 52–67. [Google Scholar] [CrossRef]
- Cowie, L.; Kusznir, N. Mapping crustal thickness and oceanic lithosphere distribution in the eastern Mediterranean using gravity inversion. Pet. Geosci. 2012, 18, 373–380. [Google Scholar] [CrossRef]
- Kende, J.; Henry, P.; Bayrakci, G.; Özeren, M.S.; Grall, C. Moho depth and crustal thinning in the Marmara Sea region from gravity data inversion. J. Geophys. Res. Solid Earth 2017, 122, 1381–1401. [Google Scholar] [CrossRef]
- Pfiffner, O.A. Thick-skinned and thin-skinned tectonics: A global perspective. Geosciences 2017, 7, 71. [Google Scholar] [CrossRef]
- Sobh, M.; Ebbing, J.; Mansi, A.H.; Götze, H.-J.; Emry, E.L.; Abdelsalam, M.G. The lithospheric structure of the Saharan metacraton From 3-D integrated geophysical-petrological modeling. J. Geophys. Res. Solid Earth 2020, 125. [Google Scholar] [CrossRef]
- Kaban, M.K.; El Khrepy, S.; Al-Arifi, N. Density structure and isostasy of the lithosphere in Egypt and their relation to seismicity. Solid Earth 2018, 9, 833–846. [Google Scholar] [CrossRef]
- Lort, J.M.; Limond, W.Q.; Gray, F. Preliminary seismic studies in the eastern Mediterranean. Earth Planet. Sci. Lett. 1974, 21, 355–366. [Google Scholar] [CrossRef]
- Meier, T.; Dietrich, K.; Stöckhert, B.; Harjes, H.P. One-dimensional models of shear wave velocity for the eastern Mediterranean obtained from the inversion of Rayleigh wave phase velocities and tectonic implications. Geophys. J. Int. 2004, 156, 45–58. [Google Scholar] [CrossRef]
- Koulakov, I.; Sobolev, S.V. Moho depth and three-dimensional P and S structure of the crust and uppermost mantle in the Eastern Mediterranean and Middle East derived from tomographic inversion of local ISC data. Geophys. J. Int. 2006, 164, 218–235. [Google Scholar] [CrossRef]
- Di Luccio, F.; Pasyanos, M.E. Crustal and upper-mantle structure in the Eastern Mediterranean from the analysis of surface wave dispersion curves. Geophys. J. Int. 2007, 169, 1139–1152. [Google Scholar] [CrossRef]
- Sampietro, D.; Mansi, A.H.; Capponi, M. Moho depth and crustal architecture beneath the Levant basin from global gravity field model. Geosciences 2018, 8, 200. [Google Scholar] [CrossRef]
- Hamouda, A.; El-Gharabawy, S. Impacts of neotectonics and salt diaper on the Nile Fan deposit, Eastern Mediterranean. Environ. Earth Sci. Res. J. 2019, 6, 8–18. [Google Scholar] [CrossRef]
- Makris, J.; Allam, A.; Möller, L. Deep seismic studies in Egypt and their interpretation. EOS Trans. Am. Geophys. Union 1981, 62, 230. [Google Scholar]
- Abdelwahed, M.F.; El-Khrepy, S.; Qaddah, A. Three-dimensional structure of Conrad and Moho discontinuities in Egypt. J. Afr. Earth Sci. 2013, 85, 87–102. [Google Scholar] [CrossRef]
- Hosny, A.; Nyblade, A. The crustal structure of Egypt and the northern Red Sea region. Tectonophysics 2016, 687, 257–267. [Google Scholar] [CrossRef]
- Marzouk, I. Study of Crustal Structure of Egypt Deduced from Deep Seismic and Gravity Data. Ph.D. Thesis, University of Hamburg, Hamburg, Germany, 1988. [Google Scholar]
- El-Hadidy, S. Crustal Structure and Its Related Causative Tectonics in Northern Egypt Using Geophysical Data. Ph.D. Thesis, Ain Shams University, Cairo, Egypt, 1995. [Google Scholar]
- Dorre, A.S.; Carrara, E.; Cella, F.; Grimaldi, M.; Hady, Y.A.; Hassan, H.; Rapolla, A.; Roberti, N. Crustal thickness of Egypt determined by gravity data. J. Afr. Earth Sci. 1997, 25, 425–434. [Google Scholar] [CrossRef]
- Azab, A.; El-Khadragy, A.; Soliman, S.A. Egyptian Crust: A structural modeling, based on gravity and seismic data. J. Am. Sci. 2015, 13, 1576–1580. [Google Scholar] [CrossRef]
- Saleh, S. 3D crustal structure and its tectonic implication for Nile delta and greater Cairo regions, Egypt, from geophysical data. Acta Geod. Geophys. Hungarica 2012, 47, 402–429. [Google Scholar] [CrossRef]
- Hirt, C.; Kuhn, M.; Featherstone, W.E.; Gtötl, F. Topographic/isostatic evaluation of new-generation GOCE gravity field models. J. Geophys. Res. Solid Earth 2012, 117, 1–16. [Google Scholar] [CrossRef]
- Müller, J.; Wu, H. Using quantum optical sensors for determining the Earth’s gravity field from space. J. Geod. 2020, 94, 71. [Google Scholar] [CrossRef]
- Uieda, L.; Barbosa, V.C.F. Fast nonlinear gravity inversion in spherical coordinates with application to the South AmericanMoho. Geophys. J. Int. 2017, 208, 162–176. [Google Scholar] [CrossRef]
- Bott, M.H.P. The use of rapid digital computing methods for direct gravity interpretation of sedimentary basins. Geophys. J. R. Astron. Soc. 1960, 3, 63–67. [Google Scholar] [CrossRef]
- Harms, J.C.; Wray, J.L. Pre-Pliocene History and Depositional Facies, Nile Delta, Egypt. AAPG Bull. United States 1988, 72. [Google Scholar] [CrossRef]
- Said, R. The geology of Egypt; Balkema: Rotterdam, The Netherlands, 1990. [Google Scholar] [CrossRef]
- Said, R. The geological evolution of the River Nile in Egypt. Z. Geomorphol. 1982. [Google Scholar] [CrossRef]
- Barber, P.M. Messinian subaerial erosion of the proto-Nile Delta. Mar. Geol. 1981, 44, 253–272. [Google Scholar] [CrossRef]
- Coutellier, V.; Stanley, D.J. Late Quaternary stratigraphy and paleogeography of the eastern Nile Delta, Egypt. Mar. Geol. 1987, 77, 257–275. [Google Scholar] [CrossRef]
- Elsohby, M.A.; Mazen, S.O.; Abou-Shook, M.; Bahr, M.A. Coastal development of Nile Delta. Coast. Lowl. Geol. Geotechnol. Proc. KNGMG Symp. Hague 1987 1989, 179, 175–179. [Google Scholar] [CrossRef]
- Narton, P. Rock Stratigraphic Nomenclature of the Western Desert; Pan American Petroleum and Transport Company: New York, NY, USA, 1967. [Google Scholar]
- Rizzini, A.; Vezzani, F.; Cococcetta, V.; Milad, G. Stratigraphy and sedimentation of a Neogene-Quaternary section in the Nile Delta area (A.R.E.). Mar. Geol. 1978, 27, 327–348. [Google Scholar] [CrossRef]
- Stanley, D.J.; Warne, A.G. Nile Delta: Recent Geological Evolution and Human Impact. Science 1993, 260, 628–634. [Google Scholar] [CrossRef]
- Warne, A.G.; Stanley, D.J. Sea-level change as critical factor in development of basin margin sequences: New evidence from late Quaternary record. J. Coast. Res. 1995, 231–240. [Google Scholar]
- Zaghloul, Z.M.; Abdel-Daiem, A.A.; Taha, A.A. Geomorphology, geologic, evolution and subsidence of the Nile Delta during the Quaternary. Bull. Fac. Sci. 1990, 1, 471–495. [Google Scholar]
- Samuel, A.; Kneller, B.; Raslan, S.; Sharp, A.; Parsons, C. Prolific deep-marine slope channels of the Nile Delta, Egypt. Am. Assoc. Pet. Geol. Bull. 2003, 87, 541–560. [Google Scholar] [CrossRef]
- Abdel-Fattah, M.I.; Slatt, R.M. Sequence stratigraphic controls on reservoir characterization and architecture: Case study of the Messinian Abu Madi incised-valley fill, Egypt. Cent. Eur. J. Geosci. 2013, 5, 497–507. [Google Scholar] [CrossRef]
- EGPC-Conoco Coral Egyptian General Petroleum Corporation-Conoco Coral, Geological map of Egypt, Scale 1:500,000. Geol. Surv. Egypt 1987.
- Vandré, C.; Cramer, B.; Gerling, P.; Winsemann, J. Natural gas formation in the western Nile delta (Eastern Mediterranean): Thermogenic versus microbial. Org. Geochem. 2007, 38, 523–539. [Google Scholar] [CrossRef]
- Sarhan, M.A.; Collier, R.E.L.; Basal, A.; Abdel Aal, M.H. Late Miocene normal faulting beneath the northern Nile Delta: NNW propagation of the Gulf of Suez Rift. Arab. J. Geosci. 2014, 7, 4563–4571. [Google Scholar] [CrossRef]
- Abdel Aal, A.; El Barkooky, A.; Gerrits, M.; Meyer, H.J.; Schwander, M.; Zaki, H. Tectonic evolution of the eastern Mediterranean basin and its significance for the hydrocarbon prospectivity of the Nile Delta deepwater area. GeoArabia 2001, 6, 363–384. [Google Scholar]
- De Ruiter, R.S.C.; Lovelock, P.E.R.; Nabulsi, N. The Euphrates graben, Eastern Syria: A new petroleum province in the northern Middle East. In Proceedings of the Geo ’94, Middle East Pet, Manama, Bahrain, 25–27 April 1994. [Google Scholar]
- Robertson, A.H.F.; Dixon, J.E.; Brown, S.; Collins, A.; Morris, A.; Pickett, E.; Sharp, I.; Ustaömer, T. Alternative tectonic models for the Late Palaeozoic-Early Tertiary development of Tethys in the Eastern Mediterranean region. Geol. Soc. Spec. Publ. 1996, 105, 239–263. [Google Scholar] [CrossRef]
- Orwig, R. Tectonic framework of Northern Egypt and the Eastern Mediterranean region. In Proceedings of the 6th Exploration and Production Conference, Cairo, Egypt; 1982; Volume 1, p. 20. [Google Scholar]
- Omara, S. Diapiric structures in Egypt and Syria. Am. Assoc. Pet. Geol. Bull. 1964, 48, 1116–1125. [Google Scholar]
- Litak, R.K.; Barazangi, M.; Beauchamp, W.; Seber, D.; Brew, G.; Sawaf, T.; Al-Youssef, W. Mesozoic-Cenozoic evolution of the intraplate Euphrates fault system, Syria: Implications for regional tectonics. J. Geol. Soc. Lond. 1997. [Google Scholar] [CrossRef]
- Bosworth, W.; Guiraud, R.; Kessler, L.G. Late Cretaceous (±84 Ma) compressive deformation of the stable shelf of NE Africa (Egypt): Far-Field stress effects of the “Santonian event” and origin of the Syrian arc. Geology 1999, 27, 633–636. [Google Scholar] [CrossRef]
- Moustafa, A.R.; Khalil, S.M. Control of compressional transfer zones on syntectonic and posttectonic sedimentation: Implications for hydrocarbon exploration. J. Geol. Soc. Lond. 2017, 174, 336–352. [Google Scholar] [CrossRef]
- Abd El-Motaal, E.; Orabi, A.; Tolba, M.; El-Sawy, E. Structural developmentand its influence on the geomorphology of the strongly folded portion in northernSinai, Egypt. Al-Azhar Bull. Sci. 2001, 12, 37–50. [Google Scholar]
- Quennell, A.M. The Western Arabia rift system. Geol. Soc. Spec. Publ. 1984, 17, 775–788. [Google Scholar] [CrossRef]
- Brew, G.; Barazangi, M.; Al-Maleh, K.; Sawaf, T. Tectonic and geologic evolution of Syria. GeoArabia 2001, 6, 573–616. [Google Scholar]
- Kvas, A.; Mayer-Gürr, T.; Krauss, S.; Brockmann, J.M.; Schubert, T.; Schuh, W.-D.; Pail, R.; Gruber, T.; Jäggi, A.; Meyer, U. The satellite-only gravity field model GOCO06s. GFZ Data Serv. 2019. [Google Scholar] [CrossRef]
- Amante, C.; Eakins, B.W. {ETOPO}1 Global Relief Model converted to {PanMap} layer format. NOAA-National Geophys. Data Cent. 2009. [Google Scholar] [CrossRef]
- Laske, G.; Masters, G.; Ma, Z.; Pasyanos, M. Update on CRUST1.0-A1-degree global model of Earth’s crust. In Proceedings of the EGU General Assembly, Vienna, Austria, 7–12 April 2013. [Google Scholar]
- Ben-Avraham, Z.; Ginzburg, A.; Makris, J.; Eppelbaum, L. Crustal structure of the Levant Basin, eastern Mediterranean. Tectonophysics 2002, 346, 23–43. [Google Scholar] [CrossRef]
- Floberghagen, R.; Fehringer, M.; Lamarre, D.; Muzi, D.; Frommknecht, B.; Steiger, C.; Piñeiro, J.; da Costa, A. Mission design, operation and exploitation of the gravity field and steady-state ocean circulation explorer mission. J. Geod. 2011, 85, 749–758. [Google Scholar] [CrossRef]
- Sebera, J.; Šprlák, M.; Novák, P.; Bezděk, A.; Vaľko, M. Iterative spherical downward continuation applied to magnetic and gravitational data from satellite. Surv. Geophys. 2014, 35, 941–958. [Google Scholar] [CrossRef]
- Ince, E.S.; Barthelmes, F.; Reißland, S.; Elger, K.; Förste, C.; Flechtner, F.; Schuh, H. ICGEM-15 years of successful collection and distribution of global gravitational models, associated services and future plans. Earth Syst. Sci. Data 2019, 11, 647–674. [Google Scholar] [CrossRef]
- Barthelmes, F.; Kohler, W. International Centre for Global Earth Models (ICGEM). J. Geod. 2012, 86, 932–934. [Google Scholar]
- Szwillus, W.; Ebbing, J.; Holzrichter, N. Importance of far-field topographic and isostatic corrections forregional density modelling. Geophys. J. Int. 2016, 207, 274–287. [Google Scholar] [CrossRef]
- Mansi, A.H.; Capponi, M.; Sampietro, D. Downward continuation of airborne gravity data by means of the change of boundary approach. Pure Appl. Geophys. 2018, 175, 977–988. [Google Scholar] [CrossRef]
- Exxon Tectonic Map Series of theWorld; ExxonMobil Research & Engineering Co.: Houston, TX, USA, 1985.
- Longacre, M.; Bentham, P.; Hanbal, I.; Cotton, J.; Edwards, R. New crustal structure of the Eastern Mediterranean basin: Detailed integration and modeling of gravity, magnetic, seismic refraction, and seismic reflection Data. In Proceedings of the EGM 2007 International Workshop, Capri, Italy, 15–18 August 2007; pp. 1–5. [Google Scholar]
- Li, X.; Götze, H.-J. Ellipsoid, geoid, gravity, geodesy, and geophysics. Geophysics 2001, 66, 1660–1959. [Google Scholar] [CrossRef]
- Uieda, L.; Barbosa, V.C.F.; Braitenberg, C. Tesseroids: Forward-modeling gravitational fields in spherical coordinates. Geophysics 2016, 81, F41–F48. [Google Scholar] [CrossRef]
- Asgharzadeh, M.F.; von Frese, R.R.B.; Kim, H.R.; Leftwich, T.E.; Kim, J.W. Spherical prism gravity effects by Gauss-Legendre quadrature integration. Geophys. J. Int. 2007, 169, 1–11. [Google Scholar] [CrossRef]
- Hayford, J.F.; Bowie, W. The effect of topography and isostatic compensation upon the intensity of gravity. Bull. Am. Geogr. Soc. 1912, 44, 464–465. [Google Scholar] [CrossRef]
- Hinze, W.J. Bouguer reduction density, why 2.67? Geophysics 2003, 68, 1559–1560. [Google Scholar] [CrossRef]
- Barbosa, V.C.F.; Silva, J.B.C.; Medeiros, W.E. Gravity inversion of basement relief using approximate equality constraints on depths. Geophysics 1997, 62, 1683–2002. [Google Scholar] [CrossRef]
- Barnes, G.; Barraud, J. Imaging geologic surfaces by inverting gravity gradient data with depth horizons. Geophysics 2012, 77, 1JF–Z19. [Google Scholar] [CrossRef]
- Martins, C.M.; Barbosa, V.C.F.; Silva, J.B.C. Simultaneous 3D depth-to-basement and density-contrast estimates using gravity data and depth control at few points. Geophysics 2010, 75, 1MJ–Z72. [Google Scholar] [CrossRef]
- Oldenburg, D.W. Inversion and interpetation of gravity anomalies. Geophysics 1974, 39, 526–536. [Google Scholar] [CrossRef]
- Santos, D.F.; Silva, J.B.C.; Martins, C.M.; dos Santos, R.D.C.S.; Ramos, L.C.; de Araújo, A.C.M. Efficient gravity inversion of discontinuous basement relief. Geophysics 2015, 80, 1JA-Z63. [Google Scholar] [CrossRef]
- Silva, J.B.C.; Santos, D.F.; Gomes, K.P. Fast gravity inversion of basement relief. Geophysics 2014, 79, 1SO-Z136. [Google Scholar] [CrossRef]
- Uieda, L.; Oliveira, V.; Barbosa, V. Modeling the Earth with Fatiando a Terra. In Proceedings of the 12th Python in Science Conference, Austin, TX, USA, 24–29 June 2013; pp. 96–103. [Google Scholar]
- Tikhonov, A.N.; Arsenin, V.Y. Solutions of Ill-Posed Problems; John Wiley: New York, NY, USA, 1977; p. 300. [Google Scholar]
- Kim, J.H. Estimating classification error rate: Repeated cross-validation, repeated hold-out and bootstrap. Comput. Stat. Data Anal. 2009, 53, 3735–3745. [Google Scholar] [CrossRef]
- Götze, H.-J.; Lahmeyer, B. Application of three-dimensional interactive modeling in gravity and magnetics. Geophysics 1988, 53, 1096–1108. [Google Scholar] [CrossRef]
- Schmidt, S.; Götze, H.-J.; Fichler, C.; Alvers, M. IGMAS+ – a new 3D Gravity, FTG and Magnetic Modeling Software. In Konferenzband GEO-INFORMATIK 2010 Die Welt im Netz, Herausgeber; Zipf, A., Behncke, K., Hillen, F., Schefermeyer, J., Eds.; Akademische Ver-lagsgesellschaft AKA GmbH: Kiel, Germany, 2010; pp. 57–63. ISBN 978-3-89838-335-6. [Google Scholar]
- Makris, J.; Stobbe, C. Physical properties and state of the crust and upper mantle of the Eastern Mediterranean Sea deduced from geophysical data. Mar. Geol. 1984, 55, 347–363. [Google Scholar] [CrossRef]
- Omran, M.; Fathy, H. Structural evolution of the Nile Cone area. Egypt J. Geol. 1998, 42, 273–291. [Google Scholar]
- Hirsch, K.K.; Bauer, K.; Scheck-Wenderoth, M. Deep structure of the western South African passive margin - Results of a combined approach of seismic, gravity and isostatic investigations. Tectonophysics 2009, 470, 1–194. [Google Scholar] [CrossRef]
- Jilinski, P.; Meju, M.A.; Fontes, S.L. Demarcation of continental-oceanic transition zone using angular differences between gradients of geophysical fields. Geophys. J. Int. 2013, 195, 276–281. [Google Scholar] [CrossRef]
- Maurya, V.; Fontes, S.; La Terra, E. An enhanced and effective technique for demarcation of Continental—Oceanic transition—Application for South Atlantic conjugate margins. In Proceedings of the 79th EAGE Conference and Exhibition, Paris, France, 12–15 June 2017. [Google Scholar]
- Karner, G.D.; Driscoll, N.W. Tectonic and stratigraphic development of the West African and eastern Brazilian Margins: Insights from quantitative basin modelling. Geol. Soc. Spec. Publ. 1999, 153, 11–40. [Google Scholar] [CrossRef]
- Whitmarsh, R.B.; Miles, P.R. Models of the development of the west Iberia rifted continental margin at 40°30′N deduced from surface and deep-tow magnetic anomalies. J. Geophys. Res. 1995, 100, 3789–3806. [Google Scholar] [CrossRef]
- Wilson, R.C.L.; Manatschal, G.; Wise, S. Rifting along non-volcanic passive margins: Stratigraphic and seismic evidence from the mesozoic successions of the Alps and Western Iberia. Geol. Soc. Spec. Publ. 2001, 187, 429–452. [Google Scholar] [CrossRef]
- Granot, R. Palaeozoic oceanic crust preserved beneath the eastern Mediterranean. Nat. Geosci. 2016, 9, 701–705. [Google Scholar] [CrossRef]
- Segev, A.; Rybakov, M.; Lyakhovsky, V.; Hofstetter, A.; Tibor, G.; Goldshmidt, V.; Ben Avraham, Z. The structure, isostasy and gravity field of the Levant continental margin and the southeast Mediterranean area. Tectonophysics 2006, 425, 137–157. [Google Scholar] [CrossRef]
- Omran, M. Crustal modeling of the continental margin of the Nile Delta region. Ann. Geol. Surv. Egypt 2000, 23, 381–387. [Google Scholar]
- Boillot, G.; Froitzheim, N. Non-volcanic rifted margins, continental break-up and the onset of sea-floor spreading: Some outstanding questions. Geol. Soc. Spec. Publ. 2001, 187, 9–30. [Google Scholar] [CrossRef]
- Keen, C.E.; Dickie, K.; Dafoe, L.T. Structural characteristics of the ocean-continent transition along the rifted continental margin, offshore central Labrador. Mar. Pet. Geol. 2018, 89, 443–463. [Google Scholar] [CrossRef]
- Mjelde, R.; Raum, T.; Murai, Y.; Takanami, T. Continent-ocean-transitions: Review, and a new tectono-magmatic model of the Vøring Plateau, NE Atlantic. J. Geodyn. 2007, 43, 374–392. [Google Scholar] [CrossRef]
- Ranero, C.R.; Phipps Morgan, J.; McIntosh, K.; Relchert, C. Bending-related faulting and mantle serpentinization at the Middle America trench. Nature 2003, 425, 367–373. [Google Scholar] [CrossRef]
- Garcia, E.S.M.; Sandwell, D.T.; Bassett, D. Outer trench slope flexure and faulting at Pacific basin subduction zones. Geophys. J. Int. 2019, 218, 708–728. [Google Scholar] [CrossRef]
- Stern, R.J. Subduction initiation: Spontaneous and induced. Earth Planet. Sci. Lett. 2004, 226, 275–292. [Google Scholar] [CrossRef]
- Salamon, A.; Hofstetter, A.; Garfunkel, Z.; Ron, H. Seismotectonics of the Sinai subplate-The eastern Mediterranean region. Geophys. J. Int. 2003, 155, 149–173. [Google Scholar] [CrossRef]
- Sawires, R.; Peláez, J.A.; Fat-Helbary, R.E.; Ibrahim, H.A. A review of seismic hazard assessment studies and hazard description in the building codes for Egypt. Acta Geod. Geophys. 2016, 51, 151–180. [Google Scholar] [CrossRef]
- Geoffroy, L. Volcanic passive margins. Comptes Rendus Geosci. 2005, 337, 1395–1408. [Google Scholar] [CrossRef]
- Tari, G.; Kohazy, R.; Hannke, K.; Hussein, H.; Novotny, B.; Mascle, J. Examples of deep-water play types in the Matruh and Herodotus basins of NW Egypt. Lead. Edge 2012, 31, 741–872. [Google Scholar] [CrossRef]
- Séranne, M.; Anka, Z. South Atlantic continental margins of Africa: A comparison of the tectonic vs climate interplay on the evolution of equatorial west Africa and SW Africa margins. J. Afr. Earth Sci. 2005, 43, 283–300. [Google Scholar] [CrossRef]
- Pindell, J.; Graham, R.; Horn, B. Rapid outer marginal collapse at the rift to drift transition of passive margin evolution, with a Gulf of Mexico case study. Basin Res. 2014, 26, 701–725. [Google Scholar] [CrossRef]
- Sarhan, M.; Hemdan, K. North Nile Delta structural setting and trapping mechanism, Egypt. In Proceedings of the 12th EGPC, Egyptian General Petroleum Corporation Conference, Cairo, Egypt, 1994; pp. 1–18. [Google Scholar]
- Stanley, D.J.; Clemente, P.L. Increased land subsidence and sea-level rise are submerging Egypt’s nile delta coastal margin. GSA Today 2017, 27, 4–11. [Google Scholar] [CrossRef]
- Walley, C.D. Some outstanding issues in the geology of Lebanon and their importance in the tectonic evolution of the Levantine region. Tectonophysics 1998, 298, 37–62. [Google Scholar] [CrossRef]
- Jenkins, D. North and Central Sinai. In Geology of Egypt; Said, R., Ed.; Balkema: Rotterdam, The Netherlands, 1990; pp. 361–380. [Google Scholar]
- Hirt, C.; Rexer, M. 10,800 Spherical Harmonics. Int. J. Appl. Earth Obs. Geoinf. 2015, 39, 103–112. [Google Scholar] [CrossRef]
- Braitenberg, C.; Wienecke, S.; Ebbing, J.; Born, W.; Redfield, T.; Mariani, P. LithoFLEX Tutorial: User’s Manual; lithoFLEX Group: Trieste, Italy, 2008. [Google Scholar]
- Mann, P.; Gahagan, L.; Gordon, M.B. Tectonic setting of the world’s giant oil and gas fields. AAPG Mem. 2005, 78, 15–105. [Google Scholar] [CrossRef]
- Mohriak, W.; Talwani, M. Atlantic rifts and continental margins. In Geophysical Monograph Series; American Geophysical Union: Washington, DC, USA, 2000; Volume 115, p. 354. [Google Scholar]
- Wen, Z.; Xu, H.; Wang, Z.; He, Z.; Song, C.; Chen, X.; Wang, Y. Classification and hydrocarbon distribution of passive continental margin basins. Pet. Explor. Dev. 2016, 43, 740–750. [Google Scholar] [CrossRef]
- Hanafy, S.; Nimmagadda, S.L.; Mahmoud, S.E.; Mabrouk, W.M.; Farhood, K. Regional integrated interpretation of the hydrocarbon prospectivity of the Nile Delta, Offshore Egypt. Arab. J. Geosci. 2016, 9, 376. [Google Scholar] [CrossRef]
- El Diasty, W.S.; Peters, K.E.; Moldowan, J.M.; Essa, G.I.; Hammad, M.M. Organic geochemistry of condensates and natural gases in the northwest Nile Delta offshore Egypt. J. Pet. Sci. Eng. 2020, 187, 106819. [Google Scholar] [CrossRef]
- Keshta, S.; Metwalli, F.J.; Al Arabi, H.S. Analysis of petroleum system for exploration and risk reduction in abu Madi/Elqar’a gas field, Nile Delta, Egypt. Int. J. Geophys. 2012, 2012, 187938. [Google Scholar] [CrossRef]
- Pigott, J.D.; Abdel-Fattah, M.I. Seismic stratigraphy of the Messinian Nile Delta coastal plain: Recognition of the fluvial Regressive Systems Tract and its potential for hydrocarbon exploration. J. Afr. Earth Sci. 2014, 95, 9–12. [Google Scholar] [CrossRef]
- Abdel-Fattah, M.I.; Tawfik, A.Y. 3D geometric modeling of the Abu Madi reservoirs and its implication on the gas development in Baltim Area (Offshore Nile Delta, Egypt). Int. J. Geophys. 2015, 2015, 369143. [Google Scholar] [CrossRef]
- Nassar, M.; Matresu, J.; Talat, A.; Hasan, M. Abu madi reservoirs-evaluation of level-III remaining gas potential, Abu Madi and el Qara fields. In Proceedings of the Society of Petroleum Engineers-SPE North Africa Technical Conference and Exhibition, Cairo, Egypt, 14–16 September 2015. [Google Scholar]
- Leila, M.; Eslam, A.; El-Magd, A.A.; Alwaan, L.; Elgendy, A. Formation evaluation and reservoir characteristics of the Messinian Abu Madi sandstones in Faraskour Gas Field, onshore Nile Delta, Egypt. J. Pet. Explor. Prod. Technol. 2020, 11, 133–155. [Google Scholar] [CrossRef]
- Esestime, P.; Hewitt, A.; Hodgson, N. Zohr-A newborn carbonate play in the Levantine Basin, East-Mediterranean. First Break 2016, 34, 87–93. [Google Scholar] [CrossRef]
- Cozzi, A.; Cascone, A.; Bertelli, L.; Bertello, F.; Brandolese, S.; Minervini, M.; Ronchi, P.; Ruspi, R.; Harby, H. Zohr giant gas discovery—A paradigm shift in Nile Delta and East Mediterranean exploration. In Proceedings of the AAPG/SEG 2017 International Conference and Exhibition, London, UK, 15–18 October 2017. [Google Scholar]
- Wessel, P.; Smith, W.H.F.; Scharroo, R.; Luis, J.; Wobbe, F. Generic mapping tools: Improved version released. EOS 2013, 94, 409–410. [Google Scholar] [CrossRef]
- ESRI ArcGIS for Desktop. Geographic Information Systems (GIS) Software ESRI ArcGIS105 Version 10.2.1. 2018. Available online: http://www.esri.com/software/arcgis/arcgis-fordesktop (accessed on 11 April 2020).
- Crameri, F.; Shephard, G.E.; Heron, P.J. The misuse of colour in science communication. Nat. Commun. 2020, 11, 1–10. [Google Scholar] [CrossRef] [PubMed]


Publisher’s Note: MDPI stays neutral with regard to jurisdictional claims in published maps and institutional affiliations. |
© 2021 by the authors. Licensee MDPI, Basel, Switzerland. This article is an open access article distributed under the terms and conditions of the Creative Commons Attribution (CC BY) license (https://creativecommons.org/licenses/by/4.0/).