Abstract
Forest canopy height is an indispensable forest vertical structure parameter for understanding the carbon cycle and forest ecosystem services. A variety of studies based on spaceborne Lidar, such as ICESat, ICESat-2 and airborne Lidar, were conducted to estimate forest canopy height at multiple scales. However, while a few studies have been conducted based on ICESat-2 simulated data from airborne Lidar data, few studies have analyzed ATL08 and ATL03 products derived from the ATLAS sensor onboard ICESat-2 for regional vegetation canopy height mapping. It is necessary and promising to explore how data obtained by ICESat-2 can be applied to estimate forest canopy height. This study proposes a new means to estimate forest canopy height, defined as the mean height of trees within a given forest area, using a combination of ICESat-2 ATL08 and ATL03 data and ZY-3 satellite stereo images. Five procedures were used to estimate the forest canopy height of the city of Nanning in China: (1) Processing ground photons in a 30 m × 30 m grid; (2) Extracting a digital surface model (DSM) using ZY-3 stereo images; (3) Calculating a discontinuous canopy height model (CHM) dataset; (4) Validating the DSM and ground photon height using GEDI data; (5) Estimating the regional wall-to-wall forest canopy height product based on the backpropagation artificial neural network (BP-ANN) model and Landsat 8 vegetation indices and independent accuracy assessments with field measured plots. The validation shows a root mean square error (RMSE) of 3.34 m to 3.47 m and a coefficient of determination R2 = 0.51. The new method shows promise and can be used for large-scale forest canopy height mapping at various resolutions or in combination with other data, such as SAR images. Finally, this study analyzes resolutions and how to filter effective data when ATL08 data are directly used to generate regional or global vegetation height products, which will be the focus of future research.
1. Introduction
As essential terrestrial ecosystems, forests form an important part of the earth’s carbon cycle [1,2]. Forests not only play an indispensable role in various ecological and social services but also help maintain carbon balance and mitigate climate change, as they are considered carbon sinks [3,4,5,6,7]. The total carbon storage of forest is equivalent to 85% of total terrestrial stocks and 75% of total terrestrial gross primary production [8]. It is estimated that 50% of plant biomass is composed of carbon, and the estimated value of aboveground biomass (AGB) is used as a substitute for aboveground carbon [9]. The accurate estimation of terrestrial forest biomass is conducive to better understanding the crucial role of forests in the cycle of global carbon. Therefore, the accurate estimation of AGB can reduce the uncertainty of terrestrial carbon quantification [10,11]. However, for many current estimates of global carbon flux and biomass distribution in forests, there is still too much uncertainty due to the coarse estimation of vegetation structures for many scientific research and policy applications [10,12,13]. In regional or global mapping, the estimation of forest canopy height and AGB is directly related to the allometric growth equation. Therefore, improving the accuracy of forest canopy height estimation and enriching data sources are conducive to improving the accuracy of AGB estimation, which is an important research focus [14].
The remote sensing system has been regarded as an indispensable practical tool because of due to its large-scale coverage and repeated observations. The combination of remote sensing satellite image data with field-measured forest inventory data can promote the production of reliable and up-to-date forest canopy height products [15]. As an active remote sensing method, light detection and ranging (Lidar) transmits energy and records the backscattered energy from feature information of the earth’s surface. Lidar can extract three-dimensional attributes and provide vegetation metrics by converting the time taken for data to be transmitted from and returned to a sensor into distance measurements [16]. The precise three-dimensional structure data obtained from airborne and spaceborne Lidar and measurements of forest canopy height, forest volume, and canopy cover have been successfully and widely monitored and estimated at multiple spatial scales [16,17,18,19,20,21].
Forest canopy height extraction based on airborne Lidar can be conducted at the single tree scale and sample plot scale. Tree heights can be extracted by the discrete point cloud and canopy height model (CHM) obtained by airborne Lidar. Pang Yong established a univariate regression model using the height of the normalized point cloud (H75) and the measured tree height and compared and analyzed the effects of high- and low-density point clouds on the retrieved stand parameters [22]. Hirata used a watershed segmentation algorithm to identify individual trees from a CHM acquired by airborne Lidar [23]. The recognition rate of a single tree decreases with decreasing cutting intensity from 95.3% in severe logging areas to 60% in noncutting areas. Popescu extracted tree height and crown width measurements from a CHM obtained through airborne Lidar and established linear and nonlinear regression models with measured DBH, AGB and component biomass data (leaf and root) [16].
However, the airborne Lidar is mainly used on a small scale due to its high data acquisition costs, limited data acquisition range and use of large amounts of data, as well as being labor intensive and time consuming, and it is difficult to use for large-scale forest vertical structure information extraction and mapping [24]. The ICESat with the Geoscience Laser Altimeter System (GLAS), as a representative spaceborne Lidar system, provides global footprint height information and is widely used in the retrieval of forest canopy heights at regional and global scales [25,26,27]. Lefsky combined waveform data from the GLAS and the terrain index extracted from SRTM DEM data to correct the slope of waveform data for an area with a large slope, and improved the estimation accuracy of the regression model of the maximum forest height [28]. The RMSE of the models for the three research areas ranged from 4.85 m to 12.66 m.
The ICESat-2 with the Advanced Topographic Laser Altimeter System (ATLAS) was launched in September 2018 as a follow-up mission to ICESat and aims to measure the structural characteristics of forests at the global scale and to complement other spaceborne Lidar missions [29,30], including the European Space Agency P-band radar BIOMASS [31], the Global Ecosystem Dynamics Investigation Lidar (GEDI) [32], and NASA-ISRO Synthetic Aperture Radar(NISAR) missions [33]. ICESat-2 was designed to draw a global image of Earth’s third dimension with height measurements and track terrain changes, including those for sea ice, glaciers, forests, etc. (https://icesat-2.gsfc.nasa.gov/science), as well as the first spaceborne Lidar system ICESat GLAS. Therefore, it is necessary and meaningful to explore how data obtained by ICESat-2 can be applied to estimate forest canopy height or AGB.
Montesano explored the abilities and uncertainties of ICESat-2 photon counting data in estimating coniferous forest biomass according to different biomass gradients and sampling distances along the orbit [34]. The authors found the 50 m scale to be the optimal horizontal resolution of ICESat-2 model fitting, and the biomass level was 20 Mg/ha with the estimation error of 20% to 50%. Gwenzi evaluated the potential of ATLAS data use for canopy height extraction from savanna ecosystems [14]. The authors found the correlation between canopy height extracted from the MATLAS simulator, which generates ATLAS-like data, and that from discrete return Lidar (DRL) to be weaker than that from Multiple Altimeter Beam Experimental Lidar (MABEL, an airborne photon counting Lidar sensor) data and predicted that the number of signal photons in spaceborne ATLAS data would be greatly reduced, causing the accuracy of canopy height estimation to decrease. Narine used simulated ICESat-2 photon counting Lidar data to generate point cloud data with the same along-orbit segmentation length as the ICESat-2 land vegetation product (ATL08), 100 m [15]. The relationship between photon counting vegetation products and forest AGB and canopy coverage obtained by airborne Lidar was analyzed in no-noise scenes, daytime scenes and night scenes [15]. Neuenschwander presented ATLAS data and verified the accuracy of its ground elevation [35,36,37]. The RMSE value of ground elevation data obtained from the ATLAS is 0.85 m, which is lower than that of the Space Shuttle Radar topographic survey mission (SRTM).
However, few studies have used ICESat-2 vegetation height products to extrapolate and map regional vegetation canopy height [38,39], and most of them are based on ICESat-2 simulation data of airborne Lidar. The purpose of this paper is to explore ways to use the ATL08 and ATL03 products to map regional forest canopy heights with a 30 m resolution. There are many definitions of forest canopy height. Forest canopy height in this study refers to the mean height of trees within a given forest area. In this study, ICESat-2 ATLAS photon data and ZY-3 stereo image pair data are combined to generate a discontinuous CHM dataset. GEDI data are used to verify the accuracy of ground photon elevation and the DSM. The CHM is used to create a training sample, and the BP-ANN model is used to generate a forest canopy height map of the city of Nanning. Finally, this study analyzes resolution and how to filter effective data that emerge when ATL08 data are directly used to generate regional or global vegetation height products, which will be the focus of future research.
2. Materials and Methods
2.1. Description of the Study Area
Nanning, located in the south-central area of Guangxi, is the capital of the Guangxi Zhuang Autonomous Region. Geographically, Nanning is located between 22°13′ and 23°32′ north and 107°45′ and 108°51′ east with a total land area of 22,100 km2 (Figure 1). Nanning consists of eight administrative regions (municipal districts and the Yongning, Mashan, Binyang, Longan, Wuming, Shanglin, and Heng counties). Elevation in the study area ranges from 70 m to 600 m, and flat land is the main geomorphic type, accounting for 57.78% of the total area. The climate in Nanning is a subtropical monsoon with average annual precipitation levels ranging from 1241 mm to 1753 mm, and the average annual temperature is approximately 21.6 °C [40]. Additionally, the presence of abundant water and heat resources render Nanning rich in forest resources. The main tree species present are eucalyptus, masson pine and cunninghamia lanceolata. According to the results of the fifth Guangxi forest resources survey, in 2016, the forested area of Nanning reached 1,050,000 hectares, and the forest volume reached 51.99 million cubic meters (http://search.nanning.gov.cn/).
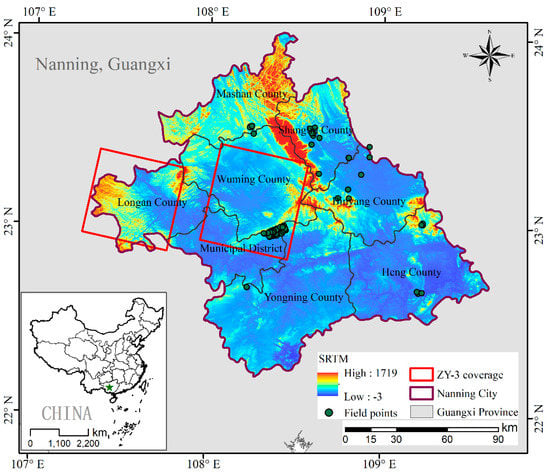
Figure 1.
Location of the city of Nanning, the study area. The spot mark denotes the position of the field survey sample. Red boxes show the locations of ZY-3 coverage. The Shuttle Radar Topography Mission (SRTM) refers to the value of the elevation product collected by a C-band radar interferometry system.
2.2. Data Collection
2.2.1. ICESat-2 ATLAS
The Advanced Topographic Laser Altimeter System (ATLAS) aboard ICESat-2 emits three pairs of beams with a spacing of 3.3 km and with a distance of approximately 90 m between the two beams. A pair consists of a strong and a weak beam. The diameter of the footprint is 14 m to 17 m and, the sampling interval along the track is set to 70 cm to facilitate intensive sampling and better capture elevation changes [29].
ATL01 to ATL21 contain three levels of ICESat-2 mission products. The Level-2 product of global geolocated photons (ATL03) measures the latitude, longitude, time and absolute height above the World Geodetic System 1984 (WGS84) for each photon [41]. ATL03 provides photon information for all Level-3A products such as land, ice elevation (ATL06), Arctic/Antarctic sea ice elevation (ATL07), land, water and vegetation elevation (ATL08) data [42]. The corresponding data of three pairs of laser beams are numbered gt1l-gt3r, representing the six ground tracks (GT) from left to right. ATL08 provides terrain, canopy height, and canopy cover parameters at an along-track segment of 100 m, while the 100 m segment consists of 5 sequential 20 m segments labeled with segment IDs in ATL03 and ATL08 [43]. The canopy height was calculated by the 98% height of all individual relative canopy heights, which is derived from a surface fitting line and vegetation surface fitting line within a 100 m segment. ATL08 provides a photon classification label (Noise, Ground, Canopy, and Top of Canopy), and the labeling of ground photons is crucial for this study. In this study, ATL03 and ATL08 data were utilized in combination where ATL03 provided height and coordinate information while ATL08 provided photon classification information. ATL03 and ATL08 data were downloaded from the National Snow and Ice Data Center (NSIDC, https://nsidc.org/data/ATL03/versions/1, https://nsidc.org/data/ATL08/versions/1) (Table 1 and Table 2). ICESat-2 ATL03 and ATL08 data for the whole study area were acquired from October 30, 2018 to April 9, 2019, and data overlap with the locations of ZY-3 data for October 30, 2018 to November 03, 2018 (Table 1, Figure 2).

Table 1.
Details of the ICESat-2, ZY-3, Landsat-8 and Global Ecosystem Dynamics Investigation Lidar (GEDI) satellite data.
Table 2.
Comparison of the ATLAS aboard ICESat-2 to the GEDI aboard the International Space Station (ISS) and the Geoscience Laser Altimeter System (GLAS) aboard ICESat [15,29].
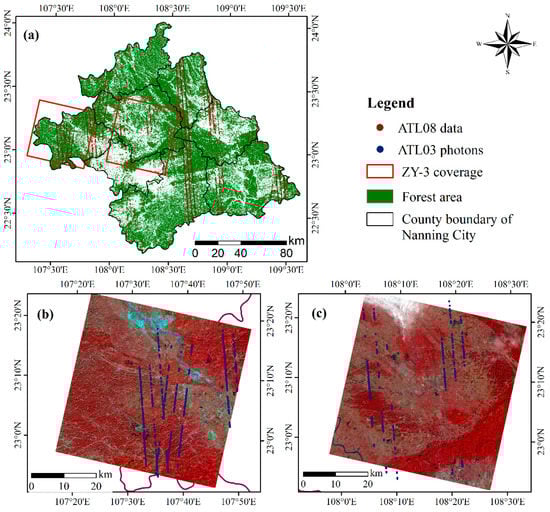
Figure 2.
ICESat-2 ATLAS ground tracks within the city of Nanning (a shows the distribution of ATL08 data in the study area, b and c show the distribution of ATL03 photons and ZY-3).
2.2.2. ZY-3 Data
The ZY-3 satellite, the first civil cartographic satellite designed for stereo photogrammetry in China launched in 2012, can measure ground heights and is mainly used for 1:50,000 topographic maps. Applying ZY-3 stereo image data for forestry research can generate a large area continuous digital surface model (DSM), which can effectively prevent errors caused by the spatial interpolation of discrete points. ZY-3 carries three panchromatic sensors pointing in the nadir, backward, and forward directions with resolutions of 2.1 m × 2.1 m, two 3.5 m × 3.5 m, respectively, and one multispectral sensor that consists of four bands (near infrared, red, green, and blue) with a resolution of 5.8 m × 5.8 m [44]. The ZY-3 02 satellite launched in 2016 is an upgraded successor of ZY-3 that have improved resolution of backward and forward panchromatic sensors from 3.5 m × 3.5 m to 2.7 m × 2.7 m [45]. ZY-3 and ZY-3 02 have the same ground swath of approximately 50 km × 50 km, and the same radiometric resolution of 10 bits [46].
In this study, the ZY-3 and ZY-3 02 image data were downloaded from the China Centre for Resources Satellite Data and Application (CRESDA, http://www.cresda.com/CN/) with the acquisition period set to 10 March 2018 to 5 October 2018 considering data availability and cloud cover (Table 1). Due to the presence of considerably more mountain shadows in forward view scenes, nadir and backward view panchromatic scenes were utilized to extract the DSM while using multispectral scenes to extract the forest area.
2.2.3. Landsat 8 Operational Land Imager Data
Landsat 8 with the Operational Land Imager (OLI) sensor provides satellite images with wavelengths of 0.43 μm to 1.38 μm. OLI images were obtained from the United States Geological Survey (USGS, https://glovis.usgs.gov/) on 31 October 2018 and 6 October 2018 (Table 1). The three scenes show less than 5% cloud cover. Bands 1–7, which contain four visible bands, one near infrared band and two shortwave infrared bands with a resolution of 30 m × 30 m, were utilized to extract the forest area by maximum likelihood classification (MLC) to calculate the vegetation indices and to estimate the forest canopy height of the study area. Preprocessing operations used included geometric correction, radiometric calibration, and atmospheric correction by the Fast Line-of-Sight Atmospheric Analysis of Hypercubes (FLAASH) module in ENVI to eliminate atmospheric effects.
This study refers to the existing literature, and a total of ten indices are selected for analysis [44,47,48], including MSR, SLAVI, NDVI, and others (Table 3).
Table 3.
Vegetation indices and formula based on Landsat 8 OLI data. Tasseled Cap Transformation is abbreviated as TCT.
2.2.4. GEDI
The Global Ecosystem Dynamics Investigation (GEDI), the first spaceborne Lidar system designed specifically for studies of forest structures and launched in 2018, is an Earth Venture Instrument (EVI) developed by NASA and equipped with three lasers and full waveform recording Lidar instrument aboard the International Space Station (ISS) [56,57]. The GEDI operates at 1064 nm and produces eight beam ground tracks spaced approximately 600 m apart in the cross-track direction and sampling approximately 60 m along a track from a 4.2 km wide swath. Each footprint reflects Lidar energy with a diameter of approximately 30 m and a vertical measurement accuracy level of approximately 2–3 cm [57,58]. GEDI L2A product data with ground elevation and relative height (RH) metrics were taken from NASA’s Land Processes Distributed Active Archive Center (LPDAAC, https://e4ftl01.cr.usgs.gov/GEDI/GEDI02_A.001/) using GEDI Finder to locate GEDI orbits (files) that intersect with the study area. GEDI data for 29 April 2019 to 1 October 2019 were acquired as the only GEDI data available for the study area when this study was conducted (Table 2). The GEDI ground tracks are displayed in Figure 3.
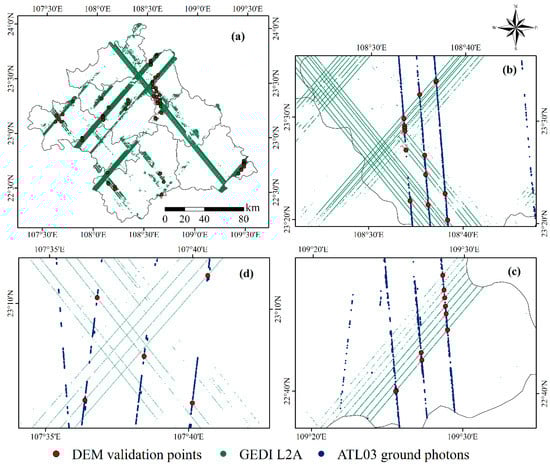
Figure 3.
GEDI and ICESat-2 ground tracks. Red dots indicate that the ground photons average value and the GEDI footprint are located within the same 30 m × 30 m pixels of Landsat 8 images, that is, the intersection points (more details are in Section 2.3.1). In pictures (a–d), red dots denote the same. (a) shows the overall distribution while (b–d) show enlarged displays. The green lines in all images are made up of dense GEDI footprints.
2.2.5. Field Plots and Auxiliary Data
A total of 66 field plots for 15 to 21 January 2018 were obtained to implement an independent accuracy assessment of estimated canopy height. Every field plot covers a 30 m × 30 m square area with information on measured mean canopy height and other forest structure parameters (Figure 1). Considering the economic costs and availability of field survey data, some of the field measurement points are scattered across the study area and the rest are concentrated within the Gaofeng forest farm. All trees with a diameter at breast height (DBH) of greater than 5 cm in each plot were recorded. The forest canopy height of each tree was derived from distance and angle measurements. Distance was measured by a hand-held laser range finder, and angles were measured by a mechanical clinometer. The forest canopy height of the recorded trees was used to calculate the mean canopy height of each square. The coordinates of the southwest and northeast corners of each plot were recorded by GPS, and the center points of the two recorded points were calculated and was taken as the plot coordinates.
SRTMGL1 data were used in collecting ground control points (GCPs) during the extraction of the DSM with ZY-3 data and were taken from NASA. The georeferenced image provides accurate coordinate information used for ZY-3 and Landsat 8 in the geometric correction.
2.3. Methods
A new canopy height estimation method was developed by combining the ICESat-2 ATLAS data with ZY-3 stereo images. Figure 4 shows the flowchart for this study which consists of five sections: (1) Calculating the elevation of ground photons in 30 m × 30 m pixels; (2) Extracting the ZY-3 DSM; (3) Producing a discontinuous canopy height model (CHM) dataset after validation; (4) Estimating the forest canopy height by the BP-ANN model; and (5) Assessing the accuracy of the estimated canopy height map.
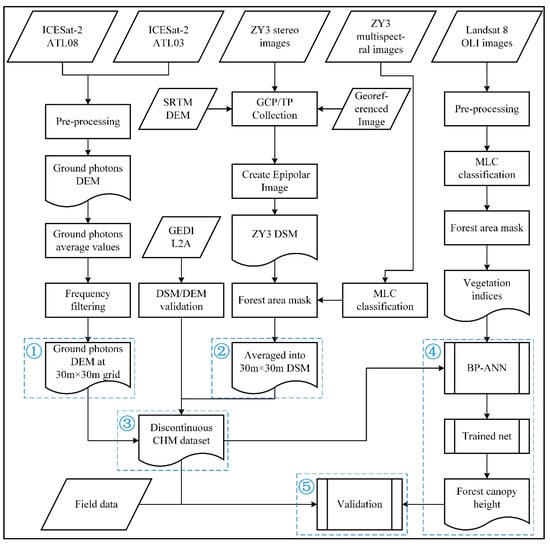
Figure 4.
Methodology flowchart. The sequence of the five main steps is numbered and highlighted.
2.3.1. Processing ICESat-2/ATLAS ATL08 and ATL03 Data
Light beams from the ATLAS laser hits the earth’s surface, and a handful of photons are then reflected back to the laser. The number of returning photons depends on the outgoing energy, solar and atmospheric conditions and on surface reflectance. The number of ground photons is significantly greater than that of vegetation because the reflectance of the terrain surface is typically approximately 0.3, which is higher than 0.1 of vegetation [43]. The ATL03 data product not only provides basic information on photons (latitude, longitude, and height of the WGS84 ellipsoid) but also extracts signal photons from noise photons. In producing the ATL08 data product, further filtering techniques to remove noise photons, ground finding filter, and canopy top filter were conducted orderly to label all the signal photons in ground, canopy and noise, respectively.
In this study, ground photons were used as the DEM to provide land surface height information. Densely distributed ground photons were resampled into a 30 m × 30 m grid with an average ground photon height (Figure 5). As a result, a total of 409,515 ground photons were processed into 22,437 new points. Then, if the number of ground photons in a 30 m × 30 m grid was less than 4, the new point was deemed ineffective and was removed since the expected number of signal photons per laser for the vegetated surface is 0 to 4 photons [43]. For example, “p5” shown in Figure 5c was removed.
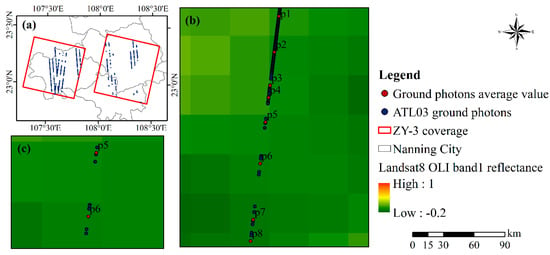
Figure 5.
Examples of locations of ground photons and ground photon average values within a 30 m × 30 m grid. Grid division is based on the row and column IDs of Landsat 8 data. The scale bar at the bottom right of the image matches that shown in (a). (a) shows the spatial distribution of ATL03 ground photons and ZY-3 data, and (b,c) are the positions of ground photons average value and ground photons in each pixel.
2.3.2. Extracting the DSM
The digital surface model (DSM) was derived from ZY-3 and ZY-3 02 stereo images using PCI Geomatica Banff 2019 software with the OrthoEngine module. A nadir and backward-looking stereo pair with an inclination angle of ±22°–23.5° between the sensors was used for processing due to the presence of fewer mountain shadows. The OrthoEngine module’s main purpose is to compute a math model that associates columns and rows of the matched pixels with ground coordinates (X, Y) and elevations (Z) using rational polynomial coefficients (RPCs), GCPs and tie points (TPs) [45]. The RPC file was distributed with the ZY-3 data file. The Semi-Global Matching (SGM) algorithm was used in the module to match pixels [46]. A total of 92 GCPs and 62 TPs were collected automatically at a variety of elevations with less than two pixel residual errors, meeting the recommended minimum value requirements [59]. The resolution of the output DSM was set to 2 m × 2 m to maintain surface details and preserve precision [44,45].
A two-step mask extraction operation was implemented to obtain the effective DSM: (1) The score band of PCI output can specify the reliability of DSM values, and values of 90 to 100 denote a good pixel; and (2) The forest area of ZY-3 coverage was classified by MLC using ZY-3 multispectral images. To meet the 30 m × 30 m resolution mapping requirement, the average value of the 30 m × 30 m grid was calculated for subsequent processing.
2.3.3. Calculating a Discontinuous CHM Dataset
In a large number of studies, a CHM is obtained by subtracting DSM and DEM layers. However, the existing high-precision and high-resolution DEM is mostly obtained via ground point cloud fitting using airborne Lidar, and the DSM is obtained from the vegetation surface fitted by stereo image pairs or vegetation point clouds. In this study, the ground photon height of spaceborne Lidar is used as the DEM, making it possible to use the point sampling DEM of spaceborne Lidar, which could be applied for large-scale and high-efficiency CHM sampling and regional or global canopy height mapping.
The DSM derived from ZY-3 data and by subtracting calculated ground photons’ average height values provides a discontinuous CHM dataset as canopy height samples. Figure 6 shows the profile of the discontinuous CHM dataset. The heights of all the data were based on the WGS 84 ellipsoid. Red, purple, and back dots represent the ZY-3 DSM, ground photon DEM, and original ground photons, respectively. Distances between red and purple dots denote canopy heights. Similarly, ZY-3 and Landsat 8 forest areas were used as masks to extract effective CHM samples. A total of 1229 CHM points were derived after filtering.
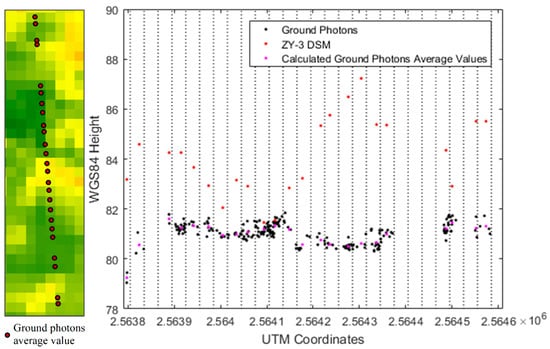
Figure 6.
The vertical section profile of the discontinuous canopy height model (CHM) dataset. The interval between the dotted lines indicates a grid resolution of 30 m.
2.3.4. Validating ZY-3 DSM and Ground Photon Values via GEDI
The evaluation of ZY-3 DSM and ground photon average value accuracy is necessary for further analysis. The waveform for each footprint was processed to determine terrain elevations and canopy heights relative to the WGS84 ellipsoid. The elevation of the center of the lowest mode from the Gauss fitting curve of return energy was used to validate the accuracy of the ground photons’ average height values while the elevation of the highest detected return was used to validate that of the ZY-3 DSM.
We assume the following: if the grid of 30 m resolution Landsat data in which GEDI footprint points are located is the same as the grid of newly calculated ground photon values, they are considered to be intersected, that is, the same point. To obtain as many intersection points as possible, all GEDI data for April to October 2019 that are currently open access were downloaded. The GEDI DEM corresponding to these intersection points was used to verify the average height values of ground photons. In total, 61 intersection points were extracted (Figure 3).
2.3.5. BP-ANN Modeling, Extrapolation and Validation
The Backpropagation—Artificial Neural Network (BP-ANN) was used to model the relationship between canopy height and vegetation indices derived from Landsat data and to predict canopy height. More than 30 types of neural networks, such as black-box algorithm models, have been developed since the first prototype was proposed [60,61]. This model has been widely used in various fields due to its powerful prediction and forecasting capabilities [60,62,63,64].
For model building, a three-layer BP neural network model with 10 input layer neurons, 11 hidden layer neurons and one output layer was constructed. The ten vegetation indices were used as input layers. In total, 80% of the model training samples were randomly selected from the discontinuous CHM dataset for a total of 983 samples. The “scikit-learn” package in python was used to implement BP-ANN model training. A wall-to-wall forest canopy height map was derived by extrapolating the BP-ANN model to the whole study area with ten vegetation index bands.
For accuracy evaluation, the mapping accuracy of canopy heights was independently validated using three validation datasets that consist of the remaining 20% CHM dataset, a total of 66 field plots, and their combination. The root mean square error (RMSE) was calculated to quantify the error of the estimated forest canopy:
where n represents the number of samples in the validation dataset, Hi represents the actual canopy height value and true value, and the represents the predicted canopy height values.
3. Results
3.1. The DSM and Discontinuous CHM
Figure 7 shows the photon classification results of some ATL08 samples. The ground photons shown in Figure 7 and the DSM are used to calculate the discontinuous CHM. Figure 8a,b shows the DSM results derived from the PCI Geomatica Banff, which represents the absolute height based on the WGS84 ellipsoid of the earth’s surface. The holes shown in the Figure are composed of three parts: (1) the failed pixels obtained when extracting DSM from the stereo image pair; (2) the nonforest area corresponding to the ZY-3 multispectral image; and (3) the nonforest area corresponding to the Landsat 8 multispectral image.
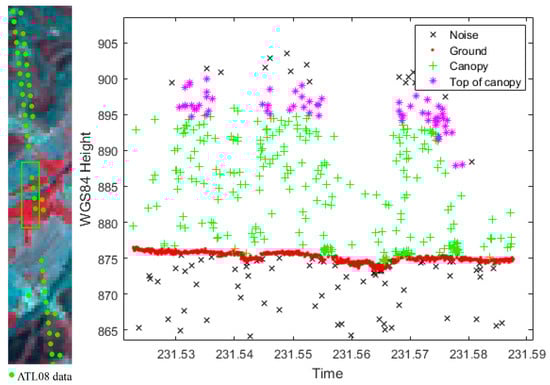
Figure 7.
Photon classification map (on the right) corresponding to atl08 data (on the left).
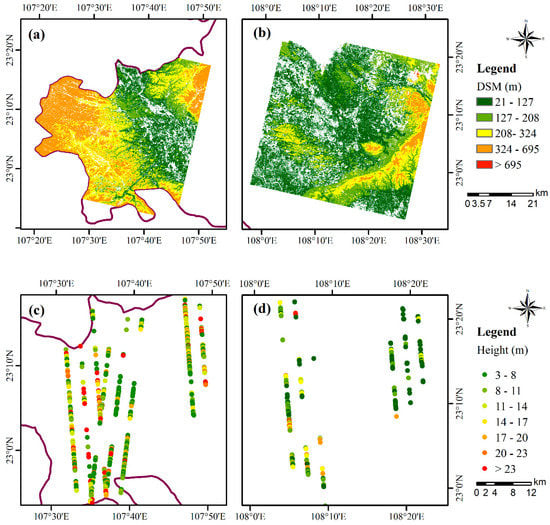
Figure 8.
ZY-3 DSM masked by two forest area masks and score bands. Discontinuous CHM dataset calculated by DSM subtracting ground photon values. (a,b) shows the distribution of DSM, and (c,d) shows the distribution of discontinuous CHM dataset.
Figure 8c,d show the distribution and value of the discontinuous CHM dataset, which was used for the training samples and some of the independent validation samples. The statistical values of the canopy height distributions of each height range show 370 (30.11%), 238 (19.37%), 183 (14.89%), 147 (11.96%), 107 (8.71%), 61 (4.96%) and 123 (10.01%) samples with height ranges of 3 to 8 m, 8 to 11 m, 11 to 14 m, 14 to 17 m, 17 to 20 m, 20 to 23 m, and more than 23 m, respectively (Table 4). This feature shows that the CHM dataset is representative for subsequent modeling and canopy height mapping.
Table 4.
Statistical table of forest canopy height in discontinuous CHM dataset.
3.2. Comparison of DSM and Ground Photon Values with GEDI Data
The 61 points shown in Figure 9a are the points at which the newly calculated average elevation of ground photons intersects with the GEDI footprint for the whole study area. The validation result for ground photon elevation with GEDI terrain elevation shows a coefficient of determination R2 = 0.995 and an RMSE = 5.73 m. Even though the RMSE is high, which is explained further blow, more than 50% of the points in Figure 9a have the difference within ± 3 m between ground photon elevation and GEDI terrain elevation. The validation results of the ZY-3 DSM with GEDI land surface elevation show an R2 = 0.991 and an RMSE = 6.59 m. The validation results for ground photon elevation with the SRTM DEM shows an R2 = 0.997 and an RMSE = 6.76 m (Table 5).
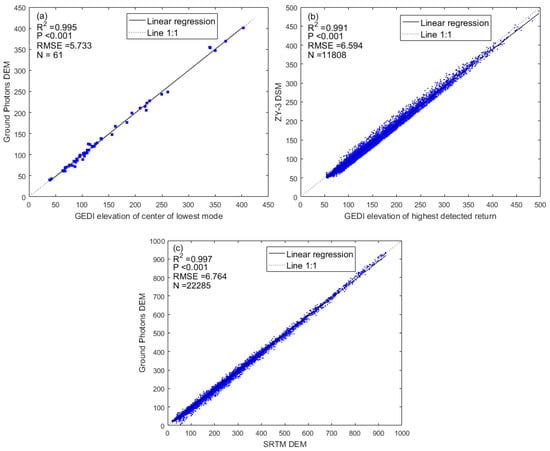
Figure 9.
Comparison of DSM and ground photon average height values with GEDI data. (a) shows the relationship between GEDI terrain elevation and ground photon terrain elevation; (b) shows the relationship between GEDI land surface elevation and ZY-3 DSM; (c) shows the relationship between the SRTM DEM and ground photon terrain elevation.).
Table 5.
Statistical results of comparison of DSM and ground photon average height values with GEDI data.
Errors of the three precision verifications mentioned above mainly result from the following: (a) There is a deviation in the data acquisition time, as the GEDI only has data for 2019. (b) Figure 9b shows that the scatter fitting line is below 1:1 because the highest point of the first return Gaussian fitting peak of GEDI full waveform data represents the top of vegetation, which is significantly different from the capacity for ZY-3 stereo images to capture the top of vegetation and which is caused by the difference in sensor imaging. (c) The different sensors have varied effects. In this study, the 30 m × 30 m resolution ground photon elevation is calculated, and the spot diameter of the GEDI is exactly 30 m. (d) Terrain factors will significantly affect the reliability of waveform data. When data conditions permit, a more reliable verification result will be obtained by applying airborne Lidar in the study area.
3.3. Forest Canopy Height Mapping and Independent Validation
Figure 10 shows the forest canopy height estimated by the BP-ANN with training samples of the discontinuous CHM dataset. The estimated forest canopy height range of 3 m to 34 m is similar to the field measured forest canopy height range of 6.2 m to 29.2 m. Across the study area, forest canopy heights of 11 to 14 m accounted for the largest proportion. The spatial distribution of the estimated forest canopy height was found to be related to the elevation of the study area. The height of the forest canopy in mountainous areas of elevations of greater than 300 m is more than 11 m as opposed to that in bare area. Due to the effects of human activities and urban expansion, the spatial distribution of forests in plain areas is relatively fragmented while the distribution of forests in mountainous areas is relatively continuous. Most of the latter are evergreen coniferous forests with a long cutting period and evergreen broad-leaved forests with a short cutting period, such as eucalyptus forests. In addition, the unique karst landforms in Guangxi, especially in Longan County in western Nanning, are mostly distributed across natural forests because they cannot be used as cultivated land. The distribution of forest canopy height is random and is not as uniform as that of artificial forest.
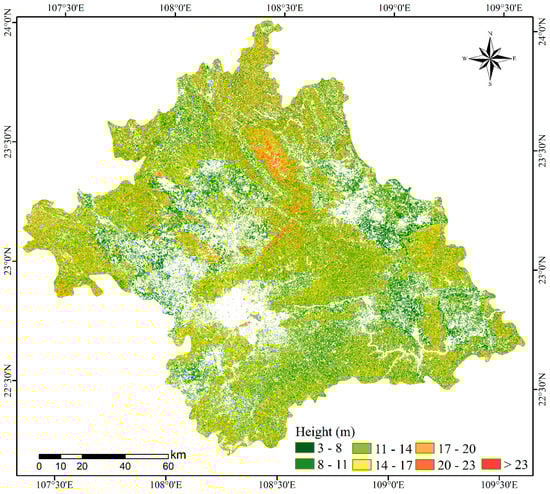
Figure 10.
Forest canopy height estimated by the BP-ANN with training samples of the discontinuous CHM dataset.
Figure 11 shows scatter plots of independent accuracy validation for the estimated forest canopy height using 20%, a total of 257 CHM datasets, 66 field measured plots, and a combination of them. The elevation of field measured plots varies from 90 m to 402 m, with slopes of 1° to 36°. The age of the forest ranges from 2 years to 56 years, which was estimated by local forestry experts in the field. The average forest canopy height of field measured plots is 13.32 m. The validation results shown in Figure 11a–c present an R2 = 0.51 and an RMSE of 3.34 m for part of the discontinuous CHM dataset, an R2 = 0.51 and an RMSE of 3.47 m based on field measured plots, an R2 = 0.51 and an RMSE for 3.38 m based on the combination of both, respectively, demonstrating the effectiveness of the BP-ANN model (Table 6).
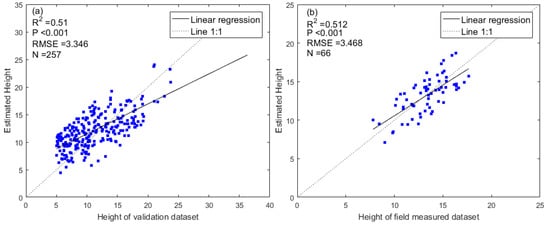
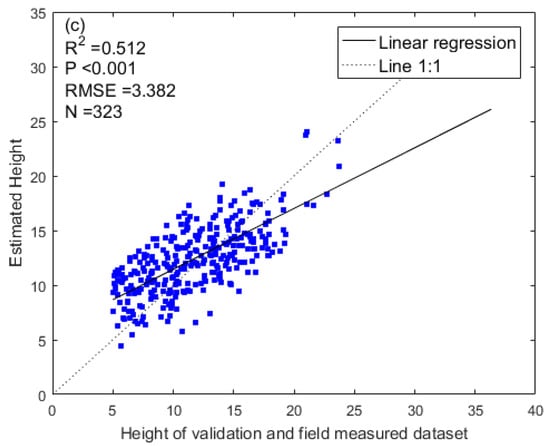
Figure 11.
Independent accuracy validation for the estimated forest canopy height. Blue dots in (a) were derived from part of the CHM dataset; blue dots in (b) were derived from field measured plots; (c) combines the blue dots from (a,b).
Table 6.
Statistical results of comparison of DSM and ground photon average height values with GEDI data.
4. Discussion
4.1. Large Scale Forest Canopy Height Mapping
We identified a new means to estimate forest canopy height using a combination of ICESat-2 ATLAS data and stereo-photogrammetry. This method uses spaceborne Lidar ICESat-2 ATLAS data to replace airborne Lidar data and in turn obtain ground elevation information. Its low cost, unlimited data acquisition range, and global sampling range allow it to be the ability to be applied to a wider range. Given our successful application of this method to a study area in Nanning, it can be used over large scales, such as regional and global forest canopy height mapping. In addition to the stereo image pairs provided by the ZY-3 satellite, China’s first submeter high-resolution optical transmission stereo mapping satellite GF-7 can provide high-precision stereo image pair data for superimposing ICESat-2 data to estimate global forest canopy height. Although GF-2 was not designed as a photogrammetric system, some studies have made use of the different orbit data from GF-2 in repeated observation areas to realize stereo observation and extract DSM data [65].
Additionally, other techniques such as radargrammetry can produce a DSM by using SAR images to replace the DSM derived from ZY-3 in this study [44,45]. In addition to ICESat-2, the GEDI can provide surface elevation information as a DEM [32,57,58].
In addition, to obtain mapping results with the same resolution as those of Landsat, 30 m × 30 m grid is used to process ground photons. If we want to obtain a lower resolution result, such as those of the Moderate Resolution Imaging Spectroradiometer (MODIS), this is feasible, but for higher resolution mapping, we should consider enough ground photons to increase the accuracy and reliability of the DEM. Further analysis and research are needed.
4.2. How to Filter Effective ATL08 Data
The canopy height values provided by ATL08 data can be used as samples to directly generate a wall-to-wall forest canopy height map. Since the resolution of ATL08 data is 100 m, ATL08 data are not suitable for vegetation mapping at a 30 m resolution as with Landsat data, and should be used to map at resolutions of greater than 100 m to eliminate errors caused by position deviations. The selection of effective ATL08 data is a key problem. These two fitting lines are highly dependent on the accuracy of photon classification, creating inevitable errors in the canopy height values of ATL08.
Our numerical analysis shows that, for ATL08 data of the study area, 6% of canopy height values are greater than 50 m, which can be considered invalid values. These invalid values may originate from the low precision surface and vegetation surface curves fitted by sparse signal photons, or even attribute values obtained by interpolation. For the remaining 94% of the data, even if we use the rest of the ATL08 data fields (such as clouds, snow, and urban areas) to exclude the influence of land surface types and clouds, the reliability of canopy height data is affected by many other factors. For instance, (1) irregular topography increases photon classification errors, and (2) when the photon signal of a surface or vegetation is weak and the number of point clouds is small, the fitting error of the surface curve will increase.
Many uncertain factors make it difficult to automatically filter effective data when data are used in regional mapping. Figure 12 shows a frequency statistics histogram of canopy and ground photons. We suggest that canopy and ground photon numbers be used as a basis for screening effective ATL08 data, as the stronger the photon signal, the smaller the error becomes. However, determining the photon number threshold with universal or adaptive rules is an issue worthy of future research.
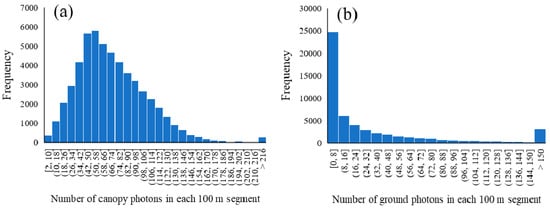
Figure 12.
Frequency statistics histogram of canopy and ground photons. The x-axis in (a,b) represents the number range of signal photons (canopy and ground photons), and the y-axis in (a,b) represents the frequency of signal photons within 100 m segments of all ATL08 records in the study area.
5. Conclusions
This study proposes a new means with which to estimate forest canopy height, which used a combination of ICESat-2 ATLAS data and ZY-3 stereo images to extract a discontinuous CHM dataset as training samples and extrapolated the BP-ANN model to the whole study area with ten vegetation index bands from Landsat 8 images. Ground photons of ATL08 and ATL03 were recalculated to obtain the average terrain height value for a 30 m × 30 m grid. A discontinuous CHM dataset was derived from the ZY-3 DSM by subtracting new ground photon heights. The accuracy of the ZY-3 DSM and ground photons’ average values was evaluated by GEDI data. The validation results show an R2 of greater than 0.991 and an RMSE of approximately 6 m, and the source of the observed error was discussed in detail. Regional forest canopy height mapping with a resolution of 30 m was executed based on the BP-ANN model using the CHM dataset as a training sample combined with vegetation indices from Landsat 8 data. The independent accuracy validation for the estimated forest canopy height shows an R2 = 0.51 and an RMSE from 3.34 m to 3.47 m based on part of the CHM dataset and field measured plots.
This paper presents a very promising means to map forest canopy heights at regional and global scales. It uses spaceborne Lidar data instead of airborne Lidar data to provide terrain information at a low cost and with global coverage. In the future, other types of data, such as radar image generating DSM and GEDI providing ground information can adopt the method used in this work, which will be conducive to the realization of multiple data sources that complement each other and work together to map regional forest canopy heights. Methods of selecting effective ATL08 data to extrapolate a wall-to-wall forest canopy height should be the focus of future research work.
Author Contributions
Conceptualization, X.L. and C.C.; methodology, X.L.; software, X.L.; validation, M.X., X.L., B.X., and Z.H.; formal analysis, X.L.; investigation, X.L., Z.H. and B.X.; resources, M.X.; data curation, X.L.; original draft preparation, X.L.; paper review and editing, B.B.; visualization, B.B. and Y.D.; supervision, C.C.; project administration, M.X., C.C., and Y.D.; funding acquisition, M.X. All authors have read and agreed to the published version of the manuscript.
Funding
This research was funded by the National Key R&D Program of China (No. 2017YFD0600903) and the Key Research and Development Program of Jiangxi, China (20181BBG70036).
Acknowledgments
We acknowledge the contributions of Huabing Huang of Sun Yat-sen University, Wenjian Ni of the Aerospace Information Research Institute (CAS), and Yao Wang of the Institute of Geographical Sciences and Natural Resource Research (CAS) for their valuable suggestions regarding this paper.
Conflicts of Interest
The authors declare no conflict of interest.
References
- Lu, D. The potential and challenge of remote sensing-based biomass estimation. Int. J. Remote Sens. 2006, 27, 1297–1328. [Google Scholar] [CrossRef]
- McKinley, D.C.; Ryan, M.G.; Birdsey, R.A.; Giardina, C.P.; Harmon, M.E.; Heath, L.S.; Houghton, R.A.; Jackson, R.B.; Morrison, J.F.; Murray, B.C.; et al. A synthesis of current knowledge on forests and carbon storage in the United States. Ecol. Appl. 2011, 21, 1902–1924. [Google Scholar] [CrossRef]
- Bonan, G.B. Forests and climate change: Forcings, feedbacks, and the climate benefits of forests. Science 2008, 320, 1444–1449. [Google Scholar] [CrossRef] [PubMed]
- Coomes, D.A.; Allen, R.B. Mortality and tree-size distributions in natural mixed-age forests. J. Ecol. 2007, 95, 27–40. [Google Scholar] [CrossRef]
- Dixon, R.K. Carbon pools and flux of global forest ecosystems. Science 1994, 265, 185–190. [Google Scholar] [CrossRef] [PubMed]
- Magnussen, S.; Naesset, E.; Gobakken, T. Prediction of tree-size distributions and inventory variables from cumulants of canopy height distributions. Forestry 2013, 86, 583–595. [Google Scholar] [CrossRef]
- Saarinen, N.; Kankare, V.; Vastaranta, M.; Luoma, V.; Pyorala, J.; Tanhuanpaa, T.; Liang, X.L.; Kaartinen, H.; Kukko, A.; Jaakkola, A.; et al. Feasibility of Terrestrial laser scanning for collecting stem volume information from single trees. ISPRS J. Photogramm. Remote Sens. 2017, 123, 140–158. [Google Scholar] [CrossRef]
- Pan, Y.D.; Birdsey, R.A.; Phillips, O.L.; Jackson, R.B. The Structure, Distribution, and Biomass of the World’s Forests. Annu. Rev. Ecol. Evol. Syst. 2013, 44, 593–622. [Google Scholar] [CrossRef]
- Nelson, R.; Gobakken, T.; Naesset, E.; Gregoire, T.G.; Stahl, G.; Holm, S.; Flewelling, J. Lidar sampling—Using an airborne profiler to estimate forest biomass in Hedmark County, Norway. Remote Sens. Environ. 2012, 123, 563–578. [Google Scholar] [CrossRef]
- Hese, S.; Lucht, W.; Schmullius, C.; Barnsley, M.; Dubayah, R.; Knorr, D.; Neumann, K.; Riedel, T.; Schroter, K. Global biomass mapping for an improved understanding of the CO2 balance—The Earth observation mission Carbon-3D. Remote Sens. Environ. 2005, 94, 94–104. [Google Scholar] [CrossRef]
- Le Toan, T.; Quegan, S.; Davidson, M.W.J.; Balzter, H.; Paillou, P.; Papathanassiou, K.; Plummer, S.; Rocca, F.; Saatchi, S.; Shugart, H.; et al. The BIOMASS mission: Mapping global forest biomass to better understand the terrestrial carbon cycle. Remote Sens. Environ. 2011, 115, 2850–2860. [Google Scholar] [CrossRef]
- Hall, F.G.; Bergen, K.; Blair, J.B.; Dubayah, R.; Houghton, R.; Hurtt, G.; Kellndorfer, J.; Lefsky, M.; Ranson, J.; Saatchi, S.; et al. Characterizing 3D vegetation structure from space: Mission requirements. Remote Sens. Environ. 2011, 115, 2753–2775. [Google Scholar] [CrossRef]
- Houghton, R.A.; House, J.I.; Pongratz, J.; van der Werf, G.R.; DeFries, R.S.; Hansen, M.C.; Le Quéré, C.; Ramankutty, N. Carbon emissions from land use and land-cover change. Biogeosciences 2012, 9, 5125–5142. [Google Scholar] [CrossRef]
- Gwenzi, D.; Lefsky, M.A.; Suchdeo, V.P.; Harding, D.J. Prospects of the ICESat-2 laser altimetry mission for savanna ecosystem structural studies based on airborne simulation data. ISPRS J. Photogramm. Remote Sens. 2016, 118, 68–82. [Google Scholar] [CrossRef]
- Narine, L.L.; Popescu, S.; Neuenschwander, A.; Zhou, T.; Srinivasan, S.; Harbeck, K. Estimating aboveground biomass and forest canopy cover with simulated ICESat-2 data. Remote Sens. Environ. 2019, 224, 1–11. [Google Scholar] [CrossRef]
- Popescu, S.C. Estimating biomass of individual pine trees using airborne lidar. Biomass Bioenergy 2007, 31, 646–655. [Google Scholar] [CrossRef]
- Boudreau, J.; Nelson, R.F.; Margolis, H.A.; Beaudoin, A.; Guindon, L.; Kimes, D.S. Regional aboveground forest biomass using airborne and spaceborne LiDAR in Québec. Remote Sens. Environ. 2008, 112, 3876–3890. [Google Scholar] [CrossRef]
- Holmgren, J. Prediction of tree height, basal area and stem volume in forest stands using airborne laser scanning. Scand. J. For. Res. 2004, 19, 543–553. [Google Scholar] [CrossRef]
- Neigh, C.S.R.; Nelson, R.F.; Ranson, K.J.; Margolis, H.A.; Montesano, P.M.; Sun, G.; Kharuk, V.; Næsset, E.; Wulder, M.A.; Andersen, H.-E. Taking stock of circumboreal forest carbon with ground measurements, airborne and spaceborne LiDAR. Remote Sens. Environ. 2013, 137, 274–287. [Google Scholar] [CrossRef]
- Nelson, R.; Margolis, H.; Montesano, P.; Sun, G.; Cook, B.; Corp, L.; Andersen, H.-E.; deJong, B.; Pellat, F.P.; Fickel, T.; et al. Lidar-based estimates of aboveground biomass in the continental US and Mexico using ground, airborne, and satellite observations. Remote Sens. Environ. 2017, 188, 127–140. [Google Scholar] [CrossRef]
- Rahlf, J.; Breidenbach, J.; Solberg, S.; Næsset, E.; Astrup, R. Comparison of four types of 3D data for timber volume estimation. Remote Sens. Environ. 2014, 155, 325–333. [Google Scholar] [CrossRef]
- Pang, Y.; Li, Z.; Tan, B.; Liu, Q. The effects of airborne LiDAR point density on forest height estimation. For. Res. 2008, 21, 14–19. [Google Scholar]
- Hirata, Y.; Furuya, N.; Suzuki, M.; Yamamoto, H. Airborne laser scanning in forest management: Individual tree identification and laser pulse penetration in a stand with different levels of thinning. For. Ecol. Manag. 2009, 258, 752–760. [Google Scholar] [CrossRef]
- Lim, K.; Treitz, P.; Wulder, M.; St-Onge, B.; Flood, M. LiDAR remote sensing of forest structure. Prog. Phys. Geogr.-Earth Environ. 2003, 27, 88–106. [Google Scholar] [CrossRef]
- Baghdadi, N.; le Maire, G.; Fayad, I.; Bailly, J.S.; Nouvellon, Y.; Lemos, C.; Hakamada, R. Testing Different Methods of Forest Height and Aboveground Biomass Estimations From ICESat/GLAS Data in Eucalyptus Plantations in Brazil. IEEE J. Sel. Top. Appl. Earth Obs. Remote Sens. 2014, 7, 290–299. [Google Scholar] [CrossRef]
- Nelson, R.; Boudreau, J.; Gregoire, T.G.; Margolis, H.; Naesset, E.; Gobakken, T.; Stahl, G. Estimating Quebec provincial forest resources using ICESat/GLAS. Can. J. For. Res. 2009, 39, 862–881. [Google Scholar] [CrossRef]
- Xing, Y.Q.; de Gier, A.; Zhang, J.J.; Wang, L.H. An improved method for estimating forest canopy height using ICESat-GLAS full waveform data over sloping terrain: A case study in Changbai mountains, China. Int. J. Appl. Earth Obs. Geoinf. 2010, 12, 385–392. [Google Scholar] [CrossRef]
- Lefsky, M.A.; Harding, D.J.; Keller, M.; Cohen, W.B.; Carabajal, C.C.; Espirito-Santo, F.D.; Hunter, M.O.; de Oliveira, R. Estimates of forest canopy height and aboveground biomass using ICESat. Geophys. Res. Lett. 2005, 32. [Google Scholar] [CrossRef]
- Markus, T.; Neumann, T.; Martino, A.; Abdalati, W.; Brunt, K.; Csatho, B.; Farrell, S.; Fricker, H.; Gardner, A.; Harding, D.; et al. The Ice, Cloud, and land Elevation Satellite-2 (ICESat-2): Science requirements, concept, and implementation. Remote Sens. Environ. 2017, 190, 260–273. [Google Scholar] [CrossRef]
- Neuenschwander, A.; Pitts, K. The ATL08 land and vegetation product for the ICESat-2 Mission. Remote Sens. Environ. 2019, 221, 247–259. [Google Scholar] [CrossRef]
- Carreiras, J.M.B.; Quegan, S.; Le Toan, T.; Ho Tong Minh, D.; Saatchi, S.S.; Carvalhais, N.; Reichstein, M.; Scipal, K. Coverage of high biomass forests by the ESA BIOMASS mission under defense restrictions. Remote Sens. Environ. 2017, 196, 154–162. [Google Scholar] [CrossRef]
- Stysley, P.R.; Coyle, D.B.; Clarke, G.B.; Frese, E.; Blalock, G.; Morey, P.; Kay, R.B.; Poulios, D.; Hersh, M. Laser Production for NASA’s Global Ecosystem Dynamics Investigation (GEDI) Lidar. In Laser Radar Technology and Applications XXI; Turner, M.D., Kamerman, G.W., Eds.; SPIE: Bellingham, WA, USA, 2016. [Google Scholar]
- Rosen, P.; Hensley, S.; Shaffer, S.; Edelstein, W.; Kim, Y.; Kumar, R.; Misra, T.; Bhan, R.; Satish, R.; Sagi, R. An updata on the NASA-ISRO dual-frequenct dbf sar(NISAR) misssion. In IEEE International Geoscience and Remote Sensing Symposium; IEEE: Piscataway, NJ, USA, 2016; pp. 2106–2108. [Google Scholar]
- Montesano, P.M.; Rosette, J.; Sun, G.; North, P.; Nelson, R.F.; Dubayah, R.O.; Ranson, K.J.; Kharuk, V. The uncertainty of biomass estimates from modeled ICESat-2 returns across a boreal forest gradient. Remote Sens. Environ. 2015, 158, 95–109. [Google Scholar] [CrossRef]
- Bhang, K.J.; Schwartz, F.W.; Braun, A. Verification of the vertical error in C-band SRTM DEM using ICESat and Landsat-7, Otter Tail County, MN. IEEE. Trans. Geosci. Remote Sens. 2007, 45, 36–44. [Google Scholar] [CrossRef]
- Naesset, E. Predicting forest stand characteristics with airborne scanning laser using a practical two-stage procedure and field data. Remote Sens. Environ. 2002, 80, 88–99. [Google Scholar] [CrossRef]
- Neuenschwander, A.L.; Magruder, L.A. Canopy and Terrain Height Retrievals with ICESat-2: A First Look. Remote Sens. 2019, 11, 1721. [Google Scholar] [CrossRef]
- Sun, T.; Qi, J.B.; Huang, H.G. Discovering forest height changes based on spaceborne lidar data of ICESat-1 in 2005 and ICESat-2 in 2019: A case study in the Beijing-Tianjin-Hebei region of China. For. Ecosyst. 2020, 7, 1–12. [Google Scholar] [CrossRef]
- Li, W.; Niu, Z.; Shang, R.; Qin, Y.C.; Wang, L.; Chen, H.Y. High-resolution mapping of forest canopy height using machine learning by coupling ICESat-2 LiDAR with Sentinel-1, Sentinel-2 and Landsat-8 data. Int. J. Appl. Earth Obs. Geoinf. 2020, 92, 102163. [Google Scholar] [CrossRef]
- Ni, X.; Xu, M.; Cao, C.; Chen, W.; Yang, B.; Xie, B. Forest height estimation and change monitoring based on artificial neural network using Geoscience Laser Altimeter System and Landsat data. J. Appl. Remote Sens. 2019, 14, 022207. [Google Scholar] [CrossRef]
- Neumann, T.; Hancock, D.; Robbins, J.; Saba, J.; Harbeck, K.; Gibbons, A. Ice, Cloud, and Land Elevation Satellite-2 (ICESat-2) Project Algorithm Theoretical Basis Document (ATBD) for Global Geolocated Photons ATL03. 2019. Available online: https://icesat-2.gsfc.nasa.gov/science/data-products (accessed on 20 July 2019).
- Wang, C.; Zhu, X.; Nie, S.; Xi, X.; Li, D.; Zheng, W.; Chen, S. Ground elevation accuracy verification of ICESat-2 data: A case study in Alaska, USA. Opt. Express 2019, 27, 38168–38179. [Google Scholar] [CrossRef]
- Neuenschwander, A.; Popescu, S.; Nelson, R.; Harding, D.; Pitts, K.; Robbins, J.; Pederson, D.; Sheridan, R. Ice, Cloud, and Land Elevation Satellite 2 (ICESat-2) Algorithm Theoretical Basis Document (ATBD) for Land-Vegetation Along-Track Products (ATL08). 2019. Available online: https://icesat-2.gsfc.nasa.gov/science/data-products (accessed on 20 July 2019).
- Liu, M.B.; Cao, C.X.; Dang, Y.F.; Ni, X.L. Mapping Forest Canopy Height in Mountainous Areas Using ZiYuan-3 Stereo Images and Landsat Data. Forests 2019, 10, 105. [Google Scholar] [CrossRef]
- Liu, M.B.; Cao, C.X.; Chen, W.; Wang, X.J. Mapping Canopy Heights of Poplar Plantations in Plain Areas Using ZY3-02 Stereo and Multispectral Data. ISPRS Int. J. Geo-Inf. 2019, 8, 106. [Google Scholar] [CrossRef]
- Ni, W.J.; Sun, G.Q.; Ranson, K.J.; Pang, Y.; Zhang, Z.Y.; Yao, W. Extraction of ground surface elevation from ZY-3 winter stereo imagery over deciduous forested areas. Remote Sens. Environ. 2015, 159, 194–202. [Google Scholar] [CrossRef]
- Lee, W.-J.; Lee, C.-W. Forest Canopy Height Estimation Using Multiplatform Remote Sensing Dataset. J. Sens. 2018, 2018, 1593129. [Google Scholar] [CrossRef]
- Ni, X.; Zhou, Y.; Cao, C.; Wang, X.; Shi, Y.; Park, T.; Choi, S.; Myneni, R. Mapping Forest Canopy Height over Continental China Using Multi-Source Remote Sensing Data. Remote Sens. 2015, 7, 8436–8452. [Google Scholar] [CrossRef]
- Baig, M.H.A.; Zhang, L.F.; Shuai, T.; Tong, Q.X. Derivation of a tasselled cap transformation based on Landsat 8 at-satellite reflectance. Remote Sens. Lett. 2014, 5, 423–431. [Google Scholar] [CrossRef]
- Wiegand, C.L.; Richardson, A.J.; Escobar, D.E.; Gerbermann, A.H. Vegetation indexes in crop assessments. Remote Sens. Environ. 1991, 35, 105–119. [Google Scholar] [CrossRef]
- Huete, A.; Didan, K.; Miura, T.; Rodriguez, E.P.; Gao, X.; Ferreira, L.G. Overview of the radiometric and biophysical performance of the MODIS vegetation indices. Remote Sens. Environ. 2002, 83, 195–213. [Google Scholar] [CrossRef]
- Brown, L.; Chen, J.M.; Leblanc, S.G.; Cihlar, J. A shortwave infrared modification to the simple ratio for LAI retrieval in boreal forests: An image and model analysis. Remote Sens. Environ. 2000, 71, 16–25. [Google Scholar] [CrossRef]
- Jordan, C.F. Derivation of leaf-area index from quality of light on forest floor. Ecology 1969, 50, 663–666. [Google Scholar] [CrossRef]
- Huete, A.R. A soil-adjusted vegetation index (SAVI). Remote Sens. Environ. 1988, 25, 295–309. [Google Scholar] [CrossRef]
- Lymburner, L.; Beggs, P.J.; Jacobson, C.R. Estimation of canopy-average surface-specific leaf area using Landsat TM data. Photogramm. Eng. Remote Sens. 2000, 66, 183–191. [Google Scholar]
- Dubayah, R.; Blair, J.B.; Goetz, S.; Fatoyinbo, L.; Hansen, M.; Healey, S.; Hofton, M.; Hurtt, G.; Kellner, J.; Luthcke, S.; et al. The Global Ecosystem Dynamics Investigation: High-resolution laser ranging of the Earth’s forests and topography. Sci. Remote Sens. 2020, 1, 100002. [Google Scholar] [CrossRef]
- Duncanson, L.; Neuenschwander, A.; Hancock, S.; Thomas, N.; Fatoyinbo, T.; Simard, M.; Silva, C.A.; Armston, J.; Luthcke, S.B.; Hofton, M.; et al. Biomass estimation from simulated GEDI, ICESat-2 and NISAR across environmental gradients in Sonoma County, California. Remote Sens. Environ. 2020, 242, 111779. [Google Scholar] [CrossRef]
- Luthcke, S.B.; Rebold, T.; Thomas, T.; Pennington, T. Algorithm Theoretical Basis Document (ATBD) for GEDI Waveform Geolocation for L1 and L2 Products. 2019. Available online: https://gedi.umd.edu/data/documents/ (accessed on 1 March 2020).
- Collecting the Right Number of Ground Control Points. 2020. Available online: https://www.pcigeomatics.com/geomatica-help/concepts/orthoengine_c/Chapter_55.html (accessed on 5 August 2020).
- Maier, H.R.; Dandy, G.C. Neural networks for the prediction and forecasting of water resources variables: A review of modelling issues and applications. Environ. Model. Softw. 2000, 15, 101–124. [Google Scholar] [CrossRef]
- Samardak, A.; Nogaret, A.; Janson, N.B.; Balanov, A.G.; Farrer, I.; Ritchie, D.A. Noise-Controlled Signal Transmission in a Multithread Semiconductor Neuron. Phys. Rev. Lett. 2009, 102, 226802. [Google Scholar] [CrossRef]
- Caorsi, S.; Cevini, G. An electromagnetic approach based on neural networks for the GPR investigation of buried cylinders. IEEE Geosci. Remote Sens. Lett. 2005, 2, 3–7. [Google Scholar] [CrossRef]
- Liu, T.; Su, Y.; Huang, C. Inversion of Ground Penetrating Radar Data Based on Neural Networks. Remote Sens. 2018, 10, 730. [Google Scholar] [CrossRef]
- Ni, X.; Park, T.; Choi, S.; Shi, Y.; Cao, C.; Wang, X.; Lefsky, M.; Simard, M.; Myneni, R. Allometric Scaling and Resource Limitations Model of Tree Heights: Part 3. Model Optimization and Testing over Continental China. Remote Sens. 2014, 6, 3533–3553. [Google Scholar]
- Wenjian, N.; Dafeng, Z.; Yao, W.; Yong, P.; Zhiyu1, Z.; Jianli, L.; Yating, H.; Wei, G. Extraction of forest height by using GF-2 cross-track stereo images. J. Remote Sens. 2018, 22, 392–399. [Google Scholar]


Publisher’s Note: MDPI stays neutral with regard to jurisdictional claims in published maps and institutional affiliations. |
© 2020 by the authors. Licensee MDPI, Basel, Switzerland. This article is an open access article distributed under the terms and conditions of the Creative Commons Attribution (CC BY) license (http://creativecommons.org/licenses/by/4.0/).