Abstract
Phewa Lake is an environmental and socio-economic asset to Nepal and the city of Pokhara. However, the lake area has decreased in recent decades due to sediment influx. The rate of this decline and the areal evolution of Phewa Lake due to artificial damming and sedimentation is disputed in the literature due to the lack of a historical time series. In this paper, we present an analysis of the lake’s evolution from 1926 to 2018 and model the 50-year trajectory of shrinkage. The area of Phewa Lake expanded from 2.44 ± 1.02 km2 in 1926 to a maximum of 4.61 ± 0.07 km2 in 1961. However, the lake area change was poorly constrained prior to a 1957–1958 map. The contemporary lake area was 4.02 ± 0.07 km2 in April 2018, and expands seasonally by ~0.18 km2 due to the summer monsoon. We found no evidence to support a lake area of 10 km2 in 1956–1957, despite frequent reporting of this value in the literature. Based on the rate of areal decline and sediment influx, we estimate the lake will lose 80% of its storage capacity in the next 110–347 years, which will affect recreational use, agricultural irrigation, fishing, and a one-megawatt hydroelectric power facility. Mitigation of lake shrinkage will require addressing landslide activity and sediment transport in the watershed, as well as urban expansion along the shores.
1. Introduction
Landslides triggered by heavy rain or earthquakes often lead to fatalities in the monsoon-dominated high-relief Himalayan landscape [1,2,3], and urban expansion is increasing socio-economic exposure to landslides. Additionally, rural road-building without proper geotechnical considerations is associated with an upward trend in landslide occurrences and sediment mobilisation in Nepal [2,4,5,6]. The highest rates of sediment transport occur during the monsoon, where pore water pressures are high and landslide activity peaks [7,8].
Nepal’s second largest lake (Phewa or Fewa) is fed from the west by the Harpan River and is part of a Ramsar site encompassing the city of Pokhara. Sediment transport into the lake (Figure 1) is causing areal shrinkage. Estimates of sedimentation rates in 1999 suggested the lake would lose 80% of its storage capacity within 360 years [9], which will affect recreational use (boating), agricultural irrigation, the fishing, and a one-megawatt hydroelectric power plant [10,11,12]. Reports of areal extent decrease contain erroneous values that are propagated through the literature, with some studies reporting an area of 10 km2 in the lake’s recent history [6,13,14,15]. The lake area decreased in response to dam failure in the 1970s, which allowed land ownership registration of areas formerly underwater [16]. Knowledge of an accurate lake area time series is especially pertinent following a 2018 Supreme Court decision to address urban encroachment on the lakeshore and siltation of the lake [17]. The court decision also reflects current concern regarding the rate of development and its proximity to the lakeshore, in the absence of wastewater treatment facilities [11,18,19].
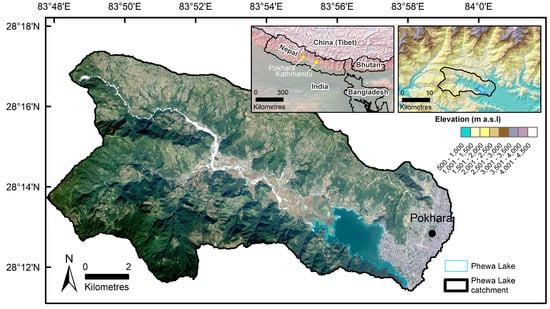
Figure 1.
Phewa Lake catchment and the city of Pokhara located in central Nepal. True-colour RapidEye background (10 November 2017).
In this study, we present a time series of Phewa Lake’s evolution from 1926 to 2018 and estimate the lake’s future extent based on observed rates of areal decline and by modelling sediment deposition on the lakebed using bathymetry derived in May 2018. We assess urbanisation of the lakeshore, as well as landslide activity and road construction in the catchment.
2. Study Site
Phewa Lake is located in the Kaski District of central Nepal, south of the Annapurna Massif, and west of and abutting the city of Pokhara, Nepal’s second-largest urban area (Figure 1). The catchment has a planimetric area of 122.5 km2, with elevations ranging from 790 m at the dam outlet to 2480 m on the western limit of the catchment. Pokhara is built on gravels deposited by successive debris, which flows from the southern glacierised slopes of Annapurna III (7555 m) and IV (7525 m) [20,21,22]. There were at least three episodes of sedimentation that occurred between ~700 and ~1700 AD, likely coinciding with three great earthquakes [23,24]. Phewa Lake formed behind the gravel deposits before a number of artificial dams were installed to raise the water level and to produce hydroelectric power. The sequence of dam formation was summarised by Ross and Gilbert [9], where they mentioned that the first stone and mortar dam was constructed in 1933, which was replaced with a rockfill dam in 1942. The rockfill dam failed in the 1960s and was replaced with a concrete dam, which reportedly failed in 1975; however, others have suggested failure in 1974 [12,13,14]. The current dam became operational in 1982 and provides one megawatt hydropower generation and irrigation for crops along the north and west shores [12,16,18,25].
3. Methods
3.1. Lake Area
We delineated the area of Phewa Lake (1926–2018) using a combination of historical maps and satellite imagery (Table 1). Satellite images were acquired in winter and spring to minimise seasonal lake-level variability. Historical maps were georeferenced using mountain peaks, road intersections, and bridges. The lake areas were manually digitised on historical maps and declassified Corona and Hexagon satellite imagery [26], and semi-automatically classified using a normalised difference water index (NDWI) applied to multispectral satellite imagery [27,28]. Blue and near-infrared bands were used for Landsat, PlanetScope, and RapidEye imagery. Green and near-infrared bands were used for the Landsat Multispectral Scanner System (MSS), which lacks a blue band. Uncertainty in the derived lake areas was estimated using shoreline buffers corresponding to half the imagery pixel size (Table 1); relative precision (image-to-image changes using similar data types and resolution) in measured lake areas have smaller uncertainties than the absolute errors [29] but were not calculated because of the heterogeneous variety of the satellite images and maps.

Table 1.
Historical maps and satellite imagery used to derive the area of Phewa Lake.
Lake area evolution was modelled 50 years into the future using bathymetry data (see next section) and estimates of sediment influx derived from the literature. We evaluated a “low” sedimentation scenario of 78,700 m3·a−1 and a “high” one of 225,000 m3·a−1. Ross and Gilbert [9] suggested a sedimentation rate in the main reservoir of 78,700 m3·a−1, while other studies suggest rates of 86,030 m3·a−1 (1981) [30] and 175,000 to 225,000 m3·a−1 (1995) [31] over the entire lake. It is clear that the current alignment of the Harpan River permits directed discharge into Phewa Lake, which favors a higher sedimentation rate during periods of high flood, landslide, and debris flow activity. In our model, the annual budget of sediment influx from the western shore was instantaneously distributed across the lakebed following either a linear (exponent of 1) or power law (exponent of 0.3) distance decay function from the sediment source, which was assumed to remain static along the western lakeshore:
where Dd is the distance decay function and Ds is the distance from the sediment source. The total annual sediment influx was distributed as a fraction of the total Dd. The power law was chosen to reflect the spatial variation in sedimentation rates presented by Ross and Gilbert [9]. After the sediment was distributed, the new lake area and volume was calculated and the updated bathymetry grid was used for the next year’s model iteration.
3.2. Lake Bathymetry and Surrounding Topography
Lake bathymetry was derived on 18 May 2018 using a Deeper Smart Sonar PRO+ towed at the side of a boat. The sonar operated at 290 kHz with a cone of 15° (2.6 m diameter footprint at 10 m depth) and recorded lake depth and location. Location information was automatically derived from a WiFi-linked smartphone operating with Global Positioning System (GPS) and Global Navigation Satellite System (GLONASS) positioning. The sonar could read to a maximum depth of 80 m and has an integrated GPS module; however, we chose to use smartphone positioning to avoid location dropout due to signal-blocking by the boat. Raw data points were interpolated into a bathymetry grid using the Topo-to-Raster tool in ArcGIS, retaining sinks in the data. We assumed an uncertainty in the sonar measurements, and hence a lake volume of 4%, following [32] who compared the Deeper Smart Sonar PRO+ to plumb-line measurements and a second reference sonar device (SS510 Smart Sensor). Lake bathymetry is measured to a reference elevation of 794.70 ± 0.06 m, derived from an average of three water-level measurements taken with an Emlid Reach RS acting as a rover (≥5-minute occupation). This elevation was 0.60 m higher than the elevation recorded on the same date by a water-level sensor at Phewa Dam (Figure 3d). The Emlid Reach RS Global Navigation Satellite System (GNSS) data were post-processed in Real-Time Kinematic Library (RTKLIB) to a static receiver acting as a temporary base station. The base station’s position was derived through processing the data to the University NAVSTAR Consortium (UNAVCO) permanent station at Lamjung using precise Global Positioning System (GPS) and Global Navigation Satellite System (GLONASS) satellite ephemeris. The Shuttle Radar Topography Mission (SRTM) digital elevation model (DEM) [33] was used to derive the catchment topography and slope.
3.3. Lake Characteristics
Records of daily lake water-level elevation were obtained from the Department of Irrigation. The water level was measured nominally twice a day at Phewa Dam. Lake surface temperature was derived using Advanced Spaceborne Thermal Emission and Reflection Radiometer (ASTER) thermal infrared (TIR) data delivered as the Level 2 Surface Kinetic Temperature product (AST_08), which is both atmospherically and emissivity corrected. Landsat 8 Thermal Infrared Sensor (TIRS) band 10 brightness temperature data were also used for comparison but not corrected for atmospheric effects or water emissivity (Table S1). Ten ASTER TIR (90 m resolution) and 48 Landsat 8 TIRS images (100 m resolution delivered as a resampled 30 m product) were used, which had cloud-free lake coverage and were acquired between 10:38 and 11:09 a.m. local Nepal Time. We excluded pixels within 270 m of the lakeshore to avoid adjacency effects leading to a mixed thermal signature [34], and calculated the mean lake temperature (2000–2018) using the remaining pixels.
3.4. Landslide Activity and Urban Expansion
The role of landslides and channel-scouring on sedimentation at the lakeshore was assessed using orthorectified RapidEye Level 3A satellite images with a ground sampling distance of 6.5 m, which were resampled and delivered at 5 m resolution (Table S2) [35]. Images were coregistered to a 2017 RapidEye image in Environment for Visualizing Images (ENVI), and a normalised difference vegetation index (NDVI) was calculated using the near-infrared and red bands. The annual NDVIs were differenced and the histograms were manually thresholded into two categories to reveal areas of NDVI decrease (devegetation) and NDVI gain (revegetation), associated mainly with landslide or flood events causing channel scouring. Manual adjustments were made with reference to the underlying true-colour imagery to exclude change relating to construction, natural vegetation phenology, and agriculture.
The number of buildings and length of tracks and roads in the catchment were estimated using OpenStreetMap data downloaded on 22 May 2018. Since the date of the dataset was unknown, it was updated using imagery accessed in Google Earth (12 December 2017) within 200 m of the lake. Similarly, a historical dataset of buildings within 200 m of the lake was derived using QuickBird-2 imagery accessed through Google Earth (19 November 2004). The distance of 200 m was chosen to provide an assessment of urbanisation in the vicinity of the lake shore.
4. Results
4.1. Lake Characteristics
Prior to the operation of the current dam (1982), the lake area ranged from a minimum of 2.44 ± 1.02 km2 in 1926 to a maximum, accounting for the areal uncertainties, of 4.61 ± 0.07 km2 in 1961 or 4.75 ± 0.63 km2 in 1972 (Figure 2). Dam failure occurred in 1975, which was observed in Landsat MSS images (Figure S1). There were no useable MSS images in 1974; however, the lake area had decreased by 0.9 km2 from 20 January 1973 to 25 February 1975. We observed a total decrease of 1.2 km2 related to dam failure (1973–1976). During the operation of the current dam (1982–present), Landsat imagery revealed that the lake area decreased by ~0.44 km2 from 1992–1994. RapidEye imagery revealed a more gradual recent decline of 0.08 km2 (2010–2018) to an area of 4.02 ± 0.07 km2 in April 2018.
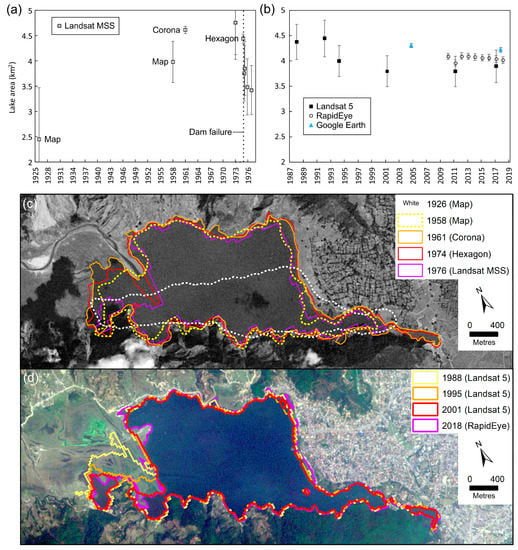
Figure 2.
Changes in lake area before and after the most recent dam (1982). (a) Lake area change from 1926–1976 and (b) 1988–2018. (c) Lake shoreline change from 1926–1976 shown on a 1962 Corona satellite image, and (d) 1988–2018 shown on a RapidEye satellite image (April 2018). The 1926 and 1958 outlines are dashed due to georeferencing and geodetic uncertainty.
The lake level is regulated within a narrow range at the dam. We observed seasonal changes in the lake shoreline, which were driven by the summer monsoon and changes in the lake water level (Figure 3a–d). In 2017, the highest water level (794.30 m) was observed on 8 October 2017, which declined to a minimum of 792.80 m on 9 March 2018. A NDWI difference between PlanetScope images close to these extremes (10 October 2017 and 27 March 2018) showed shoreline change corresponding to the 1.5 m difference in water level elevation (Figure 3c,d). This change occurred predominantly on the low-gradient western shore and accounted for a ~0.18 km2 expansion in the lake area (considering areas immediately adjacent to the lake, but excluding the river and relic river channels). The lake temperature also displayed a seasonal trend, as expected, with a peak in the summer months, which were not fully captured in the ASTER TIR or Landsat 8 TIRS data due to monsoonal cloud cover obscuring the lake (Figure 3e). Lake temperatures ranged from ~15 °C in winter months to ~30 °C in the summer.
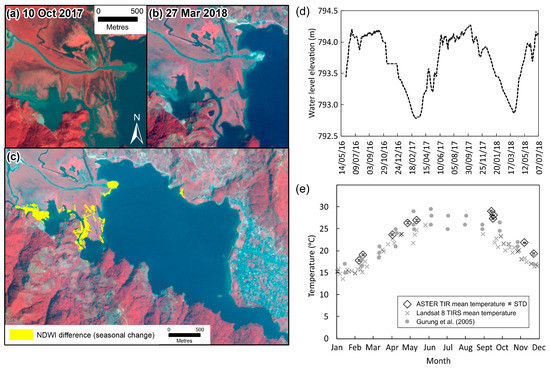
Figure 3.
Seasonal changes at Phewa Lake. (a–c) Shoreline change between high (10 October 2017) and low (27 March 2018) water levels. Backgrounds are RapidEye false colour composites (bands: near-infrared, red, and blue). (d) Water level elevation recorded at Phewa Dam with a seven-day moving average. (e) Mean lake temperature derived from ASTER Thermal Infrared (n = 10, 2000–2018), Landsat 8 Thermal Infrared Sensor (n = 48, 2013–2018), and Gurung et al. (2005) (n = 30, 2000–2002).
The Harpan River enters the lake at two locations on the western shore (Figure 4). This western shore associated with the Harpan River delta has exhibited the greatest areal decline due to the sediment deposition and the lowest near-shore slopes. By contrast, the southern and northern shores have featured little change because of lower sedimentation rates and steep near-shore slopes. However, some lake expansion has occurred at the northeastern and northwestern corners of the lake (Figure 2d, Figure S2). Based on the May 2018 bathymetry survey, the deepest area of the lake is adjacent to the southern shoreline with a maximum observed depth of 21.4 m. The lake had a mean depth of 8.5 m, a standard deviation of ±5.3 m, and a volume of 32,465,100 ± 1,298,600 m3. The volume is an underestimation, since our survey omits 10% of the lake area in the shallow western lake area (Figure 4).
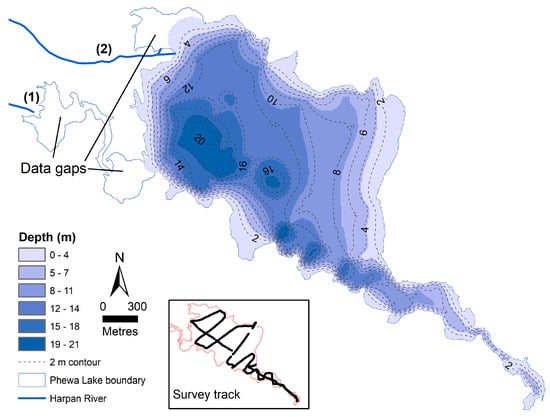
Figure 4.
Lake bathymetry (18 May 2018). The Harpan River enters the lake at points (1) and (2).
Modelled sedimentation of the lake over the next 50 years revealed the largest area decline adjacent to the delta (sediment input area), but there are differences in the spatial pattern of sediment deposition—hence lake shrinkage—depending on whether a linear or power-law distance decay function is used (Figure 5). However, the difference in net area changes between the distance decay functions was small. The average area decrease for the high and low sediment influx scenarios is 10,000 m2·a−1 and 4800 m2·a−1, respectively, with volumetric decreases of 224,000 m3·a−1 and 79,000 m3·a−1. The high and low sediment influx scenarios suggest that Phewa Lake will lose 80% of its storage capacity in the next 110–347 years.
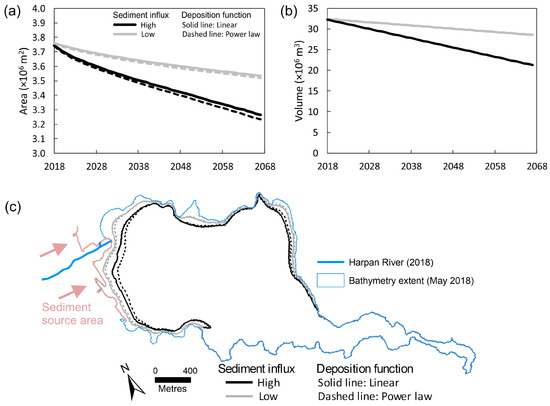
Figure 5.
Modelled area (a) and volume (b) decrease for high and low sediment influx scenarios. (c) The resulting shoreline change to the year 2067.
4.2. Urban Expansion and Landslides
Development of the Pokhara–Baglung Highway in the upper part of the Phewa catchment was visible on Landsat 5 satellite images, with over 4 km of road appearing from 1988–1989 (Figure 6a,b). This development occurred on the sparsely vegetated southerly-facing slopes, where evidence of small landslides and gully erosion were apparent in the years following road construction. At the same time, the Harpan River delta expanded into Phewa Lake, causing its shrinkage (Figure 6).
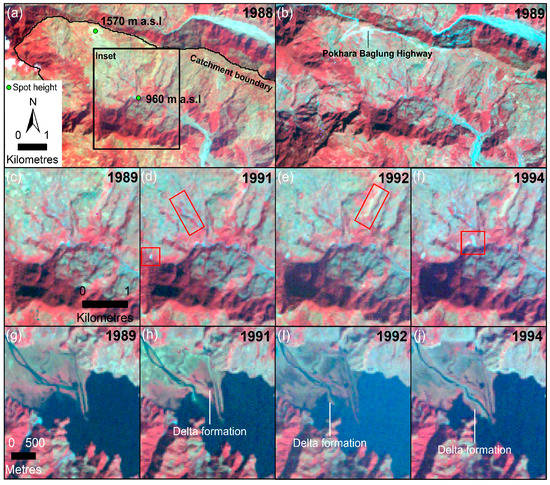
Figure 6.
(a–f) Landscape changes in the upper part of the Phewa catchment from 1988–1994, and (g–j) lake shrinkage on the western shore. Images are Landsat 5 false colour composites (bands: near-infrared, red, and blue).
NDVIs (2010–2017) reveal peak landslide and channel-scouring activity 2014–2015 relating to the Gorkha earthquake, although there was also notable activity in the preceding year (Figure 7) and subdued activity in 2016 and 2017. The revegetation of some landslide scars is evident following the peak in vegetation loss; however, this colonisation was likely by grass and pioneer species, often in place of former woodland. Channel scouring was present along the Harpan River and the low-gradient flood plain (Figure 7a). Landslide activity was concentrated in the northwestern part of the catchment. An inactive landslide mapped by the Department of Mines and Geology (1998) became reactivated in 2014 and vegetation loss continued into 2015 (Figure S3). That landslide activity coincided with the formation of a protruding delta 2014–2015 (Figure 8). Sedimentation caused lake shrinkage in three distinct locations on the western shoreline over this period (Figure 8e,g,i).
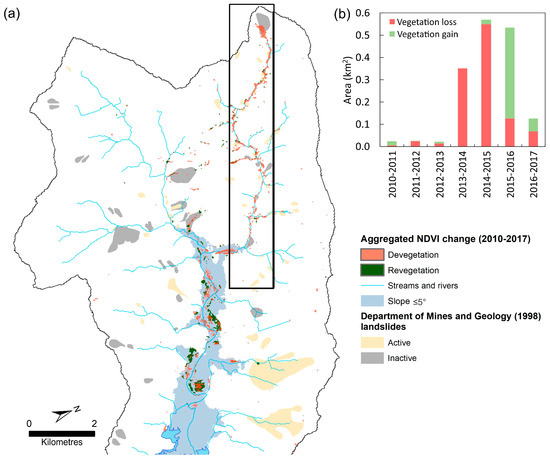
Figure 7.
(a) Landslides and normalised difference vegetation index (NDVI) change in the Phewa Catchment. Inset box refers to Figure S3. (b) Areas of change in NDVI from 2010–2017.
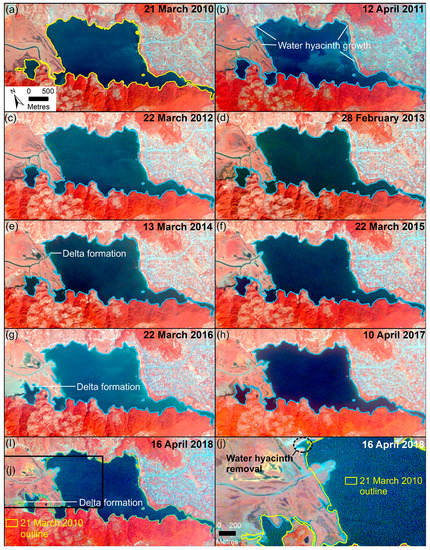
Figure 8.
Changes in lake area from 2010–2018 and the locations of sediment influx. Backgrounds are RapidEye false colour composites (bands: near-infrared, red, and blue). The corresponding classified lake outlines are shown as blue outlines (yellow outline for March 2010).
The OpenStreetMap dataset (downloaded in 2018) revealed 27,324 buildings in the Phewa catchment and 332 km of tracks and roads (Figure 9a). 52 buildings were located in the area of NDVI-derived landslide activity and 180 in the area of active landslides mapped by the Department of Mines and Geology (1998) (Table 2). However, most buildings in the catchment are located on the low-gradient lakeshore, especially the heavily urbanised area on the eastern lakeshore. Within 65 m and 200 m of the lakeshore we counted 505 and 1687 buildings, respectively, in 2017 (Table 3). The number of buildings within 65 m and 200 m of the lakeshore increased twofold from 2004 to 2017, and this increase was concentrated along the northeastern shoreline (Figure 9d). A 1961 Corona satellite image shows this area to have been undeveloped at that time (Figure 10). Our field investigation reveals that much of the recent urbanisation on the eastern shore has been restaurant development providing lake-view dining.
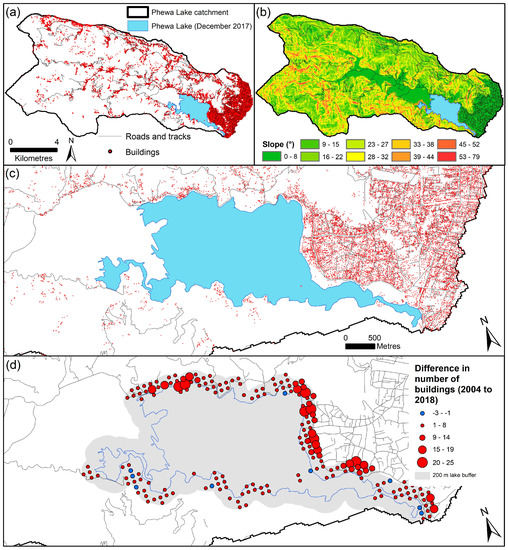
Figure 9.
(a) Tracks, roads, and buildings in the Phewa Lake catchment. (b) Catchment slope derived from the Shuttle Radar Topography Mission DEM. (c) Enlarged view of the lakeshore. (d) Difference in the number of buildings within 200 m of the lakeshore, aggregated to a 1 km2 grid (2004–2018).

Table 2.
Buildings located in areas of potential landslide activity.

Table 3.
Buildings on the shoreline of Phewa lake.
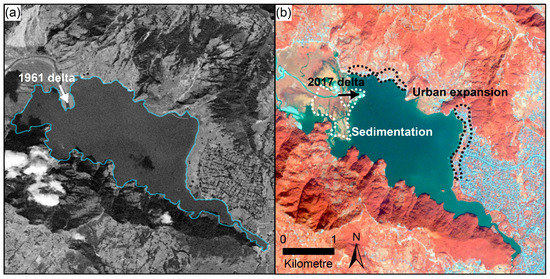
Figure 10.
(a) Phewa Lake in 1961 with a panchromatic Corona satellite image background; (b) Phewa Lake in 2017 with a RapidEye image (10 November 2017) false colour composite background (bands: near-infrared, green, and blue).
5. Discussion
5.1. Lake Area and Volume Evolution
5.1.1. Pre-1982 Lake Area
The areal decrease of Phewa Lake has been observed or stated in numerous studies; however, erroneous values of lake area circulate in the literature. In this study, lake area ranged from 2.44 ± 1.02 km2 in 1926 to a maximum of 4.61 ± 0.07 km2 in 1961 or 4.75 ± 0.63 km2 in 1972 (Figure 2). Some of this increase is clearly associated with dam construction. A historic map was used to define the 1957–1958 lake area of 3.97 ± 0.41 km2. Therefore, we find no evidence to support a lake area of 10 km2 in 1956–1957 as stated in some reports (e.g., [15]) and in a stone inscription used at the time of the inauguration of a dam on 16 January 1962 (Figure S4). Due to the extensive low-gradient upstream floodplain (Figure 7a and Figure 9b), a lake of such an area would extend over 5 km up-valley from the present western shoreline.
The 1975 dam failure caused a lake shrinkage of ~1.2 km2 (1973–1976). At the shallowest point, the 2018 bathymetry suggests a depth of 3 m in the narrow channel approaching the dam (Figure 4), which was likely the limitation preventing further drainage following the dam breach. Indeed, Ross and Gilbert (1999) suggested a water level lowering of ~3 m in response to the dam failure and analysed sediment cores showing a thick silt deposit, which was attributed to lake-bed erosion and sediment redistribution due to the failure.
5.1.2. Post-1982 Lake Area
Our time-series area analysis under the operation of the most recent dam (1982–present) showed a lake area of 4.37 ± 0.35 km2 in 1988, which was derived from the first suitable Landsat 5 satellite image after 1982. Coincident acquisitions between Landsat 5 and RapidEye 10 April 2017, and near-coincidental acquisitions in April 2011 showed that Landsat imagery likely underestimates the lake area by ~0.16 km2 compared to RapidEye (Figure 2b). The largest decrease in lake area occurred between 1992–1994 (Figure 2b), which was caused by the prograding delta (Figure 6). The construction of the Pokhara–Baglung Highway in the upper part of the catchment (1988–1989) preceded this period of lake-area decrease. A rapid and accelerating increase in rural road construction in the high-relief upper catchment is amplifying landslide activity [4], which is projected to increase the rate of sediment delivery into Phewa Lake. Vuillez et al. (2018) found that, following extreme rainfall in July 2015, 40% of newly triggered landslides intersected a road and 84% were within 40 m of a road. It is therefore possible that sediment mobilisation, due to the ~4 km of road-cutting, contributed to increased sediment delivery to the lake in the following years. Gully erosion and small landslides were also evident close to the river channel (Figure 6); however, the most significant devegetation scar in the catchment was associated with road construction.
RapidEye imagery revealed a more gradual lake shrinkage of 0.08 km2 (2010–2018), which was associated with the prograding delta 2014–2018 (Figure 8). Landslide activity, which peaked in 2015 following the Gorkha earthquake, followed by monsoon rainfall and channel-scouring during flood events, was the most likely cause of this sediment delivery to Phewa Lake (Figure 7b). The largest landslide originated in an area of inactive landslides mapped by the Department of Mines and Geology [36] in the northwestern catchment (Figure 7) and became activated in 2014. Geological and lithological controls on landsliding and silt production are described in the Supplemental Information (Figure S5).
The slowdown in lake shrinkage in recent years could be associated with the removal of the invasive Water hyacinth (Eichhornia crassipes), which had colonised shallow areas of the lake shore [37]. This is apparent in the northeastern area of the lake (Figure 8j) where the plant was cleared before the establishment of a nearby paragliding landing site and cafes. The lake temperature (~15 °C–30 °C) (Figure 3e) provides close-to-optimum growth conditions for the plant [38]. The reduced lake area in 2011 compared to 2010 and 2012 was also linked to water hyacinth expansion on the shallow northeast and northwest shores (Figure 2b and Figure 8). The Supreme Court decision to construct check dams in the catchment will also contribute to reducing sediment influx to the lake [39] and could be used to initiate sediment monitoring of the Harpan River.
Seasonal lake-area changes were driven by the summer monsoon and winter low-flow, which led to a 1.5 m annual oscillation in lake elevation (Figure 3d). The lake-level change corresponds to a ~0.18 km2 seasonal fluctuation in lake area, which peaks early autumn 2017 and 2018, relative to early spring 2016 and 2017 (Figure 3).
5.1.3. Lake Volume
Modelling of future sedimentation for high and low sediment influx scenarios suggests a lake area decrease of 10,000 m2·a−1 and 4800 m2·a−1. On the current trajectory, the lake would lose 80% of its storage capacity in the next 110–347 years. Our results correspond with [9], who estimated a lifespan of 360 years, and other literature who report estimates of 135–175 years [10,40]. However, the current alignment of the Harpan River deposits sediment directly into the main reservoir—hence, the sedimentation rate is expected to have increased. The rate of sedimentation is therefore likely to be closer to the high sediment-influx scenario (110 years for 80% lake volume reduction), since the lower rate from [9] was reported for the main reservoir. They reported sedimentation rates exceeding 1 m·a−1 where the Harpan River entered the lake, and much of this area is now land (Figure 10b). Artefacts were present in our derived bathymetry due to the survey track coverage, especially on the southern shore, which is deep in the vicinity of the shoreline (Figure 4). Therefore, future surveys should increase the bathymetry survey density in this region and investigate the current rates of sediment influx.
5.2. Urbanisation
The official Census figures do not indicate population growth of the Harpan Khola watershed between 2001 and 2011 [14], but in Google Earth it can be seen that some residential construction occurred in the 2011–2015 timeframe. [14] found that migration within the Harpan watershed from higher to lower elevation, as well as outmigration have both been very significant, noting that some people moving down from the slopes have chosen to occupy the riverbed or areas close to it. In examining Google Earth imagery, we also note that some of the new residential units have been built directly on or immediately adjacent to the river channels draining the Harpan watershed, where precipitation in 2014 and 2015 was about 4000 mm/year, averaging 42 mm/day during the two peak monsoon months of July and August [41]. High precipitation has driven repeated deadly flooding and landslides in the Harpan Khola watershed, such as on 30 July 2015 [42]. The rain event (28–31 July) and attendant floods, landslides, and debris flows washed away or buried at least 10 houses and killed at least 7 people, left more people missing, destroyed a bridge over Harpan Khola, and damaged parts of several roadways in the valley, and also killed dozens more people and destroyed dozens more houses just outside the Phewa catchment [43,44]. Although the area underwent a drying trend from 1982 to 2012 [14], annual precipitation and peak short-period rainfall amounts during extreme events could increase as a result of climate change. However, aerosol pollutants may reduce precipitation, or at least shift its seasonality of some parts of the subcontinent (e.g., [45]).
Few roads exist on the steep southerly slopes adjacent to Phewa Lake; however, the presence and increase in buildings suggests that road links may be sought, which would cause increased sediment mobilisation into the lake (Figure 6). Most urban expansion was concentrated on the eastern and northern shores, which is contributing to deteriorating water quality due to limited water treatment [11,19]. Pokharel [12] suggested that uncontrolled urbanisation was a result of poor legal enforcement. Similarily, Genesis Consultancy (P). Ltd [46] noted development was continuing without sight of natural hazards or geological suitability, since much of the area currently developed on the eastern lakeshore was assessed as highly prone to sinkhole development and subsidence by the Department of Mines and Geology [36]. We observed an increase of 320 buildings within 65 m of the Phewa lakeshore (2004–2017) (Table 3). However, a Supreme Court decision in April 2018 ordered the removal of buildings within 65 m of the lakeshore, also stating that legally registered land could only be used for cultivation purposes [17]. Resident surveys in the catchment by Aryal [11] suggested support for restricting development within 100 m of the lakeshore. As noted, the 1961 Corona image shows almost no contruction in areas around the lake that are now heavily urbanised.
Tradeoffs between new building and road construction, agricultural production, hazard mitigation, and lake conservation will determine the future size and water quality of Phewa Lake. Whilst road-building increases sediment mobilisation, community-led afforestation and abandonment of marginal agricultural lands due to an outward migration of labor from those landslide-prone sediment source areas could potentially reduce debris flows and fluvial sediment yields to the lake [6,19,47,48].
6. Conclusions
Nepal’s second largest lake (Phewa) is shrinking due to sediment influx. The rate of this decline and the areal evolution of Phewa Lake due to artificial damming and sedimentation is disputed in the literature. We presented an analysis of the lake’s evolution from 1926 to 2017, and modelled the 50-year trajectory of shrinkage. The area of Phewa Lake expanded from 2.44 ± 1.02 km2 in 1926 to a maximum of 4.61 ± 0.07 km2 in 1961. We found no evidence to support a lake area of 10 km2 in 1956–1957, despite such reports in the literature. The contemporary lake area decreased to 4.02 ± 0.07 km2 with a seasonal shoreline expansion of ~0.18 km2 related to the summer monsoon. Long-term lake area decreases caused by the prograding Harpan River delta was linked to sources of sediment mobilisation in the upper part of the catchment, including road construction in the late 1980s, landslide activity, and sediment mobilisation during floods. Based on the rate of areal decline and sediment influx, we estimate the lake will lose 80% of its storage capacity in the next 110–347 years, which will affect recreational use, agricultural irrigation, the fishing industry, and a one-megawatt hydropower plant. Refining estimates of the lake shrinkage would benefit from increased coverage of the contemporary bathymetry, suspended sediment monitoring of the Harpan River, and monitoring of landslide activity.
Supplementary Materials
The following are available online at https://www.mdpi.com/2072-4292/11/4/444/s1, Table S1: ASTER Thermal Infrared (TIR) and Landsat Thermal Infrared Sensor (TIRS) imagery used to derive lake temperature. Table S2: RapidEye imagery used to derive normalised difference vegetation indexes. Figure S1: Lake area shrinkage due to the 1975 dam failure. The lake outline from 15th December 1972 is shown on all panels. (a–d) Landsat Multispectral Scanner background false colour composite (near-infrared, red, green). Figure S2: Surface water extent and change from Landsat image classification (Pekel et al., 2016). Figure S3: Landslide activity in the upper part of Phewa catchment (Figure 7) revealed by RapidEye true colour imagery. (a) 6 November 2013. (b) 17 December 2014. (c) 31 October 2015. Figure S4: Stone inscription used at the time of the inauguration of a dam on 16 January 1962. Figure S5. A 2015 landslide (a), sourced in the Kuncha formation and nearly reaching Harpan Khola, is composed of rocks such as these (b) shown in thin section (crossed polarizers)—pelitic schist (c) and psammitic schist (d), commonly forming meta-conglomerate ((b), right). In (c) and (d), Qz = quartz, Ms—muscovite, and Bt = Biotite; and the scale bar is 0.6 mm. Panel (a) is a DigitalGlobe scene projected in Google Earth, acquisition date March 10, 2016. Figure S6: Environmental water quality and ecological problems of Phewa Lake. (a) Outlet pipe emits wastewater into the lake, where fishermen extract fish. (b) Evidence of the wastewater effects on water quality. (c) Water hyacinth, an aggressive invasive species from the Amazon Basin has invaded Phewa Lake. (d) Plastic pollution and water hyacinth.
Author Contributions
C.S.W. and D.R. collected field data. C.S.W. performed the analysis and drafted the manuscript. All authors contributed to writing and editing of the manuscript.
Funding
C.S.W. and J.K. are funded under NASA IDS grant 80NSSC18K0432. S.R. is funded under NASA HMA grant NNX16AQ61G.
Acknowledgments
The city of Pokhara Mayor (Man Bahadur GC), engineer (Mahendra Godar) and Khagendra Poudel of Prithivi Narayan Campus, Pokhara are thanked for supporting fieldwork on Phewa Lake in May 2018. The Department of Irrigation, Pokhara is thanked for providing Phewa Lake water level data. We thank Sarmila Paudyal (National Society for Earthquake Technology, Kathmandu, Nepal) for producing thin sections. We thank Planet Labs for providing access to satellite imagery through the Planet Ambassadors Program and three reviewers for comments that helped improve this manuscript.
Conflicts of Interest
The authors declare no conflict of interest.
References
- Petley, D. Global patterns of loss of life from landslides. Geology 2012, 40, 927–930. [Google Scholar] [CrossRef]
- Petley, D.N.; Hearn, G.J.; Hart, A.; Rosser, N.J.; Dunning, S.A.; Oven, K.; Mitchell, W.A. Trends in landslide occurrence in Nepal. Nat. Hazards 2007, 43, 23–44. [Google Scholar] [CrossRef]
- Kargel, J.S.; Leonard, G.J.; Shugar, D.H.; Haritashya, U.K.; Bevington, A.; Fielding, E.J.; Fujita, K.; Geertsema, M.; Miles, E.S.; Steiner, J.; et al. Geomorphic and geologic controls of geohazards induced by Nepal’s 2015 Gorkha earthquake. Science 2016, 351. [Google Scholar] [CrossRef]
- Leibundgut, G.; Sudmeier-Rieux, K.; Devkota, S.; Jaboyedoff, M.; Derron, M.-H.; Penna, I.; Nguyen, L. Rural earthen roads impact assessment in Phewa watershed, Western region, Nepal. Geoenviron. Disasters 2016, 3. [Google Scholar] [CrossRef]
- Mulmi, A.D. Green road approach in rural road construction for the sustainable development of Nepal. J. Sustain. Dev. 2009, 2. [Google Scholar] [CrossRef]
- Vuillez, C.; Tonini, M.; Sudmeier-Rieux, K.; Devkota, S.; Derron, M.-H.; Jaboyedoff, M. Land use changes, landslides and roads in the Phewa Watershed, Western Nepal from 1979 to 2016. Appl. Geogr. 2018, 94, 30–40. [Google Scholar] [CrossRef]
- Andermann, C.; Crave, A.; Gloaguen, R.; Davy, P.; Bonnet, S. Connecting source and transport: Suspended sediments in the Nepal Himalayas. Earth Planet. Sci. Lett. 2012, 351–352, 158–170. [Google Scholar] [CrossRef]
- Fort, M.; Cossart, E.; Arnaud-Fassetta, G. Hillslope-channel coupling in the Nepal Himalayas and threat to man-made structures: The middle Kali Gandaki valley. Geomorphology 2010, 124, 178–199. [Google Scholar] [CrossRef]
- Ross, J.; Gilbert, R. Lacustrine sedimentation in a monsoon environment: The record from Phewa Tal, middle mountain region of Nepal. Geomorphology 1999, 27, 307–323. [Google Scholar] [CrossRef]
- Heyojoo, B.P.; Takhachhe, P. An Assessment of Lake Area Shrinkage through Geospatial Approach: Case study of Phewa Lake of Kaski District, Nepal. Int. J. Multidiscip. Curr. Res. 2014, 2, 725–728. [Google Scholar]
- Aryal, V. Phewa Lake Watershed Area: A Study on the Challenges to Human Encroachment. In Proceedings of the Taal 2007: The 12th World Lake Conference, Jaipur, India, 29 October–2 November 2007; pp. 2292–2299. [Google Scholar]
- Pokharel, S. Conservation of Phewa Lake of Pokhara, Nepal. 2009. Available online: http://rcse.edu.shiga-u.ac.jp/gov-pro/plan/2008list/06-020503.pdf (accessed on 27 May 2018).
- Pokharel, S. Lessons from Nepal on Developing a Strategic Plan for the Integrated Lake Basin Management Conservation of Phewa Lake of Pokhara, Nepal. Sigha University and ILEC. 2009. Available online: https://www.ilec.or.jp/ILBMTrainingMaterials/resources/nepal_strategy.pdf (accessed on 4 June 2018).
- GoN/EbA/UNDP. Development of Ecosystem Based Sediment Control Techniques and Esign of Siltation Dam to Protect Phewa Lake. Summary Report. Prepared By Forum for Energy and Environment Development (FEED) P. Ltd. for The Ecosystem Based Adaptation in Mountain Ecosystems (EbA) Nepal Project. 2015. Available online: http://www.np.undp.org/content/dam/nepal/docs/reports/environment%20and%20energy/UNDP_EBA_Siltation_Dam_Summary_Report.pdf (accessed on 3 June 2018).
- JICA/SILT. Final Report on the Development Study on the Environmental Conservation of Phewa Lake in Pokhara, Nepal. 2002. Available online: http://open_jicareport.jica.go.jp/619/619/619_116_11688165.html (accessed on 3 June 2018).
- Dixit, A.; Karki, M.; Shukla, A. Vulnerability and Impacts Assessment for Adaptation Planning in Panchase Mountain. Ecological Region, Kathmandu, Nepal. 2015. Available online: https://reliefweb.int/sites/reliefweb.int/files/resources/dixit_et_al_2015_nepal_via_report_panchase_final.pdf (accessed on 23 July 2018).
- The Himalayan Times. Clear Encroachment around Phewa Lake: SC. Himal. Times. 2018. Available online: https://thehimalayantimes.com/nepal/clear-encroachment-around-phewa-lake-supreme-court/ (accessed on 13 July 2018).
- Shrestha, G.K.C.; Pradhan, A.M.S. Morphometry, Water Quality and Sedimentation of Phewa Lake, Pokhara, Nepal. 2010. Available online: https://www.researchgate.net/profile/Ananta_Pradhan/publication/273063004_WATER_QUALITY_ECOLOGICAL_STATUS_AND_BATHYMETRY_OF_PHEWA_LAKE_POKHARA/links/5565574708aec4b0f4859a38.pdf (accessed on 27 May 2018).
- Fleming, B.; Fleming, J.P. A watershed conservation success story in Nepal: Land use changes over 30 years. Waterlines 2009, 28, 29–46. [Google Scholar] [CrossRef]
- Fort, M. The Pokhara Valley: A Product of a Natural Catastrophe. In Geomorphological Landscapes of the World; Migon, P., Ed.; Springer: Dordrecht, The Netherlands, 2010; pp. 265–274. [Google Scholar]
- Yamanaka, H. Terrace landform and Quaternary deposit around Pokhara valley, central Nepal. J. Nepal Geol. Soc. 1982, 2, 113–142. [Google Scholar]
- Carson, B. Erosion and Sedimentation Processes in the Nepalese Himalaya: ICIMOD Occasional Paper No. 1. 1985. Available online: http://lib.icimod.org/record/21453/files/attachment_87.pdf (accessed on 3 June 2018).
- Stolle, A.; Bernhardt, A.; Schwanghart, W.; Hoelzmann, P.; Adhikari, B.R.; Fort, M.; Korup, O. Catastrophic valley fills record large Himalayan earthquakes, Pokhara, Nepal. Quat. Sci. Rev. 2017, 177, 88–103. [Google Scholar] [CrossRef]
- Monecke, K.; Winsemann, J.; Hanisch, J. Climatic response of Quaternary alluvial deposits in the upper Kali Gandaki valley (West Nepal). Glob. Planet. Chang. 2001, 28, 293–302. [Google Scholar] [CrossRef]
- Ramsay, W.J.H. Erosion in the Middle Himalaya, Nepal with a Case Study of the Phewa Valley. Unpublished Master’s Thesis, University of British Columbia, Vancouver, BC, Canada, 1985; 160p. [Google Scholar]
- U.S. Geological Survey. Declassified Intelligence Satellite Photographs: U.S. Geological Survey Fact Sheet 2008–3054. 2008; 2p. Available online: https://pubs.usgs.gov/fs/2008/3054/pdf/fs2008-3054.pdf (accessed on 7 February 2019).
- McFeeters, S.K. The use of the Normalized Difference Water Index (NDWI) in the delineation of open water features. Int. J. Remote Sens. 1996, 17, 1425–1432. [Google Scholar] [CrossRef]
- Huggel, C.; Kääb, A.; Haeberli, W.; Teysseire, P.; Paul, F. Remote sensing based assessment of hazards from glacier lake outbursts: A case study in the Swiss Alps. Can. Geotech. J. 2002, 39, 316–330. [Google Scholar] [CrossRef]
- Haritashya, U.; Kargel, J.; Shugar, D.; Leonard, G.; Strattman, K.; Watson, C.; Shean, D.; Harrison, S.; Mandli, K.; Regmi, D. Evolution and Controls of Large Glacial Lakes in the Nepal Himalaya. Remote Sens. 2018, 10, 798. [Google Scholar] [CrossRef]
- Impat, P. Hydrometeorology and Sediment Data for Phewa Watershed: 1979 Data; Project Field Document No. 15; Department of Soil Conservation and Watershed Management; Ministry of Forest and Soil Conservation: Kathmandu, Nepal, 1981; 29p.
- Department of Soil Conservation. Sedimentation Survey of Phewa Lake; Department of Soil Conservation (DSC); Research and Soil Conservation Sections; HMG Ministry of Forest and Soil Conservation: Kathmandu, Nepal, 1994; pp. 1–26.
- Bandini, F.; Olesen, D.; Jakobsen, J.; Kittel, C.M.M.; Wang, S.; Garcia, M.; Bauer-Gottwein, P. Technical note: Bathymetry observations of inland water bodies using a tethered single-beam sonar controlled by an unmanned aerial vehicle. Hydrol. Earth Syst. Sci. 2018, 22, 4165–4181. [Google Scholar] [CrossRef]
- Farr, T.G.; Rosen, P.A.; Caro, E.; Crippen, R.; Duren, R.; Hensley, S.; Kobrick, M.; Paller, M.; Rodriguez, E.; Roth, L.; et al. The Shuttle Radar Topography Mission. Rev. Geophys. 2007, 45. [Google Scholar] [CrossRef]
- Ramachandran, B.; Dwyer, J.; Raup, B.H.; Kargel, J.S. ASTER Datasets and Derived Products for Global Glacier Monitoring. In Global Land Ice Measurements from Space; Kargel, J.S., Leonard, G.J., Bishop, M.P., Kääb, A., Raup, B.H., Eds.; Springer: Berlin/Heidelberg, Germany, 2014; pp. 145–162. [Google Scholar]
- Planet Team. Planet Team. Planet Application Program Interface. In Space for Life on Earth; Planet Team: San Francisco, CA, USA, 2018. [Google Scholar]
- Deptartment of Mines and Geology. Engineering and Environmental Geological Map of Pokhara Valley; Scale 1:50,000; Deptartment of Mines and Geology: Kathmandu, Nepal, 1998.
- Gurung, T.B.; Wagle, S.K.; Bista, J.D.; Dhakal, R.P.; Joshi, P.L.; Batajoo, R.; Adhikari, P.; Rai, A.K. Participatory fisheries management for livelihood improvement of fishers in Phewa Lake, Pokhara, Nepal. Himal. J. Sci. 2005, 3, 47–52. [Google Scholar] [CrossRef]
- Francois, J. Recherches Experimentales sur l´ecologie la Jacinthe d´eau Eichhornia Crassipes (Mart.) Solms. Ph.D thesis, Faculte Sci Agronom, Gembloux, Belgium, 1970. [Google Scholar]
- The Himalayan Times. SC Gives Govt Six Months to Raze Structures near Phewa Lake. 2018. Available online: https://thehimalayantimes.com/nepal/supreme-court-gives-govt-six-months-to-raze-structures-near-phewa-lake/ (accessed on 12 February 2019).
- Rai, A.K. Limnological characteristics of subtropical Lakes Phewa, Begnas, and Rupa in Pokhara Valley, Nepal. Limnology 2000, 1, 33–46. [Google Scholar] [CrossRef]
- Dhakal, S. The Role of Landslides on the Sediment Budget in Upper Phewa Lake Watershed, Western Nepal. Master’s Thesis, Geo-Information Science and Earth Observations, University of Twente, Enschede, The Netherlands, 2016; 65p. Available online: https://webapps.itc.utwente.nl/librarywww/papers_2016/msc/aes/dhakal.pdf (accessed on 4 June 2018).
- The Himalayan Times. Kaski, Myagdi Landslides Claim 33. Himal. Times. 2015. Available online: https://thehimalayantimes.com/nepal/kaski-myagdi-landslides-claim-33/ (accessed on 24 July 2018).
- My Republica. Flood of Fear. 2016. Available online: http://admin.myrepublica.com/opinion/story/37525/flood-of-fear.html (accessed on 12 February 2019).
- The Kathmandu Post. Kaski Landslides: Death Toll Climbs to 30 (with Pictures). 2015. Available online: http://kathmandupost.ekantipur.com/news/2015-07-30/kaski-landslides-death-toll-climbs-to-30-with-pictures.html (accessed on 12 February 2019).
- Lau, W.K.M.; Kim, K.-M. Fingerprinting the impacts of aerosols on long-term trends of the Indian summer monsoon regional rainfall. Geophys. Res. Lett. 2010, 37. [Google Scholar] [CrossRef]
- Genesis Consultancy (P) Ltd. Report on Impact of Settlement Pattern, Land-Use Practice and Options in High Risk Areas; Report for UNDP/ERRRP; Genesis Consultancy (P) Ltd.: Pokhara Sub-Metropolitan City, Nepal, 2009. [Google Scholar]
- Baral, P.; Wen, Y.; Urriola, N. Forest Cover Changes and Trajectories in a Typical Middle Mountain Watershed of Western Nepal. Land 2018, 7. [Google Scholar] [CrossRef]
- Paudyal, K.; Baral, H.; Putzel, L.; Bhandari, S.; Keenan, R. Change in land use and ecosystem services delivery from community-based forest landscape restoration in the Phewa Lake watershed, Nepal. Int. For. Rev. 2017, 19, 88–101. [Google Scholar] [CrossRef]
© 2019 by the authors. Licensee MDPI, Basel, Switzerland. This article is an open access article distributed under the terms and conditions of the Creative Commons Attribution (CC BY) license (http://creativecommons.org/licenses/by/4.0/).