Article

Validation of ESA Sentinel-2 L2A Aerosol Optical Thickness and Columnar Water Vapour during 2017–2018

by
María Ángeles Obregón
1,*,
Gonçalo Rodrigues
1,
Maria Joao Costa
2,
Miguel Potes
1 and
Ana Maria Silva
1
1
Department of Physics, Institute of Earth Sciences, Institute for Advanced Studies and Research, University of Évora, 7000-671 Évora, Portugal
2
Department of Physics, Institute of Earth Sciences, School of Science and Technology, University of Évora, 7000-671 Évora, Portugal
*
Author to whom correspondence should be addressed.
Remote Sens. 2019, 11(14), 1649; https://doi.org/10.3390/rs11141649
Submission received: 23 May 2019 / Revised: 4 July 2019 / Accepted: 9 July 2019 / Published: 11 July 2019
(This article belongs to the Special Issue Satellite Derived Global Atmosphere Product Validation/Evaluation)

Abstract

:
This study presents a validation of aerosol optical thickness (AOT) and integrated water vapour (IWV) products provided by the European Space Agency (ESA) from multi-spectral imager (MSI) measurements on board the Sentinel-2 satellite (ESA-L2A). For that purpose, data from 94 Aerosol Robotic Network (AERONET) stations over Europe and adjacent regions, covering a wide geographical region with a variety of climate and environmental conditions and during the period between March 2017 and December 2018 have been used. The comparison between ESA-L2A and AERONET shows a better agreement for IWV than the AOT, with normalized root mean square errors (NRMSE) of 5.33% and 9.04%, respectively. This conclusion is also reflected in the values of R2, which are 0.99 and 0.65 for IWV and AOT, respectively. The study period was divided into two sub-periods, before and after 15 January 2018, when the Sentinel-2A spectral response functions of bands 1 and 2 (centered at 443 and 492 nm) were updated by ESA, in order to investigate if the lack of agreement in the AOT values was connected to the use of incorrect spectral response functions. The comparison of ESA-L2A AOT with AERONET measurements showed a better agreement for the second sub-period, with root mean square error (RMSE) values of 0.08 in comparison with 0.14 in the first sub-period. This same conclusion was attained considering mean bias error (MBE) values that decreased from 0.09 to 0.01. The ESA-L2A AOT values estimated with the new spectral response functions were closer to the correspondent reference AERONET values than the ones obtained using the previous spectral response functions. IWV was not affected by this change since the retrieval algorithm does not use bands 1 and 2 of Sentinel-2. Additionally, an analysis of potential uncertainty sources to several factors affecting the AOT comparison is presented and recommendations regarding the use of ESA-L2A AOT dataset are given.

Graphical Abstract

1. Introduction

Aerosols and water vapour are two of the most important atmospheric constituents of the Earth-atmosphere system because they attenuate solar radiation through scattering and absorption processes, and also modulate terrestrial radiation mainly by absorption and emission. The effect of aerosols and water vapour on short wave (SW) irradiance was analysed by Obregón et al. [1], who showed that the combined effect of those quantities was not simply the sum of their individual effects. The effect of each constituent has been also studied by Alexandri et al. [2]. Atmospheric aerosols also indirectly affect the radiation balance by influencing cloud formation. Changes in the atmospheric composition due to these constituents can modify the radiative budget and, as a result, the global temperature of the Earth [3]. Moreover the aerosol load in the atmospheric column (AOT) and the total water vapour integrated over an atmospheric column (IWV) are key quantities for atmospheric correction of satellite radiation measurements, and their reliability greatly influence the accuracy of the surface reflectance satellite derived products [4].
AOT and IWV data can be obtained from sunphotometer measurements. However, these are representative of point measurements at the surface, providing local information corresponding to the specific locations where the measurement stations are located and, therefore, cannot provide the spatial coverage required for global monitoring. Consequently, if the objective is to perform studies on a regional or global scale, it is better to use data with global coverage, such as those provided by instruments on board satellite platforms. Some of the instruments used to retrieve aerosol related quantities and/or water vapour on board satellite platforms as Terra, Aqua, Aura, Calipso, Meteosat or Sentinel-2, among others, are moderate resolution imaging spectroradiometer (MODIS), multi-angle imaging spectro-radiometer (MISR), ozone monitoring instrument (OMI), spinning enhanced visible and infrared imager (SEVIRI), cloud-aerosol LIdar with orthogonal polarization (CALIOP), multi-spectral imager (MSI), etc. Most AOT and IWV data derived from observations with these instruments have already been validated with data obtained from the Aerosol Robotic Network (AERONET) sunphotometer measurements [4,5,6,7,8,9,10,11,12]. These last three studies have validated AOT and IWV data obtained from the implementation of the offline version of an atmospheric correction algorithm to data from MSI measurements on board the Sentinel-2 satellite, termed Sen2Cor [13]. However, there are more recent AOT and IWV data, such as those obtained from MSI measurements on board the Sentinel-2 satellite and processed by the European Space Agency (ESA) for Europe, concretely level 2A (ESA-L2A) data, and its validation has not yet been performed in a general way. Djamai et al. [14] validated ESA-L2A AOT and IWV but only used five data points belonging to three AERONET stations, one in Spain and two in France, during the period April - October 2017. Due to the reduced number of data points and the very short time period, this validation is very limited, both spatially and temporally. Therefore, the objective of this work is to validate ESA-L2A AOT and IWV over Europe and adjacent regions (western Asia and northern Africa), under cloud-free conditions, using as many reference data as possible. Satellite AOT products that present high spatial resolution are of great interest since they can be used to study local sources of aerosols in urban areas [15] and monitor local air pollution [16]. In these areas, aerosol distributions can present important spatial variations due to the means of transportation, construction infrastructure, industrial activity or variations in the density of the human population. The use of high spatial resolution satellite AOT data support the identification of local peak concentrations and allow defining concentration gradients between surface monitoring stations. In addition, Sentinel-2 satellite is of great interest to study surface features and processes taking advantage of its high spatial resolution. This requires an accurate atmospheric correction of the images, therefore the need for assessing and improving Sentinel-2 atmospheric products. The reference data used, as in other similar validation studies, are AOT and IWV data derived from AERONET sunphotometer measurements. Specifically, data from 94 AERONET stations Supplementary Materials during the period between March 2017 and December 2018 have been used for this study. This time period covers four seasons, which may be of some interest at particular regions.
This paper is organized as follows. The data used in this study are described in Section 2. In Section 3, the methodology is presented. The main results are shown and discussed in Section 4. An analysis of potential uncertainty sources is provided in Section 5 and conclusions are given in Section 6.

2. Data

2.1. SENTINEL-2

Sentinel-2 is an Earth observation mission from the Copernicus Programme, developed and operated by the ESA that acquires high spatial resolution images over land and coastal waters. The mission consists of a constellation of two twin satellites operating in the same sun-synchronous orbit (180° apart; descending node at 10:30 am), Sentinel-2A and Sentinel-2B, launched on 23 June 2015 and 7 March 2017, respectively. The swath width is 290 km, with a repeat cycle of five days under the same viewing conditions. In some regions the revisit time is lower under different viewing conditions, due to overlap between swaths from adjacent orbits. A MSI is installed on both satellites. The MSI measures the Earth’s reflected radiance in 13 spectral bands (Table 1) from visible/near infrared (VNIR) to short wave infrared spectral range (SWIR), with four bands at 10 m, six bands at 20 m, and three bands at 60 m of spatial resolution. The bands at 60 m are used to perform atmospheric correction and cloud screening [17].
Sentinel-2 MSI Level-1C products are atmospherically corrected through the implementation of Sen2Cor method [18], obtaining Level-2A bottom of the atmosphere (BOA) reflectance products (L2A). The method was developed for application over land surfaces but it can be also applied over water surfaces. However, it should be noted that the processor does not consider water surface effects such as sunglint. L2A products include BOA reflectance images, maps of AOT at 550 nm, IWV and scene classification (SCL), among others. Sen2Cor estimates AOT at 550 nm on the basis of the dense dark vegetation (DDV) pixel method introduced by Kaufman and Sendra [19]. AOT is derived from a correlation of short wave infra-red (SWIR) reflectance (band 12, see Table 1) with the blue (band 2, see Table 1) and red (band 4, see Table 1) reflectances. If there are no DDV pixels in the image, the AOT cannot be estimated and Sen2Cor uses a fallback solution. This solution is to perform the atmospheric correction with a constant AOT, which is specified by the start (default) visibility of 40 km, corresponding to an AOT of approximately 0.2 at sea level. IWV is retrieved from a Level-1C image by means of a Sentinel-2 adapted atmospheric pre-corrected differential absorption (APDA) algorithm [20], which uses spectral bands 8A and 9 (see Table 1). Band 8a is the reference channel in an atmospheric window region, whereas band 9 is the measurement channel in the water vapour absorption region. The total Sun-ground-sensor and path radiances are calculated for both bands, assuming that the surface reflectance is the same in both. The radiance ratio obtained between the measurement channel (water vapour absorption) and the reference channel (not influenced by water vapour) is then a measure of the water vapour column content (IWV). The scene classification is separated into the 11 classes presented in Table 2. The objective of this product is not to classify the land cover in a strict sense, but to distinguish between cloudy, clear and water pixels, to be used internally in Sen2Cor for atmospheric correction purposes. The accuracy requirement limits defined by ESA [21] for AOT and IWV equal 10% of the reference AOT value plus 0.03, and 10% of the reference IWV value plus 0.2, respectively.
ESA provides L2A products based on an implementation of the Sen2Cor algorithm [13], but also provides an offline version of the Sen2Cor to produce L2A products [22]. In this study, the data used belong to the first option, and more specifically to the ESA-L2A products that are systematically generated at the ground segment over Europe and adjacent areas since March 2017. The Copernicus Open Access Hub provides complete, free and open access to Sentinel-2 data that are available to users in SENTINEL-SAFE format (https://scihub.copernicus.eu/dhus/#/home). The Sentinel-2 tiles (granules of 100 km × 100 km) were downloaded with cloud cover conditions lower than 90%. AOT and IWV products are provided with a spatial resolution of 20 m. Only pixels with SCL of dark area, vegetation or bare soils were considered.

2.2. AERONET

The aerosol robotic network (AERONET) products (https://aeronet.gsfc.nasa.gov/) were used here as ground-based reference values to validate Sentinel-2 ESA-L2A AOT at 550 nm and IWV. It is very common to use this reference data because: (a) The sunphotometer provides a near-direct measurement of the extinction, which is therefore much more reliable than the satellite measurements; (b) AERONET provides a globally distributed long-term and accessible public database of these products; (c) AERONET has a high level of standardization of instruments, calibration, processing and distribution [23]. Specifically, data from 94 AERONET stations distributed throughout Europe, western Asia and northern Africa have been used. Figure 1 displays the geographical location of the AERONET sites considered, located in various regions, coastal and inland, at different altitudes, latitudes and longitudes, representing a great variety of climate and environmental conditions. This constitutes a valuable set of reference data to assess the accuracy of Sentinel-2 level 2A AOT and IWV atmospheric products.
All ground-based stations are equipped with CIMEL CE-318 sunphotometers, the standard instrument of the AERONET network. This instrument performs direct sun measurements in 9 channels covering the spectral range between 340 and 1020 nm. In particular, the 940 nm channel is used to retrieve IWV, since water vapour has a strong absorption at this wavelength. The estimated uncertainty in AOT under cloud-free conditions is 0.01 for wavelengths higher than 440 nm and 0.02 for shorter wavelengths [23,24]. For IWV, the uncertainty is less than 12% [23]. A more detailed description about the CIMEL sunphotometer, as well as the protocol applied by AERONET to process all radiance measurements and provide AOT, IWV and inversion products have been documented by Holben et al. [23]. AERONET version 3 algorithm processing includes three different quality levels (1.0, 1.5 and 2.0). Levels 1.0 and 1.5 (cloud-screened and quality controlled) are provided in near real-time, whereas level 2.0 (quality-assured) may present a delay of more than 12-months due to final calibration and manual inspection, ensuring the highest data quality. In this study, AOT and IWV from version 3 level 2.0 have been used. This means that the data at this level are not available until the sunphotometers are subjected to calibration which is usually done once a year. Hence, the period of data used in this study is from March 2017 (beginning of the ESA-L2A database) until December 2018, when most stations used already had Level 2.0 data available when the study began.
The ESA-L2A AOT product is provided at the reference wavelength of 550 nm, however this is not a direct product of AERONET. Therefore, it is necessary to convert AERONET AOT at λ wavelength to AOT at 550 nm. The conversion has been performed using the Ångström power law (Equation (1)):
A O T 550 = A O T λ ( 550 λ ) α
where α is the Ångström exponent in the wavelength range of 440–870 nm and λ is the wavelength.

3. Methodology

The ESA-L2A retrieved AOT and IWV products were compared with independent space–time-collocated AERONET AOT and IWV quantities retrieved from the sunphotometer measurements. For this purpose, subsets of 9 km × 9 km, around the coordinates of each AERONET site were extracted from the MSI tiles, following the procedures of other validation studies (e.g., [12,14]). The procedure was limited at each site by the existence of AERONET level 2.0 data with a temporal difference of less than ±1 h from the satellite time overpass. The next step was to identify the valid pixels within the subsets for the validation process. Each of the subset pixels, with a spatial resolution of 20 m, is assigned a value of AOT, IWV and scene classification, among other products. In this study, only those pixels with scene classifications of a dark area (codified as 2), vegetation (codified as 4) or bare soils (codified as 5) were considered. Once these pixels were identified, their percentage was calculated, finally selecting those subsets with percentages greater than 50%. It is noted that pixels classified as water (scene classification 6), have not been taken into account in the calculation of this percentage. Subsequently, the AOT and IWV averages were computed for each subset with the pixels that met the defined criteria. The closest AOT and IWV AERONET data to the satellite overpass were selected for each station, considering a maximum difference of ±1 h from the satellite overpass, as mentioned before. AERONET data fulfilling this condition were then selected and linearly interpolated to estimate the value of these products at the exact time of the satellite overpass. The existence of AERONET AOT and IWV products, both in the previous and subsequent hour, is a necessary condition to perform such an interpolation.
After these collocation steps, the two initial databases (ESA-L2A and AERONET Level 2.0) are reduced to two composed of spatial and temporal coincident cases in a total of 2398 pairs of data. AOT and IWV of both databases have been compared in order to evaluate the accuracy of AOT and IWV ESA-L2A products. Common statistical indicators have been used in this study to obtain an appropriate comparative assessment of both datasets. The mean bias error (MBE), which is a measure of the overall error or systematic error, was calculated as follows:
MBE = 1 N ( X X ref )
where N is the size of the sample corresponding to the total number of data, X are ESA-L2A products data and Xref are the ground-based reference values, i.e., AERONET Level 2.0 data.
The root mean square error (RMSE) gives a measure of the error existing between ESA-L2A products data and AERONET Level 2.0 products data. Small values of the RMSE indicate that the regression fit is acceptable. This parameter is expressed as:
RMSE = 1 N ( X X ref ) 2
Also, normalized values of the previous statistic indicators (NMBE and NRMSE) have been calculated to compare AOT and IWV.
NMBE = MBE max ( X ref ) min ( X ref ) × 100
NRMSE = RMSE max ( X ref ) min ( X ref ) × 100
Another statistical indicator is the determination coefficient (R2), which indicates the accuracy of the obtained regression fit from the comparison. This parameter, which shows how much the model is able to describe the data, should be close to 1.

4. Results

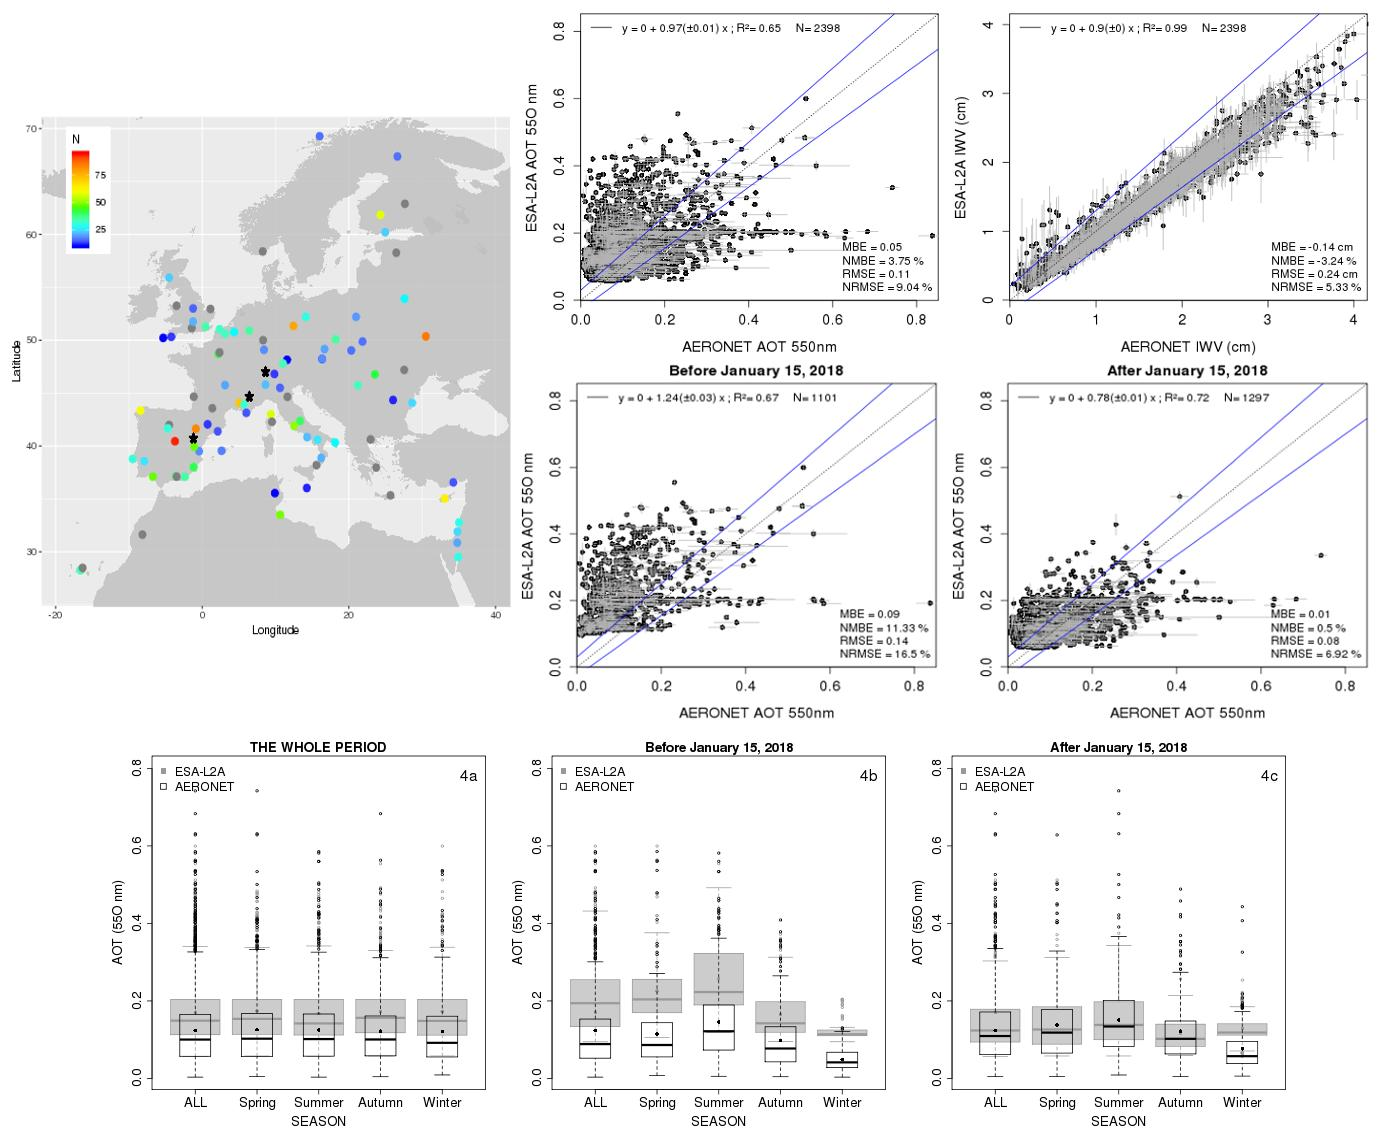
Figure 2 presents the scatter plots of the 2398 ESA-L2A retrievals of AOT (a) and IWV (b) versus the coincident reference AERONET Level 2.0 quantities retrieved from the ground-based measurements. This figure also shows the regression line, MBE, NMBE, RMSE, NRMSE and R2 values obtained for each quantity. The intercomparison of ESA-L2A and AERONET derived quantities showed a better agreement for IWV than for the AOT, with NRMSE of 5.33 and 9.04%, respectively. This conclusion was also reflected in the values of R2, which are 0.99 and 0.65 for IWV and AOT, respectively. From this figure, it was extracted that the NMBE corresponding to AOT was 3.75%, while for IWV, it presented a negative value of −3.24%. These results indicated that ESA-L2A AOT data overestimated the reference values, while the opposite occurred with IWV. The value of MBE for AOT (0.05) was lower than the value of MBE reported in Djamai et al. [14] (0.07). However, the value of MBE for IWV (−0.14 cm), although with the same sign, presented a higher absolute value than that reported by Djamai et al. [14] (−0.02 cm). It should be taken into account that these authors only used five data points belonging to three AERONET stations from the south of Europe (see Figure 1) during the period April 2017–October 2017. This was a reduced dataset compared with the 94 AERONET sites covering a wide geographical region with a variety of climate and environmental conditions considered in the present study.
Figure 2 also shows the accuracy requirement limits for AOT and IWV defined by ESA [21], represented with solid blue lines. As it can be observed, IWV meets the accuracy requirements better than AOT. Specifically, from the 2398 data points used in this study, 2167 IWV data points (90.4%) were within the limits defined by ESA, while, in the case of AOT, only 875 (36.5%) met the requirement. Another aspect to be highlighted in this figure was that the minimum value of ESA-L2A AOT was 0.06. This value is greater than the minimum value of AERONET AOT, which is close to zero. In fact, 26.9% of AERONET AOT data were lower than 0.06. With respect to IWV, it was also observed that the minimum value of ESA-L2A IWV, 0.15, was higher than the minimum value of AERONET IWV, which was 0.04. However, in this case only sixteen AERONET IWV data were lower than 0.15.
According to information from ESA (https://earth.esa.int/web/sentinel/missions/sentinel-2/news/; last accessed 21/05/2019), a new version of the Sentinel-2A spectral response functions is used from 15 January 2018 onwards, mainly correcting the responses for bands 1 and 2 due to inaccurate spectral responses provided previously and used in the above retrievals before 15 January 2018. Band 2, centered at 492 nm, is used to estimate AOT, thus one of the reasons for the poor agreement between ESA-L2A AOT estimates and AERONET AOT data could be the use of incorrect spectral response functions to estimate ESA-L2A AOT. This is investigated by dividing the data into two sub-periods, before and after the spectral response function update, and inter-comparing ESA-L2A AOT and AERONET AOT in the two sub-periods. The first sub-period includes the data obtained with the old spectral response functions, i.e., from the beginning of the study period (March 2017) until 14 January, 2018 and the second sub-period includes the data obtained with the new spectral response functions, from 15 January to December 2018.
Figure 3 presents the scatter plots of AOT from ESA-L2A retrievals versus coincident AERONET Level 2.0 data for the two sub-periods. As it can be seen in this figure, the inter-comparison of ESA-L2A AOT and AERONET showed a better agreement for the second sub-period than for the first one, with RMSE values of 0.14 and 0.08, respectively for the first and second sub-periods. Therefore, ESA-L2A AOT values estimated with the new spectral response functions are closer to the reference values than the ones obtained with the previous spectral response functions. This conclusion was also verified through the calculation of the MBE values, obtaining 0.01 for the period after 15 January, 2018 compared with the 0.09 value obtained for the period before 15 January, 2018. The values of RMSE and MBE for the two sub-periods have also been compared with the values obtained for the whole period, displayed in Table 3. This indicated that the two statistical indicators have been drastically reduced for the sub-period with the new spectral response functions, compared with the entire period, being even smaller than the ones reported by Djamai et al. [14] of 0.07 (MBE) and 0.09 (RMSE). It can be concluded that with the use of these new spectral response functions, the quality of the ESA-L2A AOT estimates has significantly improved. The results of this study are compared to those reported by Bilal et al. [25], regarding the evaluation of AOT retrievals from MODIS using AERONET, in the same region. Despite the different spatial resolutions considered in both studies, the results obtained were very similar in terms of RMSE and MBE values.
The differences between the two AOT datasets (ESA-L2A and AERONET) calculated for the entire study period (March 2017–December 2018), for the first (March 2017–January 2018) and the second sub-periods (January 2018 onwards) are also discernible when a seasonal analysis is carried out as presented in Figure 4. This figure presents the box and whisker plots for each period of analysis (complete, first and second sub-periods) of ESA-L2A AOT and AERONET AOT databases for the entire time period and for each season (spring- M,A,M-, summer-J,J,A-, autumn- S,O,N- and winter- D, J, F). When the entire study period was considered (Figure 4a), no seasonality was observed, and the statistical values for each season were very similar. It was also observed that ESA-L2A AOT values were higher than AERONET AOT values in all seasons. However, when the sub-periods were analysed separately, the behaviors were moderately different. For example, in Figure 4b, corresponding to the sub-period before 15 January, 2018, seasonality was observed in the AOT values of the two databases, obtaining the highest values in summer, and the lowest in winter. The small overlap between the two databases in winter was due to the minimum value of ESA-L2A AOT, which was 0.06, while the minimum value of AERONET was lower. However, the differences between the values of ESA-L2A and AERONET estimates were greater in this sub-period (for each season and the entire time) than when the entire study period was considered (Figure 4a). It should be noticed that in Figure 4b the boxes characterizing the inter-quartile ranges only overlap in autumn, whereas in Figure 4a, they overlap in all seasons and for the whole time period. On the other hand, if the second sub-period is used (Figure 4c) a greater overlap of both databases is obtained, which means that ESA-L2A AOT and AERONET AOT values show a better agreement when using the new spectral response functions in the ESA AOT retrievals. Moreover, the AOT values also showed seasonality, with the highest values in summer and the lowest in winter. The high AOT values in summer are due to a combination of factors that occur in this period of the year. One of them is the lack of precipitation, favoring the presence of aerosols in the atmosphere. Another factor is the arrival of desert-dust aerosols from the Saharan region and the summer forest fires, which are important sources of aerosols in the stations of the Mediterranean region [26,27] (South Europe and North Africa/Middle East). In this study, stations of the Mediterranean region predominate with respect to those of northern Europe, hence, these aerosol sources have a great influence on summer AOT values. This seasonal variation of AOT was also observed by other authors [28,29,30].

5. Analysis of Potential Uncertainty Sources

Since the correlation between ESA-L2A AOT estimates and AERONET AOT data is not very good, it improves when the correct spectral response functions are applied. Hence, a sensitivity analysis to key factors, as the scene classification class, the region and the aerosol type, has also been performed.
As mentioned, in this study only pixels with scene classifications classes 2 (Dark_Area_PIXELS), 4 (Vegetation) and 5 (Bare_soils) were considered. In order to estimate the sensitivity of the intercomparison to scene classification, the study was performed individually for each scene classifications class. The results obtained are shown in Table 4, both for the whole period and for the sub-period after 15 January, 2018. From this table, the best agreement between the two AOT datasets was obtained for the scene class 4 (Vegetation), with RMSE of 0.08 and 0.10, respectively. This conclusion was also reflected in the values of R2, which were 0.74 and 0.81 for the whole period and for the sub-period after 15 January, respectively.
Regional variation is also an important factor to take into account in the assessment of Sentinel-2 AOT values, since each region presents different environmental conditions and is typically influenced by different aerosol types. For this reason, the stations have been grouped into three regions (North Europe, South Europe, and North Africa/Middle East) in order to investigate the effect of regional variations on the ESA-L2A AOT product accuracy. The results obtained are presented in Table 5 and show that there are regional differences, with the best agreement obtained for the North Europe region and the worst agreement in North Africa/Middle East region, both for the whole period and for the sub-period after 15 January, 2018. The reason for the poor correlation between the two AOT datasets in the North Africa and Middle East regions is due to the assignment of AOT values of 0.2 (corresponding to the initial visibility assumed by the algorithm), as illustrated in Figure 5, which occurs when the scene does not contain reference pixels for the calculation. The sensitivity of the comparison to different aerosol types was analysed using the classification proposed by Elias et al. [31], who presented a criterion to classify the aerosol turbidity situations based on both the values of AOT and the Ångström exponent. The aerosol types proposed are clean (CL), continental (CO), maritime (MA), forest fires emissions (FF) and desert dust (DD). Table 6 shows the values of MBE, RMSE and R2 for each aerosol type, both for the whole period and for the sub-period after 15 January, 2018. From this table, CO type presented the best agreement between ESA-L2A AOT estimates and AERONET AOT data, with the lowest MBE and RMSE values. However, DD type presented the worst correlation due to the existence of a large number of cases with ESA-L2A AOT value equal to 0.2, showing the relationship between this aerosol type and the North Africa region. The most negative value of MBE corresponded to FF aerosol type. This means that there is an underestimation of ESA-L2A AOT in relation to AERONET AOT during these episodes, characterized by very high AOT values. Followed by these values of MBE were those corresponding to CL and MA types, although with positive values which indicated an overestimation of ESA-L2A AOT. This was because the minimum value of ESA-L2A AOT was 0.06, which was much higher than most of the lowest values of AERONET AOT, characterizing CL and MA aerosol types. Also the highest values of AOT were not well represented by ESA-L2A AOT product, as illustrated in Figure 5.
The previous sensitivity analyses allows the conclusion that ESA-L2A AOT estimates equal to 0.2 and AERONET AOT values lower than 0.06 and higher than 0.4 worsen the correlations between ESA-L2A AOT estimates and AERONET AOT data. Therefore, in the following analysis, AERONET AOT values lower than 0.06, higher than 0.4 and data corresponding to stations that present more than 20% of the ESA-L2A AOT values equal to 0.2 have not been considered. This analysis has been performed only for the sub-period after 15 January, 2018. The results obtained are presented in Figure 6 and constitute the recommended dataset to use for quantitative purposes. This figure shows that the correlation between ESA-L2A AOT estimates and AERONET AOT data is better (R2 equal to 0.84) than that obtained without the exclusions described and shown in Figure 3 (R2 equal to 0.72). The value of RMSE also decreased, from 0.08 to 0.07. This new AOT dataset meets the ESA accuracy requirements better than the complete AOT dataset presented in Figure 3 (without the exclusions described). Specifically, from the 838 data points used, 526 AOT data points (62.8%) were within the error limits defined by ESA, whereas previously only 36.5% of the AOT data met this requirement.
Therefore, it can be concluded that ESA-L2A AOT product should be used with caution in two cases: (a) Regions where the appropriate AOT value is often not estimated (due to the lack of DDV regions) and the value of 0.2 is assigned, and (b) regions with extreme visibility values (high or low), that is, sites that normally have very low or high AOT values. It would be advisable to use more than one default value (start visibility), according to the geographic area and season. These reference values could be obtained from a climatological analysis of ground-based or satellite reference data (AERONET for example). This would be important because in the cases with no DDV pixels available to obtain ESA-L2A AOT estimates, the AOT corresponding to the start visibility is used, which causes important errors as demonstrated here.

6. Conclusions

This study contributes to the validation of AOT and IWV products provided by ESA from MSI measurements on board the Sentinel-2 satellite, respectively AOT ESA-L2A and IWV ESA-L2A. These products have been validated by comparison with data from 94 AERONET stations over Europe and adjacent regions and during the period between March 2017 and December 2018. The results indicated that ESA-L2A AOT data overestimated the reference values with NMBE of 3.75%, while the opposite occurred with IWV presenting a NMBE of −3.24%. The results showed a good agreement for IWV with NRMSE of 5.33% and R2 above 0.99. However, a larger disagreement was obtained for AOT, with NRMSE of 9.04% and R2 equal to 0.65. One possible cause for this lack of agreement in the AOT values could be due to the use of inaccurate spectral response functions, which impacted the retrieval of AOT ESA-L2A product from MSI measurements (the most affected were bands 1 and 2 and AOT retrieval uses band 2, among others). A new version of the Sentinel-2A spectral response functions is used from 15 January, 2018 onwards. Therefore, the study period was divided into two sub-periods, before and after 15 January, 2018. The inter-comparison of ESA-L2A AOT with AERONET AOT showed a better agreement for the second sub-period than for the first one, with RMSE (and MBE) values of 0.08 (0.01) for the second sub-period and 0.14 (0.09), for the first one. These values of RMSE and MBE were also smaller than the ones reported by Djamai et al. [14], of 0.09 and 0.07, respectively. The seasonal differences between AOT ESA-L2A and AOT AERONET data for the entire study period, the first sub-period and the second sub-period have also been analysed. The results showed no seasonality for the entire period. However, when the sub-periods were analysed separately, seasonality was observed, obtaining the highest AOT values in summer and the lowest in winter. For the first sub-period, the differences between the ESA-L2A and AERONET AOT estimates were greater in this sub-period than for the entire study period for all seasons. On the other hand, if the second sub-period is considered, a greater overlap of both databases is obtained for all seasons. Therefore, it can be concluded that with the use of these new spectral response functions the quality of the ESA-L2A AOT estimates has significantly improved. An analysis of potential uncertainty sources showed that the algorithm accuracy highly depended on the AOT first guess and that this was a critical issue over bright surfaces. It is recommended to update the algorithm in order to consider different initial visibility values, based for example, on reference climatologies.

Supplementary Materials

The following are available online at https://www.mdpi.com/2072-4292/11/14/1649/s1, Table S1: List of the 94 AERONET stations used in the validation. Columns indicate the designation, longitude, latitude, altitude and number of data.

Author Contributions

Conceptualization, M.Á.O., G.R., M.J.C., M.P. and A.M.S.; Methodology, M.Á.O., G.R. and M.J.C.; Software, M.Á.O., G.R.; Validation, M.Á.O., G.R., M.J.C., M.P. and A.M.S.; Formal Analysis, M.Á.O., G.R., M.J.C., and A.M.S.; Investigation, M.Á.O., G.R., M.J.C., M.P. and A.M.S.; Resources, M.Á.O., G.R., and M.J.C.Data Curation, M.Á.O., G.R., and M.J.C.; Writing—original draft preparation, M.Á.O.; Writing—Review and Editing, M.Á.O., G.R., M.J.C., M.P. and A.M.S.; Visualization, M.Á.O.; Supervision, M.J.C. and A.M.S.; Project Administration, M.J.C., and A.M.S.; Funding Acquisition, M.J.C., M.P. and A.M.S.

Funding

This work was partially supported by FCT (Fundação para a Ciência e a Tecnologia) through the grants SFRH/BPD/86498/2012 and SFRH/BSAB/143164/2019 with national funding. The work is co-funded by the European Union through the European Regional Development Fund, included in the COMPETE 2020 (Operational Program Competitiveness and Internationalization) through the ICT project (UID/GEO/04683/2013) with the reference POCI-01-0145- FEDER-007690 and also through ALOP (ALT20-03-0145-FEDER- 000004), DNI-A (ALT20-03-0145-FEDER-000011), TOMAQAPA (PTDC/CTAMET/29678/2017) projects, and in the framework of the Interreg V A Spain - Portugal program (POCTEP) through the CILIFO project (Ref: 0753_CILIFO_5_E).

Acknowledgments

The authors thank Copernicus and ESA for the data Sentinel-2 provided to carry out this work and to Olivier Hagolle for providing open source codes to massive Sentinel-2 data download. Thanks are due to AERONET/PHOTONS for the scientific and technical support. We thank the (PI(s) and Co-I(s)) and their staff for establishing and maintaining the 94 sites used in this investigation. CIMEL calibration was performed at the AERONET-EUROPE GOA calibration center, supported by ACTRIS under agreement no. 654109 granted by European Union (H2020-INFRAIA-2014-2015).

Conflicts of Interest

The authors declare no conflicts of interest.

References

  1. Obregón, M.A.; Costa, M.J.; Silva, A.M.; Serrano, A. Impact of aerosol and water vapour on SW radiation at the surface: Sensitivity study and applications. Atmos. Res. 2018, 213, 252–263. [Google Scholar] [CrossRef]
  2. Alexandri, G.; Georgoulias, A.K.; Zanis, P.; Katragkou, E.; Tsikerdekis, A.; Kourtidis, K.; Meleti, C. On the ability of RegCM4 regional climate model to simulate surface solar radiation patterns over Europe: An assessment using satellite-based observations. Atmos. Chem. Phys. 2015, 15, 13195–13216. [Google Scholar] [CrossRef]
  3. Forster, P.; Ramaswamy, V.; Artaxo, P.; Berntsen, T.; Betts, R.; Fahey, D.W.; Haywood, J.; Lean, J.; Lowe, D.C.; Myhre, G.; et al. Changes in atmospheric constituents and in radiative forcing. In Climate Change 2007: The Physical Science Basis. Contribution of Working Group I to the Fourth Assessment Report of the Intergovernmental Panel on Climate Change; Solomon, S., Qin, D., Manning, M., Chen, Z., Marquis, M., Averyt, K.B., Tignor, M., Miller, H.L., Eds.; Cambridge University Press: Cambridge, UK; New York, NY, USA, 2007. [Google Scholar]
  4. Gascon, F.; Bouzinac, C.; Thépaut, O.; Jung, M.; Francesconi, B.; Louis, J.; Lonjou, V.; Lafrance, B.; Massera, S.; Gaudel-Vacaresse, A.; et al. Copernicus sentinel-2 calibration and products validation status. Remote Sens. 2017, 9, 584. [Google Scholar] [CrossRef]
  5. Chu, D.A.; Kaufman, Y.J.; Ichoku, C.; Remer, L.A.; Tanre, D.; Holben, B.N. Validation of MODIS aerosol optical depth retrieval over land. Geophys. Res. Lett. 2002, 29, 1617. [Google Scholar] [CrossRef]
  6. Kahn, R.A.; Gaitley, B.J.; Martonchik, J.V.; Diner, D.J.; Crean, K.A.; Holben, B. Multiangle Imaging Spectroradiometer (MISR) global aerosol optical depth validation based on 2 years of coincident Aerosol Robotic Network (AERONET) observations. J. Geophys. Res. 2005, 110, D10S04. [Google Scholar] [CrossRef]
  7. Levy, R.C.; Mattoo, S.; Munchak, L.A.; Remer, L.A.; Sayer, A.M.; Patadia, F.; Hsu, N.C. The Collection 6 MODIS aerosol products over land and ocean. Atmos. Meas. Tech. 2013, 6, 2989–3034. [Google Scholar] [CrossRef] [Green Version]
  8. Prasad, A.K.; Singh, R.P. Validation of MODIS Terra, AIRS, NCEP/DOE AMIP-II Reanalysis-2, and AERONET Sun photometer derived integrated precipitable water vapor using ground-based GPS receivers over India. J. Geophys. Res. 2009, 114, D05107. [Google Scholar] [CrossRef]
  9. Bibi, H.; Alam, K.; Chishtie, F.; Bibi, S.; Shahid, I.; Blaschke, T. Intercomparison of MODIS, MISR, OMI, and CALIPSO aerosol optical depth retrievals for four locations on the Indo-Gangetic plains and validation against AERONET data. Atmos. Environ. 2015, 111, 113–126. [Google Scholar] [CrossRef]
  10. Sayer, A.M.; Munchak, L.A.; Hsu, N.C.; Levy, R.C.; Bettenhausen, C.; Jeong, M.J. MODIS Collection 6 aerosol products: Comparison between Aqua’s e-Deep Blue, Dark Target, and merged data sets, and usage recommendations. J. Geophys. Res. Atmos. 2014, 119, 13–965. [Google Scholar] [CrossRef]
  11. Pflug, B.; Main-Knorn, M.; Bieniarz, J.; Debaecker, V.; Louis, J. Early Validation of Sentinel-2 L2A Processor and Products. In Proceedings of the Living Planet Symposium 2016, Prague, Czech Republic, 9–13 May 2016. ESA SP-740. [Google Scholar]
  12. Doxani, G.; Vermote, E.; Roger, J.C.; Gascon, F.; Adriaensen, S.; Frantz, D.; Hagolle, O.; Hollstein, A.; Kirches, G.; Li, F.; et al. Atmospheric Correction Inter-Comparison Exercise. Remote Sens. 2018, 10, 352. [Google Scholar] [CrossRef]
  13. Mueller-Wilm, U.; Devignot, O.; Pessiot, L. Sen2Cor Configuration and User Manual. S2-PDGS-MPC-L2A-SUM-V2.4. 2017. Available online: http://step.esa.int/thirdparties/sen2cor/2.4.0/Sen2Cor_240_Documenation_PDF/S2-PDGS-MPC-L2A-SUM-V2.4.0.pdf (accessed on 1 December 2017).
  14. Djamai, N.; Fernandes, R. Comparison of SNAP-Derived Sentinel-2A L2A Product to ESA Product over Europe. Remote Sens. 2018, 10, 926. [Google Scholar] [CrossRef]
  15. Thomas, C.; Briottet, X.; Santer, R. Remote sensing of aerosols in urban areas from very high spatial resolution images: Application of the OSIS code to multispectral PELICAN airborne data. Int. J. Remote Sens. 2013, 34, 919–937. [Google Scholar] [CrossRef]
  16. Engel-Cox, J.A.; Hoff, R.M.; Haymet, A.D.J. Recommendations on the Use of Satellite Remote-Sensing Data for Urban Air Quality. J. Air Waste Manag. Assoc. 2004, 54, 1360–1371. [Google Scholar] [CrossRef] [PubMed]
  17. Drusch, M.; Del Bello, U.; Carlier, S.; Colin, O.; Fernandez, V.; Gascon, F.; Hoersch, B.; Isola, C.; Laberinti, P.; Martimort, P.; et al. Sentinel-2: ESA’s Optical High-Resolution Mission for GMES Operational Services. Remote Sens. Environ. 2012, 20, 25–36. [Google Scholar] [CrossRef]
  18. Richter, R.; Louis, J.; Müller-Wilm, U. Sentinel-2 MSI—Level 2A Products Algorithm Theoretical Basis Document; S2PAD-ATBD-0001, Issue 2.0; Telespazio VEGA Deutschland GmbH: Darmstadt, Germany, 2012. [Google Scholar]
  19. Kaufman, Y.J.; Sendra, C. Algorithm for automatic atmospheric corrections to visible and near-IR satellite imagery. Int. J. Remote Sens. 1988, 9, 1357–1381. [Google Scholar] [CrossRef]
  20. Schläpfer, D.; Borel, C.C.; Keller, J.; Itten, K.I. Atmospheric precorrected differential absorption technique to retrieve columnar water vapour. Remote Sens. Environ. 1998, 65, 353–366. [Google Scholar] [CrossRef]
  21. Clerc, S.; MPC Team. Level 2A Data Quality Report (Ref. S2-PDGS-MPC-L2ADQR); European Space Agency: Paris, France, 2018. [Google Scholar]
  22. Louis, J.; Debaecker, V.; Pflug, B.; Main-Knorn, M.; Bieniarz, J.; Mueller-Wilm, U.; Cadau, E.; Gascon, F. Sentinel-2 Sen2Cor: L2A processor for users. In Proceedings of the Living Planet Symposium 2016, Prague, Czech Republic, 9–13 May 2016. ESA SP-740. [Google Scholar]
  23. Holben, B.; Eck, T.F.; Slutsker, I.; Tanre, D.; Buis, J.; Setzer, K.; Vermote, E.; Reagan, J.; Kaufman, Y.; Nakajima, T.; et al. AERONET—A federated instrument network and data archive for aerosol characterization. Remote Sens. Environ. 1998, 66, 1–16. [Google Scholar] [CrossRef]
  24. Smirnov, A.; Holben, B.N.; Eck, T.F.; Dubovik, O.; Slutsker, I. Cloud screening and quality control algorithms for the AERONET data base. Remote Sens. Environ. 2000, 73, 337–349. [Google Scholar] [CrossRef]
  25. Bilal, M.; Qiu, Z.; Shen, X.; Nazeer, M. A New MODIS C6 Dark Target and Deep Blue Merged Aerosol Product on a 3 km Spatial Grid. Remote Sens. 2018, 10, 463. [Google Scholar] [CrossRef]
  26. Pace, G.; Meloni, D.; di Sarra, A. Forest fire aerosol over the Mediterranean basin during summer 2003. J. Geophys. Res. 2005, 110, D21202. [Google Scholar] [CrossRef]
  27. Obregón, M.A.; Costa, M.J.; Silva, A.M.; Serrano, A. Thirteen years of aerosol radiative forcing in Southwestern Iberian Peninsula. Aerosol Air Qual. Res. 2017, 17, 2509–2521. [Google Scholar] [CrossRef]
  28. Barnaba, F.; Gobbi, G.P. Aerosol seasonal variability over the Mediterranean region and relative impact of maritime, continental and Saharan dust particles over the basin from MODIS data in the year 2001. Atmos. Chem. Phys. 2004, 4, 2367–2391. [Google Scholar] [CrossRef] [Green Version]
  29. Kaskaoutis, D.G.; Kosmopoulos, P.; Kambezidis, H.D.; Nastos, P.T. Aerosol climatology and discrimination of different types over Athens, Greece, based on MODIS data. Atmos. Environ. 2007, 41, 7315–7329. [Google Scholar] [CrossRef]
  30. Obregón, M.A.; Pereira, S.; Wagner, F.; Serrano, A.; Cancillo, M.L.; Silva, A.M. Regional differences of column aerosol parameters in western Iberian Peninsula. Atmos. Environ. 2012, 12, 1–10. [Google Scholar] [CrossRef]
  31. Elias, T.; Silva, A.M.; Belo, N.; Pereira, S.; Formenti, P.; Helas, G.; Wagner, F. Aerosol extinction in a remote continental region of the Iberian Peninsula during summer. J. Geophys. Res. 2006, 111, 1–20. [Google Scholar] [CrossRef]
Figure 1. Geographical distribution of the 94 selected AERONET test sites and number of data N available at each site, for the ESA-L2A AOT at 550 nm and integrated water vapour (IWV) validation. The sites with less than 10 data points are represented by the grey dots. The location of the three stations used by Djamai et al. [14] are shown with a black star.
Remotesensing 11 01649 g001
Figure 2. Scatter plots of aerosol optical thickness (AOT) (a) and IWV (b) from ESA-L2A retrievals versus coincident AERONET Level 2.0 data. The dashed grey line indicates the x = y line and the solid blue lines show the accuracy requirement limits (a) |ΔAOT 550| ≤ 0.1 × AOT 550 ref +0.03, and (b) |ΔIWV| ≤ 0.1 × IWV ref + 0.2 [21].
Remotesensing 11 01649 g002
Figure 3. Scatter plots of AOT from ESA-L2A retrievals versus coincident AERONET Level 2.0 data for (a) before 15 January, 2018 and (b) after 15 January, 2018. The dashed grey line indicates the x = y line and the solid blue lines show the accuracy requirement limits (a) |ΔAOT 550| ≤ 0.1 × AOT 550 ref + 0.03, and (b) |ΔIWV| ≤ 0.1 × IWV ref + 0.2 [21].
Remotesensing 11 01649 g003
Figure 4. Box and whisker plots of AOT ESA-L2A and AERONET databases for the entire time period and for each season of that time period, considering the entire study period (a), the first sub-period (b) and the second sub-period (c). The mean (filled circles), median (horizontal segment within the box), 25 th and 75 th percentiles (top/bottom box limits) and the data within 1.5 times the interquartile range (whiskers) are shown.
Remotesensing 11 01649 g004
Figure 5. Scatter plot of AOT from ESA-L2A retrievals versus coincident AERONET Level 2.0 data for the sub-period after 15 January, 2018 in North Africa/Middle East region. The dashed grey line indicates the x = y line and the solid blue lines show the accuracy requirement limits (a) |ΔAOT 550| ≤ 0.1 × AOT 550 ref + 0.03, and (b) |ΔIWV| ≤ 0.1 × IWV ref + 0.2 [21].
Remotesensing 11 01649 g005
Figure 6. Scatter plot of AOT from ESA-L2A retrievals versus coincident AERONET Level 2.0 data for the sub-period after 15 January, 2018 excluding data corresponding to AERONET AOT lower than 0.06 and to stations with a percentage of cases of AOT = 0.2 higher than 20%. The dashed grey line indicates the x = y line and the solid blue lines show the accuracy requirement limits (a) |ΔAOT 550| ≤ 0.1 × AOT 550 ref + 0.03, and (b) |ΔIWV| ≤ 0.1 × IWV ref + 0.2 [21].
Remotesensing 11 01649 g006
Table 1. Wavelengths, bandwidths and spatial resolutions of the 13 bands of the multi-spectral imager (MSI) instruments.
Band NumberS2AS2BSpatial Resolution (m)
Central Wavelength (mm)Bandwidth (mm)Central Wavelength (mm)Bandwidth (mm)
1442.727442.24560
2492.498492.19810
3559.845559.04610
4664.638664.93910
5704.119703.82020
6740.518739.11820
7782.828779.72820
8832.8145832.913310
8a864.733864.03220
9945.126943.22760
101373.5751376.97660
111613.71431610.414120
122202.42422185.723820
Table 2. Sen2Cor Scene classification classes for Sentinel-2.
Sen2Cor Class
0No data
1Saturated_or_defective
2Dark_Area_PIXELS
3Cloud_Shadows
4Vegetation
5Bare_soils
6WATER
7Cloud_LOW_PROBABILITY
8Cloud_MEDIUM_PROBABILITY
9Cloud_HIGH_PROBABILITY
10Thin_CIRRUS
11Snow
Table 3. Mean bias error (MBE) and root mean square error (RMSE) AOT values for the whole period, the period before 15 January, 2018 and the period after 15 January, 2018.
Whole Period (March 2017–December 2018)Before 15 January 2018After 15 January 2018
MBE AOT0.050.090.01
RMSE AOT0.110.140.08
Table 4. MBE, RMSE and R2 AOT values for each scene classification class, both for the whole period and for the sub-period after January 15 2018.
WHOLE PERIODAfter January 15 2018
Scene 2Scene 4Scene 5Scene 2Scene 4Scene 5
N2768772019401328
MBE0.040.030.070.01−0.010.02
RMSE0.130.080.140.120.100.12
R20.610.740.560.700.810.62
Table 5. MBE, RMSE and R2 AOT values for different regions (North Europe, South Europe, and North Africa/Middle East) corresponding to the whole period and to the period after 15 January, 2018.
WHOLE PERIODAfter January 15 2018
North EuropeSouth Europe North AfricaNorth EuropeSouth Europe North Africa
N8231251324532614151
MBE0.010.070.05−0.020.020.03
RMSE0.070.120.150.070.080.16
R20.780.670.540.8460.750.53
Table 6. MBE, RMSE and R2 AOT values for different aerosol types (clean (CL), continental (CO), maritime (MA), forest fires emissions (FF) and desert dust (DD)) corresponding to the whole period and to the period after 15 January, 2018.
WHOLE PERIODAfter 15 January 2018
CLCOMAFFDDCLCOMAFFDD
N223598305653928937016436212
MBE0.110.010.09−0.1000.09−0.030.07−0.13−0.05
RMSE0.130.090.110.130.140.100.070.090.150.13
R20.750.810.720.920.670.780.870.750.940.76

