
Evolution Characteristics of Landscape Ecological Risk Patterns in Coastal Zones in Zhejiang Province, China


Abstract
:1. Introduction
2. Data and Methods
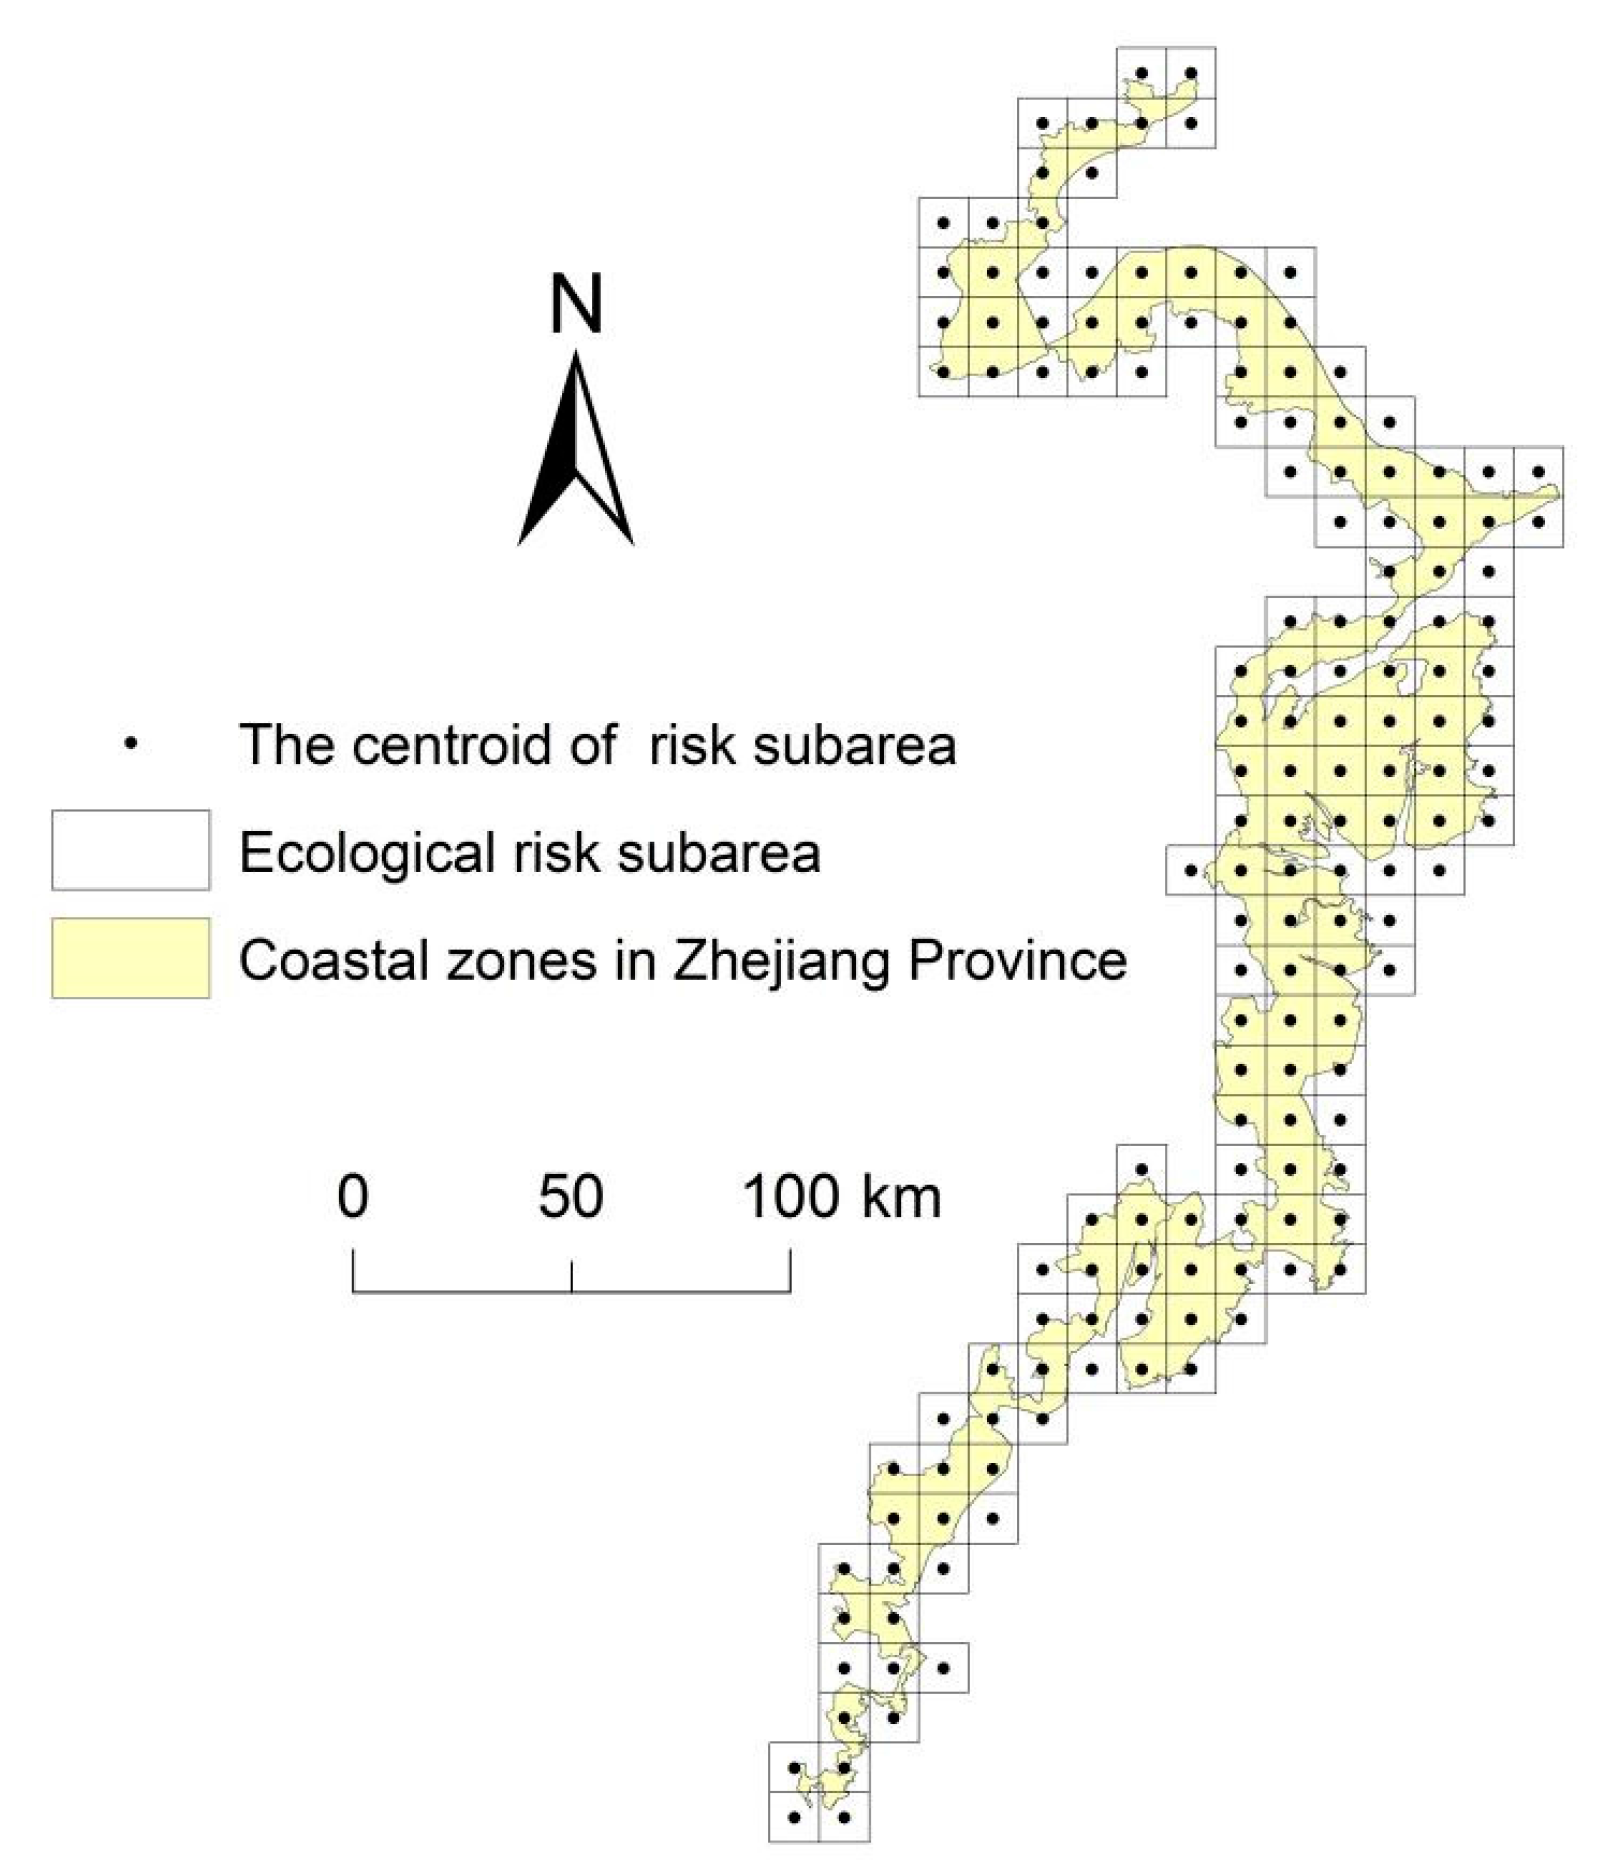
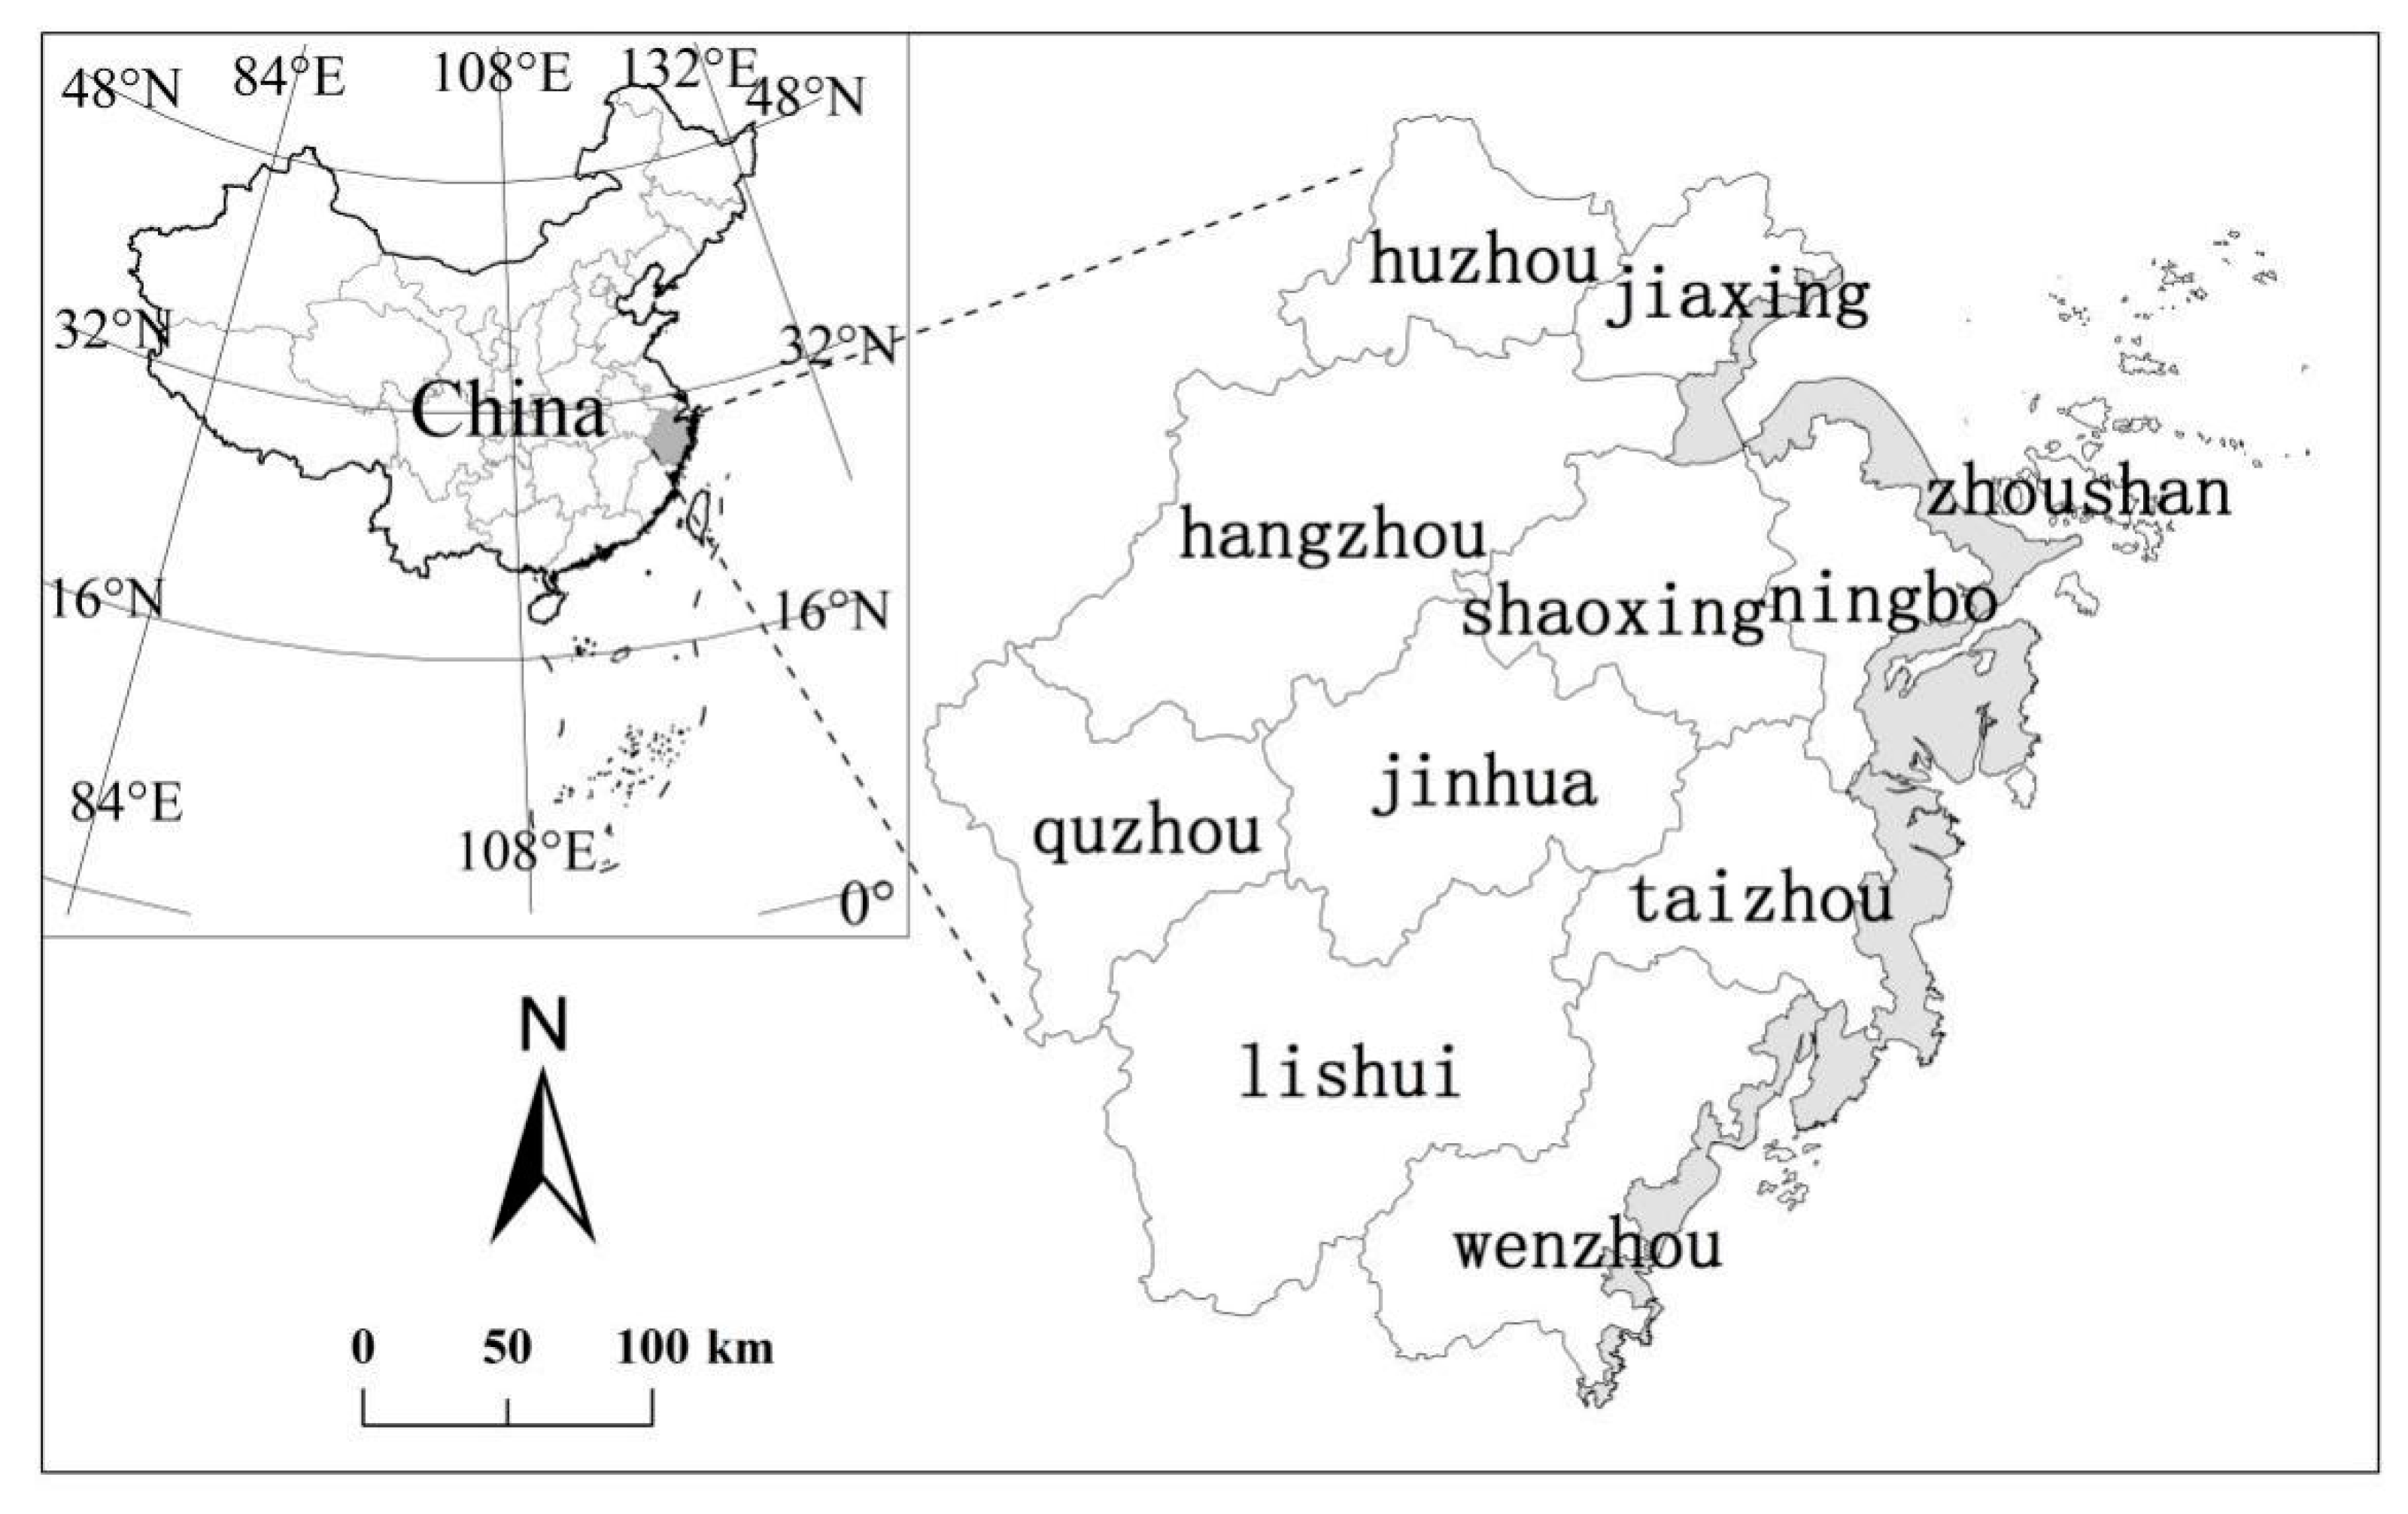
2.1. Study Area
2.2. Data Sets and Processing
2.3. Dividing Ecological Risk Subarea
2.4. Constructing Ecological Risk Indexes
2.5. Spatial Analysis Method
3. Results and Analyses
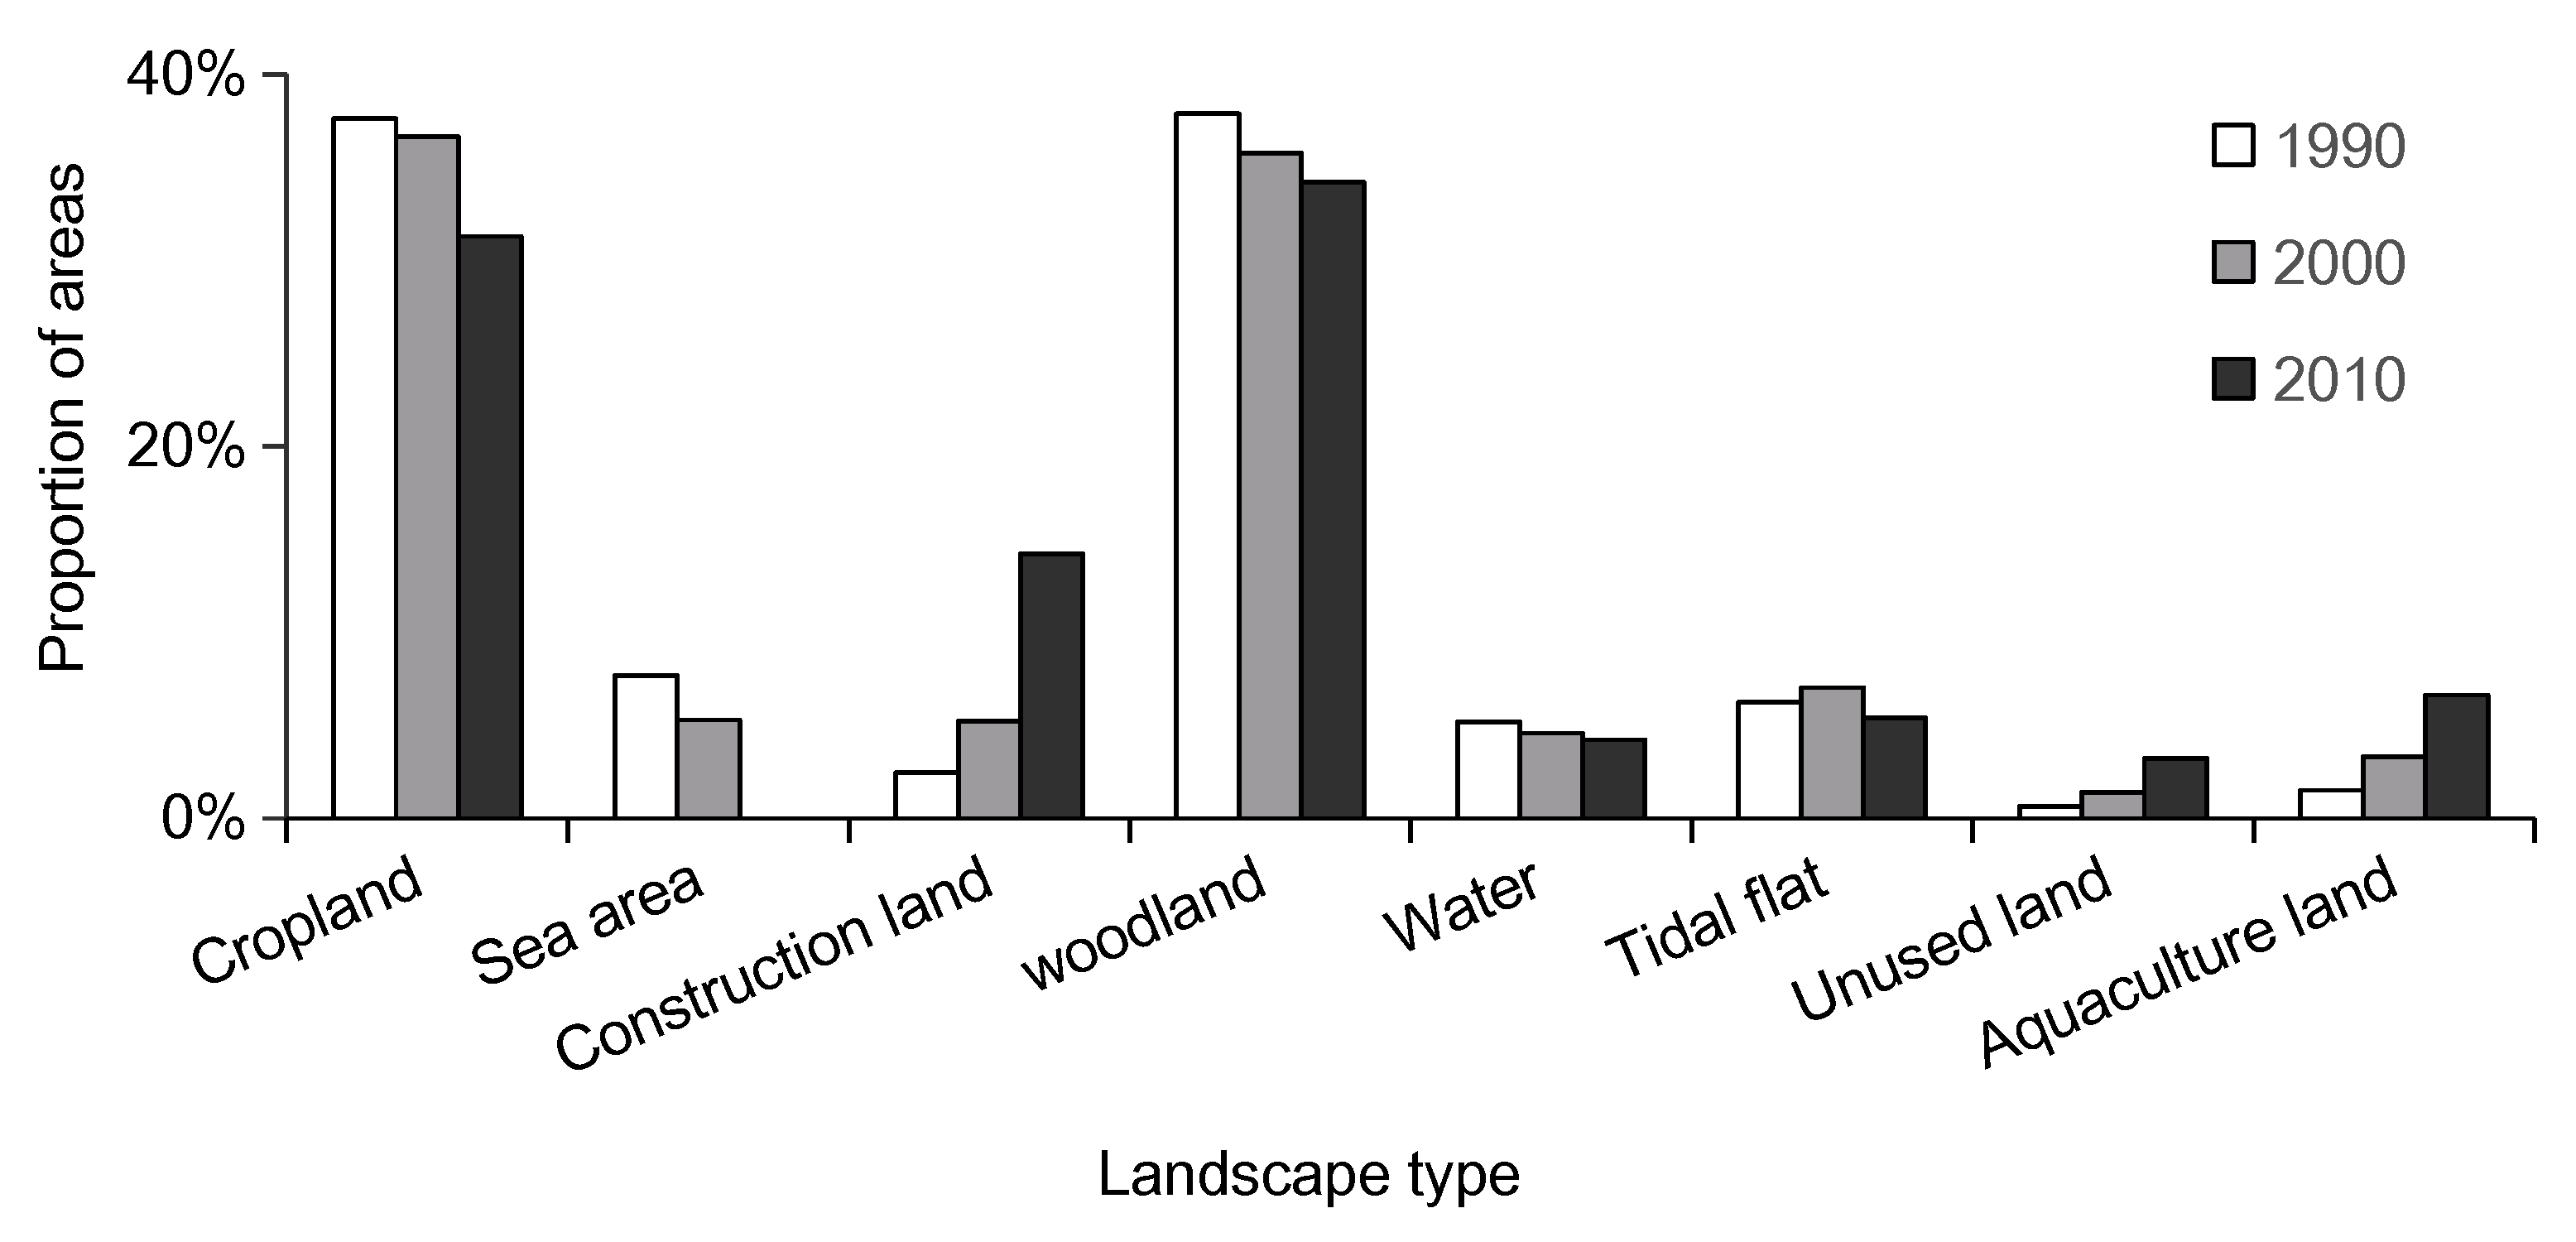
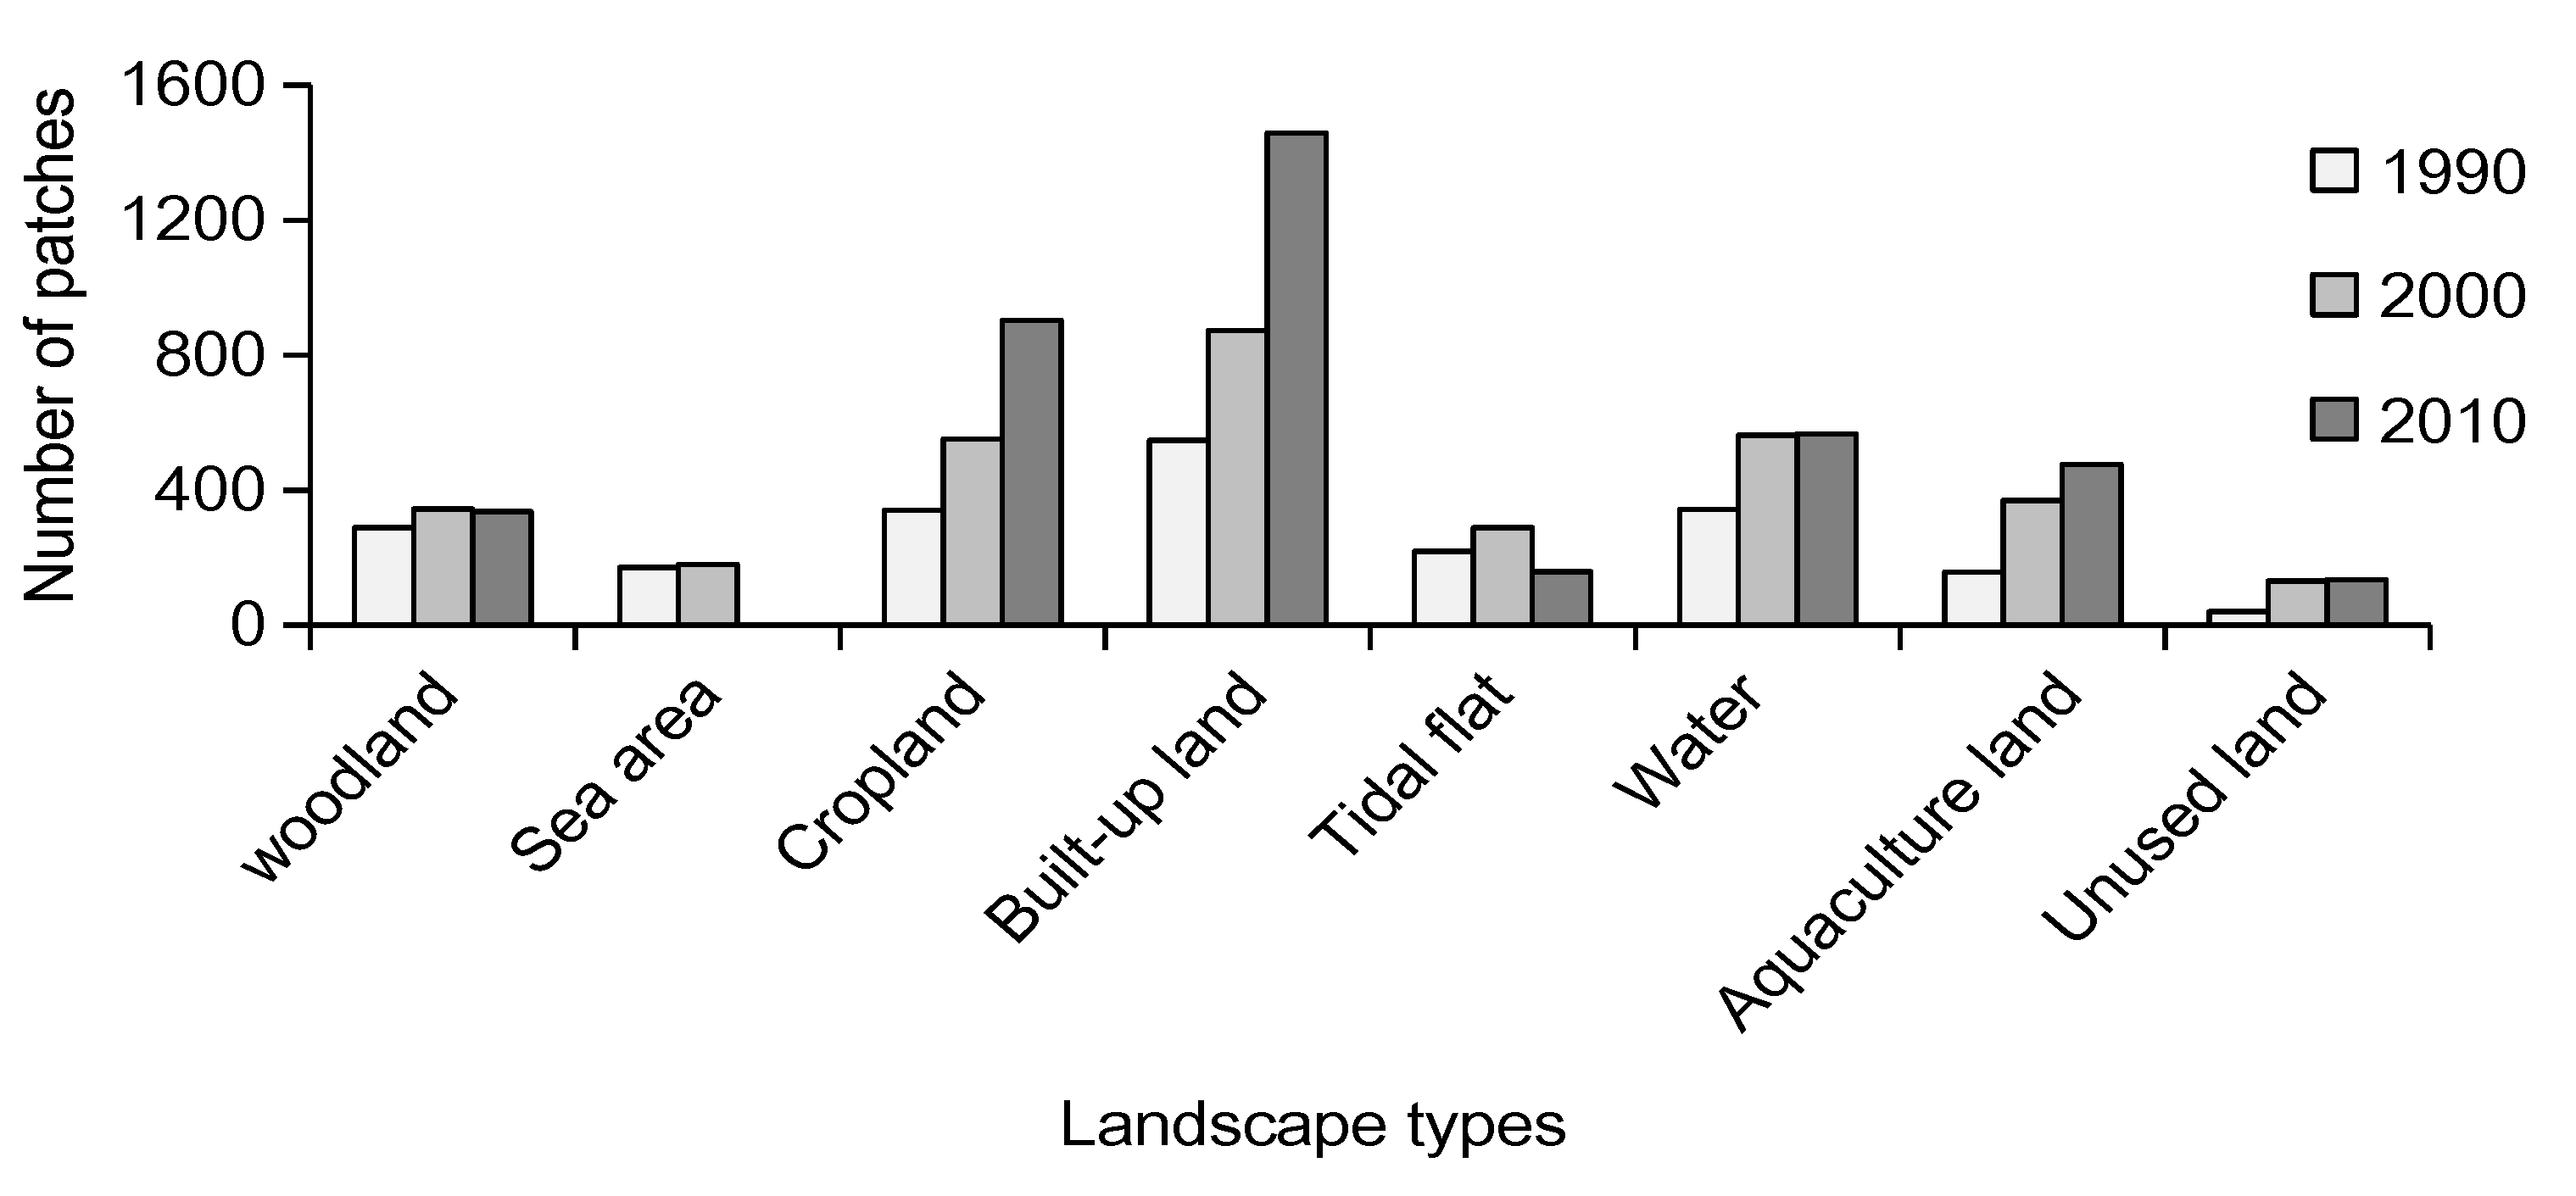
3.1. Evolution Characteristics of Landscape Types
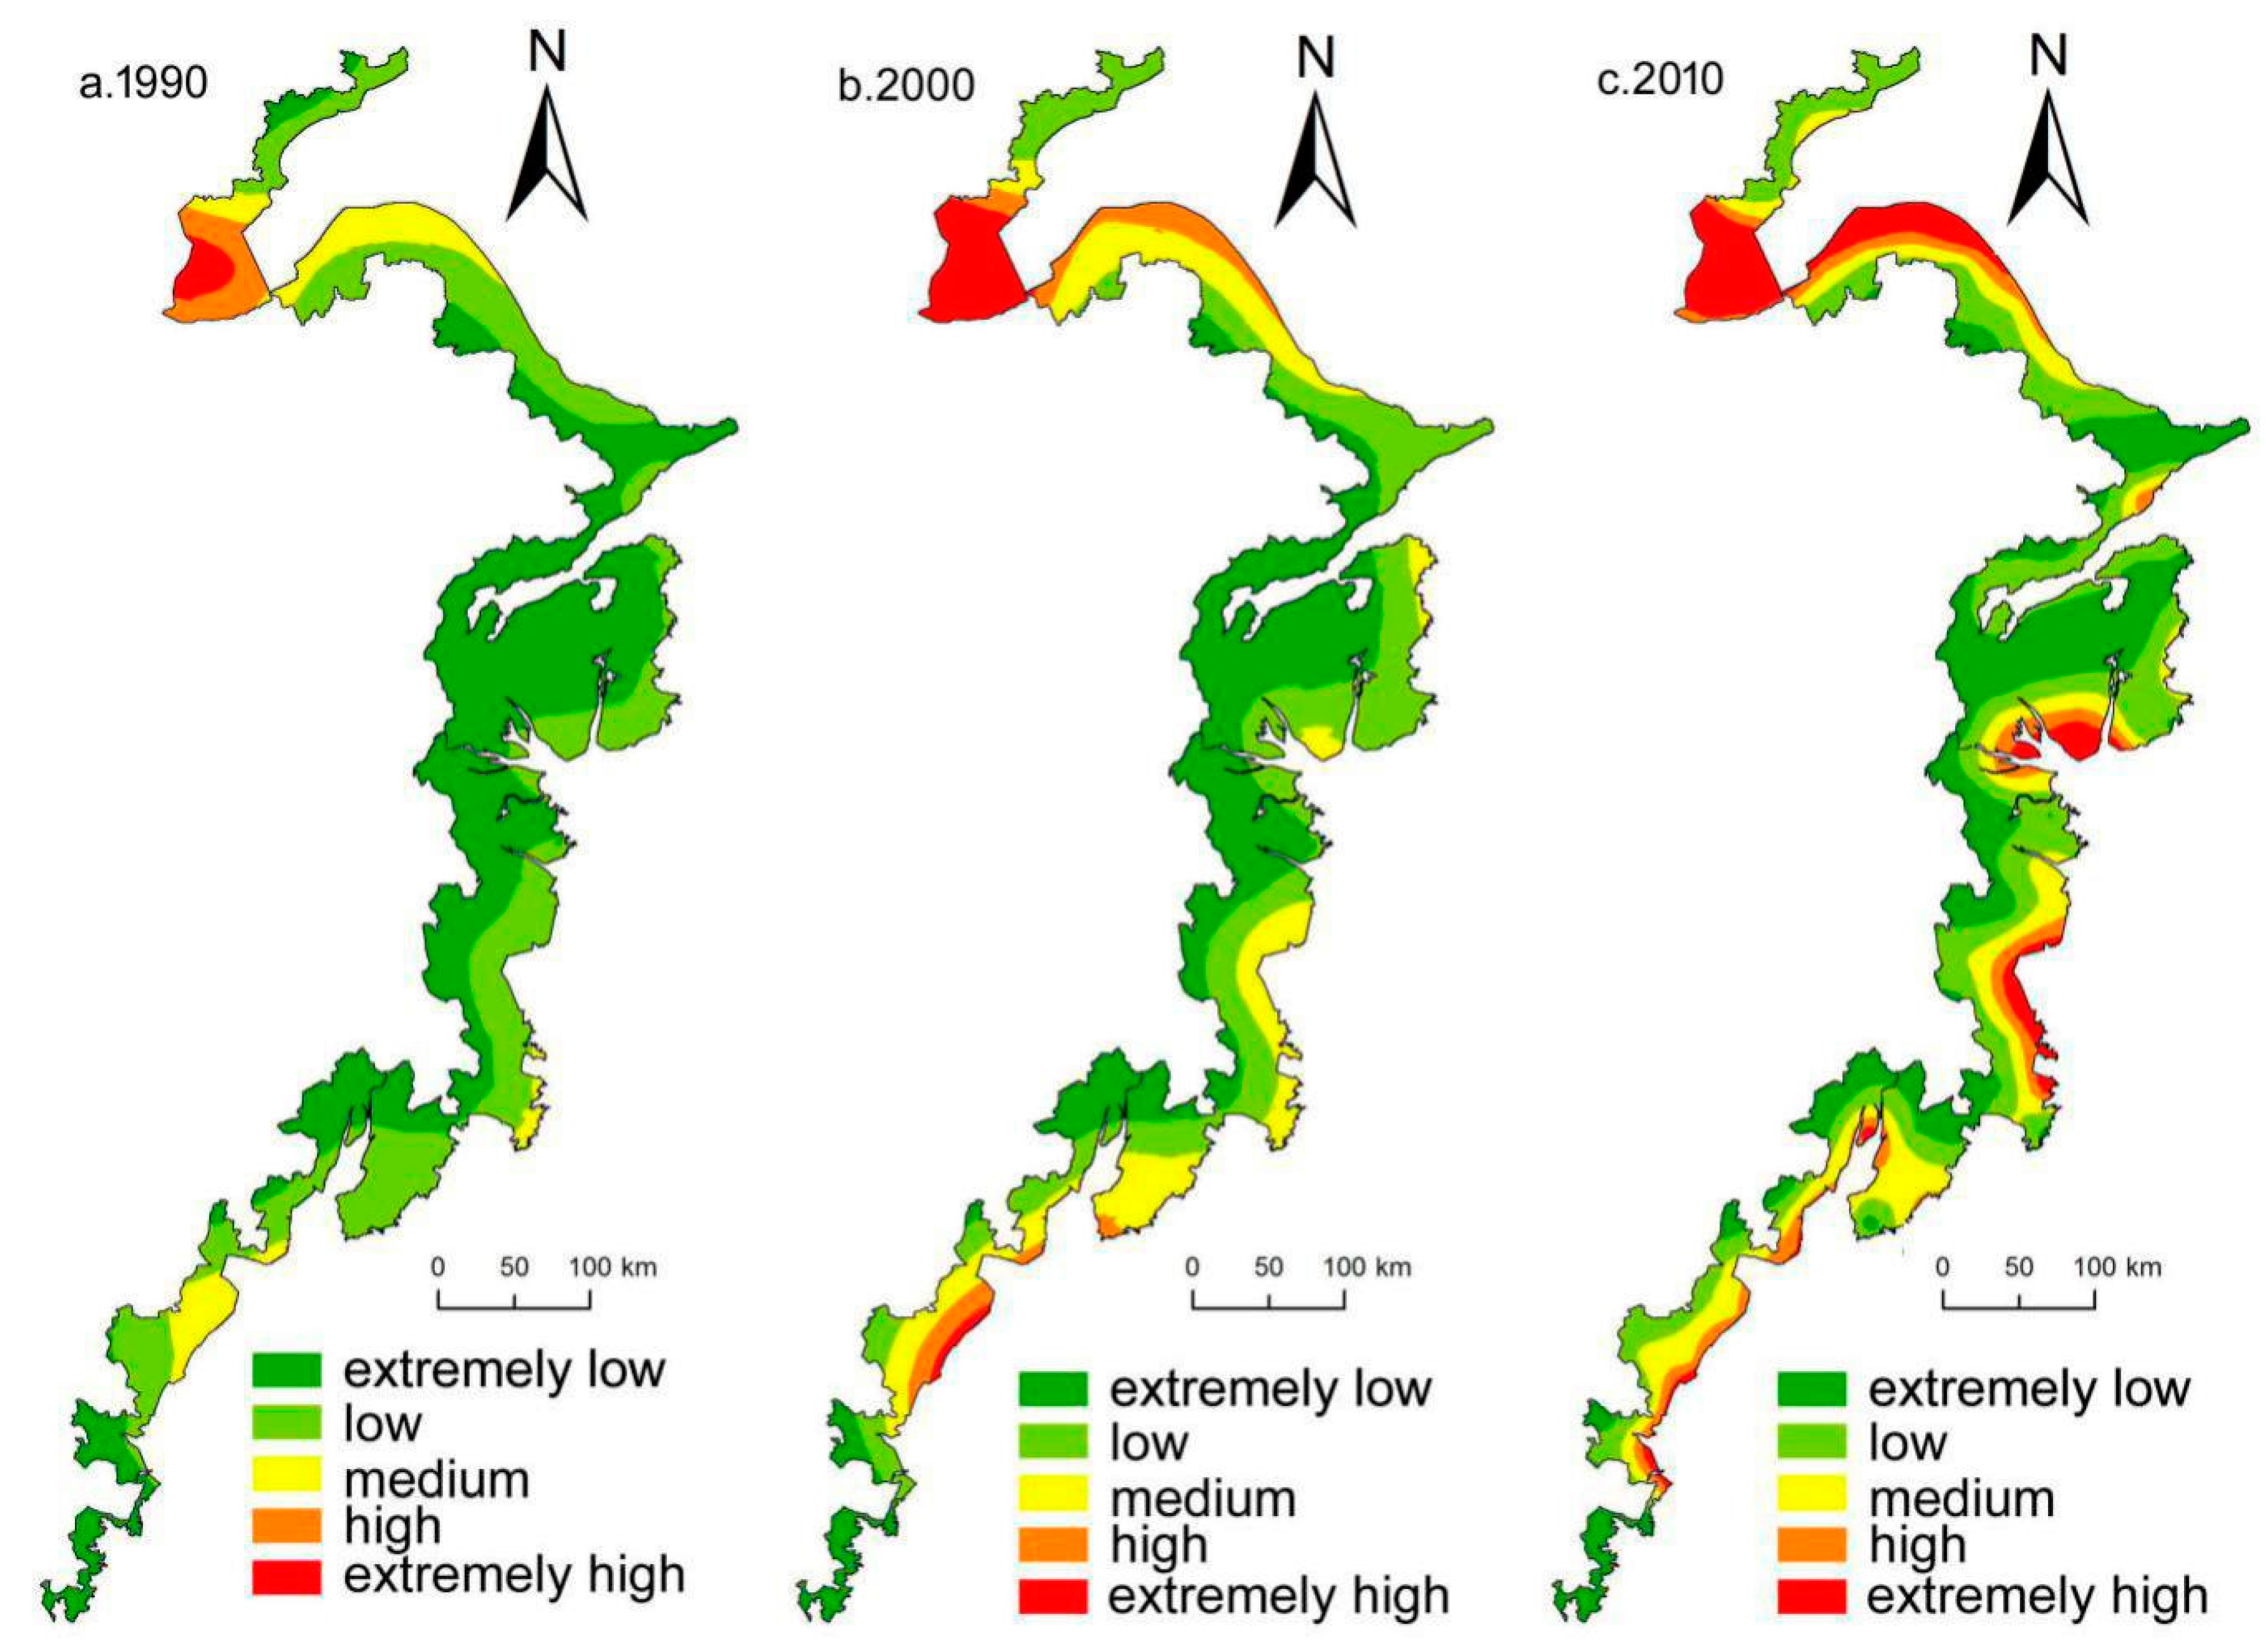
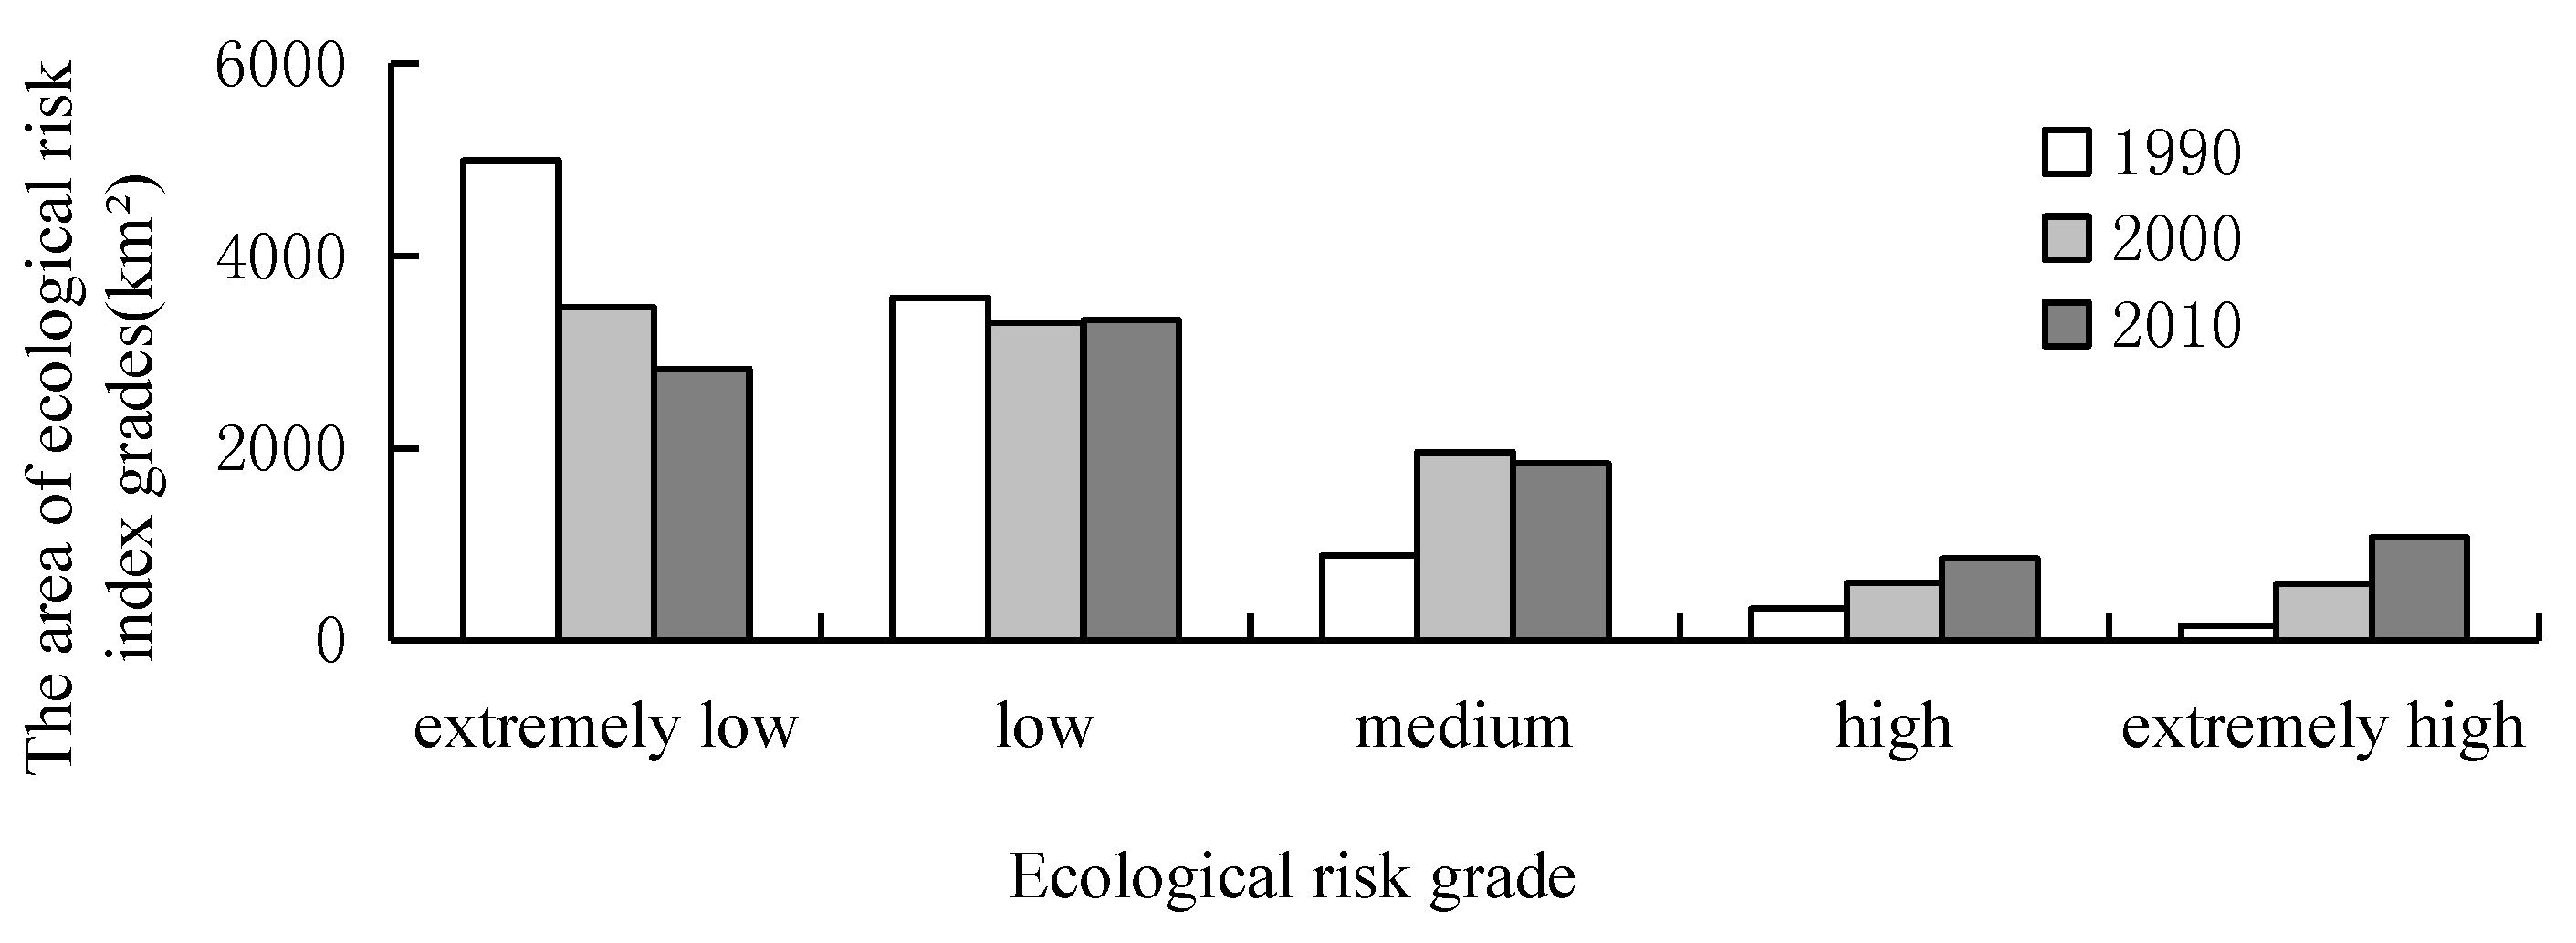
3.2. Spatiotemporal Differences of Landscape Ecological Risk Patterns
3.3. The Ecological Risk Grade Shifting Analysis
4. Discussion
5. Conclusions
Acknowledgments
Author Contributions
Conflicts of Interest
References
- IOMC (Inter-Organizaition Programme for the Sound Management for Chemicals). IPCS Risk Assessment Terminology; World Health Organization (WHO): Geneva, Switzerland, 2004. [Google Scholar]
- Pollino, C.; Thomas, C.; Hart, B. Introduction to models and risk assessment. Hum. Ecol. Risk Assess. 2012, 18, 13–15. [Google Scholar] [CrossRef]
- Liu, X.; Su, W.; Wang, Z.; Huang, Y.; Deng, J. Regional ecological risk assessment of land use in the flooding zone of the three gorges reservoir area based on relative risk model. Acta Sci. Circumst. 2012, 32, 248–256. [Google Scholar]
- Xu, X.; Lin, H.; Fu, Z. Regional ecological risk assessment of wetland in the Huanghe River delta. Acta Sci. Nat. Univ. Pekin. 2001, 37, 111–120. [Google Scholar]
- Markus, J.; Mc Bratney, A.B. A review of the contamination of soil with lead II, Spatial distribution and risk assessment of soil lead. Environ. Int. 2001, 27, 399–411. [Google Scholar] [CrossRef]
- Riviere, J.L. Ecological Risk Evaluation of Polluted Soils; The Chemical Rubber Company Press: Boca Raton, FL, USA, 2006. [Google Scholar]
- Environmental Protection Agency (EPA). Guidelines for Ecological Risk Assessment; Office of Water: Washington, DC, USA, 1998.
- Cook, R.B.; Suter, G.W.; Sain, E.R. Ecological risk assessment in a large river reservoir: 1. Introduction and background. Environ. Toxicol. Chem. 1999, 18, 581–588. [Google Scholar]
- Cormier, S.M.; Smith, M.; Norton, S.; Neiheisel, T. Assessing ecological risk in watersheds: A case study of problem formulation in the Big Darby Creek watershed, Ohio, USA. Environ. Toxicol. Chem. 2000, 19, 1082–1096. [Google Scholar] [CrossRef]
- Salihoglu, G.; Karaer, F. Ecological risk assessment and problem formulation for Lake Uluabat, a Ramsar state in Turkey. Environ. Manag. 2004, 33, 899–910. [Google Scholar] [CrossRef]
- Jiang, Q.; Deng, X.; Zhan, J.; Yan, H. Impacts of economic development on ecosystem risk in the Yellow River Delta. Procedia Environ. Sci. 2011, 5, 208–218. [Google Scholar] [CrossRef]
- Xu, X.G.; Lin, H.P.; Fu, Z.Y. Probe into the method of regional ecological risk assessment—A casestudy of wetland in the Yellow River Delta in China. J. Environ. Manag. 2004, 70, 253–262. [Google Scholar] [CrossRef] [PubMed]
- Hayes, E.H.; Landis, W.G. Regional ecological risk assessment of a near shore marine environment: Cherry Point, WA. Hum. Ecol. Risk Assess. 2004, 10, 299–325. [Google Scholar] [CrossRef]
- Obery, A.M.; Landis, W.G. A regional multiple stressor risk assessment of the Codorus Creek watershed applying the relative risk model. Hum. Ecol. Risk Assess. 2002, 8, 405–428. [Google Scholar] [CrossRef]
- Bhagyanagar, R.; Kawal, B.M.; Dwarakish, G.S.; Surathkal, S. Land use/land cover change and urban expansion during 1983–2008 in the coastal area of Dakshina Kannada district, South India. J. Appl. Remote Sens. 2012, 6, 1–17. [Google Scholar] [CrossRef]
- Li, D.Q.; Zhang, C.; Pizzol, L.; Critto, A.; Zhang, H.B.; Lv, S.H.; Marcomini, A. Regional risk assessment approaches to land planning for industrial polluted areas in China: The Hulunbeier region case study. Environ. Int. 2014, 65, 16–32. [Google Scholar] [CrossRef] [PubMed]
- Merlotto, A.; Piccolo, M.C.; Bertola, G.R. Urban growth and land use/cover change at Necochea and Quequen cities, Buenos Aires province, Argentina. Revista de Geografia Norte Grande 2012, 53, 159–176. [Google Scholar] [CrossRef]
- Walker, R.; Landis, W.; Brown, P. Developing a regional ecological risk assessment: A case study of a tasmanian agricultural catchment. Hum. Ecol. Risk Assess. 2001, 7, 412–439. [Google Scholar] [CrossRef]
- Bartolo, R.E.; van Dam, R.A.; Bayliss, P. Regional ecological risk assessment for Australia’s Tropical rivers: Application of the relative risk model. Hum. Ecol. Risk Assess. 2012, 18, 16–46. [Google Scholar] [CrossRef]
- Colnar, A.M.; Landis, W.G. Conceptual model development for invasive species and a regional risk assessment case study: The European green crab, Carcinus maenas, at cherry point, Washington, USA. Hum. Ecol. Risk Assess. 2007, 13, 120–155. [Google Scholar] [CrossRef]
- Zhang, S.; Zhang, L.; Zhang, Y. Ecological risk assessment of the Yulin coal mining area based on the petarmethod. Resour. Sci. 2011, 33, 1914–1923. [Google Scholar]
- Suter, G.W. Endpoints for regional ecological risk assessments. Environ. Manag. 1990, 14, 9–23. [Google Scholar] [CrossRef]
- Turner, M.G. Landscape Ecology in Theory and Practice: Pattern and Process; Springer: Berlin, Germany, 2001. [Google Scholar]
- Wu, L.Y. The Study of Regional Landscape Ecological Risk Assessment and the Environmental Risk Management Countermeasure: Take Dongshan Island for Example; Fujian Normal University: Fuzhou, China, 2004. [Google Scholar]
- Peng, J.; Wang, Y.L.; Wu, J.S.; Zhang, Y.S. Evaluation for regional ecosystem health: Methodology and research progress. Acta Ecol. Sin. 2007, 27, 4877–4885. [Google Scholar] [CrossRef]
- Liu, D.D.; Qu, R.J.; Zhao, C.H. Landscape ecological risk assessment in Yellow River Delta. J. Food Agric. Environ. 2012, 10, 970–972. [Google Scholar]
- Sachs, J.D.; Mellinger, A.D.; Gallup, J.L. The geography of poverty and wealth. Sci. Am. 2001, 284, 70–75. [Google Scholar] [CrossRef] [PubMed]
- Adger, W.N.; Hughes, T.P.; Folke, C.; Carpenter, S.R.; Rockstrom, J. Social-ecological resilience to coastal disasters. Science 2005, 309, 1036–1039. [Google Scholar] [CrossRef] [PubMed]
- Paula, D.P.; Dias, J.M.A.; Ferreira, O.; Morais, J.O. High-rise development of the sea-front at Fortaleza (Brazil): Perspectiveson its valuation and consequences. Ocean Coast. Manag. 2013, 77, 14–23. [Google Scholar] [CrossRef]
- Small, C.; Nicholls, R.J. A global analysis of human settlement in coastal zones. J. Coast. Res. 2003, 19, 584–599. [Google Scholar]
- Deng, J.S.; Wang, K.; Hong, Y.; Qi, J.G. Spatio-temporal dynamics and evolution of land use change and landscape pattern in response to rapid urbanization. Landsc. Urban Plan. 2009, 92, 187–198. [Google Scholar] [CrossRef]
- Wan, J.; Li, Z.; Lei, K. Dynamic analysis of the landscape spatial pattern in the coastal zone of the Bohai bay, 1954–2000. Res. Environ. Sci. 2009, 22, 77–82. [Google Scholar]
- Chen, Q.; Liu, J.; Ho, K.C. Development of a relative risk model for evaluating ecological risk of water environment in the Haihe River Basin estuary area. Sci. Total Environ. 2012, 420, 79–89. [Google Scholar] [CrossRef] [PubMed]
- Yu, W.W.; Zhang, L.P.; Ricci, P.F.; Chen, B.; Huang, H. Coastal ecological risk assessment in regional scale: Application of the relative risk model to Xiamen Bay China. Ocean Coast. Manag. 2015, 108, 131–139. [Google Scholar] [CrossRef]
- Zuo, L.; Xu, J.; Zhang, Z.; Wen, Q.; Liu, B.; Zhao, X.; Yi, L. Spatial-temporal land use change and landscape response in Bohai. J. Remote Sens. 2011, 15, 604–620. [Google Scholar]
- Jiang, W.; Sheng, S.; Zhu, X.; Zuo, W. Change and spatial pattern of flood disaster risk. Geogr. Res. 2008, 27, 502–508. [Google Scholar]
- Ramachandra, T.V.; Aithal, B.H.; Sanna, D.D. Insights to urban dynamics through landscape spatial pattern analysis. Int. J. Appl. Earth Obs. Geoinf. 2012, 18, 329–343. [Google Scholar]
- Dewan, A.M.; Yamaguchi, Y. Land use and land cover change in Greater Dhaka, Bangladesh: Using remote sensing to promote sustainable urbanization. Appl. Geogr. 2009, 29, 390–401. [Google Scholar] [CrossRef]
- Islam, M.A.; Mitra, D.; Dewan, A.; Akhter, S.H. Coastal multi-hazard vulnerability assessment along the Ganges deltaic coast of Bangladesh—A geospatial approach. Ocean Coast. Manag. 2016, 127, 1–15. [Google Scholar] [CrossRef]
- Xu, L.; Li, J.; Yang, L.; Yuan, Q.; Wang, M.; Chen, P. Integrated suitability evaluation on mainland coastline resources in Zhejiang Province. Chin. Land Sci. 2015, 29, 49–56. [Google Scholar]
- Li, X.; Li, J. Analysis on regional landscape ecological risk based on GIS—A case study along the lower reaches of the Weihe River. Arid Zone Res. 2008, 25, 899–903. [Google Scholar]
- Zhang, X.; Shi, P.; Luo, J.; Liu, H.; Wei, W. The ecological risk assessment of arid inland river basin at the landscape scale: A case study on Shiyang river basin. J. Nat. Resour. 2014, 29, 410–419. [Google Scholar]
- Liu, H.; Zhu, Q. Studies of methodologies and their development on land use/cover change detection by using high spatial resolution remote sensing data. Resour. Sci. 1999, 21, 23–27. [Google Scholar]
- Zeng, H.; Liu, G. Analysis of regional ecological risk based on landscape structure. Chin. Environ. Sci. 1999, 19, 454–457. [Google Scholar]
- Gao, B.; Li, X.; Li, Z.; Chen, W.; He, X.; Qi, S. Assessment of ecological risk of coastal economic developing zone in Jinzhou Bay based on landscape pattern. Acta Ecol. Sin. 2011, 31, 3441–3450. [Google Scholar]
- Fu, Z.; Xu, X.; Lin, H.; Wang, X. Regional ecological risk assessment of in the Liaohe river delta wetlands. Acta Ecol. Sin. 2001, 21, 365–373. [Google Scholar]
- Liu, S.; Yang, Z.; Cui, B.; Gan, S. Effects of road on landscape and its ecological risk assessment: A case study of Lancangjiang River valley. Chin. J. Ecol. 2005, 24, 897–901. [Google Scholar]
- Wang, J.; Zhao, G.; Du, C. Analysis on the regional ecological environment vulnerability based on the information of spatial structure of landscapes—A case study in Kenli country located in the Yellow River delta. Arid Zone Res. 2005, 22, 317–321. [Google Scholar]
- Xie, H. Regional eco-risk analysis of based on landscape structure and spatial statistics. Acta Ecol. Sin. 2008, 28, 5020–5026. [Google Scholar]
- Zhang, Y.; Lei, G.; Lin, J.; Zhang, H. Spatiotemporal change and its ecological risk of landscape pattern in different spatial scales in Zhalong Nature Reserve. Chin. J. Ecol. 2012, 31, 1250–1256. [Google Scholar]
- Wu, J.H. Landscape Ecology-Pattern, Process, Scale and Grade, 2nd ed.; Higher Education Press: Beijing, China, 2007. [Google Scholar]
- Dewan, A.M.; Yamaguchi, Y.; Rahman, M.Z. Dynamics of land use/cover changes and the analysis of landscape fragmentation in Dhaka Metropolitan, Bangladesh. GeoJournal 2012, 77, 315–330. [Google Scholar] [CrossRef]
- He, C.H.; Zhou, R.J. Spatial-temporal variation of land use based on landscape patterns in the coastal zone of Yancheng, Jiansu. Resour. Environ. Yangtze Basin 2016, 25, 1191–1199. [Google Scholar]
- Bateman, I.J.; Harwood, A.R.; Mace, G.M.; Watson, R.T.; Abson, D.J.; Andrews, B.; Binner, A.; Crowe, A.; Day, B.H.; Dugdale, S.; et al. Bringing ecosystem services into economic decision-making: Land use in the United Kingdom. Science 2013, 341, 45–51. [Google Scholar] [CrossRef] [PubMed]
- Fürst, C.; Helming, K.; Lorz, C.; Müller, F.; Verburg, P.H. Integrated land use and regional resource management: A cross disciplinary dialogue on future perspectives for a sustainable development of regional resources. J. Environ. Manag. 2013, 127, S1–S5. [Google Scholar] [CrossRef] [PubMed]


| Index | Definition | Expression |
|---|---|---|
| Landscape disturbance index (Ei) | It represents the degree of an ecosystem disturbed by external factors, is constructed by weighting three landscape ecological indices, including the landscape fragmentation index (Ci), the landscape isolation index (Ni) and the landscape dominant index (Di) to characterize the ecosystem affected by external disturbance. | where, a, b and c are the weighted coefficients (a + b + c = 1). Based on previous studies [40] and the experts’ suggestions, coefficients with 0.5, 0.3, and 0.2 were respectively set for a, b, and c. In addition, for unused land, a = 0.2, b = 0.3, and c = 0.5 were specially set because of their possessing regional and specific landscape features [42]. |
| Landscape fragmentation index (Ci) | It is defined as the degree of fragmentation of the entire landscape or one certain type of landscape at a specific time and in a specific nature. The greater the Ci is, the poorer the stability within a landscape [48]. | where, ni is the number for ith land (land use and land cover) type, and Ai is the total area of the ith land type. |
| Landscape isolation index (Ni) | It refers to the degree of dispersion of different patches in a type of landscape. The greater dispersion degree means more separate from different patches in the landscape and thus more complicated of the landscape distribution [41]. | where, A is the landscape total area; Ai is the area of ith land type; and ni is the number of patches of ith land type. |
| Landscape dominant index (Di) | It represents the importance of certain patches in the entire landscape, directly reflecting effects of patches on landscape pattern formation and change. | where, Pi is the patch density (Pi = the number of patches of ith landscape type/total number of patches); fi is the patch frequency (fi = the number of samples of ith landscape type/total number of samples); and Li is the patch ratio (Li = the area of samples of ith landscape type/total area of samples) |
| Landscape fragility index (Fi) | It mainly refers to the vulnerability of ecosystem structure within different landscape types, reflecting the resistance ability of different landscape receptors to the disturbance of the external risk resources. The weaker the resistance ability of a landscape risk receptor to the external risk resources, the greater the fragility, and thus the greater the ecological risk. | In this study, based on the characteristics of the study area and previous studies [49,50], the vulnerability of different landscape types was first divided into eight levels from low to high, i.e., built-up land, woodland, cropland, water, sea area, aquaculture land, tidal flat, and unused land. The landscape fragility index of various landscape types was then normalized to obtain final Fi values of different landscape types. |
| Landscape loss degree index (Ri) | It represents the loss severity of ecosystem’s natural properties of different landscape types when suffering disturbances from the external risk sources (including natural and anthropogenic factors). It is derived by the superposition of the landscape disturbance index (Ei) and the landscape fragility index (Fi). | where, Ri is the ith landscape loss degree index; Ei is the ith landscape disturbance index; Fi is the ith landscape fragility index |
| Landscape ecological risk index (ERIi) | It represents the relative degree of comprehensive ecological losses in a sample plot so that the landscape spatial pattern is transformed to a spatialized ecological risk variable using sampling method. In the process, a concept of area proportion of different landscape components is introduced. | where, ERIi is the ith subarea’s ecological risk index; Rj is the jth landscape loss degree index; Akj is the jth landscape’s area in the kth region; and Ak is an area of kth region. |
| Year | Type | Ci | Ni | Di | Ei | Fi | Ri |
|---|---|---|---|---|---|---|---|
| 1990 | woodland | 0.08 | 0.22 | 0.42 | 0.19 | 0.06 | 0.01 |
| Sea area | 0.22 | 0.85 | 0.20 | 0.41 | 0.14 | 0.06 | |
| Cropland | 0.09 | 0.24 | 0.46 | 0.21 | 0.08 | 0.02 | |
| Construction land | 2.23 | 4.74 | 0.26 | 2.59 | 0.03 | 0.07 | |
| Tidal flat | 0.35 | 1.18 | 0.23 | 0.57 | 0.20 | 0.11 | |
| Water | 0.66 | 1.78 | 0.23 | 0.91 | 0.11 | 0.10 | |
| Aquaculture land | 1.05 | 4.16 | 0.14 | 1.80 | 0.17 | 0.30 | |
| Unused land | 0.64 | 5.01 | 0.06 | 1.66 | 0.22 | 0.37 | |
| 2000 | woodland | 0.10 | 0.26 | 0.41 | 0.21 | 0.06 | 0.01 |
| Sea area | 0.34 | 1.26 | 0.17 | 0.58 | 0.14 | 0.08 | |
| Cropland | 0.15 | 0.32 | 0.46 | 0.26 | 0.08 | 0.02 | |
| Construction land | 1.67 | 2.82 | 0.30 | 1.74 | 0.03 | 0.05 | |
| Tidal flat | 0.41 | 1.20 | 0.23 | 0.61 | 0.19 | 0.12 | |
| Water | 1.23 | 2.58 | 0.25 | 1.44 | 0.11 | 0.16 | |
| Aquaculture land | 1.12 | 2.90 | 0.21 | 1.47 | 0.17 | 0.25 | |
| Unused land | 0.94 | 4.1 | 0.11 | 1.48 | 0.22 | 0.33 | |
| 2010 | woodland | 0.10 | 0.27 | 0.39 | 0.21 | 0.06 | 0.01 |
| Cropland | 0.29 | 0.48 | 0.45 | 0.38 | 0.08 | 0.03 | |
| Construction land | 1.03 | 1.34 | 0.39 | 0.10 | 0.03 | 0.03 | |
| Tidal flat | 0.30 | 1.16 | 0.17 | 0.53 | 0.19 | 0.10 | |
| Water | 1.34 | 2.81 | 0.25 | 1.56 | 0.11 | 0.17 | |
| Aquaculture land | 0.72 | 1.64 | 0.23 | 0.90 | 0.17 | 0.15 | |
| Unused land | 0.42 | 1.79 | 0.14 | 0.69 | 0.22 | 0.15 |
| Year 2000 | Extremely Low | Low | Medium | High | Extremely High | Total | |
|---|---|---|---|---|---|---|---|
| Year 1999 | |||||||
| Extremely low | 3420.34 | 1564.95 | 5.80 | 0 | 0 | 4991.08 | |
| Low | 48.02 | 1742.30 | 1660.91 | 114.69 | 0 | 3565.92 | |
| Medium | 0 | 0 | 294.81 | 480.14 | 107.70 | 882.65 | |
| High | 0 | 0 | 0 | 0 | 329.00 | 329.00 | |
| Extremely high | 0 | 0 | 0 | 0 | 153.77 | 153.77 | |
| Total | 3468.36 | 3307.25 | 1961.52 | 594.82 | 590.47 | 9922.42 | |
| Year 2010 | Extremely Low | Low | Medium | High | Extremely High | Total | |
|---|---|---|---|---|---|---|---|
| Year 2000 | |||||||
| Extremely low | 2145.25 | 1163.85 | 142.57 | 16.69 | 0 | 3468.36 | |
| Low | 631.35 | 1677.18 | 659.36 | 249.82 | 89.54 | 3307.25 | |
| Medium | 41.44 | 501.34 | 802.33 | 346.80 | 269.61 | 1961.52 | |
| High | 6.67 | 43.85 | 168.37 | 129.26 | 246.67 | 594.82 | |
| Extremely high | 0 | 0 | 14.61 | 111.18 | 464.67 | 590.47 | |
| Total | 2824.71 | 3386.22 | 1787.25 | 853.75 | 1070.49 | 9922.42 | |
| Year 2010 | Extremely Low | Low | Medium | High | Extremely High | Total | |
|---|---|---|---|---|---|---|---|
| Year 1990 | |||||||
| Extremely low | 2677.13 | 1855.91 | 333.72 | 114.44 | 9.88 | 4991.08 | |
| Low | 141.18 | 1430.13 | 1255.42 | 472.98 | 266.21 | 3565.92 | |
| Medium | 6.39 | 100.17 | 198.11 | 227.22 | 350.75 | 882.65 | |
| High | 0 | 0 | 0 | 39.12 | 289.88 | 329.00 | |
| Extremely high | 0 | 0 | 0 | 0 | 153.77 | 153.77 | |
| Total | 2824.71 | 3386.22 | 1787.25 | 853.75 | 1070.49 | 9922.42 | |
| Transfer Direction | 1990–2000 | 2000–2010 | Transfer Direction | 1990–2000 | 2000–2010 |
|---|---|---|---|---|---|
| From extremely low to low | 156.49 | 116.24 | From medium to high | 48.01 | 34.68 |
| From extremely low to medium | 0.58 | 14.26 | From medium to extremely high | 10.77 | 26.96 |
| From extremely low to high | 0 | 1.67 | From high to extremely low | 0 | 0.67 |
| From low to extremely low | 4.80 | 63.13 | From high to low | 0 | 4.38 |
| From low to medium | 166.09 | 65.94 | From high to medium | 0 | 16.84 |
| From low to extremely high | 11.47 | 24.98 | From high to extremely high | 32.90 | 24.67 |
| From low to extremely high | 0 | 8.95 | From extremely high to medium | 0 | 1.46 |
| From medium to extremely low | 0 | 4.14 | From extremely high to high | 0 | 11.12 |
| From medium to low | 0 | 50.13 |
© 2017 by the authors. Licensee MDPI, Basel, Switzerland. This article is an open access article distributed under the terms and conditions of the Creative Commons Attribution (CC BY) license (http://creativecommons.org/licenses/by/4.0/).
Share and Cite
Li, J.; Pu, R.; Gong, H.; Luo, X.; Ye, M.; Feng, B. Evolution Characteristics of Landscape Ecological Risk Patterns in Coastal Zones in Zhejiang Province, China. Sustainability 2017, 9, 584. https://doi.org/10.3390/su9040584
Li J, Pu R, Gong H, Luo X, Ye M, Feng B. Evolution Characteristics of Landscape Ecological Risk Patterns in Coastal Zones in Zhejiang Province, China. Sustainability. 2017; 9(4):584. https://doi.org/10.3390/su9040584
Chicago/Turabian StyleLi, Jialin, Ruiliang Pu, Hongbo Gong, Xu Luo, Mengyao Ye, and Baixiang Feng. 2017. "Evolution Characteristics of Landscape Ecological Risk Patterns in Coastal Zones in Zhejiang Province, China" Sustainability 9, no. 4: 584. https://doi.org/10.3390/su9040584
APA StyleLi, J., Pu, R., Gong, H., Luo, X., Ye, M., & Feng, B. (2017). Evolution Characteristics of Landscape Ecological Risk Patterns in Coastal Zones in Zhejiang Province, China. Sustainability, 9(4), 584. https://doi.org/10.3390/su9040584