Article

Spatial Expansion and Soil Organic Carbon Storage Changes of Croplands in the Sanjiang Plain, China

1
Key Laboratory of Wetland Ecology and Environment, Northeast Institute of Geography and Agroecology, Chinese Academy of Sciences, Changchun 130102, China
2
University of Chinese Academy of Sciences, Beijing 100049, China
3
Department of Earth Sciences, Indiana University-Purdue University, Indianapolis 420, IN 46202, USA
4
Jilin Province Water Resource and Hydropower Consultative Company of P. R. China, Changchun 130021, China
5
College of Computer and Information, Fujian Agriculture and Forestry University, Fuzhou 350002, China
6
College of Earth Science, Jilin University, Changchun 130100, China
*
Authors to whom correspondence should be addressed.
These authors contributed equally to this work.
Sustainability 2017, 9(4), 563; https://doi.org/10.3390/su9040563
Submission received: 23 January 2017 / Revised: 27 March 2017 / Accepted: 30 March 2017 / Published: 12 April 2017
(This article belongs to the Special Issue Physical Geography and Environmental Sustainability)

Abstract

:
Soil is the largest pool of terrestrial organic carbon in the biosphere and interacts strongly with the atmosphere, climate and land cover. Remote sensing (RS) and geographic information systems (GIS) were used to study the spatio-temporal dynamics of croplands and soil organic carbon density (SOCD) in the Sanjiang Plain, to estimate soil organic carbon (SOC) storage. Results show that croplands increased with 10,600.68 km2 from 1992 to 2012 in the Sanjiang Plain. Area of 13,959.43 km2 of dry farmlands were converted into paddy fields. Cropland SOC storage is estimated to be 1.29 ± 0.27 Pg·C (1 Pg = 103 Tg = 1015 g) in 2012. Although the mean value of SOCD for croplands decreased from 1992 to 2012, the SOC storage of croplands in the top 1 m in the Sanjiang Plain increased by 70 Tg C (1220 to 1290). This is attributed to the area increases of cropland. The SOCD of paddy fields was higher and decreased more slowly than that of dry farmlands from 1992 to 2012. Conversion between dry farmlands and paddy fields and the agricultural reclamation from natural land-use types significantly affect the spatio-temporal patterns of cropland SOCD in the Sanjiang Plain. Regions with higher and lower SOCD values move northeast and westward, respectively, which is almost consistent with the movement direction of centroids for paddy fields and dry farmlands in the study area. Therefore, these results were verified. SOC storages in dry farmlands decreased by 17.5 Tg·year−1 from 1992 to 2012, whilst paddy fields increased by 21.0 Tg·C·year−1.

1. Introduction

Soil is the largest pool of terrestrial organic carbon in the biosphere. It holds more than twice as much carbon as plants or the atmosphere; therefore, a slight change in soil organic carbon (SOC) can have great impacts on global terrestrial carbon cycling [1]. Climate change is being reinforced by increasing carbon dioxide emissions from soils owing to rising temperature [2], hence leading to a positive feedback effect [3]. The direct impact of human activities, deforestation, biomass burning, land cover change, and environmental pollution, releasing trace gases enhancing the “greenhouse effect” can markedly change the carbon balance of terrestrial ecosystems. In particular, agricultural activities involving soil carbon sequestration significantly affect the dynamics of SOC storage [4]. Accurate evaluation of SOC dynamics is important to reveal potential responses of the terrestrial biosphere to global change [5].
SOC in croplands is of high importance to both food security and climate change mitigation, since it has a strong impact on both crop productivity and yield stability [6]. Many efforts tried to estimate SOC storage in croplands [7,8]. On account of a higher rate of mineralization, lower carbon input, and higher losses caused by accelerating erosion and leaching, most croplands contain lower SOC concentrations than other land-cover types [6]. As a large agricultural country, China has more than 1.72 × 10⁶ km2 cropland surface area [9]; therefore, it plays an important role in regional climate change; and is highly sensitive to human activities such as irrigation and crop rotation [10]. A general declining trend of SOC storage has occurred in China’s soils in recent decades, but one study indicates that SOC storage in China’s croplands has increased [11]. Consequently, the uncertainty associated with estimates of cropland SOC storage and its changes is still unresolved. Therefore, it is important to accurately estimate cropland SOC storage dynamics during recent decades.
SOC is highly sensitive to land cover change. Cropland change significantly affects the vertical and horizontal distribution of SOC in croplands and its losses and gains [12]. Cropland change causes changes in biodiversity, actual and potential primary productivity, soil quality, soil runoff, and sedimentation rate. It also influences material and energy flows that sustain the biosphere and geosphere, including trace gases emissions and the hydrological cycle. In addition, it impacts the water and energy balance and the biogeochemical cycling of carbon from the regional to global scale. Wetland, grassland and forest reclamation decrease plant productivity and the input of carbon. This increases the decomposition rate of SOC and hence reduces SOC sequestration. Carbon is emitted to the atmosphere, which brings the carbon cycle out of balance unbalances the carbon cycle [13]. Hence, monitoring cropland change is critically important to estimate the SOC pool.
Remote sensing (RS) and geographic information systems (GIS) are widely used to monitor cropland change and estimate SOC storage change [14]. In Brazil, these methods were applied to estimate carbon pools in Rondonia [15]. In China, previous studies have applied RS and GIS to characterize the carbon storage in Northeastern China and analyze spatial patterns of urban carbon metabolism in Beijing [16,17]. In recent years, airborne hyperspectral thermal infrared data, hyperspectral satellite data and field spectroscopy have been applied to estimate SOC and map soil carbon content [18,19]. RS and GIS can be applied to estimate SOC storage at different scales by estimating the SOC values of point source data at unsampled locations with spatial interpolation methods [20]. However, direct measurement of soil carbon at larger scales is expensive and time consuming. Hence, RS and GIS are used more and more intensively to estimate the SOC pool at regional, national, and global scales [21].
Only approximately 820 km2 of cropland occurred in the Sanjiang Plain in 1949; prior to this year little cropland existed here. Owing to the influx of immigrants after this time period, cropland increased dramatically and turned into the dominant land-cover type in the Sanjiang Plain. The Sanjiang Plain is now one of the most productive agricultural regions in China [22]. Therefore, the accurate estimate of cropland change and its SOC storage change induction is important to guarantee food security and maintain the regional carbon balance. The aim of this study is to: (1) illustrate the spatio-temporal dynamics of croplands in the Sanjiang Plain; (2) characterize SOC density (SOCD) change and its spatial distribution; and (3) evaluate SOC storage dynamics of croplands in the Sanjiang Plain over the past two decades.

2. Materials and Methods

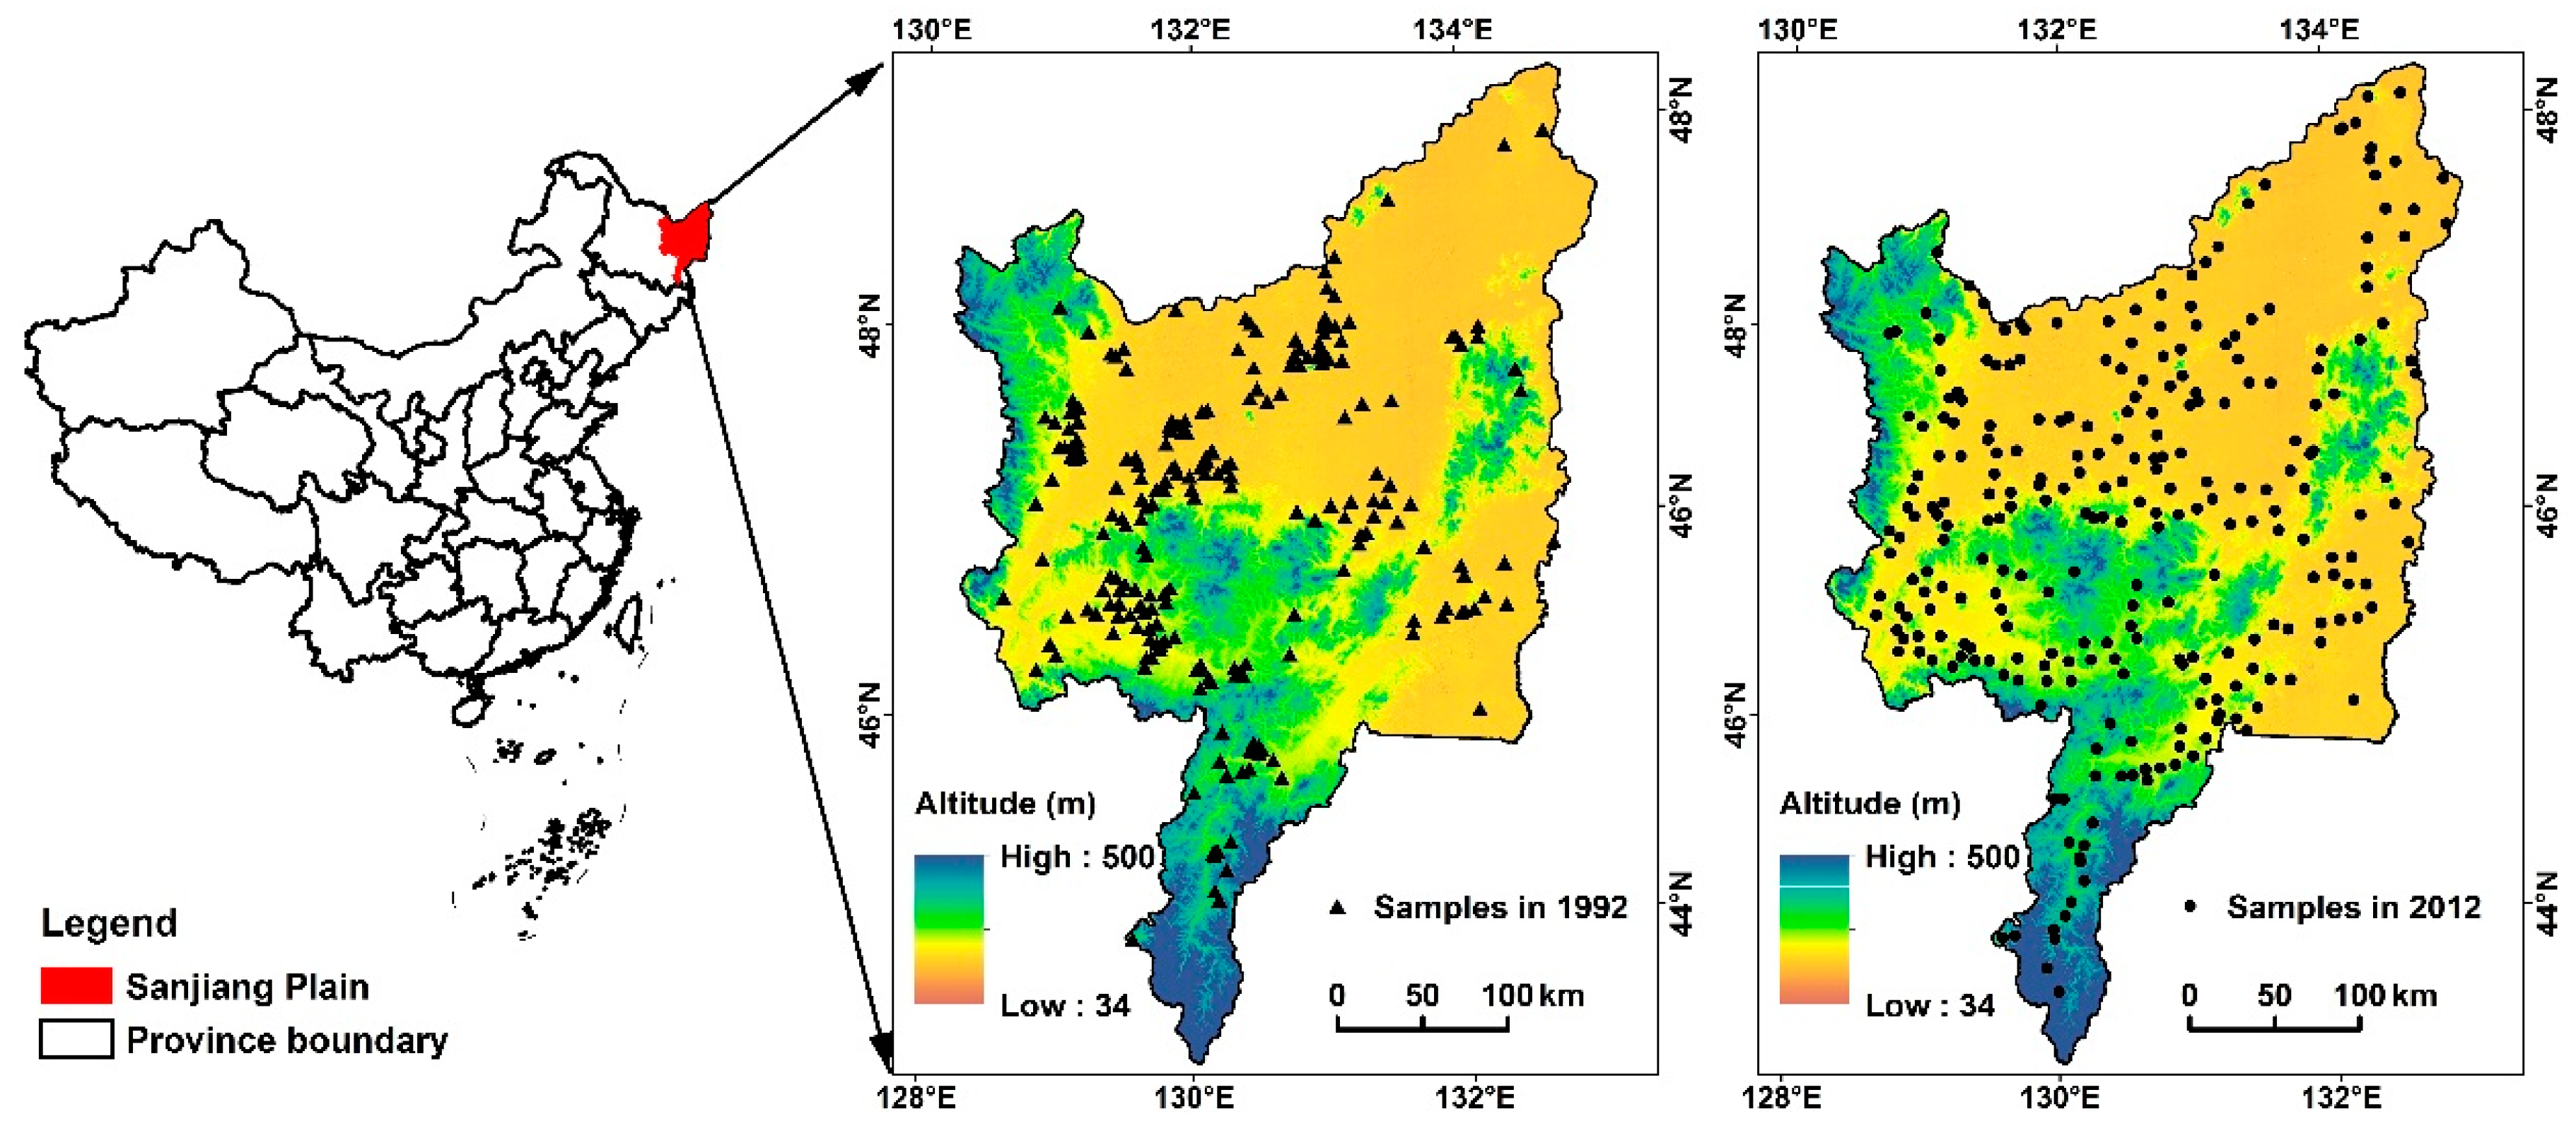
2.1. Description of Study Area

The Sanjiang Plain (129°11′20″–135°05′10″E, 43°49′55″–48°27′56″N) is located in the northeastern part of China, with an altitude ranging from 34 to 500 m (Figure 1). It is a low alluvial plain formed by the Heilongjiang, Songhuajiang, and Wusulijiang Rivers, covering a total area of 108,513 km2 that is composed of 23 counties. The climate is temperate humid and sub-humid continental monsoon, with a mean annual precipitation of 500–650 mm and a mean annual temperature of 1.4–4.3 °C. The zonal soil types are dominated by Luvisols, Phaeozems, Cambisols, and Histosols, which occupy more than 90% of the study area [22]. The Sanjiang Plain is one of China’s primary food and agricultural bases. Dominant crop types include soybean, maize, and paddy rice.

2.2. Object-Oriented Classification and Cropland Dynamics

2.2.1. Remote Sensing Data

Cloud-free Landsat Thematic Mapper (TM) data with a spatial resolution of 30 m from 1992 and 2012 were used to identify the landscape in the study region. Radiometric calibration and FLAASH atmospheric correction model with the software of ENVI (version 5.2, ITT Exelis, McLean, VA, USA) were used to correct all images by removing radiometric and atmospheric effects. There were 4787 survey sites (1663 for dry farmlands, 1120 for paddy fields and 2004 for other land-cover types) of croplands to check veracity of classification.

2.2.2. Object-Oriented Classification

Object-oriented classification is successfully applied to cropland classification using Landsat TM data [23], which can use spectral information, as well as other information such as shape, texture, and contextual relationships [24,25]. In addition, environmental factors related to cropland distribution, such as elevation, slope, and aspect, can also be used to improve cropland classification [24].
With the support of software eCognition (version 8.64, Definiens Imaging, Munich, Germany), the object-oriented classification approach was used to extract the distribution of croplands. Object-based classification generally consists of three steps. The first step is segmentation, where the image is segmented into objects consisting of groups of relatively homogeneous pixels. Image segmentation parameters include scale, shape and compactness. The scale parameter indirectly determines the size of objects by specifying the maximum heterogeneity that is allowed within each object. A greater scale parameter corresponds to a greater average size of the objects. After a series of tests, the satisfactory scale parameter was set at 15. The shape factor balances spectral homogeneity versus shape of objects, whereas the compactness factor balances compactness and smoothness. Weights from 0 to 1 could be applied to the shape and compactness factors, which control objects at a certain level of scale [25]. Cropland objects are regularly shaped; therefore, more weight was assigned to the shape than spectral homogeneity. The shape factor was set as 0.6 after a trial-and-error approach to parameter refinement, which was chosen with the goal of creating homogeneous cropland objects for the classification. The same weight parameters were determined to be 0.5 for both compactness and smoothness in order to balance both compactness and smoothness of object boundaries equally [26]. After objects in the images are segmented, a rule-based classification (i.e., membership functions) is used to classify each object into one of cropland (including paddy fields and dry farmlands) or non-cropland classes to get an initial classification result. Visual and manual interpretations are carried out to modify the initial result. Finally, accuracy assessment is conducted using ArcGIS (version 10.3, Esri, Redlands, CA, USA) with reporting of a series of performance metrics including producer’s and user’s accuracies, overall accuracy, and Kappa Coefficient of Agreement [24]. Although there is classification uncertainty using the object-oriented classification method for mapping croplands, it has been widely proven to be more accurate and robust than the traditional pixel-based method [27].

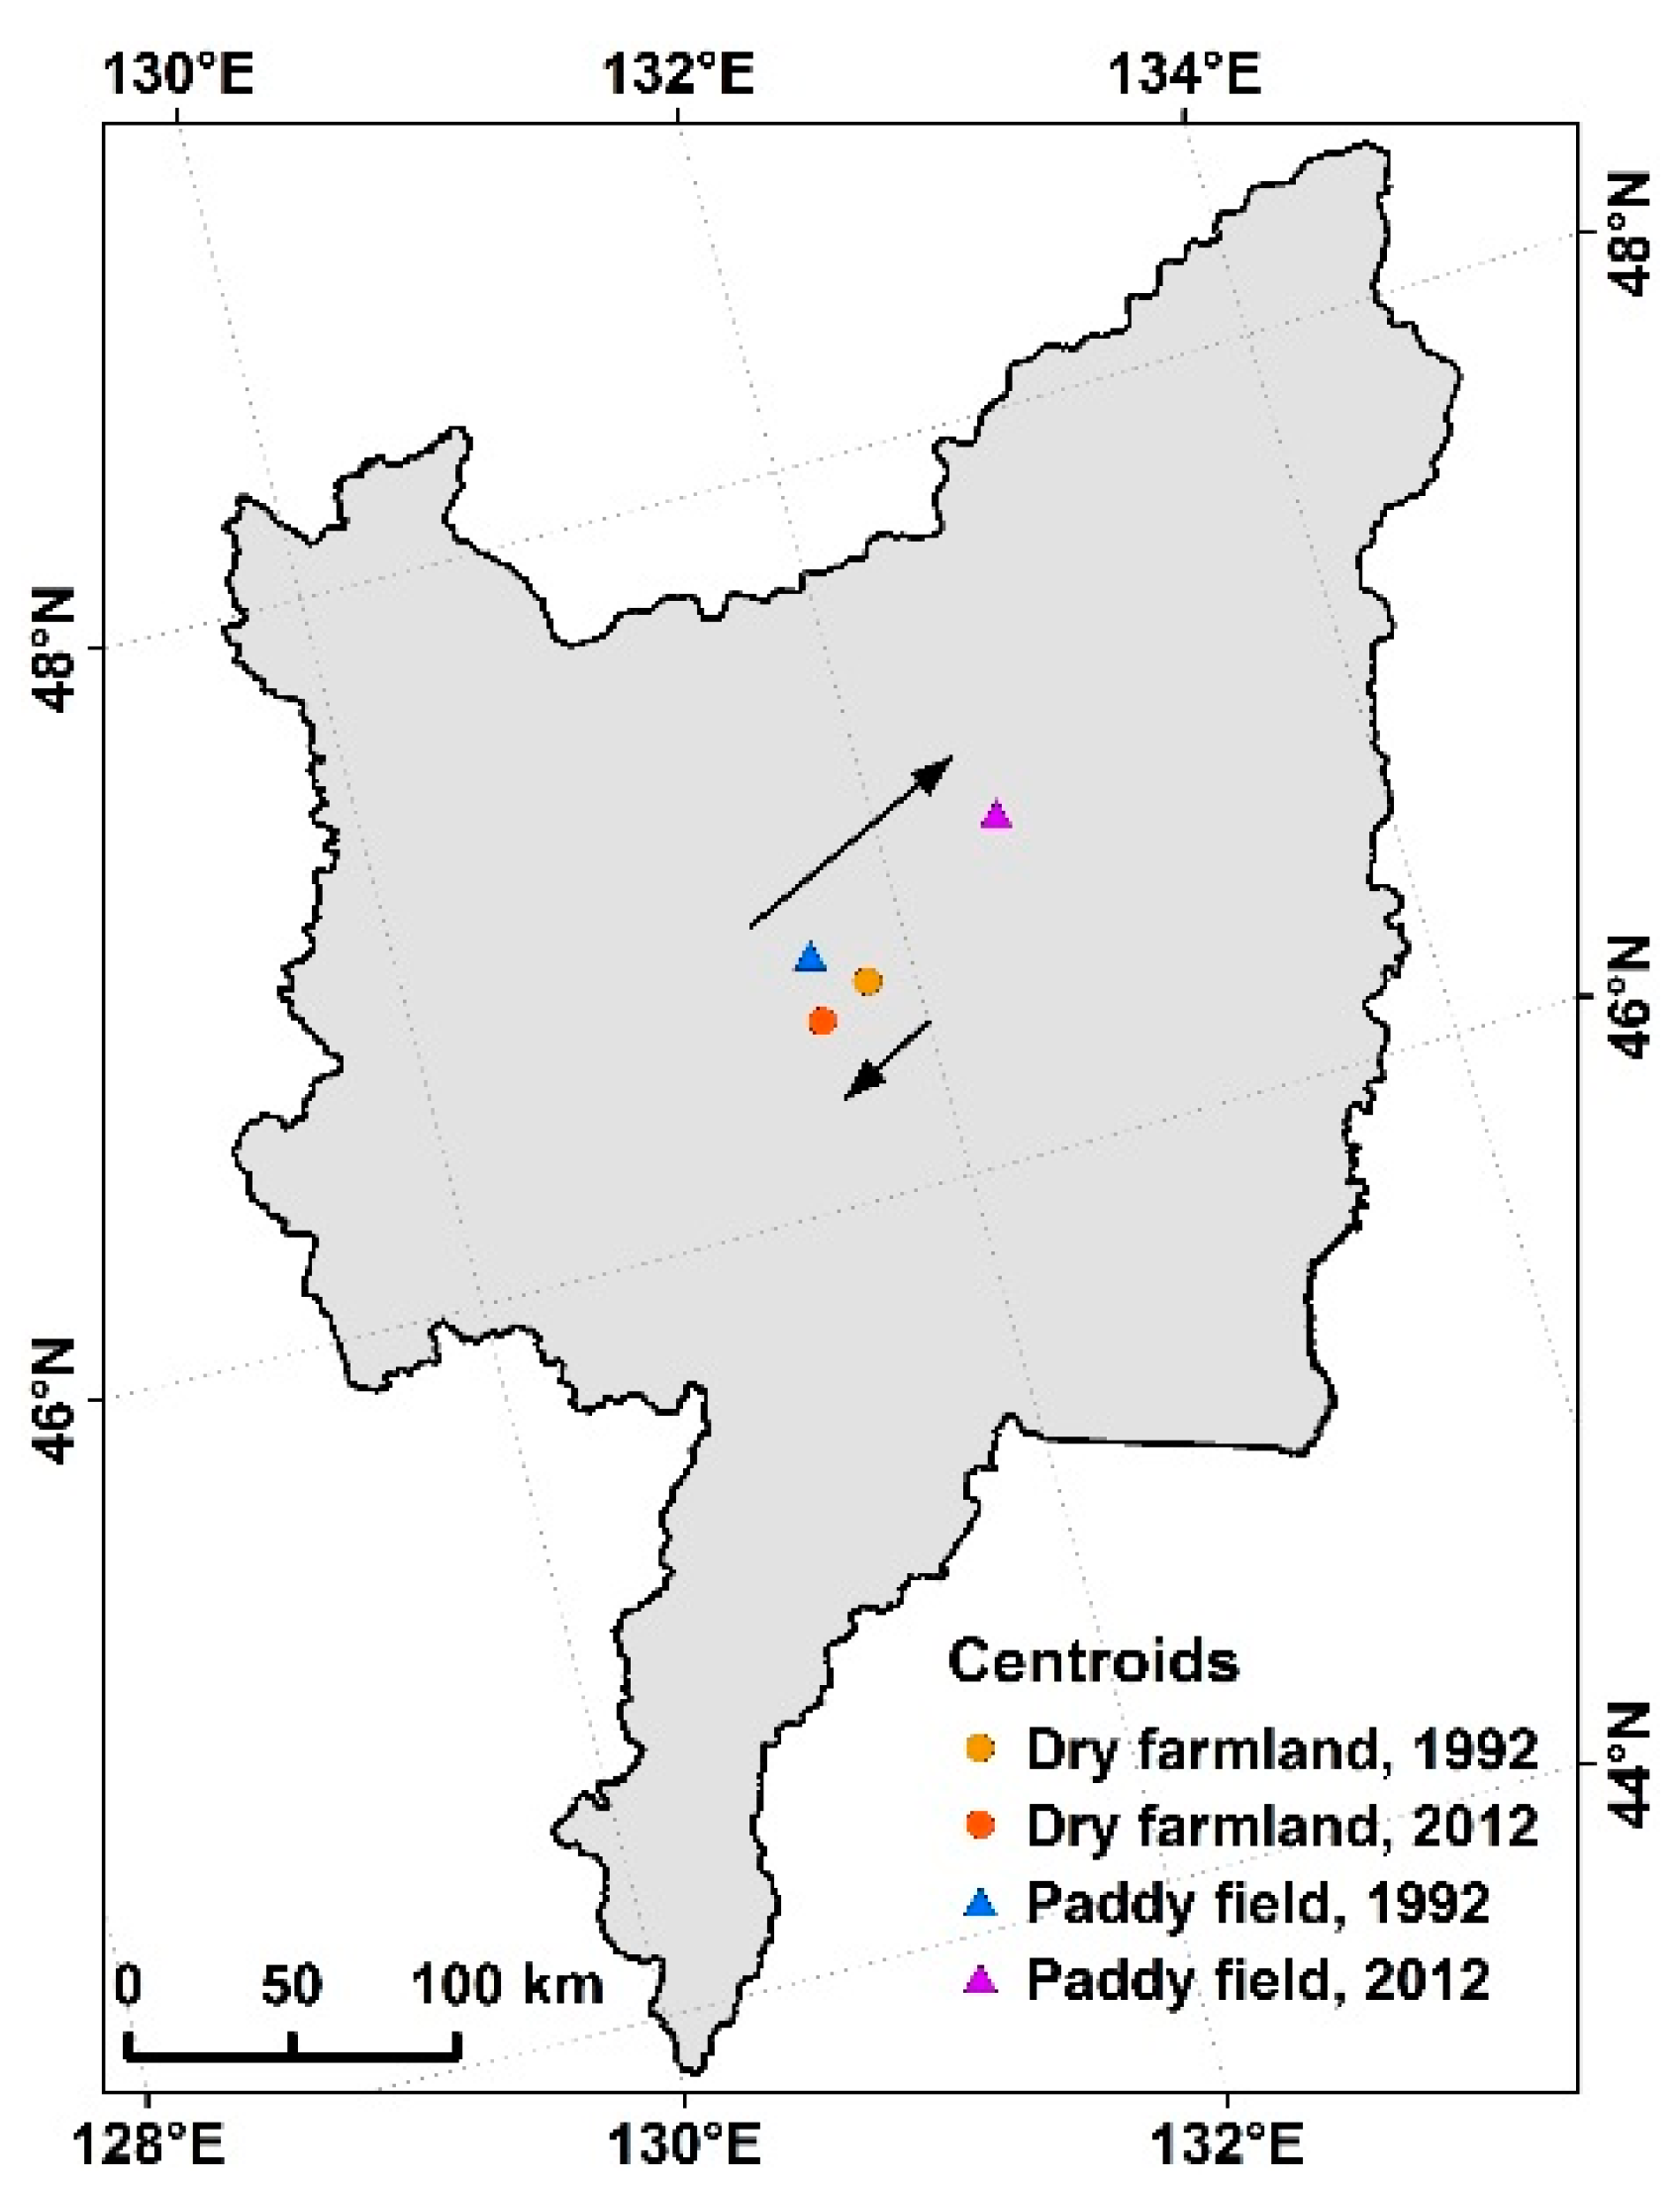
2.2.3. Calculation of the Area-Weighted Center

To explore the spatio-temporal changes in the spatial distribution of croplands, area-weighted centers (centroids) of cropland patches are calculated [28]. The centroid of an area includes the coordinates of a geometric center of a polygon or multiple polygons [29], which is calculated from the geometric characteristics of a polygon by an advanced application of spatial analysis, i.e., predictive modeling. This allows the quantification of the direction and distance of the change and identify geographic trends by representing the shifts as vectors linking centroids from different periods. Area-weighted centroids are calculated to represent the spatio-temporal movement of the dry farmlands and paddy fields from 1992 to 2012 in the Sanjiang Plain. Centroids of complex or arbitrary shapes can be obtained by integration, expressed as follows:
X t = i = 1 N ( C t i X i ) / i = 1 N C t i
Y t = i = 1 N ( C t i Y i ) / i = 1 N C t i
where X t and Y t are abscissa and ordinate of each land-use type in period t , respectively; C t i is the area of a patch i in a land-cover type; X i and Y i represent the abscissa and ordinate of a patch i ; and Ν is the number of patches [28].

2.3. Soil Profile Data

A dataset consisting of 229 soil profiles (195 for dry farmlands and 34 for paddy lands) is extracted from the Second National Soil Inventory to analyze the SOC storage for 1992 [22,30]. This national level soil inventory investigated soil physical and chemical properties for different horizons. The resultant dataset includes the geographic location, land cover information, layer thickness, bulk density, rock fragment, and soil organic matter for each soil profile.
To estimate the 2012 soil organic carbon (SOC) storage, soil samples were collected at 265 sites (206 for dry farmlands and 59 for paddy fields) for croplands across the Sanjiang Plain in 2012. At each site, three profiles were excavated to 100 cm depth to collect samples for physical and chemical analyses of the soil profile, and three soil samples were taken at three depths: 0–30, 30–60, and 60–100 cm. Soil samples were collected for each depth layer using a standard 100 cm3 cutting ring. The methods to preprocess soil samples and measure SOC concentration can be found in previous studies [4,8].
Locations of these soil sampling sites for 1992 (n = 229) and 2012 (n = 265) are shown in Figure 1. In this study, soil organic matter was converted to SOC for each sample using a constant of 0.58 [31]. The SOCD and SOC storage were calculated using Equations (3) and (4), respectively.
S O C D = S O C × B D × H × 0.01
S O D S = A × S O C D
where SOCD is the soil organic carbon density (kg·m−2), SOC is the soil organic carbon content (g·kg−1), BD is the soil bulk density (g·cm−3), H is the soil layer height (cm), SODS is the soil organic carbon storage (kg), and A is the area of different landscape types (m2) [14].

2.4. Geostatistical Analysis

2.4.1. Geostatistical Analysis Method

Statistics and geostatistics have been applied widely to describe and predict spatial variation, to quantify the spatial distribution patterns of SOCD and to carry out spatial interpolation [32]. Geostatistics uses the semivariogram to quantify the spatial variation based on the theory of a “regionalized variable”, and provides the input parameters for the spatial interpolation method of Kriging [32,33]. The semivariogram is half the expected squared difference between paired data values z ( x ) and z ( x + h ) to the lag distance h, by which locations are separated [34]:
γ ( h ) = 1 2 N ( h ) i = 1 N ( h ) [ z ( x i ) z ( x i + h ) ] 2
where z ( x i ) is the value of the variable z at location of x i and N ( h ) is the number of pairs of sample points separated by h. For irregular sampling, it is rare for the distance between the sample pairs to be exactly equal to h; that is, h is often represented by a distance band. The experimental semivariogram is calculated for several lag distances. The smallest nugget values of mean prediction errors (ME) close to 0 and root-mean-square standardized prediction errors (RMSSE) close to 1 are selected [35].
In this study, the software GS+ (version 9.0, Gamma Design Software, Plainwell, MI, USA) is used to carry out geostatistical parameters, including nugget variance C0, structural variance sill (C0 + C1) and spatial autocorrelation length (range) that are derived from the fitted semivariogram The degree of spatial dependence (GD) was used to define distinct classes of spatial dependence [36].
G D = C 0 / ( C 0 + C 1 ) × 100 %   { G D 25 % strong   spatial   dependence ; 25 % < G D < 75 % moderate   spatial   dependence ; G D 75 % weak   spatial   dependence .

2.4.2. Geostatistical Analysis of SOCD

Geostatistical parameters and prediction errors are shown in Table 1. MEs and RMSSEs for the SOCD at different depths were all close to 0 and 1, respectively. It indicates that semivariogram models were accurate and could be used for Kriging. The semivariogram for SOCD in the 60–100 cm depth in 1992 had a larger nugget (C0), structural variance sill (C0 + C1) and spatial autocorrelation length (range) than for other depths, implying that more sampling errors and inherent variability of SOCD are in this depth than in other depths. GD values smaller than 25% at depths of 0–30 cm in 1992, all depths in 2012 indicated that the variable was strongly spatially dependent. GD values ranging 25–75% at depths of 30–60 cm, 60–100 cm and 0–100 cm showed that the variable was moderately spatially dependent. In this study, the semivariograms were all fitted by the exponential model.
The GIS software ArcGIS was used to produce maps obtained by interpolation for visualization. For raster GIS maps algebraic functions were used to calculate and visualize the spatial differences between the maps. The SOCD values for each 30 m × 30 m cell in the Sanjiang Plain were generated by using ordinary Kriging interpolation on the soil datasets of 1992 and 2012.

3. Results

3.1. Cropland Changes

Error matrices for assessing classification accuracy of the croplands for 1992 and 2012 are shown in Table 2. Results based on the object-oriented classification for mapping croplands in 1992 and 2012 in the Sanjiang Plain show that the overall classification accuracy and the Kappa statistics are more than 93% and 91% (Table 2), respectively. Classification results are sufficient for the assessment of SOC storage for croplands in the Sanjiang Plain.
The cropland distribution in 1992 and 2012 and their changes are shown in Figure 2. Croplands covered an area of approximately 50,740.60 km2 in 1992 and 61,341.28 km2 in 2012, which is approximately 46.76% and 56.53% of the total study area, respectively. This implies a cropland increase of 20.89% within 20 years, at an average rate of 530.02 km2·year−1. Areas of dry farmlands and paddy fields were 44,292.91 km2 and 6447.69 km2 in 1992, respectively; decreasing by 19.87% and increasing by 304.69% from 1992 to 2012, respectively. An area of 13,959.43 km2 of dry farmlands was converted into paddy fields from 1992 to 2012. Although dry farmlands covered more area (87.38%) than paddy fields in 1992 and (57.91%) in 2012, the area and proportion of dry farmlands decreased. In contrast, paddy fields increased in area and proportion.
Figure 3 shows the position of area-weight centroids of dry farmlands and paddy fields. Results indicate that the centroids of dry farmlands and paddy fields patches shifted southwestward and northeastward from 1992 to 2012, with a distance of 18.58 km and 71.41 km, respectively.

3.2. Descriptive Statistics for Soil Bulk Density (BD)

Results of descriptive statistics for BD are shown in Table 3. BD values varied significantly among different depths with an increase trend following depth (p < 0.05) in both 1992 and 2012. The BD in the same depth (0–30 cm and 30–60 cm) was significantly higher in 1992 than in 2012 (p < 0.05), but the difference of the BD in 60–100 cm was not significant between 1992 and 2012. The distribution of BD can be described by coefficient of variation (CV). The CV smaller than 10% indicates low variability, the CV ranging between 10% and 100% indicates moderate variability, and the CV larger than 100% indicates high variability. All CV values of the BD ranged between 10% and 100% except for the 60–100 cm depth in 1992, indicating that the BD was low variability at the 60–100 cm depth in 1992 (CV < 10%) and moderate variability at other five depths. It indicates that the BD had a heterogeneous spatial distribution.

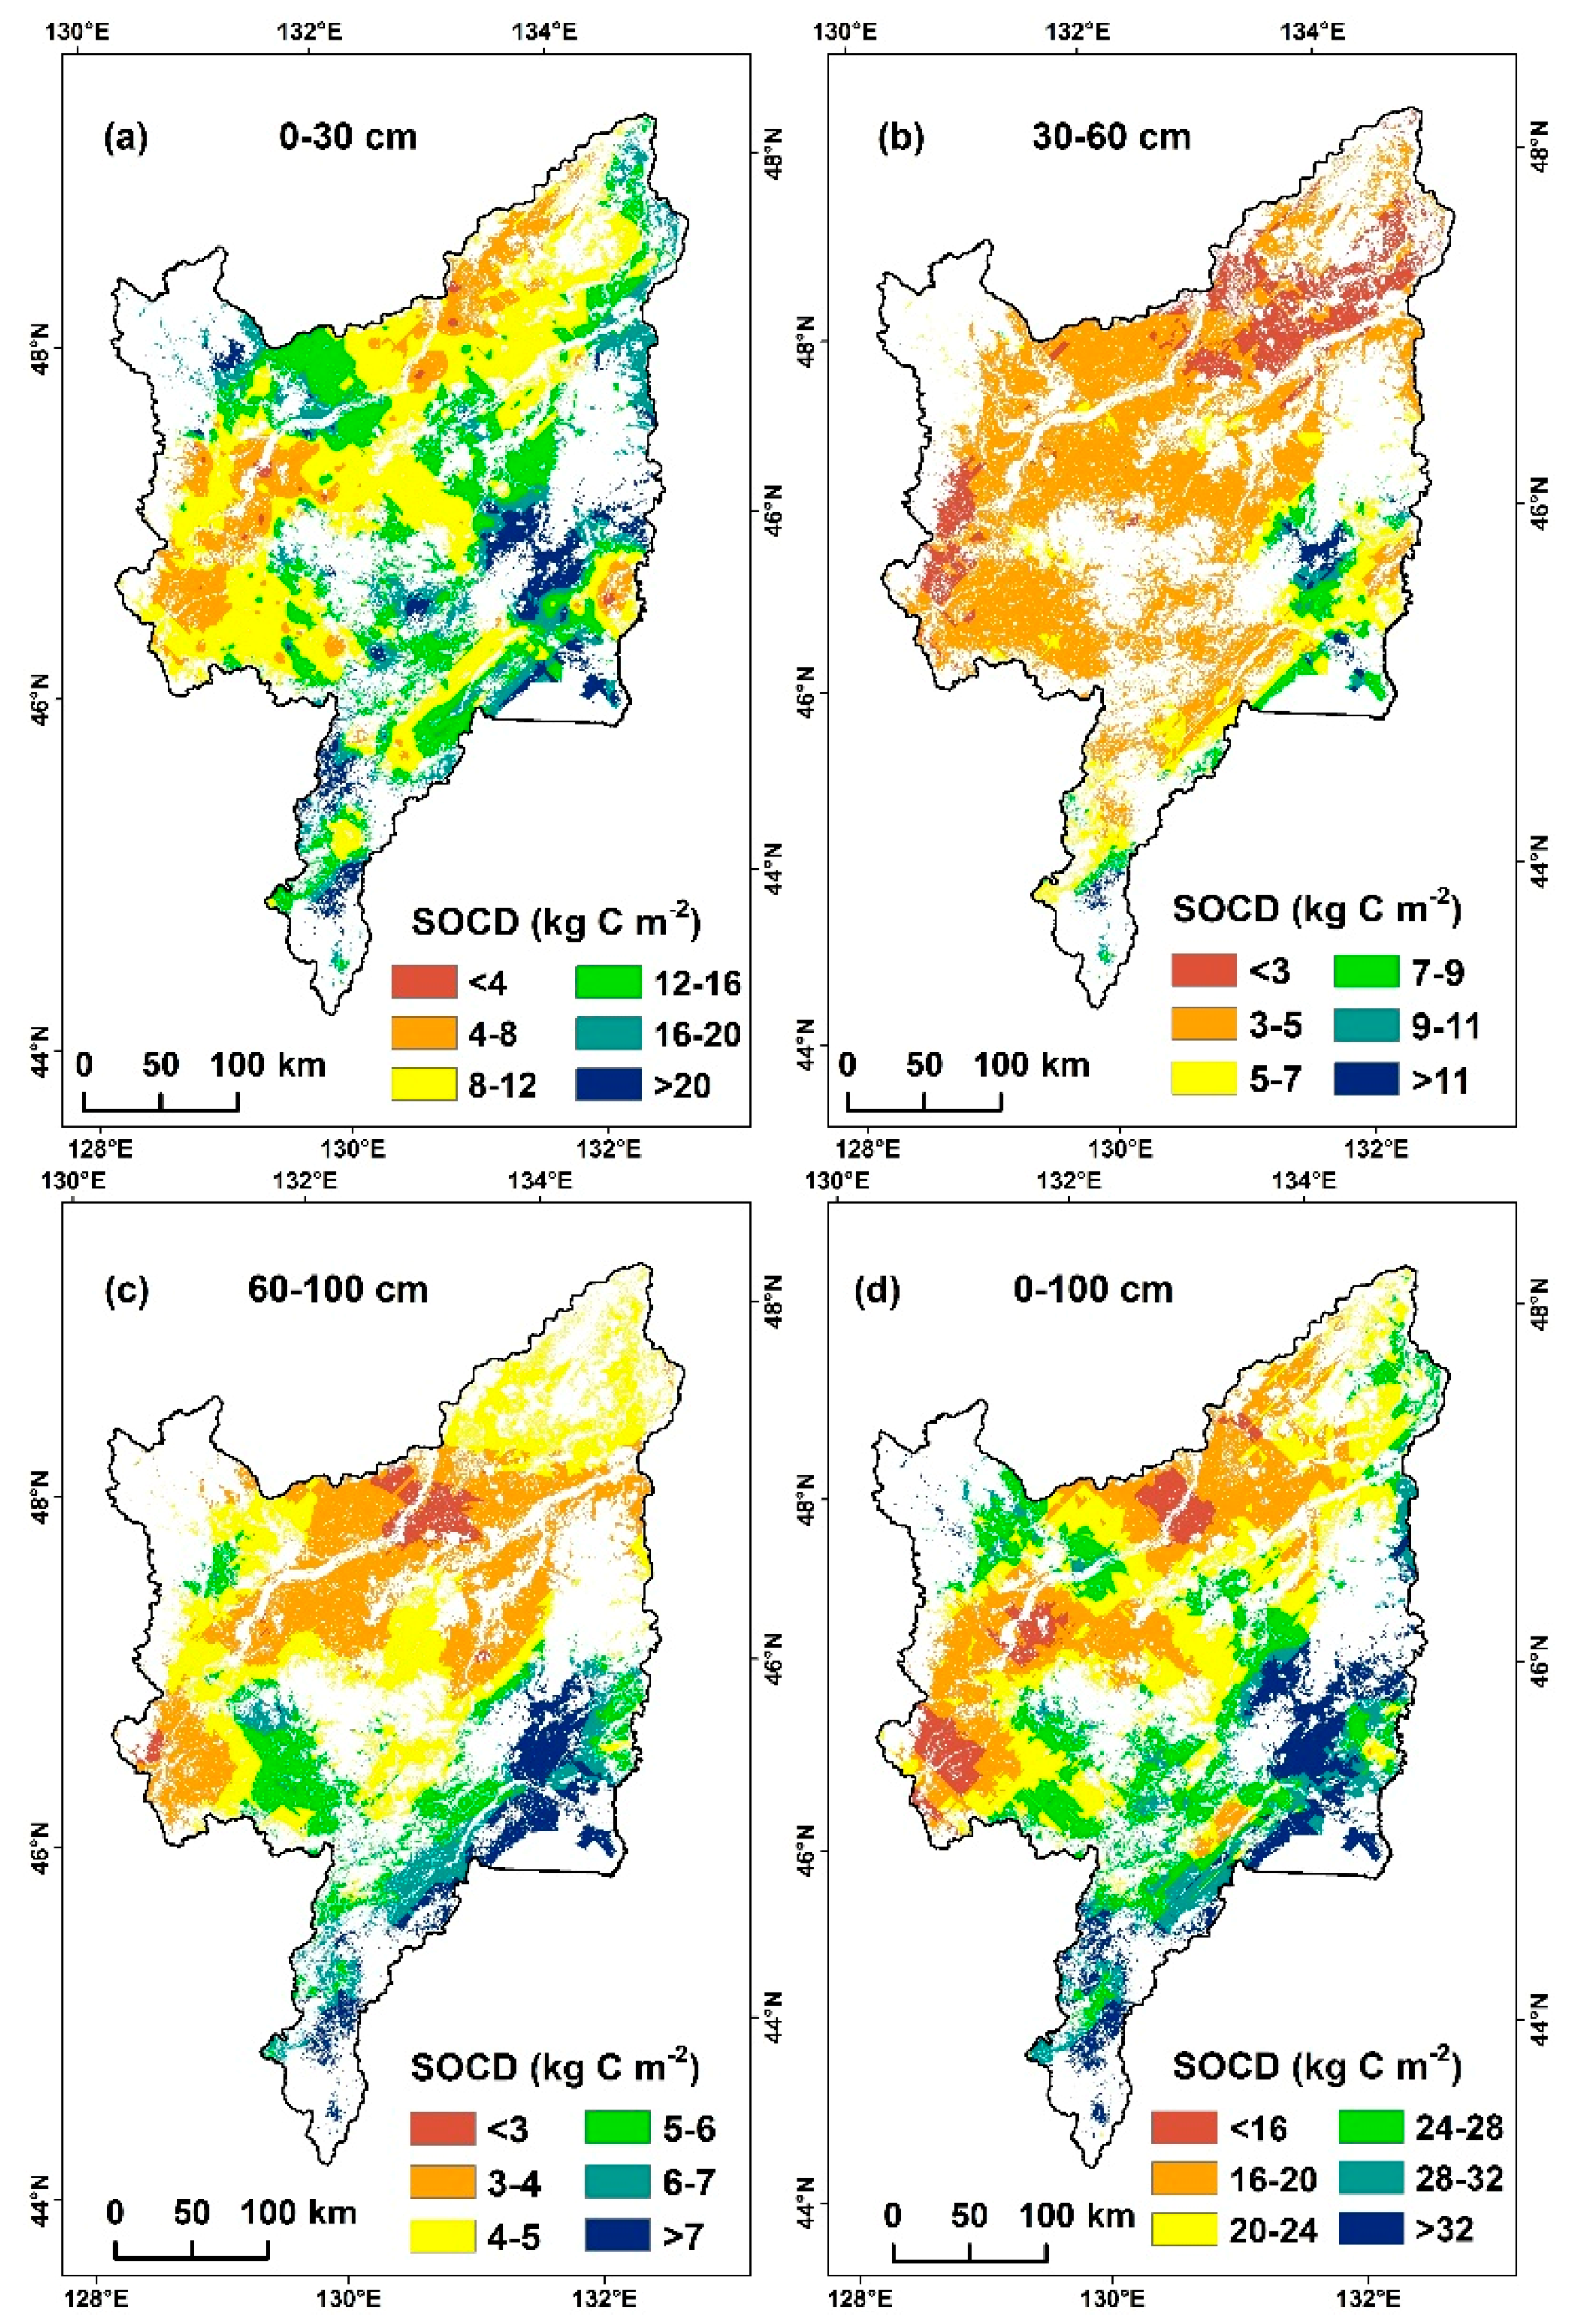
3.3. Spatio-Temporal Dynamics of SOCD

The spatial variation of SOCD according to soil depth is apparent (Figure 4 and Figure 5). The SOCD in the top 30 cm ranged from 0.87 to 36.97 kg·C·m−2 in 1992 and from 0.92 to 48.63 kg·C·m−2 in 2012, with an average SOCD of 12.44 kg·C·m−2 and 9.95 kg·C·m−2, respectively. Most of the SOCD values at 0–30, 30–60 and 60–100 cm had a range of 4–16, 3–5 and 3–5 kg·C·m−2, and were 80.58%, 66.81% and 65.26% in 1992, respectively, while SOCD values had a range of 4–16, 3–7 and 3–7 kg·C·m−2 and were 95.69%, 80.28% and 88.34% in 2012, respectively.
The SOCD value shows inconsistent spatial distributions for the time node of 1992 and 2012 (Figure 4d and Figure 5d). For the upper meter of soil, high SOCD values (more than 28 kg·C·m−2) were mainly present in the south and southeast in 1992, whereas high SOCD values were found in the northeast in 2012. Low SOCD values (<16 kg·C·m−2), however, are consistently distributed in 1992 and 2012 in the west and northwest, as well as being sprawled westwards in 2012.
On account of the difference in depth interval thickness and SOC concentrations between the depths, the mean SOCD values were different. The mean and standard deviations (SD) of SOCD at different depths were 12.44 ± 4.77 kg·C·m−2 (0–30 cm), 6.71 ± 3.44 kg·C·m−2 (30–60 cm) and 3.75 ± 1.60 kg·C·m−2 (60–100 cm) in 1992 and 9.95 ± 3.07 kg·C·m−2 (0–30 cm), 5.63 ± 2.02 kg·C·m−2 (30–60 cm) and 5.06 ± 1.32 kg·C·m−2 (60–100 cm) in 2012.
From 1992 to 2012, the mean SOCD values for the upper meter in croplands significantly decreased from 24.08 kg·C·m−2 to 21.00 kg·C·m−2, corresponding to a decrease of 12.79%. When compared to paddy fields, a higher mean ± SD of SOCD were found for dry farmlands at 0–30, 0–60 and 0–100 cm in 1992 (Table 4). Conversely, in 2012, the mean ± SD SOCD values in paddy fields were higher than dry farmlands at different depth interval thicknesses (independent-samples t-test, significant difference at p < 0.1 level at 0–30 and 0–60 cm depth and non-significant difference at the 0–100 depth using).

3.4. Change of SOC Storage

The results reveal that SOC storage in the upper meter increased from 1992 to 2012 with a yearly increase of 3.5 Tg·C. More specifically, SOC storage decreased from the surface (0–30 cm) to a higher depth (60–100 cm). The mean ± SD SOC storages at different intervals were 0.63 ± 0.24 Pg·C, 0.34 ± 0.17 Pg·C and 0.19 ± 0.08 Pg·C in 1992 and 0.61 ± 0.19 Pg·C, 0.35 ± 0.12 Pg·C and 0.31 ± 0.08 Pg·C in 2012 (Table 4). Similarly, the cumulative SOC storages for the upper 30, 60 and 100 cm depths were 0.63, 1.01, and 1.22 Pg·C in 1992 and 0.61, 0.98, and 1.29 Pg·C in 2012, respectively. Approximately 51.65% and 47.39% of the SOC storage in the upper meter were stored within the upper 30 cm depth in 1992 and 2012, respectively.
The SOC storage in paddy fields and dry farmlands were estimated, and show a consistent distribution with croplands in different soil intervals. There was a great difference of SOC storage for both 1992 and 2012 between paddy fields and dry farmlands in the upper meter. While SOC storages in dry farmlands were higher than those in paddy fields by 0.94 Pg·C and 0.17 Pg·C in 1992 and 2012, respectively, the yearly increase of 21.0 Tg·C for paddy fields was higher than −17.5 Tg·year−1 for dry farmlands. The SOC storage in paddy fields in the upper meter varied from 11.74% to 43.18% from 1992 to 2012.

4. Discussion

4.1. Cropland Expansion and Conversion from Dry Farmlands to Paddy Fields

As one of the most productive agricultural regions in China, the Sanjiang Plain has attracted much attention for its cropland change over the past several decades. The classification results show that croplands in the Sanjiang Plain covered 61,341.28 km2 in 2012, which accounted for approximately 14.72% (417,000 km2) and 3.56% (1,720,000 km2) for Northeast China [23] and China [9], respectively. Wang et al. [37] reported a cropland area increase in the Sanjiang Plain of 42,900 km2 from 1954 to 2005, which is consistent with our results. Regional large-scale increasing population has been the most important and direct driving force for cropland area change [37]. National policies and enhancement by agricultural technology development were also reasons for the increase in cropland area [23].
Our study reveals that centroids of dry farmlands and paddy fields moved southwestward and northeastward from 1992 to 2012, respectively. Large conversion from dry farmlands to paddy fields is the major reason for the inverse movement of the centroid of dry farmlands and paddy fields. Warming climate is one of the reasons for the expansion of paddy fields northeastward [38]. Furthermore, the gradient of precipitation with a decrease from northeast to southwest [39] suggests that the northeast is more suitable for planting rice than the southwest. Moreover, scientific-technical progress, such as development of cold-tolerant varieties of rice, also accounts for the northeastward expansion of paddy fields [23]. Because the increasing area of paddy fields also occupied other natural land-use types beside dry farmlands, the centroid for paddy fields moved a greater distance than that of dry farmlands.

4.2. SOCD Dynamics during 1992–2012

4.2.1. SOCD Estimates

Many methods were used to estimate soil organic carbon, such as soil taxonomy, vegetation types, Holdridge zones, correlative relationship and modeling. The shortcoming of these methods include a lack of focus to details regarding soil types and soil diversity, complicated analog computation and lost sight of differences of major influence factors in different regions. At present, Kriging interpolation has been a major method to determine the spatial distribution of SOCD [40]. Based on a “regionalized variable”, Kriging interpolation has contributed to descriptions of the spatial distribution of SOCD, as well as analyses of correlation between SOCD and other factors [41]. A large number of soil profiles were surveyed over the study area and thus could improve the accuracy of estimation.
The higher SOCD value of croplands (12.44 kg·C·m−2) was discovered in the top 30 cm in the Sanjiang Plain than that in China’s croplands (3.5 kg·C·m−2) [42], which supports previous findings of higher SOCD in Northeast China than that in China [43,44]. This is mostly on account of lower temperature than in the south and more precipitation than the west of China [4]. In addition, the SOCD in the upper meter of the Sanjiang Plain croplands was higher than that in northeast China (9.49 kg·C·m−2) [45] and globally (7.9 kg·C·m−2) [46]. This may be due to conversion from marshes into croplands with the largest scales [37], as wetlands have the highest SOCD due to a low decomposition rate of soil organic matter and high soil moisture content [4,47]. Practices of no-tillage (NT) and reduced-tillage (RT) have greater carbon sequestration potentials than conventional tillage (CT) [48], but tillage systems is not the key reason for the difference, because the same CT systems were used in the Sanjiang Plain and most regions of China [4,49]. However, because straw return can increase carbon input to soil from crop residues [50], more straw return in the Sanjiang Plain may be an important factor for different SOCDs among the Sanjiang Plain, China and globally. Likewise, soil texture may be another factor for differences, because it plays a key role in shaping the spatial pattern of SOCD and closely relates to the decomposition rate of organic matter [51]. Our study also reveals that paddy fields and dry farmlands in the Sanjiang Plain have significantly higher SOCD than those in China at the depth of 30 cm (paddy soils, 4.54 kg·C·m−2 and dry farmlands, 3.47 kg·C·m−2) [10] and in the top meter (paddy soils, 9.72 kg·C·m−2 and dry farmlands, 6.38 kg·C·m−2) [52]. Overall, SOCD in the Sanjiang Plain croplands was more than twice that of China, indicating that the SOCD of croplands in the Sanjiang Plain plays a critical role in China’s carbon cycle.

4.2.2. SOCD Decrease

According to recent reports, SOCD dynamics of croplands are more and more a concern. Globally, conversion of natural to agricultural ecosystems has caused a loss of as much as 20–80 tons C ha−1 [6]. Previous studies reported that in past decades, the major factor responsible for soil carbon loss was the change in management practices in last decades toward increasing cultivation of annual crops [7]. In Belgium, SOCD significantly decreased (p < 0.05) in croplands, from 5.36 ± 0.03 to 4.95 ± 0.09 kg·C·m−2 from 1960 to 2006 [53]. In Finland, the annual carbon loss from cropland organic soils was on average 0.2%–0.3% year−1 corresponding to a carbon stock (kg·m−2) loss of 170–200 kg·ha−1·year−1 over the period of 1974 to 2009 [7]. In China, SOCD increased in eastern and northern China and decreased in northeastern China [43,54]. In Lindian, Hailun and Baoqing of Heilongjiang Province, northeast China, the SOCD in croplands between 1981 and 2011 decreased by 6.6, 14.7 and 5.7 Mg·C·ha−1, respectively [55]. However, the topsoil of SOCD in croplands increased significantly from 1980 to 2010, with an average increase of 0.56 kg·C·m−2 in the Songnen Plain of Northeast China [8]. Hence, the SOCD shows different trends at different times or scales, such as regional, continental and global scales.
Our study indicates there was a large variation of SOCD of the Sanjiang Plain croplands, with a loss of 0.31 kg·C·m−2·year−1 on average in the upper meter (Table 4). It is well known that lower temperature and higher precipitation are conducive to carbon sequestration [4,45]. Previous studies indicate that the temperature rose steadily with an average increase rate of 0.03 °C·year−1, and precipitation declined with an average decreased rate of 1.03 mm·year−1 in the Sanjiang Plain from 1952 to 2012 [22]. The significant warming and drying trend under climate change may have impacted the SOCD decline in croplands in the Sanjiang Plain. It was reported that long-term nitrogen fertilizer application has caused greater decrease in SOC concentration [56], while the rate of applying chemical fertilizers has increased remarkably from 1980s to 2010 in the Sanjiang Plain [30], which was another reason for the decline. Moreover, long-term cultivation also caused the loss of SOC. Ussiri and Lal [57] have shown that 43-year-old NT soil contains significantly higher concentration of SOC in the top 0–15 cm depth than moldboard plow tillage and chisel tillage treatments. Nevertheless, tillage management had a more variable impact on SOC storage than long-term cultivation in terms of both increase and decrease in storage with the implementation of reduced and NT practices according to field experiments [58]. NT cropping systems usually exhibit increased aggregation and soil organic matter relative to CT because macroaggregate turnover is approximately twice as slow in NT compared to CT [48]. The practice of CT in the Sanjiang Plain may be another factor for SOC loss.
BD is an important factor significantly influencing SOCD and its spatial distribution. The change of SOCD is more complicated due to the obvious vertical and horizontal characteristics distribution [36]. Pearson correlation is used to analyze the relationships between SOCD and BD. The correlation test results show that the SOCD at all depths has a significant negative correlation with BD (p < 0.01). The BD at the same depth was significantly higher in 1992 than in 2012 (Table 3, p < 0.05). The BD increase is an important factor SOC loss.

4.2.3. Differences in SOCD Dynamics between Paddy Fields and Dry Farmlands

Previous findings suggest that paddy fields have a relatively higher SOCD than dry farmlands [52,54], which correlates well to our results of 2012 in the Sanjiang Plain. This suggests that paddy fields play a critical role in SOC sequestration. In the upper meter, the mean SOCD values decreased from 1992 to 2012 in both paddy fields and dry farmlands, while paddy fields had conspicuously less annual decrease rate (0.07 kg·C·m−2·year−1) than dry farmlands (0.37 kg·C·m−2·year−1). Long-term tillage most likely led to the SOC loss for both paddy fields and dry farmlands. For paddy fields in the Sanjiang Plain, climate change causes SOC to decompose and release carbon dioxide into atmosphere, resulting in the loss of SOC. Large areas of conversion from dry farmlands to paddy fields resulted in the mean SOCD of paddy fields to decline to a lower mean SOCD than for dry farmlands. Many natural land-use types were reclaimed into paddy fields; therefore, the mean SOCD of paddy fields increased to a higher mean SOCD for natural land-use types than for paddy fields [4]. In summary, the conversion among dry farmlands, paddy fields and natural land-use types plays an important role in determining the mean SOCD.
A large regional variation of cropland carbon dynamics occurred across the Sanjiang Plain from 1992 to 2012 (Figure 4 and Figure 5). Specifically, the high SOCD values moved from south and southeast to northeast, and the regions of low SOCD values expanded westward. This movement direction of high and low SOCD values are consistence with the movements direction of centroid of paddy fields and dry farmlands, respectively, which suggests that the spatial variation for the centroid of paddy fields impacted the distribution of SOCD values. As a result, SOCD values were higher for paddy fields than for dry farmlands. Comparing Figure 4 and Figure 5, SOCD values increased in the northeast Sanjiang Plain from 1992 to 2012. This is most likely due to the conversion of natural land-use types to croplands (Figure 2c).

4.3. SOC Storage Changes

According to the results, the SOC storage in the top 30 cm decreased in both paddy fields and dry farmlands across the Sanjiang Plain. This decrease was also observed by earlier studies in the northeastern part of China. In Heilongjiang, the total SOC storage of croplands decreased by 11.3% and 19.1% from 1981 to 2011 in Lindian and Hailun, respectively [55], whereas, in China, it increased with exception of Northeast China [43]. A declining trend was also found in Europe, including Finland [7], England and Wales [59].
Our study indicates that the SOC storage in the Sanjiang Plain’s croplands lost 20 Tg C in the top 30 cm during the period of 1992–2012. This implies that carbon inputs from plant production were less than outputs from microbial decomposition [60]. According to previous experimental studies, an increase of SOC decomposition was due to higher temperatures. The temperature rose steadily with an average increase rate of 0.03 °C ·year−1 in the Sanjiang Plain [22], resulting in more carbon release from soils. In addition, agricultural management reduced carbon inputs to soils, and water loss and soil erosion also induced large SOC loss [43]. In regards to the change of SOC storage in the top meter, 70 Tg·C was gained over the period of 1992–2012. This gain may be because cropland area expansion was more than the loss of SOCD.

5. Conclusions

Observed changes of SOC were estimated using remote sensing and geographic information systems. Our results show that the area of croplands increased by 21.11% (10,600.68 km2), while 13,959.43 km2 dry farmlands was converted into paddy fields from 1992 to 2012 in the Sanjiang Plain. Though the mean SOCD of croplands decreased from 1992 to 2012, the SOC storage in Sanjiang Plain’s croplands in the upper meter was estimated to have increased 70 Tg·C (1220 to 1290), which was attributed to the increasing area of croplands. The SOCD of paddy fields was greater and decreased more slowly than that of dry farmlands from 1992 to 2012. The conversion between dry farmlands and paddy fields and the reclamation from natural land-use types have significantly impacted the spatio-temporal pattern of SOCD in the Sanjiang Plain. The regions of higher and lower SOCD values have moved from the south and southeast to northeast and westward, respectively, which is almost consistent to the movement direction of centroids for paddy fields and dry farmlands in the Sanjiang Plain, respectively. SOC storage of dry farmlands and paddy fields decreased and increased by 17.5 Tg·year−1 and 21.0 Tg·C·year−1 from 1992 to 2012, respectively. These findings contribute to supporting the estimate of SOCD in region scale and farmland ecosystem.

Acknowledgments

This study was jointly supported by the National Key Research and Development Project (No. 2016YFA0602301); the Outstanding Young Scientist Foundation of Institute of Northeast Geography and Agroecology (IGA), Chinese Academy of Sciences (No. Y5H1061001); the Program Founding from IGA (IGA-135-05); and the National Natural Science Foundation of China (No. 41671219 and 41471148). We are very grateful to those who participated in the field soil surveys.

Author Contributions

Weidong Man, Hao Yu, Dehua Mao, Chunying Ren, Lin Li and Zongming Wang conceived and designed the experiments; Weidong Man and Hao Yu performed the experiments; Weidong Man and Hao Yu analyzed the data; Mingyue Liu, Mingming Jia, Zhenghong Miao, Chunyan Lu and Huiying Li contributed reagents/materials/analysis tools; and Weidong Man, Hao Yu, Dehua Mao, and Lin Li wrote the paper.

Conflicts of Interest

The authors declare no conflict of interest.

References

  1. Johnson, D.W.; Todd, D.E.; Trettin, C.F.; Sedinger, J.S. Soil carbon and nitrogen changes in forests of walker branch watershed, 1972 to 2004. Soil Sci. Soc. Am. J. 2007, 71, 1639–1646. [Google Scholar] [CrossRef]
  2. Yang, Y.H.; Fang, J.Y.; Ma, W.H.; Smith, P.; Mohammat, A.; Wang, S.P.; Wang, W. Soil carbon stock and its changes in northern China’s grasslands from 1980s to 2000s. Glob. Chang. Biol. 2010, 16, 3036–3047. [Google Scholar] [CrossRef]
  3. Davidson, E.A.; Janssens, I.A. Temperature sensitivity of soil carbon decomposition and feedbacks to climate change. Nature 2006, 440, 165–173. [Google Scholar] [CrossRef] [PubMed]
  4. Mao, D.H.; Wang, Z.M.; Li, L.; Miao, Z.H.; Ma, W.H.; Song, C.C.; Ren, C.Y.; Jia, M.M. Soil organic carbon in the Sanjiang Plain of China: Storage, distribution and controlling factors. Biogeosciences 2015, 12, 1635–1645. [Google Scholar] [CrossRef]
  5. Trumbore, S.E.; Czimczik, C.I. Geology. An uncertain future for soil carbon. Science 2008, 321, 1455–1456. [Google Scholar] [CrossRef] [PubMed]
  6. Lal, R. Soil carbon sequestration impacts on global climate change and food security. Science 2004, 304, 1623–1627. [Google Scholar] [CrossRef] [PubMed]
  7. Heikkinen, J.; Ketoja, E.; Nuutinen, V.; Regina, K. Declining trend of carbon in Finnish cropland soils in 1974–2009. Glob. Chang. Biol. 2013, 19, 1456–1469. [Google Scholar] [CrossRef] [PubMed]
  8. Mao, D.H.; Wang, Z.M.; Wu, C.S.; Zhang, C.H.; Ren, C.Y. Topsoil carbon stock dynamics in the Songnen Plain of Northeast China from 1980 to 2010. Fresenius Environ. Bull. 2014, 23, 531–539. [Google Scholar]
  9. Wu, B.F.; Yuan, Q.Z.; Yan, C.Z.; Wang, Z.M.; Yu, X.F.; Li, A.N.; Ma, R.H.; Huang, J.L.; Chen, J.S.; Chang, C.; et al. Land cover changes of China from 2000 to 2010. Quat. Sci. 2014, 34, 723–731. [Google Scholar]
  10. Qin, Z.C.; Huang, Y.; Zhuang, Q.L. Soil organic carbon sequestration potential of cropland in China. Glob. Biogeochem. Cycles 2013, 27, 711–722. [Google Scholar] [CrossRef]
  11. Lal, R. Soil carbon sequestration in China through agricultural intensification, and restoration of degraded and desertified ecosystems. Land Degrad. Dev. 2002, 13, 469–478. [Google Scholar] [CrossRef]
  12. Jobbagy, E.G.; Jackson, R.B. The vertical distribution of soil organic carbon and its relation to climate and vegetation. Ecol. Appl. 2000, 10, 423–436. [Google Scholar] [CrossRef]
  13. He, C.F.; Wang, S.Q.; Xu, J.; Zhou, C.H. Using remote sensing to estimate the change of carbon storage: A case study in the estuary of Yellow River delta. Int. J. Remote Sens. 2002, 23, 1565–1580. [Google Scholar] [CrossRef]
  14. Yu, J.; Wang, Y.; Li, Y.; Dong, H.; Zhou, D.; Han, G.; Wu, H.; Wang, G.; Mao, P.; Gao, Y. Soil organic carbon storage changes in coastal wetlands of the modern Yellow River Delta from 2000 to 2009. Biogeosciences 2012, 9, 2325–2331. [Google Scholar] [CrossRef]
  15. De Moraes, J.F.L.; Seyler, F.; Cerri, C.C.; Volkoff, B. Land cover mapping and carbon pools estimates in Rondonia, Brazil. Int. J. Remote Sens. 1998, 19, 921–934. [Google Scholar] [CrossRef]
  16. Wang, S.Q.; Tian, H.Q.; Liu, J.Y.; Zhuang, D.F.; Zhang, S.W.; Hu, W.Y. Characterization of changes in land cover and carbon storage in Northeastern China: An analysis based on Landsat TM data. Sci. China Life Sci. 2002, 45, 40–47. [Google Scholar]
  17. Zhang, Y.; Linlin, X.; Weining, X. Analyzing spatial patterns of urban carbon metabolism: A case study in Beijing, China. Landsc. Urban Plan. 2014, 130, 184–200. [Google Scholar] [CrossRef]
  18. Pascucci, S.; Casa, R.; Belviso, C.; Palombo, A.; Pignatti, S.; Castaldi, F. Estimation of soil organic carbon from airborne hyperspectral thermal infrared data: A case study. Eur. J. Soil Sci. 2014, 65, 865–875. [Google Scholar] [CrossRef]
  19. Tiwari, S.K.; Saha, S.K.; Kumar, S. Prediction modeling and mapping of soil carbon content using artificial neural network, hyperspectral satellite data and field spectroscopy. Adv. Remote Sens. 2015, 4, 63–72. [Google Scholar] [CrossRef]
  20. Ferraz, A.; Saatchi, S.; Mallet, C.; Jacquemoud, S.; Gonçalves, G.; Silva, C.; Soares, P.; Tomé, M.; Pereira, L. Airborne Lidar Estimation of Aboveground Forest Biomass in the Absence of Field Inventory. Remote Sens. 2016, 8, 653. [Google Scholar] [CrossRef]
  21. Kumar, S. Soil organic carbon mapping at field and regional scales using GIS and remote sensing applications. Adv. Crop Sci. Technol. 2013. [Google Scholar] [CrossRef]
  22. Wang, Z.M.; Mao, D.H.; Li, L.; Jia, M.M.; Dong, Z.Y.; Miao, Z.H.; Ren, C.Y.; Song, C.C. Quantifying changes in multiple ecosystem services during 1992–2012 in the Sanjiang Plain of China. Sci. Total Environ. 2015, 514, 119–130. [Google Scholar] [CrossRef] [PubMed]
  23. Man, W.D.; Wang, Z.M.; Liu, M.Y.; Lu, C.Y.; Jia, M.M.; Mao, D.H.; Ren, C.Y. Spatio-temporal dynamics analysis of cropland in Northeast China during 1990–2013 based on remote sensing. Trans. Chin. Soc. Agric. Eng. 2016, 32, 1–10. [Google Scholar]
  24. Ke, Y.H.; Quackenbush, L.J.; Im, J. Synergistic use of QuickBird multispectral imagery and LIDAR data for object-based forest species classification. Remote Sens. Environ. 2010, 114, 1141–1154. [Google Scholar] [CrossRef]
  25. Jia, M.M.; Wang, Z.M.; Li, L.; Song, K.S.; Ren, C.Y.; Liu, B.; Mao, D.H. Mapping China’s mangroves based on an object-oriented classification of Landsat imagery. Wetlands 2014, 34, 277–283. [Google Scholar] [CrossRef]
  26. Mui, A.; He, Y.H.; Weng, Q.H. An object-based approach to delineate wetlands across landscapes of varied disturbance with high spatial resolution satellite imagery. ISPRS J. Photogramm. Remote Sens. 2015, 109, 30–46. [Google Scholar] [CrossRef]
  27. Aguirre-Gutiérrez, J.; Seijmonsbergen, A.C.; Duivenvoorden, J.F. Optimizing land cover classification accuracy for change detection, a combined pixel-based and object-based approach in a mountainous area in Mexico. Appl. Geogr. 2012, 34, 29–37. [Google Scholar] [CrossRef]
  28. Ehman, J.L.; Fan, W.H.; Randolph, J.C.; Southworth, J.; Welch, N.T. An integrated GIS and modeling approach for assessing the transient response of forests of the southern Great Lakes region to a doubled CO2 climate. For. Ecol. Manag. 2002, 155, 237–255. [Google Scholar] [CrossRef]
  29. Jia, M.M.; Wang, Z.M.; Zhang, Y.Z.; Ren, C.Y.; Song, K.S. Landsat-Based Estimation of Mangrove Forest Loss and Restoration in Guangxi Province, China, Influenced by Human and Natural Factors. IEEE J. Sel. Top. Appl. Earth Obs. Remote Sens. 2015, 8, 311–323. [Google Scholar] [CrossRef]
  30. Miao, Z.H.; Wang, Z.M.; Song, K.S.; Zhang, C.H.; Ren, C.Y. Spatial and temporal variability of Soil organic carbon in the Corn Belt of Northeastern China, 1980s–2005: A case study in four counties. Commun. Soil Sci. Plant Anal. 2014, 45, 163–176. [Google Scholar] [CrossRef]
  31. Mann, L.K. Changes in soil carbon storage after cultivation. Soil Sci. 1986, 142, 279–288. [Google Scholar] [CrossRef]
  32. McGrath, D.; Zhang, C.S. Spatial distribution of soil organic carbon concentrations in grassland of Ireland. Appl. Geochem. 2003, 18, 1629–1639. [Google Scholar] [CrossRef]
  33. Wang, Z.M.; Zhang, B.; Song, K.S.; Liu, D.W.; Ren, C.Y. Spatial Variability of Soil Organic Carbon Under Maize Monoculture in the Song-Nen Plain, Northeast China. Pedosphere 2010, 20, 80–89. [Google Scholar] [CrossRef]
  34. Webster, R.; Oliver, M.A. Geostatistics for Environmental Scientists, 2nd ed.; John Wiley & Sons: Chichester, UK, 2007. [Google Scholar]
  35. Hu, K.; Li, H.; Li, B.; Huang, Y. Spatial and temporal patterns of soil organic matter in the urban–rural transition zone of Beijing. Geoderma 2007, 141, 302–310. [Google Scholar] [CrossRef]
  36. Zhao, B.; Li, Z.; Li, P.; Xu, G.; Gao, H.; Cheng, Y.; Chang, E.; Yuan, S.; Zhang, Y.; Feng, Z. Spatial distribution of soil organic carbon and its influencing factors under the condition of ecological construction in a hilly-gully watershed of the Loess Plateau, China. Geoderma 2017, 296, 10–17. [Google Scholar] [CrossRef]
  37. Wang, Z.M.; Song, K.S.; Liu, D.W.; Zhang, B.; Zhang, S.Q.; Li, F.; Ren, C.Y.; Jin, C.; Yang, T.; Zhang, C.H. Process of Land Conversion from Marsh into Cropland in the Sanjiang Plain during 1954–2005. Wetl. Sci. 2009, 7, 208–217. [Google Scholar]
  38. Gao, J.; Liu, Y.S. Climate warming and land use change in Heilongjiang Province, Northeast China. Appl. Geogr. 2011, 31, 476–482. [Google Scholar] [CrossRef]
  39. Li, H.W.; Tian, Z.J.; Yang, W.; Li, X. Analysis of spatial distribution of agricultural meteorological conditions in the Sanjiang Plain during nearly 50 years. J. Anhui Agric. Sci. 2013, 41, 4493–4496. [Google Scholar]
  40. Holmes, K.W.; Chadwick, O.A.; Kyriakidis, P.C.; de Filho, E.P.S.; Soares, J.V.; Roberts, D.A. Large-area spatially explicit estimates of tropical soil carbon stocks and response to land-cover change. Glob. Biogeochem. Cycles 2006, 20, 2981–2990. [Google Scholar] [CrossRef]
  41. Frogbrook, Z.L.; Oliver, M.A. Comparing the spatial predictions of soil organic matter determined by two laboratory methods. Soil Use Manag. 2006, 17, 235–244. [Google Scholar] [CrossRef]
  42. Song, G.H.; Li, L.Q.; Pan, G.X.; Zhang, Q. Topsoil organic carbon storage of China and its loss by cultivation. Biogeochemistry 2005, 74, 47–62. [Google Scholar] [CrossRef]
  43. Huang, Y.; Sun, W.J. Changes in topsoil organic carbon of croplands in mainland China over the last two decades. Chin. Sci. Bull. 2006, 51, 1785–1803. [Google Scholar] [CrossRef]
  44. Pan, G.X.; Li, L.Q.; Wu, L.S.; Zhang, X.H. Storage and sequestration potential of topsoil organic carbon in China’s paddy soils. Glob. Chang. Biol. 2004, 10, 79–92. [Google Scholar] [CrossRef]
  45. Liu, J.Y.; Liu, M.L.; Tian, H.Q.; Zhuang, D.F.; Zhang, Z.X.; Zhang, W.; Tang, X.M.; Deng, X.Z. Storages of soil organic carbon and nitrogen and land use changes in China: 1990–2000. Acta Geogr. Sin. 2004, 59, 483–496. [Google Scholar]
  46. Post, W.M.; Emanuel, W.R.; Zinke, P.J.; Stangenberger, A.G. Soil carbon pools and world life zones. Nature 1982, 298, 156–159. [Google Scholar] [CrossRef]
  47. Taggart, M.; Heitman, J.L.; Shi, W.; Vepraskas, M. Temperature and Water Content Effects on Carbon Mineralization for Sapric Soil Material. Wetlands 2012, 32, 939–944. [Google Scholar] [CrossRef]
  48. Six, J.; Elliott, E.T.; Paustian, K. Soil macroaggregate turnover and microaggregate formation: A mechanism for C sequestration under no-tillage agriculture. Soil Biol. Biochem. 2000, 32, 2099–2103. [Google Scholar] [CrossRef]
  49. Tang, H.J.; Qiu, J.J.; Van Ranst, E.; Li, C.S. Estimations of soil organic carbon storage in cropland of China based on DNDC model. Geoderma 2006, 134, 200–206. [Google Scholar] [CrossRef]
  50. Lu, F.; Wang, X.K.; Han, B.; Ouyang, Z.Y.; Duan, X.N.; Zheng, H.; Miao, H. Soil carbon sequestrations by nitrogen fertilizer application, straw return and no-tillage in China’s cropland. Glob. Chang. Biol. 2009, 15, 281–305. [Google Scholar] [CrossRef]
  51. Chaplot, V.; Bouahom, B.; Valentin, C. Soil organic carbon stocks in Laos: Spatial variations and controlling factors. Glob. Chang. Biol. 2010, 16, 1380–1393. [Google Scholar] [CrossRef]
  52. Zhao, Q.G.; Li, Z.; Xia, Y.F. Organic carbon storage in soils of southeast China. Nutr. Cycl. Agroecosyst. 1997, 49, 229–234. [Google Scholar]
  53. Meersmans, J.; van Wesemael, B.; Goidts, E.; van Molle, M.; De Baets, S.; De Ridder, F. Spatial analysis of soil organic carbon evolution in Belgian croplands and grasslands, 1960–2006. Glob. Chang. Biol. 2011, 17, 466–479. [Google Scholar] [CrossRef]
  54. Pan, G.X.; Xu, X.W.; Smith, P.; Pan, W.N.; Lal, R. An increase in topsoil SOC stock of China’s croplands between 1985 and 2006 revealed by soil monitoring. Agric. Ecosyst. Environ. 2010, 136, 133–138. [Google Scholar] [CrossRef]
  55. Li, L.J.; Burger, M.; Du, S.L.; Zou, W.X.; You, M.Y.; Hao, X.X.; Lu, X.C.; Zheng, L.; Han, X.Z. Change in soil organic carbon between 1981 and 2011 in croplands of Heilongjiang Province, northeast China. J. Sci. Food Agric. 2016, 96, 1275–1283. [Google Scholar] [CrossRef] [PubMed]
  56. Dossou-Yovo, E.R.; Brüggemann, N.; Ampofo, E.; Igue, A.M.; Jesse, N.; Huat, J.; Agbossou, E.K. Combining no-tillage, rice straw mulch and nitrogen fertilizer application to increase the soil carbon balance of upland rice field in northern Benin. Soil Tillage Res. 2016, 163, 152–159. [Google Scholar] [CrossRef]
  57. Ussiri, D.A.N.; Lal, R. Long-term tillage effects on soil carbon storage and carbon dioxide emissions in continuous corn cropping system from an alfisol in Ohio. Soil Tillage Res. 2009, 104, 39–47. [Google Scholar] [CrossRef]
  58. Ogle, S.M.; Breidt, F.J.; Paustian, K. Agricultural management impacts on soil organic carbon storage under moist and dry climatic conditions of temperate and tropical regions. Biogeochemistry 2005, 72, 87–121. [Google Scholar] [CrossRef]
  59. Bellamy, P.H.; Loveland, P.J.; Bradley, R.I.; Lark, R.M.; Kirk, G.J. Carbon losses from all soils across England and Wales 1978–2003. Nature 2005, 437, 245–248. [Google Scholar] [CrossRef] [PubMed]
  60. Schlesinger, W.H. Carbon Balance in Terrestrial Detritus. Ann. Rev. Ecol. Syst. 1977, 8, 51–81. [Google Scholar] [CrossRef]
Figure 1. Location of the Sanjiang Plain, study region and sample sites.
Sustainability 09 00563 g001
Figure 2. Classified cropland map in 1992 (a) and 2012 (b) and cropland change from 1992 to 2012 (c) in the Sanjiang Plain.
Sustainability 09 00563 g002
Figure 3. Area-weight centroids movement for dry farmlands and paddy fields from 1992 to 2012.
Sustainability 09 00563 g003
Figure 4. Spatial distribution of predicted the soil organic carbon density (SOCD) in croplands at different depths in 1992: (a) SOCD at 0–30 cm; (b) SOCD at 30–60 cm; (c) SOCD at 60–100 cm; and (d) SOCD at 0–100 cm.
Sustainability 09 00563 g004
Figure 5. Spatial distribution of predicted the soil organic carbon density (SOCD) in croplands at different depths in 2012: (a) SOCD at 0–30 cm; (b) SOCD at 30–60 cm; (c) SOCD at 60–100 cm; and (d) SOCD at 0–100 cm.
Sustainability 09 00563 g005
Table 1. The semivariogram models for SOC density (SOCD) in the Sanjiang Plain.
YearDepth (cm)ModelC0C0 + C1Range (m)GDMERMSSE
19920–30Exponential0.0720.45524,30015.8240.1731.169
30–60Exponential0.1930.73522,80026.2590.1961.016
60–100Exponential0.5321.065732,30049.953−0.0291.383
0–100Exponential0.1240.41936,00029.485−0.0011.084
20120–30Exponential0.0300.30524,9009.7250.0111.013
30–60Exponential0.0470.40829,40011.5200.0521.029
60–100Exponential0.0480.35428,80013.539−0.0091.045
0–100Exponential0.0300.23045,00013.0430.0960.948
Note: C0: nugget variance; C1: structural variance; GD: degree of spatial dependence; ME: mean prediction errors; RMSSE: root-mean-square standardized prediction errors.
Table 2. Summary of cropland classification accuracies for 1992 and 2012.
19922012
Producer’s AccuracyUser’s AccuracyProducer’s AccuracyUser’s Accuracy
Dry farmlands0.970.960.940.94
Paddy fields0.890.940.880.96
Other land-cover types0.950.920.950.90
Overall accuracy94%93%
Kappa coefficient91%91%
Table 3. Descriptive statistics of soil bulk density (BD) in the Sanjiang Plain.
YearDepth (cm)Mean (g/cm3)SDMinimum (g/cm3)Maximum (g/cm3)CV (%)
19920–301.13aA0.240.141.7920.96
30–601.32bA0.190.321.8414.70
60–1001.40cA0.130.351.889.41
20120–301.19aB0.290.061.7924.54
30–601.33bB0.260.131.7519.28
60–1001.34bA0.250.351.8018.63
Note: CV: coefficient of variation. Lower letters (a, b and c) indicate significant difference at p < 0.05 using the Duncun method at different depths in the same year, and capital letters (A and B) indicate significant difference at p < 0.05 by independent-samples T test at same depths between 1992 and 2012.
Table 4. The soil organic carbon density (SOCD, kg·C·m−2) and storage (Pg·C) of soil groups in croplands, estimated from datasets in 1992 and 2012.
TypeDepth (cm)19922012
Area (km2)SOCD (kg·C·m−2)SOC Storage (Pg·C)Area (km2)SOCD (kg·C·m−2)SOC Storage (Pg·C)
Dry farmland0–30 12.63 ± 4.84A0.56 ± 0.21 9.76 ± 3.15B0.35 ± 0.11
0–6044,292.91 20.10 ± 7.36A0.89 ± 0.3335,481.1115.46 ± 3.75B0.55 ± 0.13
0–100 24.35 ± 7.56a1.08 ± 0.33 20.63 ± 4.13b0.73 ± 0.15
Paddy field0–30 11.12 ± 4.03a0.07 ± 0.03 10.22 ± 2.95a0.26 ± 0.08
0–606447.6917.92 ± 5.89a0.12 ± 0.0425,860.1716.55 ± 4.34a0.43 ± 0.11
0–100 22.25 ± 6.39a0.14 ± 0.04 21.51 ± 4.86a0.56 ± 0.13
Cropland0–30 12.44 ± 4.77A0.63 ± 0.24 9.95 ± 3.07B0.61 ± 0.19
0–6050,740.6019.82 ± 7.23a1.01 ± 0.3761,341.2815.92 ± 4.05b0.98 ± 0.25
0–100 24.08 ± 7.45a1.22 ± 0.38 21.00 ± 4.47b1.29 ± 0.27
Note: Data are expressed as the mean ± SD. Lower letters (a and b) and capital letters (A and B) in the same row indicate significant difference at p < 0.05 and p < 0.01 between 1992 and 2012, respectively.

