Abstract
Xinjiang’s industrial sector accounted for more than 80% of the total energy-related carbon emissions. A further understanding of each industrial sub-sector’s carbon intensity is very necessary to make differentiated policies and measures. This paper applied index decomposition analysis and attribution analysis to examine the influencing factors and each sub-sector’s contributions to the changes in influencing factors. The results demonstrated the following: (1) energy intensity effect contributed most to the decreases in industrial carbon intensity, and mining and quarrying, foods and tobacco, and other manufactures were the most representative industrial sub-sectors; (2) energy structure effect showed a positive effect on industrial carbon intensity, but its effect was not significant, and fuel processing, smelting and pressing of metals, metal products, and textile were mainly responsible for the increases in energy structure effect; (3) industrial structure effect showed significant fluctuations, but its accumulative effect promoted the increases in industrial carbon intensity, and fuel processing, mining and quarrying, and textiles were the main sub-sectors, which exerted negative effects on the decreases in industrial structure effect; (4) fuel processing, smelting and pressing of metals, and mining and quarrying significantly influenced these three decomposed factors from 2000 to 2014; (5) since 2009, energy-intensive sub-sectors increased rapidly, and the energy structure was not optimized, while attention was not paid to controlling the energy efficiency, thus all decomposed factors promoted the increases in industrial carbon intensity; and (6) mining and quarrying, textiles, fuel processing, and transport equipment were primarily responsible for the increases in energy structure effect. Fuel processing, chemicals, and smelting and pressing of metals were primarily responsible for the increases in energy intensity effect. Fuel processing, chemicals, smelting and pressing of metals, and other manufactures were primarily responsible for the increases in industrial structure effect.
1. Introduction
Global warming has become a recognized environmental problem in the world, and fossil energy-related carbon emissions are the main greenhouse gases [1]. China has become one of the biggest emitters of greenhouse gases. Meanwhile, high-speed economic growth, industrialization, and urbanization all stimulate the demand for energy in the future. In addition, as the primary energy, coal’s dominating role will not change in the foreseeable future [2,3]. Under such a circumstances, attention has been paid to carbon emissions changes in China by the international community [4,5]. The Chinese government promised to reduce the carbon intensity by 40%–50% between 2005 and 2020 at Copenhagen conference [6]. In 2014, China and the United States issued a joint statement on climate changes, and China promised to achieve its carbon emissions peak before 2030 [7]. In the ‘Thirteenth Five Year Plan’ (2016–2020), China planned that the carbon emissions of some key industries, such as iron and steel, should be effectively controlled, and the developed regions were supported to take the lead in achieving the carbon emissions peak [8]. These goals are great challenges for China. Fulfilling the goals without negatively influencing the socio-economic development highlights the importance of research on carbon emissions.
The current studies on carbon emissions focus on the estimation and calculation of carbon emissions [9,10,11,12], influencing factors and driving mechanisms of carbon emissions [13,14,15,16,17], scenario analysis and forecast of carbon emissions [18,19,20,21], carbon emissions reduction mechanisms and policy implications [22,23,24]. Analysis of the influencing factors and driving mechanisms of carbon emissions is indispensable to conduct scenario analysis and make polices for carbon emissions reduction [25]. Therefore, the studies on decomposing carbon emissions changes have been increasing [13]. According to previous studies, primarily three methods were applied to decompose the carbon emission changes. They are index decomposition analysis (IDA), structural decomposition analysis (SDA), and production-theoretical decomposition analysis (PDA) [13,26,27]. IDA is an effective tool to conduct the decomposition analysis, and it primarily contains two methods, i.e., the Laspeyres index method and the Divisia index method. Compared with the other two methods, IDA is also more widely applied. The SDA method applied the input-output framework to decompose carbon emission changes in specific years; therefore, the dependence on the input-output tables restricts its extensive use in empirical analyses. Nevertheless, some ideas related to the IDA method may be helpful to the SDA method [28].The applications of the PDA method have also been increasing because of the increasing studies on energy and environmental area using data envelopment analysis, production theory, and distance functions. An increasing number of studies applied the Laspeyres index [29,30,31,32], Divisia index [33,34,35], SDA [36,37,38], and PDA [39,40,41] to decompose carbon emissions changes in China because China has become one of the biggest emitters of carbon emissions. China’s industrial carbon emissions had also been analyzed using these methods. For example, Liu et al. (2007) analyzed China’s 36 industrial sectors’ carbon emissions changes over 1998–2005 and found that industrial activity and energy intensity contributed most to the changes of industrial sectors’ carbon emissions [42]. Yan and Fang (2015) analyzed the decomposed factors of manufacturing carbon emissions in China during 1993–2011 and indicated that economic scale contributed most to the increases in carbon emissions and that energy intensity contributed most to the decreases [43].
Overall, although most studies on industrial carbon emissions have obtained the influencing factors, these studies, further exploring the contributions of each industrial sub-sector to each influencing factor, are still scarce. In 2012, Choi and Ang (2012) [44] proposed the attribution analysis method to estimate each sub-sector’s contribution to the changes in each influencing factor. Some scholars regarded the attribution analysis as a perfect extension of the traditional index decomposition analysis [45]. Since 2012, attribution analysis had been applied by some scholars [46,47,48,49,50,51], but these studies applied the attribution analysis to analyze the carbon emissions changes at the national level or international organizations level, i.e., China [46,47,52], the European Union [48,50], Korea [49], and Mexico [51]. Therefore, the studies, applying the attribution analysis to analyze carbon emissions changes at the provincial level, are also relatively insufficient.
In particular, the stages of economic growth, economic structure and energy structure are vary in different regions; therefore there are significant differences in energy consumption and energy-related carbon emissions across the different provinces within China [53,54], and thus the task of carbon reduction is usually allocated through administrative regions [55]. Xinjiang is a relatively less developed region in China, but it is developing rapidly because of some strategic opportunities such as ‘Western Development’, and ‘the Belt and Road’. As an important energy base, energy resources contributed greatly to its economic development. Meanwhile, its environment began to face serious challenges. Therefore, slowing down the carbon emissions without negatively influencing the socio-economic development is the biggest challenge faced by Xinjiang. Some scholars had paid attention to Xinjiang’s carbon emissions, e.g., Wang and Wang (2015) used the input-output structural decomposition analysis to uncover the influencing factors of Xinjiang’s carbon emissions and found that per capita GDP contributed most to the increases in carbon emission [56]; Wang et al. measured the influencing factors of Xinjiang’s carbon emissions by means of an extended STIRPAT model based on an IPAT identity and indicated that economic growth and fixed assets investment contributed most to the increases in carbon emissions after 2001, and carbon intensity showed a significant negative effect [25]. The previous studies did not pay attention to the sub-sectors’ contributions to the driving factors. This paper applied the attribution analysis to analyze the individual industrial sub-sectors’ contribution to the driving factors, which can help make differentiated recommendations.
From 2000 to 2014, Xinjiang’s industrial sector accounted for more than 80% of the energy-related carbon emissions, and the proportion shows an increasing trend. Thus, the industrial sector is the key sector to slow down the carbon emissions. This study aimed to firstly apply the Sato-Vartia Logarithmic Mean Divisia Index (LMDI) method to analyze the industrial carbon intensity. Then, based on the decomposition results, attribution analysis was applied to exploring the contributions of each industrial sub-sector to each influencing factor. The Sato-Vartia LMDI method, attribution analysis method and the estimation approach of industrial carbon emissions are shown in section Appendix A. Compared with the results of decomposition analysis and attribution analysis, some recommendations were proposed for Xinjiang.
2. Empirical Analysis
2.1. Sato-Vartia Index Decomposition Analysis
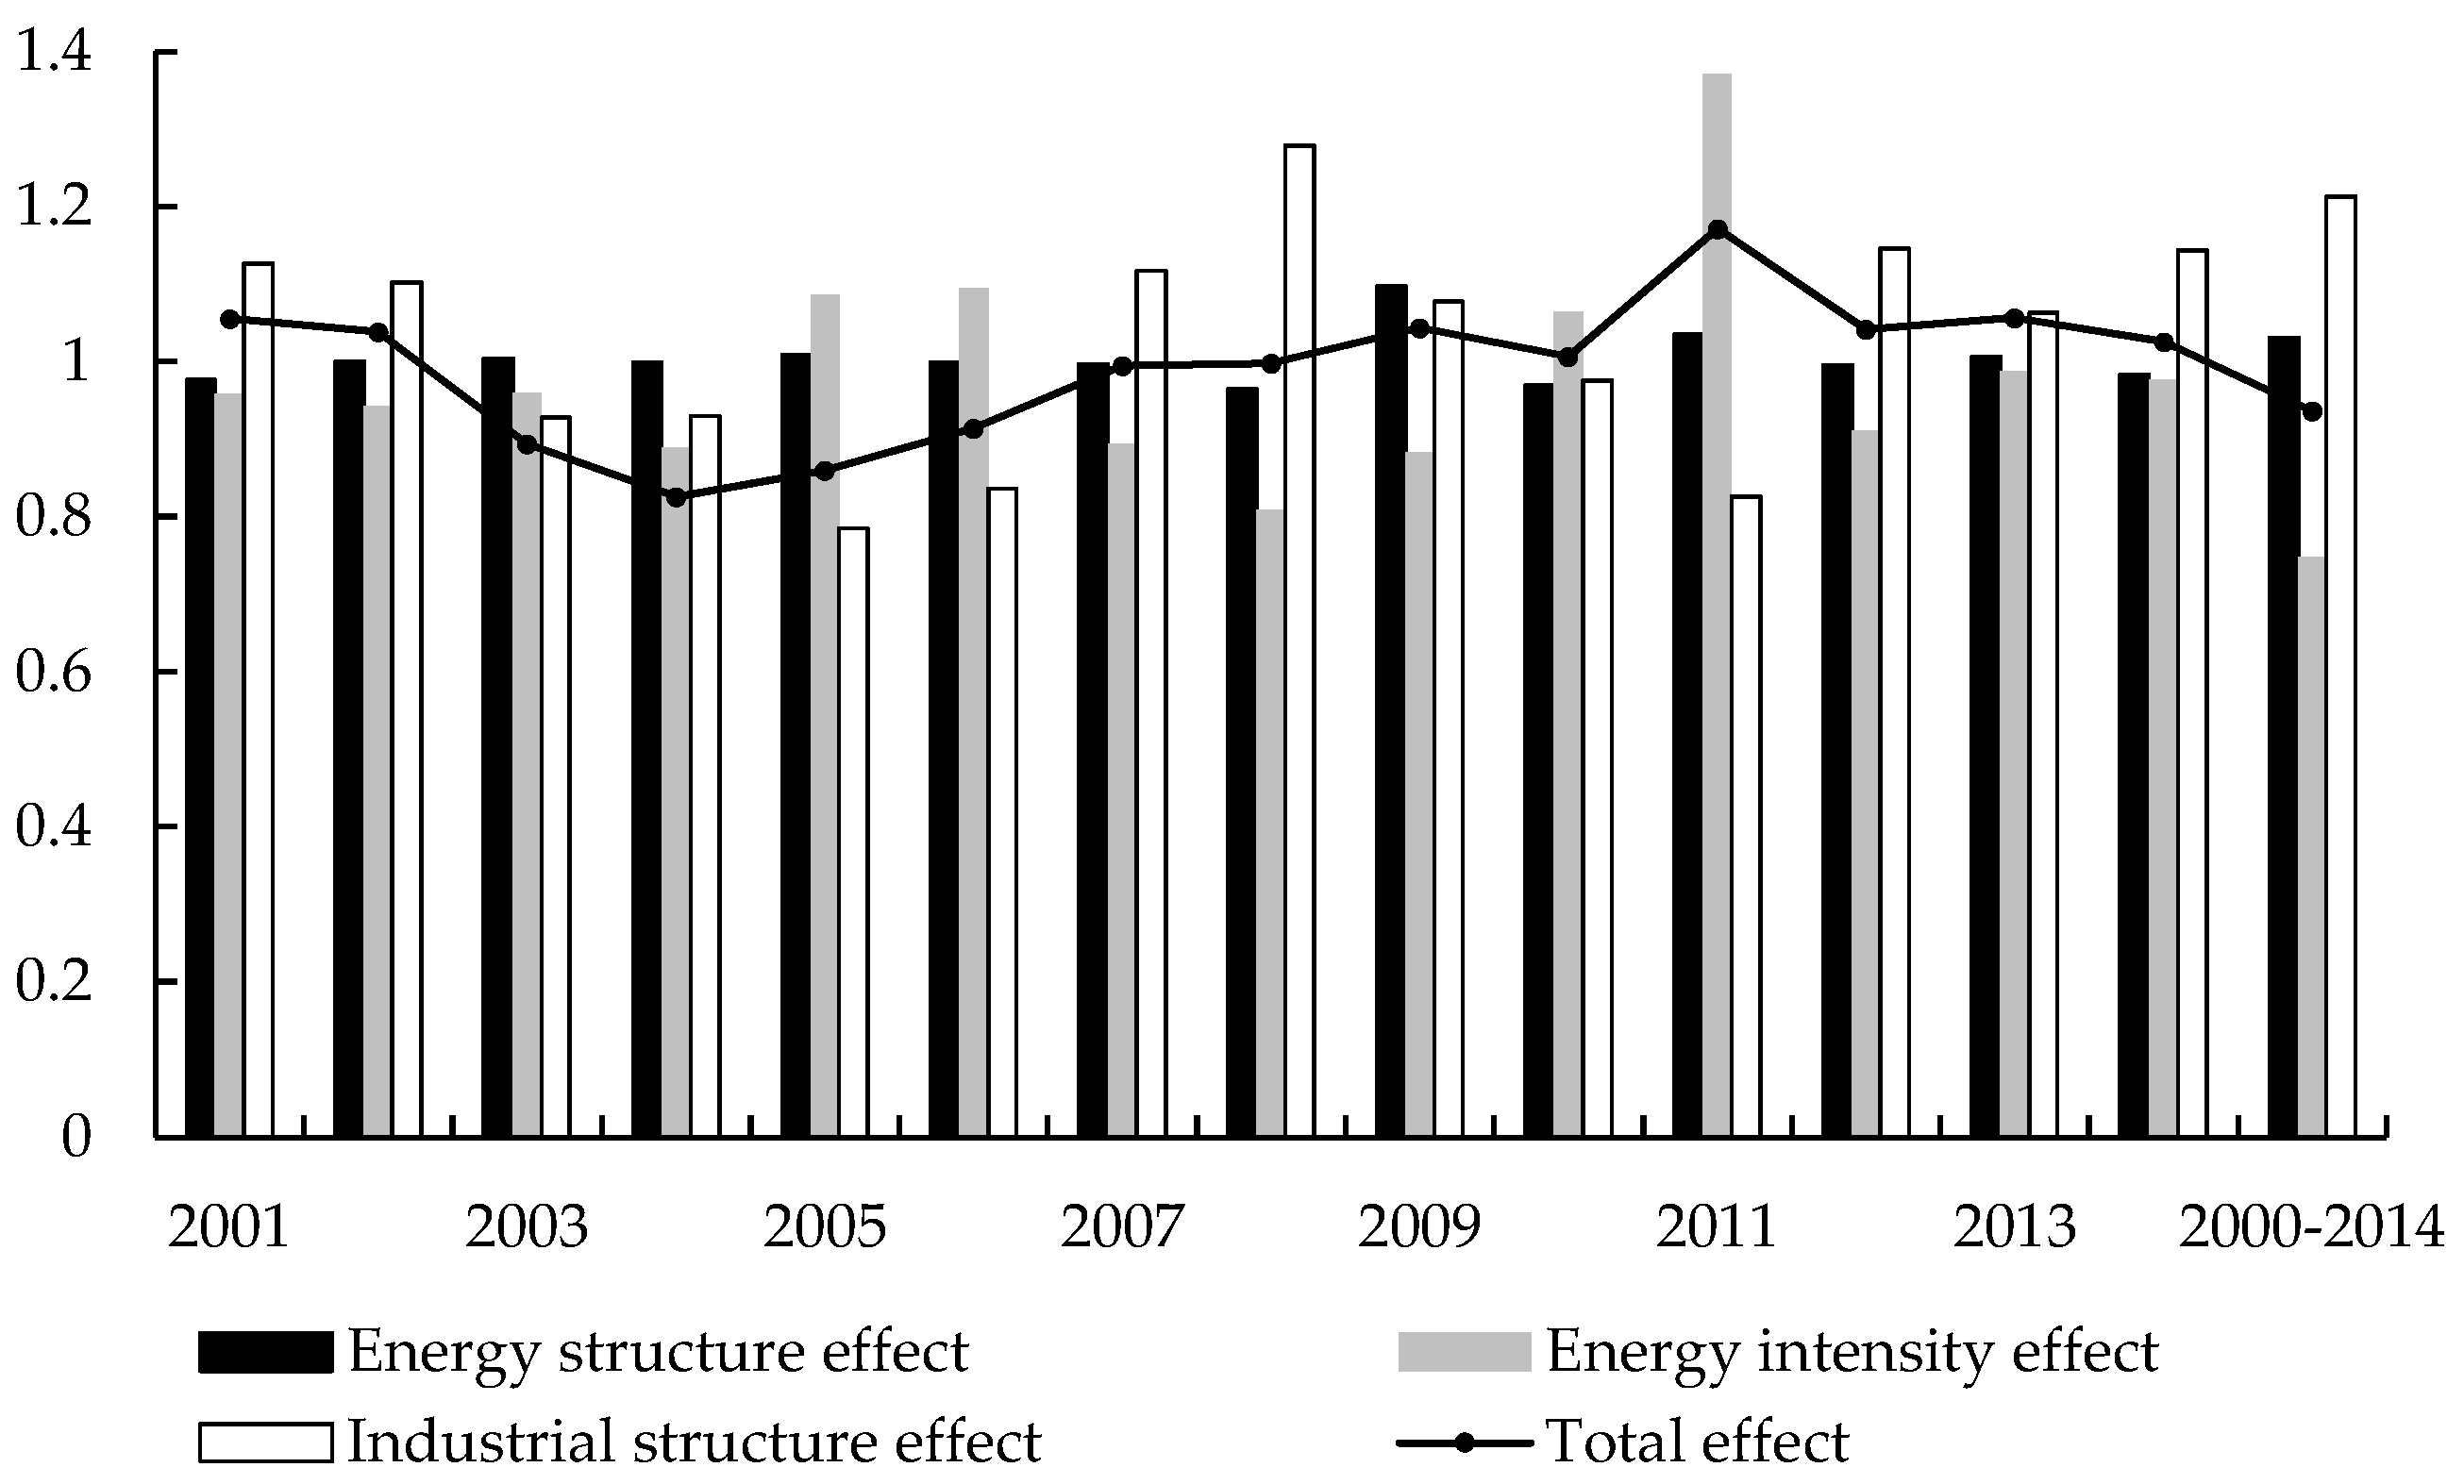
This paper decomposed the industrial carbon intensity changes into the effects of energy structure (Des), energy intensity (Dei) and industrial structure (Dis). A multiplicative Sato-Vartia LMDI method was applied to examine these effects, and the results are shown in Figure 1.
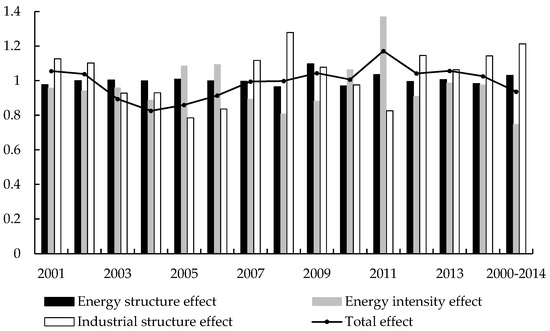
Figure 1.
Sato-Vartia index decomposition analysis of Xinjiang’s industrial carbon intensity changes.
As indicated in Figure 1, Xinjiang’s industrial carbon intensity dropped by only 6.4% from 2000 to 2014. According the accumulative effects of three decomposed factors, the energy intensity mainly exerted a positive effect on decreases in the industrial carbon intensity, and industrial structure and energy structure mainly exerted negative effects. From 2000 to 2014, in most years, energy intensity effects were less than 1, and the accumulative effect of energy intensity was 0.748. It illustrated that the energy intensity was the main driving factor, which caused the decrease in industrial carbon intensity, and the industrial carbon intensity decreased by 25.2% owing to the changes in energy intensity during the study period. The accumulative effect of the industrial structure exceeded 1, and it illustrated that industrial structure exerted a negative effect on the decrease in industrial carbon intensity. Industrial structure changes was the main factor, which hindered the decreasing trend of carbon intensity. Energy structure effect in lowering industrial carbon intensity was not obvious, and its accumulative effect was only 1.031; nevertheless, it also hindered the decrease in industrial carbon intensity.
Compared with the other two decomposed factors, the annual energy structure effect did not influence the carbon intensity obviously. As seen in Figure 1, the fluctuation of energy structure effect was every small, and the values was approximately equal to 1. It illustrated that the impact of energy structure was relatively small during the period of 2000–2014. Xinjiang’s energy supplies were dominated by coal, and coal was also still the main energy source for the industrial sectors. Since 2005, the proportion of coal had also been increasing slowly. Therefore, energy structure was not optimized. The reliance on coal in industrial sectors had caused high carbon emissions in Xinjiang, and it also hindered the decrease in industrial carbon intensity. In the future, optimization of industrial energy structure would exert an important influence on industrial carbon intensity.
The values of energy intensity effect exceed 1 during 2005–2006 and 2010–2011, which meant that the energy intensity negatively influenced the decreases in industrial carbon intensity. However, the energy intensity promoted the decreases in industrial carbon intensity during the other 12 years. It indicated that energy intensity was the most important factor which reduced the industrial carbon intensity. In addition, according to the accumulative effect of each factor, the contributions of energy intensity effect were more than those of energy structure effect and industrial structure effect.
Although the accumulative effect of industrial structure exceed 1, the annual industrial structure effect was not stable. The trend of industrial structure effect showed significant fluctuations. The values of industrial structure effect in 2003–2006 and 2010–2011 were less than 1, and the values exceed 1 during other years. Since the implementation of “Western Development”, Xinjiang’s industrial sectors increased rapidly. Xinjiang had been readjusting its industrial structure for rapid development [57], therefore, the added value ratio between non-energy-intensive industries and energy-intensive industries remained unstable. However, Xinjiang began to be defined as the national energy strategic base from 2010. Based on the rich energy resources, energy-intensive industries increased rapidly in recent years. Therefore, the industrial structure was the main factor that hindered the decrease in Xinjiang’s industrial carbon intensity.
2.2. Attribution Analysis
Attribution analysis was applied to explore the attribution of Xinjiang’s industrial sub-sectors to the changes in each influencing factor, and the results were shown in Figure 2 and Table 1, Table 2 and Table 3.
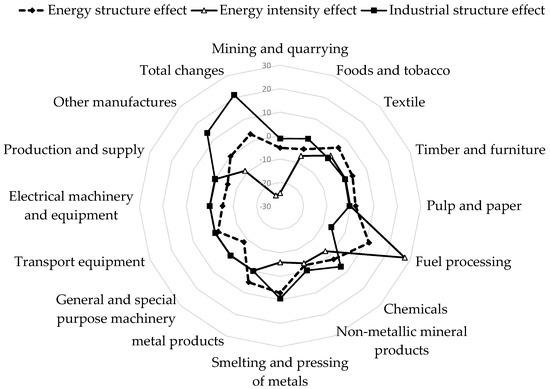
Figure 2.
Multi-period attribution results of energy structure effect, energy intensity effect and industrial structure effect in Xinjiang (base = 2000) (Unit: %).

Table 1.
Single-period attribution results of energy structure effect in Xinjiang (base = previous year) (Unit: %).
Table 2.
Single-period attribution results of energy intensity effect in Xinjiang (base = previous year) (Unit: %).
Table 3.
Single-period attribution results of industrial structure effect in Xinjiang (base = previous year) (Unit: %).
The attribution results of energy structure effect were shown in Figure 2 and Table 1. The multi-period attribution results in Figure 2 indicated that energy structure hindered the decrease in industrial carbon intensity, and the accumulative contribution was 3.19%, which was far less than other two decomposed factors. Fuel processing, smelting and pressing of metals, metal products, and textile were mainly responsible for the increase in energy structure effect. Their accumulative contributions were 10.99%, 7.07%, and 5.17%, respectively. In 2000, these three sub-sectors consumed 12.51% of the total coal, but the proportion became 36.26% in 2014. These three sub-sectors’ increasing coal consumption hindered the decrease in industrial carbon intensity. Additionally, the accumulative contributions of general and special purpose machinery, production and supply, electrical machinery and equipment were −8.23%, −5.80% and −5.46%, and these three sub-sectors were the main contributors in hindering the increases in energy structure effect. According to Table 1, energy structure effect contributed most to the changes in industrial carbon intensity in 2009. Mining and quarrying, textile, transport equipment were primarily responsibility for the sudden increase in energy structure effect. Besides, what needs to be emphasized is that the results of 2002 in Table 1 were relatively smaller, because the results were expressed to a precision of two decimal place, thus all results of 2002 in Table 1 showed 0.00.
The attribution results of energy intensity effect were shown in Figure 2 and Table 2. The accumulative contribution of energy intensity effect was −25.20%, which also meant that energy intensity was the leading contributor to promote the decrease in carbon intensity. Fuel processing, textile, and timber and furniture were the only three sub-sectors which hindered the decrease in energy intensity effect. Compared with other two sub-sectors, fuel processing’s influence was much larger, and it illustrated that fuel processing was the key industrial sub-sector to reduce the energy intensity. The accumulative contributions of other sub-sectors were all negative, and all these sub-sectors promoted the decrease in energy intensity effect. Mining and quarrying, foods and tobacco, and other manufactures were the main contributors to the decrease. According to the single-period attribution results in Table 2, Xinjiang’s industrial energy intensity fell most years, expect for 2005–2006 and 2010–2011, when energy intensity increased significantly. In 2005, 2006 and 2010, the smelting and pressing of metals mainly contributed to the short-term increase in industrial energy intensity, while in 2011, the fuel processing was principally responsible among the various sub-sectors. These two sub-sectors were all belong to energy-intensive industries. This paper compared the growth rates of these two sub-sectors’ industrial output and energy consumption. It observed that the growth rate of each sub-sector’ energy consumption was larger than its corresponding industrial output. Therefore, it illustrated that a sudden increase occurred in production capacities of these two energy-intensive industries, while the energy efficiency was not paid attention to be controlled [46,58].
The attribution results of industrial structure effect were shown in Figure 2 and Table 3. The accumulative contribution of industrial structure effect was 21.21%, which also meant that industrial effect was the main contributor to hinder the decrease in industrial carbon intensity. Smelting and pressing of metals, chemicals, and other manufactures were the main sub-sectors significantly contributing to the result. In contrast, fuel processing, mining and quarrying, and textile were the main sub-sectors which exerted negative effects on industrial structure effect. According to Table 3, the industrial structure effect contributed most to the changes in industrial carbon intensity in 2008. Fuel processing’s contribution was much larger. In 2007, the industrial output of fuel processing was only 0.69 million Yuan, but the industrial output reached 2.19 million Yuan in 2014, therefore, the industrial output grew by 3.17 times. The sudden boom in industrial output of fuel processing promotes the increase in energy consumption. This may be the reason for the sudden increase in the contribution of fuel processing.
3. Discussion
By applying the attribution analysis method, each sub-sector’s contribution to the decomposed factor of Xinjiang’s industrial carbon intensity during 2000–2014 was examined. Fuel processing, smelting and pressing of metals, and mining and quarrying significantly influenced these three decomposed factors. As shown in Figure 2, the values of mining and quarrying’ decomposition factor effects were all negative, which meant that it promoted the decreases in Xinjiang’s carbon intensity. Xinjiang is rich in mineral resources, which helps mining and quarrying become the main industrial sub-sector. The mining and quarrying’s production capacities had been growing, meanwhile its energy efficiency had also been improved. Besides, Xinjiang had been readjusting its industrial structure, and the proportion of mining and quarrying had also been felling. Therefore, mining and quarrying contributed the decreases in industrial carbon intensity. Fuel processing, and smelting and pressing of metals were absolutely Xinjiang’s energy-intensive industries. During the study period, these two sub-sectors consumed 49.59% of the total industrial energy consumption, while their added value only accounted for 15.24%. Fuel processing hindered decreases in energy structure effect and energy intensity effect, and promoted decreases in industrial structure effect. In the following years, it needs to optimize fuel processing’s energy structure and improve its energy efficiency. Smelting and pressing of metals hindered decreases in energy structure effect and industrial structure effect, and promoted decreases in energy intensity, and it needed to optimize its energy structure and control its proportion properly.
Xinjiang’s industrial carbon intensity did not show a general decreasing trend from 2000 to 2014. The trend of Xinjiang’s industrial carbon intensity can be divided into three stages (Figure 1). Before 2002, the values of total effect exceed 1, which meant that the industrial carbon intensity increased. During 2003–2008, the values of total effect were less than 1, which meant that the industrial carbon intensity decreased. Since 2009, the values of total effect exceed 1 again, and thus Xinxiang’s industrial carbon intensity showed an increasing trend again. In the first stage (2000–2002), the accumulative effects of energy structure and energy intensity promoted the decrease in industrial intensity. But the accumulative industrial structure effect hindered the decrease, and it contributed most to the changes. In the second stage (2003–2008), the accumulative effects of all decomposed factors promoted the decrease. But in the third stage (2009–2014), the accumulative effects of all decomposed factors exerted positive effects on increase in industrial carbon intensity. Therefore, this paper will emphatically explore the reasons for the increase in industrial carbon intensity, and it is also important for Xinjiang to slow down or even reduce carbon emissions from the respective of industrial sector. According to Table 1, energy structure effect showed positive effects in 2009, 2011, and 2013. Mining and quarrying, textile, fuel processing, and transport equipment were primarily responsible for increases in energy structure effect. According to Table 2, energy intensity effect positively influenced the increases in industrial carbon intensity in 2010 and 2011. Fuel processing, chemicals, and smelting and pressing of metals were primarily responsible for increases in energy intensity effect. According to Table 3, industrial structure effect promoted increases in industrial carbon intensity in 2009, 2012, 2013 and 2014. Fuel processing, chemicals, smelting and pressing of metals, and other manufactures were primarily responsible for the increases in industrial structure effect.
4. Conclusions and Policy Implications
Xinjiang’s industrial sector accounts for more than 80% of the energy-related carbon emissions, and the proportion shows an increasing trend from 2000 to 2014. Therefore, industrial sector should be primarily responsible for slowing down or even reducing carbon emissions. In order to further understand the changes in Xinjiang’s industrial carbon intensity, this paper applied Sato-Vartia LMDI method to explore the decomposed factors of industrial carbon intensity, and then applied the attribution analysis method to investigate the contribution of each industrial sub-sector to each decomposed factor. The main conclusions are provided as follows.
(1) Energy intensity effect was the main factor in promoting the decrease in Xinjiang’s carbon intensity. Fuel processing, textile, and timber and furniture were the only three sub-sectors which hindered the decreases in energy intensity effect. Mining and quarrying, foods and tobacco, and other manufactures were the main sub-sectors contributed to the increases in energy intensity effect.
(2) Energy structure effect was not obvious, and its fluctuations were not obvious, but its accumulative effect showed positive effects on the increases in industrial carbon intensity. Fuel processing, smelting and pressing of metals, metal products, and textile were mainly responsible for the increase in energy structure effect; General and special purpose machinery, electric power, and gas and water production and supply, electrical machinery and equipment were the main contributors in hindering the increases in industrial energy structure effect.
(3) Industrial structure effect showed significant fluctuations, but its accumulative effect promoted the increases in industrial carbon intensity. Smelting and pressing of metals, chemicals, and other manufactures were the main sub-sectors significantly contributing to the decreases in industrial structure effect. Fuel processing, mining and quarrying, and textile were the main sub-sectors which exerted negative effects on the decreases in industrial structure effect.
(4) Fuel processing, smelting and pressing of metals, and mining and quarrying significantly influenced these three decomposed factors from 2000 to 2014. Since 2009, the industrial carbon intensity showed an increasing trend, and three decomposed factors all positively influenced the change. Mining and quarrying, textile, fuel processing, and transport equipment were primarily responsible for increases in energy structure effect. Fuel processing, chemicals, and smelting and pressing of metals were primarily responsible for increases in energy intensity effect. Fuel processing, chemicals, smelting and pressing of metals, and other manufactures were primarily responsible for the increases in industrial structure effect.
Based on the above findings, some policy recommendations were proposed as follows:
(1) Readjusting industrial structure is necessary. Since the implementation of “Western Development”, other regions regarded Xinjiang as their energy suppliers [57]. As one of the most important energy bases, energy-intensive industries, such as mining and quarrying, fuel processing, and chemicals, have been accounting for a larger proportion in Xinjiang. Therefore, Xinjiang needs to change its economic development model. Currently, energy-intensive industries are Xinjiang’s main sub-sectors, and rich energy resources favor the development of energy-intensive industries. Therefore, it is much difficult to change the dominant role of energy-intensive industries in the short term. On one hand, it needs to make periodic plans to decrease the proportion of energy-intensive industries. Fuel processing, mining and quarrying, and textile are the main sub-sectors which should be control their production capacity. On the other hand, some effective policies, such as subsidy and tax, can be adopted to support other sub-sector’s development, especially the high-tech industries. Besides, the central government needs also to encourage developed regions to aid the non-energy-intensive industries.
(2) It needs to make differentiated policies to improving the energy efficiency of different sub-sectors. Energy intensity effect was the main contributors to decrease the industrial carbon intensity, but various sub-sectors’ contributions were also different. Energy efficiency of some sub-sectors, such as fuel processing, smelting and pressing of metals, metal products, and textile, has been improved over the study period, while energy efficiency of general and special purpose machinery, production and supply, electrical machinery and equipment has been reduced. Therefore, differentiated policies are required to improving the energy efficiency. As for the industrial sub-sectors that energy efficiency is improved, it proves that the original policies are effective, and they can still be encouraged. As for other industrial sub-sectors that energy efficiency is reduced, new policies or measures are required. For example, more attention should be paid to the scientific and technological innovation, and advanced technology or low-carbon technology should be introduced.
(3) It is also important to optimize the energy structure. Although the accumulative energy structure effect was relatively smaller, its potential was enormous. Xinjiang’s industrial energy structure dominated by coal, and the proportion of coal has not decreasing since 2005. Although some industrial-sectors, such as general and special purpose machinery, production and supply, and electrical machinery and equipment, contributed most to the decreases in energy structure effect, coal also accounted for a larger proportion in their energy structure, and it also needed to promote the proportion of clean and renewable energy. Other industrial sub-sectors, such as fuel processing, smelting and pressing of metals, metal products, and textile, promoted the energy structure effect, and it also indicated that their energy structure had not been optimizing, and it must optimize these sub-sectors’ energy structure.
Acknowledgments
This work was supported by a grant from the National Natural Science Fundation of China (Nos. 41371518, 41501144). And the Ordinary University Graduate Scientific Research Innovation Projects of Jiangsu Province (No. KYLX16_1272).
Author Contributions
All authors contributed equal to this work. In particular, Xinlin Zhang developed the original idea for the study and conceived of the designed the methodology. Xinlin Zhang drafted the manuscript, which was revised by Yuan Zhao. All authors have read and approved the final manuscript.
Conflicts of Interest
The authors declare no conflict of interest.
Appendix A
Due to the theoretical foundation, adaptability, ease of use, and ease of result interpretation [27], the LMDI method is applied by a great many scholars. This study also used the LMDI method to decompose Xinjiang’s industrial carbon intensity. Based on the Kaya identity, the carbon intensity in Xinjiang’s industrial sectors can be expressed as follows:
where CI denotes the industrial carbon intensity; C denotes the industrial carbon emissions; G denotes the total added value of Xinjiang’s industrial sector; Cij denotes the carbon emissions from the consumption of energy j by sub-sector i; Eij denotes the consumption of energy type j by sub-sector i; and Gi denotes the added value of sub-sector i.
Appling the multiplicative Sato-Vartia LMDI method [59], the industrial carbon intensity changes for year t − 1 to year t can be decomposed as Equation (A2).
where DA denotes the total effect; Dce denotes the carbon emission coefficient effect, referring to the carbon intensity change caused by the emission coefficient; Des denotes the energy structure effect, referring to carbon intensity change caused by the energy structure; Dei denotes the energy intensity effect, referring to the carbon intensity change caused by the energy intensity; and Dis denotes the industrial structure effect, referring to the carbon intensity change caused by the industrial structure. Applying the Sato-Vartia function can calculate these following influencing factors:
where denotes the weight of energy j in industrial sub-sector i, and it can be defined as Equation (A7). L(x,y) is the logarithmic average of two positive numbers. It can be calculated by the function L(x,y) = (y − x)/ln(y/x), x, y are positive numbers, and x ≠ y.
Applying Equations (A3)–(A6) can obtain the single-period decomposition results. The accumulative effect of the multi-period period from year 0 to year T can be derived from the single-period results as follows:
In order to explore the contributions of Xinjiang’s industrial sub-sectors to the effects of different influencing factors, the attribution analysis method [44] is adopted. The single-period attribution analysis of each influencing factor is shown as follows:
where Dt−1,t − 1 denotes the single-period change of a relative decomposed factor, and it can further be decomposed as the contributions of industrial sub-sectors; denotes the contribution of industrial sub-sector i to the changes in a decomposed factor from year t − 1 to year t. Equations (A9)–(A12) represent the single-period contributions of each industrial sub-sector. The multi-period attribution results of the decomposed factors can be expressed as follows:
where denotes the multi-period effect of a relative decomposed factor over the 0–T period; and denotes the contribution of industrial sub-sector i to the multi-period effect of a relative decomposed factor over the 0–T period.
According to some previous studies [15,45,60], this paper assumed that the carbon emissions coefficient of each fuel type is constant and that their effects are also negligible, andthat their values are 1, respectively. Only three decomposed factors were estimated in this paper.
Data resources, consisting of the added value of industrial sub-sectors, and the sub-sectors’ energy consumption by fuel types, were collected from Xinjiang Statistical Yearbooks (2001–2015) [61,62,63,64,65,66,67,68,69,70,71,72,73,74,75]. In order to avoid the influence of the inflation, all added values were converted into a 2000 constant price. Xinjiang’s industrial carbon emissions were calculated using the equation, where the subscript i denotes the fuel type; superscript t denotes the year t; Ct denotes the industrial carbon emission; Eit denotes the fuel consumption; LCVi denotes the lower calorific value of energy fuel type i; CFit denotes the carbon emissions factors of fuel type i; and Oi denotes the oxidation rate of fuel type i. These coefficients are shown in Table A1.
Table A1.
Conversion factors, lower calorific value (LCV), oxidation rate and carbon emission factors of different fuel.
| Fuels | Conversion Factors (t ce/t or tce/103 m3) a | LCV (MJ/t or MJ/Mm3) b | Carbon Emission Factors (TC/TJ) c | Oxidation Rate c |
|---|---|---|---|---|
| Raw coal | 0.714 | 20.908 | 25.8 | 0.918 |
| Cleaned coal | 0.900 | 26.344 | 27.680 | 0.918 |
| Other washed coal | 0.286 | 8.363 | 25.800 | 0.918 |
| Coke | 0.971 | 28.435 | 29.410 | 0.928 |
| Crude oil | 1.429 | 41.816 | 20.80 | 0.979 |
| Gasoline | 1.471 | 43.070 | 18.900 | 0.986 |
| Kerosene | 1.471 | 43.070 | 19.600 | 0.980 |
| Diesel oil | 1.457 | 42.652 | 20.170 | 0.982 |
| Fuel oil | 1.429 | 41.816 | 20.000 | 0.980 |
| LPG | 1.714 | 50.179 | 17.200 | 0.990 |
| Refinery gas | 1.571 | 46.055 | 18.200 | 0.989 |
| Other petroleum products | 1.429 | 41.816 | 20.000 | 0.980 |
| gas | 1.330 | 38.931 | 17.200 | 0.990 |
a Data resource: [76]; b Data resource: [77]; c Data resource: [78]. Xinjiang Statistical Yearbooks (2001–2015) [61,62,63,64,65,66,67,68,69,70,71,72,73,74,75] list about 39 industrial sub-sectors, and the sub-sectors listed in Xinjiang Statistical Yearbooks [61,62,63,64,65,66,67,68,69,70,71,72,73,74,75] for different years were not completely identical. Therefore, these sub-sectors were further merged into 15 industrial sub-sectors, as shown in Table A2. This paper consulted the classification method in Lv [79].
Table A2.
Classification of Xinjiang’s industrial sub-sectors.
| 15 Sub-Sectors | |
|---|---|
| Mining and quarrying | Mining and Washing of Coal; Extraction of Petroleum and Natural Gas; Mining and Processing of Ferrous Metals Ores; Mining and Processing of Nonferrous Metals Ores; Mining and Processing of Nonmetal Ores; Mining Activities |
| Foods and tobacco | Manufacture of Food; Manufacture of Beverage; Manufacture of Tobacco |
| Textile | Manufacture of Textile; Manufacture of Textile Wearing Apparel, Footwear and Caps; Leather, Fur, Feather and Related Products Manufacturing |
| Timber and furniture | Processing of Timber, Wood, Bamboo, Cane, Grass Products; Manufacture of Furniture |
| Pulp and paper | Manufacture of Paper and Paper Products; Printing and Copying of Medium for Record; Manufacture of Articles for Culture, Education, Sports and Entertainment |
| Fuel processing | Oil Processing, Coking and Nuclear Fuel Processing |
| Chemicals | Raw Chemical Material and Chemical Products; Manufacture of Medicine; Manufacture of Chemical Fiber; Manufacture of Rubber Products |
| Non-metallic mineral products | Manufacture of Nonmetal Mineral Products |
| Smelting and pressing of metals | Smelting and Pressing of Ferrous Metals; Smelting and Pressing of Nonferrous Metals |
| Metal products | Manufacture of Metal Products |
| General and special purpose machinery | Manufacture of General Purpose Machinery; Manufacture of Special Purpose Machinery |
| Transport equipment | Manufacture of Automobile; Manufacture of Railroads, Ships, Aerospace and Other Transportation |
| Electrical machinery and equipment | Manufacture of Electric Equipment and Machinery |
| Production and supply | Production and Supply of Electricity and Thermal; Production and Supply of Gas; Production and Supply of Water |
| Other manufactures | Others |
References
- Intergovernmental Panel on Climate Change (IPCC). Climate Change 2007: The Fourth Assessment Report of the Inter-Governmental Panel on Climate Change; Cambridge University Press: Cambridge, UK, 2007. [Google Scholar]
- You, C.F.; Xu, X.C. Coal combustion and its pollution control in China. Energy 2010, 35, 4467–4472. [Google Scholar] [CrossRef]
- Wang, J.; Feng, L.; Davidsson, S.; Höök, M. Chinese coal supply and future production outlooks. Energy 2013, 60, 204–214. [Google Scholar] [CrossRef]
- Wang, C.; Wang, F.; Zhang, H.; Ye, Y.; Wu, Q. China’s carbon trading scheme is a priority. Environ. Sci. Technol. 2014, 48, 13559. [Google Scholar] [CrossRef] [PubMed]
- Zeng, N.; Ding, Y.; Pan, J.; Wang, H.; Gregg, J. Climate change—The Chinese challenge. Science 2008, 319, 730–731. [Google Scholar] [CrossRef] [PubMed]
- Qiu, J. China’s climate target: Is it achievable? Nature 2009, 462, 550–551. [Google Scholar] [CrossRef] [PubMed]
- David, M. China’s peak carbon pledge raises pointed questions. Science 2014, 346, 903. [Google Scholar]
- Mi, Z.; Wei, Y.M.; Wang, B.; Meng, J.; Liu, Z.; Shan, Y.; Liu, J.; Guan, D. Socioeconomic impact assessment of China’s CO2 emissions peak prior to 2030. J. Clean. Prod. 2017, 142, 2227–2236. [Google Scholar] [CrossRef]
- Guan, D.; Liu, Z.; Geng, Y.; Lindner, S.; Hubacek, K. The gigatonne gap in China’s carbon dioxide inventories. Nat. Clim. Chang. 2012, 2, 672–675. [Google Scholar] [CrossRef]
- Gu, M.S.; Wang, L.M. Petroleum terminal utilization carbon emissions in China based on regional differences. Resour. Sci. 2016, 38, 255–264. (In Chinese) [Google Scholar]
- Zhang, C.; Lin, Y. Panel estimation for urbanization, energy consumption and CO2 emissions: A regional analysis in China. Energy Policy 2012, 49, 488–498. [Google Scholar] [CrossRef]
- Fan, Y.; Liu, L.C.; Wu, G.; Tsai, H.T.; Wei, Y.M. Changes in carbon intensity in China: Empirical findings from 1980–2003. Ecol. Econ. 2007, 62, 683–691. [Google Scholar] [CrossRef]
- Zhang, Y.J.; Da, Y.B. The decomposition of energy-related carbon emission and its decoupling with economic growth in China. Renew. Sustain. Energy Rev. 2015, 41, 1255–1266. [Google Scholar] [CrossRef]
- Mahony, T.O. Decomposition of Ireland's carbon emissions from 1990 to 2010: An extended Kaya identity. Energy Policy 2013, 59, 573–581. [Google Scholar] [CrossRef]
- Wang, W.; Liu, R.; Zhang, M.; Li, H. Decomposing the decoupling of energy-related CO2 emissions and economic growth in Jiangsu Province. Energy Sustain. Dev. 2013, 17, 62–71. [Google Scholar] [CrossRef]
- Mi, Z.; Zhang, Y.; Guan, D.; Shan, Y.; Liu, Z.; Cong, R.; Yuan, X.C.; Wei, Y.-M. Consumption-based emission accounting for Chinese cities. Appl. Energy 2016, 184, 1073–1081. [Google Scholar] [CrossRef]
- Mi, Z.F.; Pan, S.Y.; Yu, H.; Wei, Y.M. Potential impacts of industrial structure on energy consumption and CO2 emission: A case study of Beijing. J. Clean. Prod. 2015, 103, 455–462. [Google Scholar] [CrossRef]
- Huang, R.; Wang, Z.; Ding, G.Q.; Gong, Y.R.; Liu, C.X. Trend prediction and analysis of influencing factors of carbon emissions from energy consumption in Jiangsu province based on STIRPAT model. Geogr. Res. 2016, 35, 781–789. (In Chinese) [Google Scholar]
- Wang, Z.X.; Ye, D.J. Forecasting Chinese carbon emissions from fossil energy consumption using non-linear grey multivariable models. J. Clean. Prod. 2017, 142, 600–612. [Google Scholar] [CrossRef]
- Wang, T.; Watson, J. Scenario analysis of China’s emissions pathways in the 21st century for low carbon transition. Energy Policy 2010, 38, 3537–3546. [Google Scholar] [CrossRef]
- Schipper, L.; Murtishaw, S.; Khrushch, M.; Ting, M.; Karbuz, S.; Unander, F. Carbon emissions from manufacturing energy use in 13 IEA countries: Long-term trends through 1995. Energy Policy 2001, 29, 667–668. [Google Scholar] [CrossRef]
- Dhakal, S. Urban energy use and carbon emissions from cities in China and policy implications. Energy Policy 2009, 37, 4208–4219. [Google Scholar] [CrossRef]
- Qi, T.; Winchester, N.; Karplus, V.J.; Zhang, X. Will economic restructuring in China reduce trade-embodied CO2 emissions? Energy Econ. 2014, 42, 204–212. [Google Scholar] [CrossRef]
- Cheng, J.H. Decomposition of carbon cap target at provincial level in China: A case study of Zhejiang. China Popul. Resour. Environ. 2016, 26, 23–30. (In Chinese) [Google Scholar]
- Wang, C.; Wang, F.; Zhang, X.; Yang, Y.; Su, Y.; Ye, Y.; Zhang, H. Examining the driving factors of energy related carbon emissions using the extended STIRPAT model based on IPAT identity in Xinjiang. Renew. Sustain. Energy Rev. 2017, 67, 51–61. [Google Scholar] [CrossRef]
- Xie, S.H.; Wang, L.X.; Shao, Z.L. Review on carbon emissions researches at home and abroad. Arid Land Geogr. 2014, 37, 720–730. (In Chinese) [Google Scholar]
- Ang, B.W. Decomposition analysis for policymaking in energy: Which is the preferred method? Energy Policy 2004, 32, 1131–1139. [Google Scholar] [CrossRef]
- Su, B.; Ang, B.W. Structural decomposition analysis applied to energy and emissions: Some methodological developments. Energy Econ. 2012, 34, 177–188. [Google Scholar] [CrossRef]
- Sun, J.W. Changes in energy consumption and energy intensity: A complete decomposition model. Ecol. Econ. 1998, 20, 85–100. [Google Scholar] [CrossRef]
- Wang, L.; Ma, D.; Chen, W. A new improved decomposition model base Laspeyres index: A case of CO2 emission in China from 1996–2011. Adv. Mater. Rese. 2013, 734–737, 1797–1803. [Google Scholar] [CrossRef]
- Sinton, J.E.; Levine, M.D. Changing energy intensity in Chinese industry: The relatively importance of structural shift and intensity change. Energy Policy 1994, 22, 239–255. [Google Scholar] [CrossRef]
- Shang, W.; Pei, G.; Walsh, C.; Meng, M.; Meng, X. Have Market-oriented Reforms Decoupled China’s CO2 Emissions from Total Electricity Generation? An Empirical Analysis. Sustainability 2016, 8, 468. [Google Scholar] [CrossRef]
- Li, D.; Wang, D. Decomposition analysis of energy consumption for an freeway during its operation period: A case study for Guangdong, China. Energy 2016, 97, 296–305. [Google Scholar] [CrossRef]
- Wang, W.; Liu, X.; Zhang, M.; Song, X. Using a new generalized LMDI (logarithmic mean Divisia index) method to analyze China’s energy consumption. Energy 2014, 67, 617–622. [Google Scholar] [CrossRef]
- Xie, X.; Shao, S.; Lin, B. Exploring the driving forces and mitigation pathways of CO2 emissions in China’s petroleum refining and coking industry: 1995–2031. Appl. Energy 2016, 184, 1004–1015. [Google Scholar] [CrossRef]
- Li, H.; Wei, Y.M. Is it possible for China to reduce its total CO2 emissions? Energy 2015, 83, 438–446. [Google Scholar] [CrossRef]
- Wu, R.; Zhang, J.; Bao, Y.; Zhang, F. Geographical Detector Model for Influencing Factors of Industrial Sector Carbon Dioxide Emissions in Inner Mongolia, China. Sustainability 2016, 8, 149. [Google Scholar] [CrossRef]
- Wang, Z.; Yang, Y. Features and influencing factors of carbon emissions indicators in the perspective of residential consumption: Evidence from Beijing, China. Ecol. Indic. 2016, 61, 634–645. [Google Scholar] [CrossRef]
- Zhang, X.P.; Zhang, Y.X.; Rao, R.; Shi, Z.P. Exploring the drivers to energy-related carbon emissions changes at China’s provincial levels. Energy Effic. 2014, 8, 699–712. [Google Scholar] [CrossRef]
- Zhang, X.P.; Tan, Y.K.; Tan, Q.L.; Yuan, J.H. Decomposition of aggregate CO2 emissions within a joint production framework. Energy Econ. 2012, 34, 1088–1097. [Google Scholar] [CrossRef]
- Li, A.; Zhang, A.; Zhou, Y.; Yao, X. Decomposition analysis of factors affecting carbon dioxide emissions across provinces in China. J. Clean. Prod. 2017, 141, 1428–1444. [Google Scholar] [CrossRef]
- Liu, L.C.; Fan, Y.; Wu, G.; Wei, Y.M. Using LMDI method to analyze the change of China’s industrial CO2 emissions from final fuel use: An empirical analysis. Energy Policy 2007, 35, 5892–5900. [Google Scholar] [CrossRef]
- Yan, X.; Fang, Y.P. CO2 emissions and mitigation potential of the Chinese manufacturing industry. J. Clean. Prod. 2015, 103, 759–773. [Google Scholar] [CrossRef]
- Choi, K.H.; Ang, B.W. Attribution of changes in Divisia real energy intensity index—An extension to index decomposition analysis. Energy Econ. 2012, 34, 171–176. [Google Scholar] [CrossRef]
- Wang, Q.; Hang, Y.; Zhou, P.; Wang, Y. Decoupling and attribution analysis of industrial carbon emissions in Taiwan. Energy 2016, 113, 728–738. [Google Scholar] [CrossRef]
- Liu, N.; Ma, Z.; Kang, J. Changes in carbon intensity in China’s industrial sector: Decomposition and attribution analysis. Energy Policy 2015, 87, 28–38. [Google Scholar] [CrossRef]
- Su, B.; Ang, B.W. Attribution of changes in the generalized Fisher index with application to embodied emission studies. Energy 2014, 69, 778–786. [Google Scholar] [CrossRef]
- Fernández González, P.; Landajo, M.; Presno, M.J. The Divisia real energy intensity indices: Evolution and attribution of percent changes in 20 European countries from 1995 to 2010. Energy 2013, 58, 340–349. [Google Scholar] [CrossRef]
- Choi, K.H.; Oh, W. Extended Divisia index decomposition of changes in energy intensity: A case of Korean manufacturing industry. Energy Policy 2014, 65, 275–283. [Google Scholar] [CrossRef]
- Fernández González, P.; Presno, M.J.; Landajo, M. Regional and sectoral attribution to percentage changes in the European Divisia carbonization index. Renew. Sustain. Energy Rev. 2015, 52, 1437–1452. [Google Scholar] [CrossRef]
- González, D.; Martínez, M. Changes in CO2 emission intensities in the Mexican industry. Energy Policy 2012, 51, 149–163. [Google Scholar] [CrossRef]
- Su, B.; Ang, B.W. Multi-region comparisons of emission performance: The structural decomposition analysis approach. Ecol. Indic. 2016, 67, 78–87. [Google Scholar] [CrossRef]
- Zhang, Y.; Wang, H.; Liang, S.; Xu, M.; Liu, W.; Li, S.; Zhang, R.; Nielsen, C.P.; Bi, J. Temporal and spatial variations in consumption-based carbon dioxide emissions in China. Renew. Sustain. Energy Rev. 2014, 40, 60–68. [Google Scholar] [CrossRef]
- Wang, C.; Wang, F.; Zhang, H.; Ye, Y.; Wu, Q.; Su, Y. Carbon Emissions Decomposition and Environmental Mitigation Policy Recommendations for Sustainable Development in Shandong Province. Sustainability 2014, 6, 8164–8179. [Google Scholar] [CrossRef]
- Mi, Z.F.; Wei, Y.M.; He, C.Q.; Li, H.N.; Yuan, X.C.; Liao, H. Regional efforts to mitigate climate change in China: A multi-criteria assessment approach. Mitig. Adapt. Strateg. Glob. Chang. 2015, 22, 45–66. [Google Scholar] [CrossRef]
- Wang, C.; Wang, F. Structural Decomposition Analysis of Carbon Emissions and Policy Recommendations for Energy Sustainability in Xinjiang. Sustainability 2015, 7, 7548–7567. [Google Scholar] [CrossRef]
- Zhang, X.L.; Wang, Q.; Wang, C.J.; Lu, J.R. Analyses of development and industry relevancy of energy industries in Xinjiang. J. Univ. Chin. Acad. Sci. 2013, 30, 504–509. (In Chinese) [Google Scholar]
- Hasanbeigi, A.; Price, L.; Fino-Chen, C.; Lu, H.; Ke, J. Retrospective and prospective decomposition analysis of Chinese manufacturing energy use and policy implications. Energy Policy 2013, 63, 562–574. [Google Scholar] [CrossRef]
- Ang, B.W.; Choi, K.H. Decomposition of aggregate energy and gas emission intensities for industry: A refined Divisia index method. Energy J. 1997, 18, 59–73. [Google Scholar] [CrossRef]
- Tan, Z.; Li, L.; Wang, J.; Wang, J. Examining the driving forces for improving China’s CO2 emission intensity using the decomposing method. Applied Energy 2011, 88, 4496–4504. [Google Scholar] [CrossRef]
- Statistic Bureau of Xinjiang Uygur Autonomous Region. Xinjiang Statistical Yearbook 2001; Statistic Bureau of Xinjiang Uygur Autonomous Region: Xinjiang, China, 2001. (In Chinese) [Google Scholar]
- Statistic Bureau of Xinjiang Uygur Autonomous Region. Xinjiang Statistical Yearbook 2002; Statistic Bureau of Xinjiang Uygur Autonomous Region: Xinjiang, China, 2002. (In Chinese) [Google Scholar]
- Statistic Bureau of Xinjiang Uygur Autonomous Region. Xinjiang Statistical Yearbook 2003; Statistic Bureau of Xinjiang Uygur Autonomous Region: Xinjiang, China, 2003. (In Chinese) [Google Scholar]
- Statistic Bureau of Xinjiang Uygur Autonomous Region. Xinjiang Statistical Yearbook 2004; Statistic Bureau of Xinjiang Uygur Autonomous Region: Xinjiang, China, 2004. (In Chinese) [Google Scholar]
- Statistic Bureau of Xinjiang Uygur Autonomous Region. Xinjiang Statistical Yearbook 2005; Statistic Bureau of Xinjiang Uygur Autonomous Region: Xinjiang, China, 2005. (In Chinese) [Google Scholar]
- Statistic Bureau of Xinjiang Uygur Autonomous Region. Xinjiang Statistical Yearbook 2006; Statistic Bureau of Xinjiang Uygur Autonomous Region: Xinjiang, China, 2006. (In Chinese) [Google Scholar]
- Statistic Bureau of Xinjiang Uygur Autonomous Region. Xinjiang Statistical Yearbook 2007; Statistic Bureau of Xinjiang Uygur Autonomous Region: Xinjiang, China, 2007. (In Chinese) [Google Scholar]
- Statistic Bureau of Xinjiang Uygur Autonomous Region. Xinjiang Statistical Yearbook 2008; Statistic Bureau of Xinjiang Uygur Autonomous Region: Xinjiang, China, 2008. (In Chinese) [Google Scholar]
- Statistic Bureau of Xinjiang Uygur Autonomous Region. Xinjiang Statistical Yearbook 2009; Statistic Bureau of Xinjiang Uygur Autonomous Region: Xinjiang, China, 2009. (In Chinese) [Google Scholar]
- Statistic Bureau of Xinjiang Uygur Autonomous Region. Xinjiang Statistical Yearbook 2010; Statistic Bureau of Xinjiang Uygur Autonomous Region: Xinjiang, China, 2010. (In Chinese) [Google Scholar]
- Statistic Bureau of Xinjiang Uygur Autonomous Region. Xinjiang Statistical Yearbook 2011; Statistic Bureau of Xinjiang Uygur Autonomous Region: Xinjiang, China, 2011. (In Chinese) [Google Scholar]
- Statistic Bureau of Xinjiang Uygur Autonomous Region. Xinjiang Statistical Yearbook 2012; Statistic Bureau of Xinjiang Uygur Autonomous Region: Xinjiang, China, 2012. (In Chinese) [Google Scholar]
- Statistic Bureau of Xinjiang Uygur Autonomous Region. Xinjiang Statistical Yearbook 2013; Statistic Bureau of Xinjiang Uygur Autonomous Region: Xinjiang, China, 2013. (In Chinese) [Google Scholar]
- Statistic Bureau of Xinjiang Uygur Autonomous Region. Xinjiang Statistical Yearbook 2014; Statistic Bureau of Xinjiang Uygur Autonomous Region: Xinjiang, China, 2014. (In Chinese) [Google Scholar]
- Statistic Bureau of Xinjiang Uygur Autonomous Region. Xinjiang Statistical Yearbook 2015; Statistic Bureau of Xinjiang Uygur Autonomous Region: Xinjiang, China, 2015. (In Chinese) [Google Scholar]
- Liang, S.; Zhang, T. What is driving CO2 emissions in a typical manufacturing center of South China? The case of Jiangsu Province. Energy Policy 2011, 39, 7078–7083. [Google Scholar] [CrossRef]
- Xi, F.; Geng, Y.; Chen, X.; Zhang, Y.; Wang, X.; Xue, B.; Dong, H.; Liu, Z.; Ren, W.; Fujita, T.; et al. Contributing to local policy making on GHG emission reduction through inventorying and attribution: A case study of Shenyang, China. Energy Policy 2011, 39, 5999–6010. [Google Scholar] [CrossRef]
- Geng, Y.; Zhao, H.; Liu, Z.; Xue, B.; Fujita, T.; Xi, F. Exploring driving factors of energy-related CO2 emissions in Chinese provinces: A case of Liaoning. Energy Policy 2013, 60, 820–826. [Google Scholar] [CrossRef]
- Lv, K.W.; Miao, C.H.; Shang, W.Y. Sectoral difference in carbon emission of industrial energy consumption: A case study of Henan province. Econ. Geogr. 2012, 32, 15–20. (In Chinese) [Google Scholar]

© 2017 by the authors. Licensee MDPI, Basel, Switzerland. This article is an open access article distributed under the terms and conditions of the Creative Commons Attribution (CC BY) license ( http://creativecommons.org/licenses/by/4.0/).