Abstract
By selecting the panel data from 2005 to 2014 of 9 cities in the Pearl River Delta (PRD) in China, this paper respectively establishes the evaluation index system of tourism economy and transport. It also applies a synthetic evaluation model and coupling coordination model to estimate comprehensive indices of tourism economy and transport system and their coordinated relationships. The results show that: (1) during 2005–2014, the synthetic indices of tourism economy generally presented constantly upward tendency and the synthetic indices of transport represented wave-like raising trend in the PRD region; (2) during 2005–2014, the 9 cities in the PRD region gradually tended to have coordinated development between tourism economy and transport, and the central area of the PRD region developed faster than the flanks; (3) the correlations between the tourism economy and transport of the cities with abundant tourism resources, developed economy, and advanced transport facilities were more remarkable, and the coordination degrees were higher. Besides, macro-policies, mega-events, and locations also impacted on coordinated development between the tourism economy and transport in the PRD region.
1. Introduction
Tourism is an important function of a modern city and the main choice for many areas to promote economic development and accelerate the progress of urbanization [1]. The development of tourism is closely linked to transport industry, as convenient transport is not only the necessary condition for the exploitation of tourism resources and construction of tourist destinations, but also an essential sign to measure the developed degree of tourism industry in a country or area [2]. Transport is a key factor in developing tourism attractiveness and activities [3,4,5], linking the customer market with tourist destination, providing access and mobility with a wide destination area (region or country), offering transport services within the destination, and providing travel along a recreational route [6,7]. Meanwhile, tourism economic activities have great influence on the transport network [8], transport demands of tourists [9], etc.
Transport services are indispensable for the development of the tourism sector. The research about tourism and transport have made certain progress, mainly focusing on coordination between tourism economy and transport [8,9], tourism transport planning [10,11,12,13], travel behavior and regularity of tourist movements [14,15,16], tourists’ satisfaction to tourism transport [17,18,19,20], the impact of transport on tourism and spatial structure of tourism activities [21,22,23], energy consumption of tourism transport and sustainable development of tourism transport in an area [24,25,26], carbon emissions of tourism transport [27,28,29,30], etc.
Tourism economy and transport influence each other and restrict each other. Scholars adopted qualitative analysis and quantitative analysis to probe the relationships between tourism economy and transport. Chen et al. applied fuzzy mathematics to analyze the development pattern and evolution between tourism and transport [31]. Zhu et al. adopted impulse response function to study the relationships between railway traffic and tourism economic growth in China and found that the increase of railway construction investment could not continuously promote the increase of tourism income, and the increase of total tourism revenue always maintained a small-range positive response on the impact of the growth rate of railway route length [32] Yu et al. and Wang et al. respectively applied physical coupling model to empirically analyze the relationships between tourism economy and transport of Chizhou and Xi’an city in China, finding that there were obvious connections between the two systems [8,9]. Yan et al. synthetically assessed the connection between transport industry and inbound tourism of 31 provinces/cities/districts in China by correspondence analysis method, and the result showed that transport industry in the eastern areas with developed inbound tourism progressed faster and stronger correlations between both. While the areas with backward inbound tourism had weaker correlations between inbound tourism and transport, which showed that transport hindered the development of inbound tourism to some extent [33]. Wang et al. utilized PSR (pressure-state-response) model to find out that the response mechanism of transport in Zhangjiajie to the tourism development was influenced by four factors: economic development level, traffic construction, spatial structure of tourism resources, and the status of tourism industry [34]. Khadaroo adopted a gravity model approach to find out that transport infrastructure was a significant determinant of tourism flows into a destination, and the sensitivity of tourism flows to transport in infrastructure did vary depending on customer origins and destinations [35]. Guo et al. and Mu et al. found that high-speed railway had greatly strengthened the tourism traffic accessibility and tourism economy of the cities in Northeast China and the Yangtze River Delta [36,37].
To sum up, quantitative analysis can effectively reflect the mutual relations and interactive degrees between tourism economy and transport system. However, the existing research mainly takes a single city or area as an example, barely analyzing the tourism economy and transport of an urban agglomeration which contains different scales of cities. For this consideration, We here chooses the urban agglomeration in the Pearl River Delta(PRD) as a case and applies coupling coordination model to analyze spatial-temporal difference in coordinated development of each city in the PRD region, looking forward to providing guidance and suggestions for the sustainable development of tourism economy in the PRD region.
2. The Study Area
The Pearl River Delta (PRD) is located in southern mainland China adjacent to the South China Sea and is considered as one of the most economically developed regions in China (see Figure 1). The PRD region covers about 54,754 km2 in south central Guangdong Province and comprises of two deputy provincial cities which are Guangzhou and Shenzhen, and seven prefecture-level cities which are Foshan, Dongguan, Zhuhai, Huizhou, Zhongshan, Jiangmen, and Zhaoqing. In 2014, the PRD region had about 57.63 million people, which made it one of the most densely populated areas in the World. The gross revenue of tourism industry in the PRD region was about 573.859 billion yuan in 2014, accounting for 9.95% of its GDP, that was about 5.765 trillion yuan.
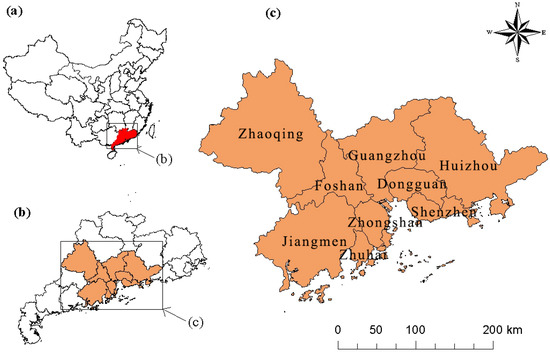
Figure 1.
Location of the PRD region, China. (a) China; (b) Guangdong province; (c) the PRD region.
Tourism resources of the 9 cities in the PRD region are different from each other, such as bustling city tourism in both Guangdong and Shenzhen, coastal and marine tourism in Zhuhai, temple and ancient relic tourism in Foshan, the revolutionary history tourism in Zhongshan, hot spring tourism in Jiangmen, industrial exhibition tourism in Dongguan, and natural sightseeing in both Huizhou and Zhaoqing. Wu et al. investigated the distribution of scenic spots in the PRD region and found that there were 5006 in Guangzhou, 3083 in Shenzhen, 1980 in Foshan, 1347 in Dongguan, 909 in Huizhou, 840 in Zhuhai, 792 in Zhongshan, and 446 in Zhaoqing, respectively [38]. In general, tourism development of the PRD is unbalanced, presenting that Guangzhou and Shenzhen are more prosperous while Zhaoqing and Zhongshan are laggard.
The geographical pattern “outer mountain-middle river-inner sea” of the PRD region causes a difference in the urban traffic layout among the 9 cities. Because of the geographical location and advanced economy, Guangzhou, Shenzhen, Zhuhai, and Foshan all have incorporated into the solid traffic layout across sea, land, and air. Except for the four cities, Zhongshan and Jiangmen close to the sea are relatively better in the water transport, Dongguan is relatively better in highway transport, Huizhou is relatively better in railway transport, while mountainous Zhaoqing is relatively laggard in all transport means.
3. Research Data and Methods
3.1. Evaluation System and Data Source
The main objects that tourism transport serves are people, so the transport indicators selected should represent the capacity of passenger transport. Domestical tourism flow among the cities is the biggest feature in the PRD region, so resident’s disposable income and possession of personal vehicles are selected as evaluation indictors. Per capita disposable income is one of the important conditions for travel, the increase in possession of personal vehicles can promote self-driving tourism in close distance. Consulting the existing evaluation system [8], considering the specific circumstance of the PRD region and following the systematic, scientific, and operable principles, this study built the evaluation systems of tourism economy and transport (see Table 1). Data were derived from Guangdong Statistical Yearbook, the Statistical Yearbook of the 9 cities, and China City Statistical Yearbook [39,40,41,42,43,44,45,46,47,48,49].

Table 1.
Evaluation systems of tourism economy and transport in the PRD region.
3.2. Synthetic Evaluation Model
Suppose that t x1, x2, …, xn are the indicators of tourism economy system and that y1, y2, …, yn are the indicators of transport system. The synthetic evaluation functions are expressed as:
where F(x) and G(y) represent the synthetic values of tourism economy and transport at time i, respectively. x’ij and y’ij are the standardized values of original indicators xij and yij, respectively. ωj indicates the weight of index j. The 0-1 normalization is adopted to standardize the original indicator, and the formula is expressed as:
where xjmin and xjmax indicate the minimum and maximum value of the indicator j, respectively. Correspondingly, y’ij is also obtained by this formula.
The weight ωj of each indicator is calculated by entropy weight method. Based on the original information of objective environment, this method obtains weight of an indicator through analyzing the correlation among these indicators and the information that they provide. To a certain extent, this method can avoid deviation resulting from subjective factors. The steps are as follows:
where pij indicates the proportion of the index j at time i. The original expression of pij should be: , but when pij = 1, lnpij is meaningless. So pij is revised as the Formula (4). ej is the information entropy of the indicator j. k and n represent the quantities of years and the indicators, respectively. ωj indicates the weight of the indicator j. Therefore, the indicator weights of tourism economy and transport are shown in Table 1.
3.3. Coupling Coordination Model
Coupling refers to that two or more systems and motion forms influence each other through variety of interaction. Generally, the interaction degree of these systems or factors is represented by coupling degree [50]. Coordination means that two or more systems or factors cooperate with each other properly and are in a harmonious and sustainable relationships. Obviously, there are coupling coordinated relationships between a tourism economy system and transport system. The development of tourism economy has great impacts on transport economy, transport operation, transport quality, transport layout, etc. The development of transport has great impacts on tourism economy, performance of tourist flow, development of tourism resources, tourism image, etc. The coupling coordination model of tourism economy and transport is as follows:
where D and C indicate coupling coordination degree and coupling degree, respectively. F(x) and G(y) represent the synthetic values of tourism economy and transport, respectively. M is the comprehensive coordination index. α and β are both undetermined coefficients, α > 0, β > 0, and α + β = 1. Both tourism economy and transport system are important in this study, so we set α = 0.5 and β = 0.5. Referencing the existing research, coupling coordination degree is classified as follows, as seen in Table 2.
Table 2.
Discriminating standard of coupling coordination degree of tourism economy and transport.
4. Results
4.1. Synthetic Evaluation for the Subsystems
F(x) and G(y), the synthetic values for tourism economy and transport in the PRD region, are calculated by synthetic evaluation models (see Table 3). The trends of the two subsystems with time are shown as Figure 2 and Figure 3.
Table 3.
Synthetic values of tourism economy system and transport system in the PRD (2005–2014).
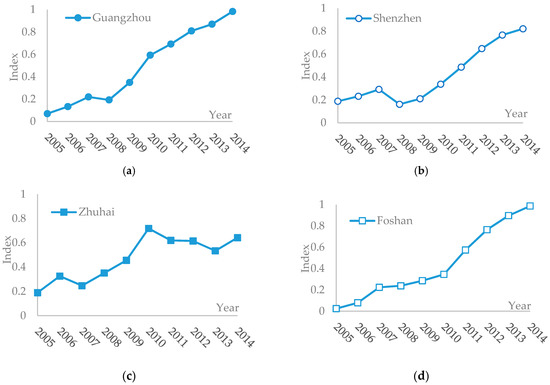
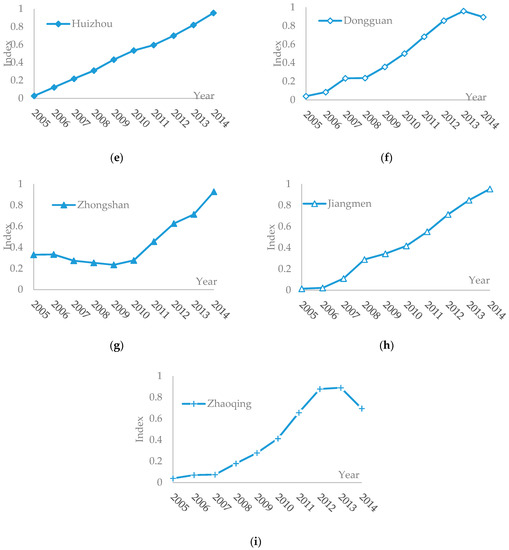
Figure 2.
Trend of synthetic evaluation indices of tourism economy in the PRD (2005–2014): (a) Guangzhou; (b) Shenzhen; (c) Zhuhai; (d) Foshan; (e) Huizhou; (f) Dongguan; (g) Zhongshan; (h) Jiangmen; and (i) Zhaoqing.
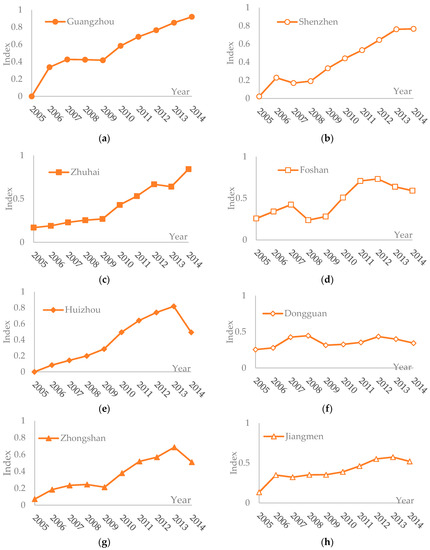
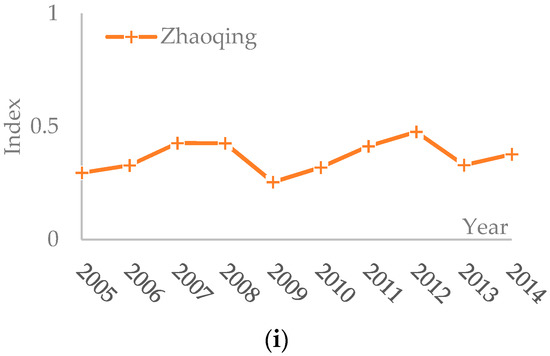
Figure 3.
Trend of synthetic evaluation indices of transport in the PRD (2005–2014): (a) Guangzhou; (b) Shenzhen; (c) Zhuhai; (d) Foshan; (e) Huizhou; (f) Dongguan; (g) Zhongshan; (h) Jiangmen; and (i) Zhaoqing.
Overall, the synthetic values for tourism economy of the 9 cities in the PRD all showed increasing trends from 2005 to 2014 (see Figure 2). The synthetic values for tourism economy of both Guangzhou and Shenzhen firstly increased during 2005–2007, declined in 2008, and then kept rising during 2009–2014. As we can see from the tourism economy indicators of Guangzhou and Shenzhen, the reasons for decline mainly were that the foreign exchange income and tourism income share of GDP both declined, which indicated that the two cities with developed economies were greatly influenced by the financial crisis in 2008. The development levels for tourism economy of Foshan, Huizhou, and Jiangmen all kept rising during 2005–2014. Dongguan and Zhaoqing kept improving in tourism economy during 2005–2013, while it declined in 2014. The reasons for Dongguan declining were the reduction of its per capita annual disposable income from 7585.22 dollars in 2013 to 5984.89 dollars in 2014, and the reduction of its overseas tourists from 3.14 million in 2013 to 2.73 million in 2014. Except the increase of domestic travel income of Zhaoqing in 2014, other indicators declined as compared with 2013. The synthetic value of Zhuhai showed a wavy upward trend. Zhongshan showed a U-shaped trend, and reached the lowest value for tourism economy in 2009.
The slopes in Figure 2 were bigger, the hoisting speeds of tourism economy values were faster. The curve slopes of the 9 cities in the PRD region in descending order were Dongguan, Foshan, Jiangmen, Guangzhou, Zhaoqing, Huizhou, Shenzhen, Zhongshan, and Zhuhai. Obviously, the developing speeds of tourism economy of Guangzhou, Shenzhen, and Zhuhai with better tourism infrastructures were not so outstanding, while the developing speed of Dongguan headed the list.
From the view of transport development, the synthetic values for 9 cities in the PRD region represented wavy trends that the values firstly increased, then declined, and finally increased (see Figure 3). During 2005–2014, the developing indices of urban transport of Guangzhou, Shenzhen, Zhuhai, and Huizhou all declined once: Guangzhou in 2008, Shenzhen in 2007, Zhuhai in 2013 and Huizhou in 2014. However, the developing indices of urban transport of Foshan, Dongguan, Zhongshan, Zhaoqing, and Jiangmen all declined twice: Foshan in 2008 and 2013, Dongguan in 2009 and 2013, Zhongshan in 2009 and 2014, Zhaoqing in 2009 and 2013, and Jiangmen in 2007 and 2014. By checking the transport indicators of each city, it was found that the similarities of the reason for decline in each city in those years were the decrease of the relative indices about waterways and highways and the increase of the relative indices about railways and aviation. For instance, passenger traffic by waterway of Guangzhou decreased from 3.23 million person-times in 2007 to 2.54 million person-times in 2008, and its passenger-kilometers by waterway decreased from 292 million person-kilometers in 2007 to 231 million person-kilometers in 2008. While passenger traffic by railway and aviation of Guangzhou increased from 75.88 million person-times and 43.2 million person-times in 2007 to 83.75 million person-times and 43.97 million person-times in 2008, respectively. Obviously, tourists prefer to choose convenient traffic means like highway and aviation when they travel. From the view of the curve slopes of transport development indices, it was shown that the transport developing speeds of Guangzhou and Shenzhen were faster, while that of Jiangmen and Dongguan were slower.
4.2. Coupling Coordination Analysis of Tourism Economy and Transport
The rising trends of synthetic values for tourism economy and transport of each city in the PRD, had played positive roles in the coordinated development of the whole system. We calculated the coupling coordination degree M by Formulas (7)–(9) mentioned above. It was found that the coupling coordination degrees for tourism economy and transport of each city in the PRD had increased year by year. As is shown in Table 4, the imbalanced developing stages of Guangzhou, Shenzhen, Zhuhai, Foshan, Huizhou, Dongguan, Zhongshan, Jiangmen, and Zhaoqing occurred respectively during 2005–2008, 2005–2009, 2005–2008, 2005–2009, 2005–2008, 2005–2007, 2005–2009, 2005–2007, and 2005–2009. The transitional developing stages of Guangzhou, Shenzhen, Zhuhai, Foshan, Huizhou, Dongguan, Zhongshan, Jiangmen, and Zhaoqing occurred during 2009–2011, 2010–2012, 2010–2013, in 2011, 2010–2011, 2012–2014, 2012–2014, 2011–2014, and 2011–2014, respectively. There are 5 cities that went into coordinated development. Among them, Guangzhou was in primary coordination during 2012–2014, Shenzhen during 2012–2014, Zhuhai during 2014, Foshan during 2012–2014, and Huizhou during 2012–2013. The results showed a phenomenon that the cities with better transport facilities and more tourism resources went into coordinated development earlier.
Table 4.
Coupling coordinated degrees of tourism economy and transport in the PRD (2005-2014).
To further analyze the dynamic changes of the coupling coordination degrees of each city, ArcGIS 10.0 was adopted to visually show the results in 2005, 2008, 2011, and 2014, shown as Figure 4. In 2005, Guangzhou, Shenzhen, Huizhou, Foshan, and Jiangmen were all in the level of high imbalance. Dongguan, Zhaoqing, and Zhongshan were all in moderate imbalance. Zhuhai was in slight imbalance. In 2008, the coupling coordination degrees of the 9 cities in the PRD region had increased compared with those in 2005, Shenzhen was in moderate imbalance, Jiangmen and Dongguan were in approaching imbalance, the rest of the cities were all in slight imbalance. 2008 was a transitional year for all cities in the PRD. Besides Zhongshan and Dongguan being in approaching imbalance, the other cities went into reluctant coordination. In 2014, Guangzhou, Shenzhen, Foshan, and Zhuhai all went into primary coordination, the rest of the cities still stayed in reluctant coordination. In a word,, urban tourism economy and transport gradually went into coordinated development in the PRD region. The spatio-temporal evolution of coupling coordination degrees represented that the central area of the PRD region developed faster than the flanks.
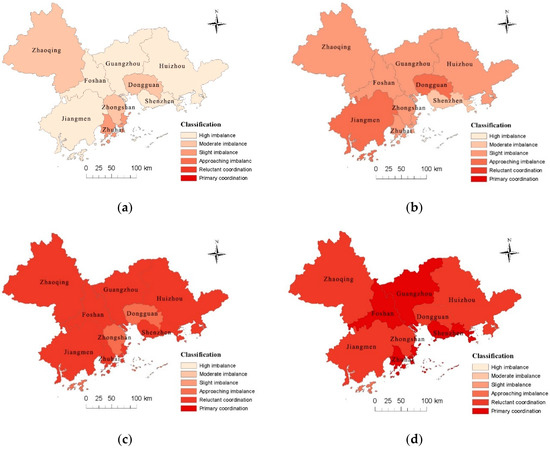
Figure 4.
Spatio-temporal variation of coupling coordination degree between tourism economy and transport in the PRD (2005–2014). (a) 2005; (b) 2008; (c) 2011; (d) 2014.
To further demonstrate the correlations between the tourism economy system and transport system, SPSS 18.0 was adopted to make a regression analysis for developing indices of tourism economy and transport, and we got the optimal simulation equation of each city in the PRD, shown in Table 5. The coefficients of determination R2 of Guangzhou, Shenzhen, Zhuhai, Foshan, Huizhou, and Jiangmen were bigger and their significant coefficients Sig. were all less than 0.005, which indicated that the six cities had significant relations and stronger interactivities between their tourism economy and transport. The coefficients of determination R2 of Zhongshan and Dongguan were smaller and their significant coefficients Sig. were both greater than 0.005, which showed that there were weaker relations and interactivities between tourism economy and transport of the two cities. The coefficient of determination R2 of Zhaoqing was just 0.103, which apparently showed there was little interactivity between tourism economy and transport in Zhaoqing. The results showed the cities like Guangzhou, Shenzhen, Zhuhai, Foshan, etc. with abundant tourism resources and better transport facilities had stronger correlations and higher coupling coordination degrees between tourism economy and transport. On the contrary, the cities, like Zhaoqing, Zhongshan, etc. with less tourism resources and lagging transport facilities had weaker correlations and lower coupling coordination degrees between tourism economy and transport. Although Dongguan has many tourism spots and good transport conditions, there was also a weaker relationship between tourism economy and transport in Dongguan, which resulted from there being many extraneous people who came from other cities and were not the permanent residents here (extraneous people accounting for 77.06% of the total population in 2014) and that traffic passengers were mainly extraneous people.
Table 5.
Regression analysis between tourism economy and transportation in the Pearl River Delta.
5. Discussion
5.1. Impact Factors for Coordinated Development of Urban Tourism Economy and Transport
Tourism economy and transport of the 9 cities in the PRD region became more and more harmonious year by year. However, their coordinated development levels were still distinct from each other in space and through time, which may resulted from many reasons like the differences of economy development levels, tourism resources, and transport facilities, etc.
A region with a developed economy can invest more in traffic facilities, infrastructure, and financial supports to tourism development. It can also have higher-level tourism management abilities and services which make this region more attractive. The six indispensable factors (food, accommodation, transportation, shopping, and recreation) of tourism all need economic support. Some regions with rich tourism resources and a backward economy cannot translate resource advantages into economic advantages due to lack of relative supporting facilities. The research showed that Guangzhou, Shenzhen, Zhuhai, and Foshan with developed economy reached coordinated development between tourism economy and transportation earlier than other cities in the PRD region.
As the basis of tourism economy development, the quality and quantity of tourism resources have played crucial roles in the development of tourism economy of a region. As the impacts of historical and geographical environment, the tourism resources in different areas have great differences. Among the 9 cities in the PRD region, the tourism resources of Guangzhou are the most abundant, while the tourism resources of Zhaoqing are the least. As it is shown in Table 4, the coupling coordination degree of Guangzhou in each year was the highest, while Zhaoqing was the lowest among the 9 cities.
Besides, to some extent, macro-policies, mega-events, and locations also impacted on coordinated development between tourism economy and transportation in the PRD region.
Macro-policy is not only the driving force for regional development, but also the weathervane. It has great influence on the development of the tourism economy system and transportation system, and the coupling coordination degrees of the two systems. The tourism economy subsystem, transportation subsystem, and their coupling coordination degrees develop in accordance with the 11th Five-year Plan (2006–2010) and the 12th Five-year Plan (2011–2015) of Guangdong Province. The 11th Five-year Tourism Plan of Guangdong province put forward that the PRD region should consider Guangzhou, Shenzhen, and Zhuhai as the core cities of tourism development, firstly realized tourism modernization, tourism internationalization, and tourism industrialization, became the guaranteed area of tourism sustainable development and the dominant area of tourist destinations in Guangdong Province. The 12th Five-year Tourism Plan proposed to build the PRD region as the metropolitan tourist area of Guangdong Province. The 12th Five-year Plan of comprehensive transportation system development proposed to promote transport integration and optimize the layout of a comprehensive transportation network in the PRD region. Before 2010, the coupling coordination degrees of most cities were under 0.5, their tourism economy and transportation were in imbalanced development. After 2011, tourism economy and transport in most of the cities went into balanced development.
Mega-events have far-reaching influences on the tourism development of the host country or city. In 2010, the 16th Asian Games was hosted in Guangzhou, co-organized in Dongguan, Foshan, and Shanwei. According to some materials, to host the 16th Asian Games, Guangzhou newly built a railway station and three intercity fast rail routes connected with Shenzhen, Zhuhai, and Foshan, which made it convenient and fast for the tourists from Hong Kong, Macau, and the PRD region. Guangzhou also built two expressways around the city and eight radial highways to the outside. So the tourist and passenger flow volume remarkably increased in 2010. As it is shown in Figure 2 and Figure 3, the synthetic values for both tourism economy and transportation of the 9 cities had remarkable increases in 2010. Meanwhile, all cities in the PRD region went into transitional development from imbalanced development since 2010.
From the view of spatial interaction, location is the basis of regional development and also a vital factor of the development of regional tourism. It not only influences the regional attractiveness for tourists, but also the accessibility of tourists to this region. Zhaoqing is located in the northwestern mountainous area of the PRD region, which makes it difficult to build helpful transport facilities and it is also inconvenient for tourist access. So, as we can see from Table 3 and Table 4, it is obvious to find that the synthetic values for tourism economy and transportation, coupling coordination degree of Zhaoqing are the lowest among the 9 cities in the PRD region, which clearly shows that the location of the city has great influence on the coordination between tourism economy and transportation.
5.2. Methodological Discussion
Coupling coordination degree model can objectively assess the coordinated development level of tourism economy and transportation of a region during a specific time period and analyze the change trends of coupling coordination degrees in space and time. The results of this model have higher reference value. However, the results just represent relative comparability in specific space and time, and cannot explain absolute coordinated developing levels of the interested objects. So there is straight comparability among different research results unless we standardize the interested subjects. By the limits of the specific condition of the PRD region, the evaluation model needs further improvement—by adding the quantities of starred hotels or tourism income per capita as the evaluation indicators of tourism economy, for example. As the PRD region is one of the important industrial regions, there are many extraneous workers, which may have an influence on some traffic indices like passenger capacity and passenger-kilometers, and finally result in high value for those indices.
6. Conclusions
This paper built the evaluation systems of tourism economy and transportation in the PRD region and adopted synthetic evaluation model and coupling coordination model to estimate the synthetic indices of tourism economy and transport system, and their coupling coordination degrees during 2005–2014 in the PRD region. From the view of synthetic development levels, tourism economy of the 9 cities in the PRD region showed prominent improvement during 2005–2014. The developing speed of Dongguan was faster, while those of Guangzhou, Shenzhen, and Zhuhai were relatively slower. The development of transport of the 9 cities in the PRD region showed wave-like raising trends. The raising speeds of Guangzhou and Shenzhen were relatively faster, while that of Dongguan was relatively slower. From the view of coupling coordination degree, all the 9 cities in the PRD region improved during 2005–2014. Guangzhou, Shenzhen, Zhuhai, Foshan, and Huizhou all went into primary coordinated development stage from imbalance development, Dongguan, Zhongshan, Jiangmen, and Zhaoqing went into transitional stages from imbalance stages. The coordinated development between tourism economy and transportation in the PRD region indicated that the central part of this region became coordinated faster than the flanks. From the further argument about the relationships between tourism economy and transportation, it was found that the coordination degrees for the cities with plentiful tourism resources and good transport facilities were higher than those for the cities with a lack of tourism resources and transport facilities. Based on the analysis above and the specific situation of the PRD region, it was found that the development level of urban economy, the difference of tourism resources, macro-policies, the 16th Asian Games in Guangzhou, and the location of the city have great impact on the coordinated development between tourism economy and transportation in the PRD region.
According to the above conclusions, some suggestions are presented for policy makers and tourism planners: (1) According to the focus of “Tourism integration planning in the PRD region”, Guangzhou and Shenzhen should continue to play the leading role in the integrative development of tourism in the PRD region and intensify its irradiation effects to Foshan, Jiangmen, Zhongshan, Huizhou, and Zhaoqing by such means as integrated routes, resources sharing, tourists flow sharing, etc.; (2) It is necessary to break restrictions of administrative boundaries in the development of tourism products and tourism route designs, realizing complementary development and differential development of tourism products among these cities. It is also necessary to promote the construction of traffic facilities across the cities in the PRD region; (3) To appeal to tourists and promote the development of tourism economy, the undeveloped cities like Zhongshan and Zhaoqing should deeply explore their tourism resources and plan some distinctive, highly participant tourism projects.
Acknowledgments
This study was supported by the Science and Technology Planning Project of Guangdong Province, China (No. 2015A020215025 and No. 2016A020228009). The authors would like to thank the editor and the anonymous reviewers for their helpful comments and suggestions.
Author Contributions
All authors conceived and designed the research. Qiuxia Zheng contributed to building models, analyzing the data, and writing this paper. Yaoqiu Kuang and Ningsheng Huang revised the content and reviewed the manuscript.
Conflicts of Interest
The authors declare no conflict of interest.
References
- Geng, S.; Xie, Y. Research on coupling relation between tourism economy and ecological environment of china’s sub-provincial cities. Urban Dev. Stud. 2013, 20, 91–95. [Google Scholar]
- Li, R.Y.; Huang, C.Z. Research on the impact of traffic infrastructure on reginal tourism development in china: Based on the evidence of threshold regression model. Tour. Sci. 2015, 29, 1–13. [Google Scholar]
- Gronau, W.; Kagermeier, A. Key factors for successful leisure and tourism public transport provision. J. Transp. Geogr. 2007, 15, 127–135. [Google Scholar] [CrossRef]
- Hall, D.R. Conceptualising tourism transport: Inequality and externality issues. J. Transp. Geogr. 1999, 7, 181–188. [Google Scholar] [CrossRef]
- Gutiérrez, A.; Miravet, D. The determinants of tourist use of public transport at the destination. Sustainability 2016, 8, 908. [Google Scholar] [CrossRef]
- Bel, G. How to compete for a place in the world with a hand tied behind your back: The case of air transport services in girona. Tour. Manag. 2009, 30, 522–529. [Google Scholar] [CrossRef]
- Prideaux, B. The role of the transport system in destination development. Tour. Manag. 2000, 21, 53–63. [Google Scholar] [CrossRef]
- Yu, F.F.; Hu, W.H.; Rong, H.F. Coordinated development about tourism economy and transportation in medium and small cities: Chizhou as example. Sci. Geogr. Sin. 2015, 52, 1116–1122. [Google Scholar]
- Wang, Y.M.; Ma, Y.F. Analysis of coupling coordination between urban tourism economy and transport system development: A case study of Xi’an city. J. Shanxi Norm. Univ. 2011, 39, 86–90. [Google Scholar]
- Hou, X.G. The tourist transportation planning of jiangxi province. Urban Plan. Forum 2001, 2, 65–68. [Google Scholar]
- Jing, Y.J.; Chen, J. Tourist traffic network planning in deqing city. Mod. Urban Res. 2006, 21, 51–54. [Google Scholar]
- Schiefelbusch, M.; Jain, A.; Schäfer, T.; Müller, D. Transport and tourism: Roadmap to integrated planning developing and assessing integrated travel chains. J. Transp. Geogr. 2007, 15, 94–103. [Google Scholar] [CrossRef]
- Yin, C.Z.; Lv, B. The plan of the regional tourism transportation of the three gorges region. Urban Plan. Forum. 2024, 2, 52–57. [Google Scholar]
- Guang, H.Z.; Shao, J.; Li, Y.R.; Bai, H.L. A travel behavior model for sightseeing travel. Urban Transp. Chin. 2005, 3, 59–62. [Google Scholar]
- Lew, A.; Mckercher, B. Modeling tourist movements: A local destination analysis. Ann. Tour. Res. 2006, 33, 403–423. [Google Scholar] [CrossRef]
- Mckercher, B.; Packer, T.; Yau, M.K.; Lam, P. Travel agents as facilitators or inhibitors of travel: Perceptions of people with disabilities. Tour. Manag. 2003, 24, 465–474. [Google Scholar] [CrossRef]
- Kozak, M. Repeaters’ behavior at two distinct destinations. Ann. Tour. Res. 2001, 28, 784–807. [Google Scholar] [CrossRef]
- Pritchard, M.P.; Havitz, M.E. Destination appraisal: An analysis of critical incidents. Ann. Tour. Res. 2006, 33, 25–46. [Google Scholar] [CrossRef]
- Thompson, K.; Schofield, P. An investigation of the relationship between public transport performance and destination satisfaction. J. Transp. Geogr. 2007, 15, 136–144. [Google Scholar] [CrossRef]
- Wang, Z.F. Tourists’ perception of urban public transport, satisfaction and behavioral intention in zhangjiajie city, China. Geogr. Res. 2014, 33, 978–987. [Google Scholar]
- Feng, L.X.; Yang, X.Z.; Yao, H.; LV, S. The impact of key transport facility on reginal tourism spatial structure: A case study of the trans-strait passage in the bohai strait. Econ. Geogr. 2011, 31, 189–194. [Google Scholar]
- Wang, H.Q.; Meng, X.J.; Du, H.B.; Sun, H.L. Analysis of tourism economic structure under constraints of transport axis in jinin province. Ecol. Econ. 2012, 4, 107–111. [Google Scholar]
- Yang, Z.Y.; Song, L.U. The impacts of traffic improvements on spatial structure of regional tourism: Case of southern Anhui. Sci. Geogr. Sin. 2013, 33, 806–814. [Google Scholar]
- Becken, S.; Simmons, D.G.; Frampton, C. Energy use associated with different travel choices. Tour. Manag. 2003, 24, 267–277. [Google Scholar] [CrossRef]
- Dickinson, J.E.; Calver, S.; Watters, K.; Wilkes, K. Journeys to heritage attractions in the uk: A case study of national trust property visitors in the south west. J. Transp. Geogr. 2004, 12, 103–113. [Google Scholar] [CrossRef]
- Peeters, P.; Szimba, E.; Duijnisveld, M. Major environmental impacts of european tourist transport. J. Transp. Geogr. 2007, 15, 83–93. [Google Scholar] [CrossRef]
- Sun, J.K.; Zhang, J.H.; Liu, Z.H.; Li, M.; Yang, L. Estimation model of carbon dioxide emissions by regional tourism transportation and empirical analysis of Nanjing and Huangshan cities, China. Acta Ecol. Sin. 2015, 35, 7161–7171. [Google Scholar]
- Xiao, X.; Zhang, J.; Lv, J.Y.; Zhong, S.E.; Yin, L.J. Analysis on spatial structure and scenarios of carbon dioxide emission from tourism transportaion. Acta Ecol. Sin. 2012, 32, 7540–7548. [Google Scholar] [CrossRef]
- Meng, W.Q.; Xu, L.Y.; Hu, B.B.; Zhou, J.; Wang, Z.L. Quantifying direct and indirect carbon dioxide emissions of the chinese tourism industry. J. Clean. Prod. 2016, 126, 586–594. [Google Scholar] [CrossRef]
- Lin, T.P. Carbon dioxide emissions from transport in Taiwan’s national parks. Tour. Manag. 2010, 31, 285–290. [Google Scholar] [CrossRef]
- Chen, X.; Li, Y.Z. Quantitavie evaluation of coordinated development of urban traffic and tourism: Taking dalian as an example. Tour. Trib. 2008, 23, 60–64. [Google Scholar]
- Zhu, T.X.; Lu, J.; Zhu, Z.G. Study on relationship between railway traffic and tour economic growth in china based on impulse response function. Railw. Transp. Econ. 2015, 37, 54–60. [Google Scholar]
- Yan, C.Y.; Lv, A.G.; Gao, J.H. Evaluation on relationship between inboud tourism and transportation bade on correspondence analysis method. Railw. Transp. Econ. 2013, 35, 62–66. [Google Scholar]
- Wang, Z.F.; Luo, Y. The transportation industry response mechanism driven by the tourism in Zhangjiajie. Sci. Geogr. Sin. 2015, 35, 1397–1403. [Google Scholar]
- Khadaroo, J.; Seetanah, B. The role of transport infrastructure in international tourism development: A gravity model approach. Tour. Manag. 2008, 29, 831–840. [Google Scholar] [CrossRef]
- Guo, J.; Wang, S.; Li, B.; Peng, F.; Wang, D. The spatial effect of harbin-dalian high-speed rail to the northeast city tourism economic link. Sci. Geogr. Sin. 2016, 36, 521–529. [Google Scholar]
- Jiang, L.Q.; Zhang, D.; Zhang, D.D. The construction of high-speed railway and the yangtze river delta area tourism integration development strategy. Commer. Res. 2012, 35, 193–202. [Google Scholar]
- Wu, X.L.; Zhao, L.X.; Ruan, J.Y.; Zhang, D.M. Current situation of tourism development and analysis of sustainable development in the pearl river delta. Spec. Zone. Econ. 2015, 28–32. [Google Scholar]
- Statistics Bureau of Guangdong Province. Guangdong Statistical Yearbook; China Statistics Press: Beijing, China, 2006–2015. Available online: http://www.gdstats.gov.cn/tjsj/gdtjnj/ (accessed on 15 May 2016).
- Guangzhou Municipal Statistics Bureau. Guangzhou Statistical Yearbook; China Statistics Press: Beijing, China, 2006–2015. Available online: http://data.gzstats.gov.cn/gzStat1/chaxun/njsj.jsp (accessed on 15 May 2016).
- Shenzhen Municipal Statistics Bureau. Shenzhen Statistical Yearbook; China Statistics Press: Beijing, China, 2006–2015. Available online: http://www.sztj.gov.cn/xxgk/tjsj/tjnj/ (accessed on 15 May 2016).
- Zhuhai Municipal Statistics Bureau. Zhuhai Statistical Yearbook; China Statistics Press: Beijing, China, 2006–2015. Available online: http://www.stats-zh.gov.cn/tjsj/tjnj/ (accessed on 15 May 2016).
- Zhongshan Municipal Statistics Bureau. Zhongshan Statistical Yearbook; China Statistics Press: Beijing, China, 2006–2015. Available online: http://www.zsstats.gov.cn/tjzl/tjnj/ (accessed on 15 May 2016).
- Jiangmen Municipal Statistics Bureau. Jiangmen Statistical Yearbook; China Statistics Press: Beijing, China, 2006–2015. Available online: http://tjj.jiangmen.gov.cn/tjsj/tjnj/ (accessed on 15 May 2016).
- Foshan Municipal Statistics Bureau. Foshan Statistical Yearbook; China Statistics Press: Beijing, China, 2006–2015. Available online: http://www.fstjj.gov.cn/tjnj/ (accessed on 15 May 2016).
- Zhaoqing Municipal Statistics Bureau. Zhaoqing Statistical Yearbook; China Statistics Press: Beijing, China, 2006–2015. Available online: http://tjj.zhaoqing.gov.cn/TJSJ/tjnj1/ (accessed on 15 May 2016).
- Dongguan Municipal Statistics Bureau. Dongguan Statistical Yearbook; China Statistics Press: Beijing, China, 2006–2015. Available online: http://tjj.dg.gov.cn/website/web2/art_list.jsp?columnId=10000 (accessed on 15 May 2016).
- Huizhou Municipal Statistics Bureau. Huizhou Statistical Yearbook; China Statistics Press: Beijing, China, 2006–2015. Available online: http://tongji.cnki.net/kns55/Navi/HomePage.aspx?id=N2015110106&name=YOSNF&floor=1 (accessed on 15 May 2016).
- State Statistics Bureau. China City Statistical Yearbook; China Statistics Press: Beijing, China, 2006–2015. Available online: http://tongji.cnki.net/kns55/Navi/HomePage.aspx?id=N2010042092&name=YZGCA&floor=1 (accessed on 15 May 2016).
- Meng, D.Y.; Shen, J.H.; Yu-Qi, L.U. Spatial coupling between transportation superiority and economy in central plain economic zone. Econ. Geogr. 2012, 32, 7–14. [Google Scholar]
© 2016 by the authors; licensee MDPI, Basel, Switzerland. This article is an open access article distributed under the terms and conditions of the Creative Commons Attribution (CC-BY) license (http://creativecommons.org/licenses/by/4.0/).