Abstract
Urbanization is intensifying congestion, emissions, and unequal mobility access in cities. This study aims to operationalize sustainability objectives—efficiency, environmental externalities, and service equity—in network-wide traffic system control. We propose SERL-H, a sustainability-aware hierarchical multi-agent reinforcement learning (MARL) controller. SERL-H separates fast intersection-level actuation from slower region-level coordination under a centralized-training decentralized-execution paradigm, and employs adaptive graph attention to capture time-varying interdependencies with bounded neighborhood communication. The learning reward explicitly balances delay/throughput, emissions/fuel, and an equity regularizer based on service dispersion across user groups. In a SUMO-based city-scale simulation with 100 signalized intersections, SERL-H reduces average delay from 45 s to 29 s and average travel time from 120 s to 88 s relative to fixed-time control, while increasing throughput and lowering total emissions (4800 kg to 3950 kg). A socio-economic assessment suggests higher annualized cost savings (e.g., $50.27 M/year to $65.91 M/year) and improved environmental quality indices. We also report, as supporting evidence, an optional sustainability-enhanced spatio-temporal graph predictor (SUT-GNN) that provides reliable short-horizon forecasts during peak-hour volatility.
1. Introduction
Urbanization is accelerating at an unprecedented rate globally, with projections indicating that by 2050, 68% of the world’s population will reside in urban areas [1]. This rapid growth places enormous pressure on urban infrastructures, particularly transportation systems. Urban mobility sits at the intersection of mobility demand, environmental externalities, and social well-being: traffic congestion increases travel delay and operating costs, stop-and-go driving elevates fuel consumption and pollutant emissions, and uneven service can disproportionately burden specific movements, neighborhoods, or vulnerable road users. Road transport is a major contributor to greenhouse gas emissions at the global scale [2], motivating traffic control formulations that treat efficiency, environmental impact, and equity as coupled objectives rather than afterthoughts.
Intelligent transportation systems (ITSs) provide a promising pathway to address these challenges by integrating sensing, communication, and control. Recent advances in artificial intelligence, particularly reinforcement learning (RL) and deep learning (DL), have demonstrated strong potential for adaptive traffic signal control. RL enables controllers to learn policies directly from interaction with traffic dynamics, while DL supports representation learning under high-dimensional and noisy observations. However, deploying learning-based control at the network scale remains challenging: many existing approaches optimize isolated intersections, rely on overly simplified coupling assumptions, or prioritize a single operational metric (e.g., delay) without explicitly accounting for environmental and equity-related impacts.
Urban traffic signal control is difficult for at least four reasons:
- A city network is inherently multi-agent: each intersection is both a local decision point and a component of a coupled system where upstream decisions propagate to downstream queues;
- Observations are often partial and noisy due to imperfect detectors and stochastic behavior;
- Scalable coordination requires communication-efficient representations of neighborhood context that generalize beyond small grids;
- Sustainability introduces multi-objective trade-offs, efficiency, emissions, and equity that are rarely embedded into standard RL formulations.
As shown in Figure 1, this work addresses three key research questions:
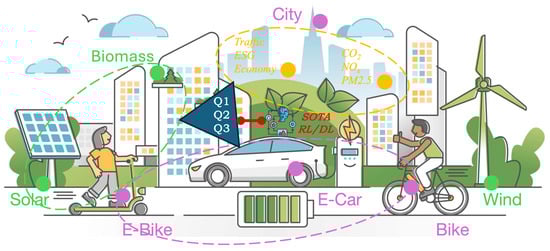
Figure 1.
The relationship of ITSs (purple) and USD (green represents new energy and orange represents sustainability factors). Three issues (RQ1, RQ2, and RQ3 in the triangle) with the state-of-the-art RL/DL-based models (red) arise from each other. Reproduced from Ref. [3] with permission.
- (RQ1)
- How can sustainability objectives be operationalized in network-wide signal control such that efficiency, emissions, and equity are jointly optimized?
- (RQ2)
- How can multi-agent RL be structured to scale to realistic urban networks under partial observability and limited communication?
- (RQ3)
- How can the impact of sustainability-aware ITSs be evaluated consistently across different spatial scales (network, corridor, intersection) and demand regimes?
To answer these questions, we propose an urban sustainable development (USD) oriented network-wide signal control framework whose primary contribution is a hierarchical multi-agent deep reinforcement learning controller, denoted as SERL-H. SERL-H follows a centralized-training decentralized-execution (CTDE) paradigm, combines region-level coordination with adaptive graph attention to encode time-varying network coupling under bounded neighborhood communication, and embeds sustainability objectives directly into the learning reward. In addition, when available, short-horizon traffic forecasts from an auxiliary spatio-temporal graph predictor, denoted as SUT-GNN, which can be appended as anticipatory features; importantly, SERL-H does not depend on any particular forecasting model and can operate with conventional sensing alone.
The contributions of this paper are as follows:
- Sustainability-aware hierarchical MARL for city-scale signal control: We propose SERL-H, a sustainability-aware hierarchical multi-agent RL formulation for network-wide traffic signal control. SERL-H integrates (i) region-level coordination to reflect heterogeneous urban contexts and (ii) adaptive GAT to capture dynamic interdependencies under bounded communication, while explicitly optimizing efficiency–environment–equity objectives;
- We develop a USD-oriented evaluation pipeline that reports operational performance together with environmental outcomes, equity-related service dispersion, and monetized socio-economic indicators, enabling interpretable assessment beyond travel-time-only metrics;
- We additionally report results for a sustainability-enhanced spatio-temporal graph predictor (SUT-GNN) to validate that reliable short-horizon anticipatory signals can be obtained during peak-hour volatility when such a module is enabled.
While SERL-H integrates hierarchy, graph attention, and sustainability-aware objectives, its conceptual novelty is not the use of any single component in isolation. Instead, SERL-H enables region-conditioned, sustainability-aware coordination under realistic constraints that existing graph-based MARL baselines do not explicitly address.
First, SERL-H introduces regional coordinators conditioned on socio-economic and environmental context vectors , which provide slow-timescale guidance that is explicitly heterogeneity-aware. This goes beyond neighborhood message passing by allowing coordination policies to adapt across urban subregions that differ in demand volatility, vulnerability exposure, and environmental burden.
Second, SERL-H operationalizes sustainability not only as a multi-objective reward but as a control-and-evaluation bundle: learning optimizes efficiency–environment–equity simultaneously Equation (9), while evaluation reports USD-oriented outcomes (Section 5.2.7) that translate operational gains into interpretable policy metrics.
Third, SERL-H is designed for bounded neighborhood communication and deployable execution: adaptive attention selects the most relevant neighbors dynamically, and feasibility is guaranteed through action masking, making the policy compatible with real signal-control constraints. In short, the contribution is a differentiated integration targeted at sustainability-aware, heterogeneity-aware, and deployment-aware network control, rather than an incremental architectural combination.
We also evaluate network-wide signal control in a calibrated microscopic simulation (SUMO) that is parameterized using real-world traffic statistics; we do not claim field deployment results in this study. We discuss practical deployment requirements (sensor noise, latency, safety fallback, and governance) in Section 7.
The remainder of this paper is structured as follows: Section 2 reviews related work. Section 3 presents the problem formulation and preliminaries. Section 4 details the proposed methodology. Section 5 describes the experimental setup and evaluation metrics. Section 6 reports experimental results. Section 7 discusses implications, trade-offs, and limitations. Finally, Section 8 concludes the paper and outlines future research directions.
2. Related Work
Research relevant to sustainability-oriented urban traffic signal control spans four closely related themes:
- ITSs and data-driven traffic management;
- Graph-based learning for spatio-temporal traffic modeling;
- RL for network-wide signal control with scalable coordination;
- Sustainability and socio-economic impact assessment for ITS interventions.
This section reviews each theme and positions our work.
2.1. ITS and Data-Driven Traffic Management
ITSs integrate sensing, communication, and control to improve mobility efficiency, safety, and environmental performance, including applications such as traffic signal control, traveler information services, and vehicle–infrastructure interaction [4,5,6,7,8]. Traditional signal control, including fixed-time or actuated strategies, can be effective under stable demand but often underperforms in modern cities where demand is non-stationary and multimodal interactions are frequent.
With the proliferation of sensing and connectivity, data-driven ITSs increasingly rely on DL to support adaptive decision-making [9,10,11,12]. These methods benefit from richer observations (counts, occupancy, trajectories) and enable more responsive signal strategies, but a recurring limitation is that many approaches remain local or weakly coupled and do not fully capture network interdependencies such as spillback propagation and corridor progression [13,14,15]. This motivates learning-based network control methods that explicitly model spatial coupling and coordination under realistic information constraints.
2.2. Graph-Based Model for Spatio-Temporal Traffic
Urban traffic exhibits strong spatial–temporal dependencies governed by road topology and signal interactions. Graph Neural Networks (GNN) provide a natural representation for traffic networks and have become widely used for traffic forecasting because they directly encode graph structure [16,17]. In traffic prediction, GNN-based spatio-temporal models often outperform purely statistical or sequence-based baselines by jointly modeling temporal dynamics and spatial correlations on road networks [18,19,20,21,22].
However, many of the GNN models in transportation focus on forecasting accuracy (e.g., flow/speed/arrival prediction) and do not explicitly incorporate sustainability objectives or downstream control decisions. In practice, prediction is valuable when it provides reliable anticipatory signals under peak-hour volatility and partial observability. Accordingly, in our framework, forecasting is treated as an auxiliary module: when enabled, the SUT-GNN supplies short-horizon arrival forecasts as additional features, but the proposed controller does not depend on any particular predictor.
2.3. RL for Traffic Signal Control: From Single-Agent to Multi-Agent
The RL has been increasingly adopted for adaptive traffic signal control because it learns policies directly from interaction with traffic dynamics. Early RL approaches were commonly formulated for a single intersection and later extended using deep RL techniques, enabling adaptive phase selection or timing strategies under stochastic demand [23]. Nevertheless, centralized or single-agent formulations face scalability challenges in large networks due to high-dimensional state/action spaces and difficult credit assignment.
To address these issues, Multi-Agent Reinforcement Learning (MARL) models each intersection as an agent, enabling decentralized execution and improving scalability [24,25,26,27]. Yet, independent learning can suffer from non-stationarity because each agent’s evolving policy changes the environment for others, often resulting in unstable training and limited coordination in strongly coupled networks. Coordination-focused MARL methods address this by designing explicit interaction mechanisms. For example, CoSLight employs graph-based coordination to improve multi-intersection performance [28], while MonitorLight incorporates monitoring and pressure-based signals for robust control [29]. Despite these advances, many MARL approaches still prioritize a narrow set of operational objectives (e.g., delay) and do not explicitly embed sustainability trade-offs (efficiency–emissions–equity) into the learning objective.
2.4. Scalable Coordination via Hierarchical RL and Graph-Based Representations
Two complementary directions are particularly relevant to city-scale deployment: hierarchy and graph-based representations.
Hierarchical RL (HRL). The HRL decomposes a complex task into multiple levels of abstraction, enabling learning at different temporal and spatial scales. In signal control, hierarchy is attractive because local phase switching requires fast reactions, while corridor progression and spillback mitigation benefit from slower, region-level coordination. Such decomposition can improve stability and sample efficiency by separating local actuation from broader coordination logic.
Graph-based RL. Graph representations can be integrated into RL to encode spatial coupling and allow policies to condition on structured neighborhood context. Attention mechanisms (e.g., Graph Attention Networks, GAT) are especially suitable because neighbor relevance is time-varying: upstream feeders dominate during surges, while downstream bottlenecks dominate under spillback [17]. In our work, this motivates an adaptive GAT encoder for control that weights neighbor influence dynamically under bounded neighborhoods and limited communication.
2.5. Sustainability and Socio-Economic Impact Assessment in ITSs
ITS interventions are increasingly evaluated not only by operational performance but also by their contribution to USD, typically framed by environmental, social, and economic pillars [30]. On the environmental side, smoother traffic and reduced idling can lower CO2 emissions and local pollutants [31,32,33]. On the social side, sustainability-oriented traffic management emphasizes equitable service and accessibility, including adequate consideration of pedestrians and other vulnerable users [34,35,36]. On the economic side, congestion causes substantial losses through time delays, operating costs, and reduced productivity, motivating evaluation frameworks that translate operational improvements into socio-economic benefits [37,38,39].
However, most learning-based signal control studies still report a limited metric set (e.g., average delay or throughput). Comprehensive USD-oriented evaluation that integrates environmental externalities, equity-related indicators, and monetized socio-economic outcomes remains comparatively rare [40,41,42]. This gap motivates evaluation pipelines that connect control outcomes with interpretable sustainability and socio-economic indicators.
2.6. Summary and Positioning of This Work
The literature suggests three gaps. First, GNN-based traffic prediction captures spatio-temporal dependencies well but is typically optimized for forecasting accuracy rather than sustainability-aware decision making [18,19,20]. Second, MARL-based signal control improves adaptivity but still struggles with stable, scalable coordination under partial observability and constrained communication [24,25,26,27]. Third, sustainability and socio-economic impacts are widely recognized but are seldom embedded into learning objectives and reported through a unified, USD-oriented evaluation framework [30].
To address these gaps, we propose SERL-H: a sustainability-aware hierarchical MARL controller that (i) uses region-level coordination to reflect heterogeneous urban contexts, (ii) uses adaptive GAT to encode dynamic interdependencies under bounded neighborhoods, and (iii) explicitly optimizes efficiency–environment–equity objectives. In addition, we report results for SUT-GNN, a sustainability-enhanced spatio-temporal graph predictor, as supporting evidence that reliable anticipatory signals can be obtained during peak-hour volatility when such a module is enabled.
Existing coordination-centric MARL controllers (e.g., pressure-based or graph-coordination methods) primarily target efficiency metrics such as delay and throughput, and may incorporate neighborhood information through fixed or learned message passing. Hierarchical MARL improves scalability by decomposing decisions across temporal or spatial levels, yet typical formulations do not explicitly condition coordination on region-level socio-economic heterogeneity, nor do they report policy-facing sustainability outcomes in a unified way.
SERL-H differs in two respects. Methodologically, SERL-H conditions region-level coordination signals on contextual vectors and combines them with adaptive attention under bounded neighborhoods, enabling time-varying coupling representation without requiring global communication. Substantively, SERL-H treats sustainability as a first-class objective and reports USD-oriented outcomes (environment, safety proxies, reliability, and socio-economic indicators) that are directly interpretable in planning and policy contexts. This positioning motivates our design choices and the evaluation protocol adopted in Section 5 and Section 6.
3. Problem Formulation and Preliminaries
This section formalizes sustainability-oriented urban traffic signal control as a hierarchical partially observable Markov game on a directed traffic network graph. We also define the sustainability-enhanced spatio-temporal predictor that can provide short-horizon anticipatory features for control, without changing the underlying control formulation.
3.1. Traffic Network as a Directed Graph with Region Partition
We represent an urban traffic network as a directed graph , where each node denotes a signalized intersection and each directed edge indicates directed connectivity (e.g., downstream influence or movement-to-movement coupling) from i to j. Let denote a bounded neighborhood of i (e.g., 1-hop neighbors or a truncated -hop set used for coordination).
To model socio-economic and environmental heterogeneity across the city, we further partition intersections into regions (in our city-scale setting, ). Each region k is associated with a slowly varying context vector capturing region-level attributes (e.g., economic activity proxies, environmental quality indicators). The region assignment of an intersection i is denoted by .
3.2. Traffic Dynamics and Partial Observability
Let be the latent global traffic state at control step t, including network-wide queues, densities, speeds, signal states, and pedestrian call states. Given the joint control action , the system evolves as:
Each intersection agent i receives a local observation generated from available sensing (loop detectors/cameras), controller status (current phase, elapsed green, clearance timers), and pedestrian calls:
where captures sensing noise and missing data. When available, Vehicle-to-Everything (V2X) probes can augment observations with trajectory-derived signals (e.g., speed, headway, and estimated arrivals), parameterized by a penetration rate .
3.3. Sustainability-Enhanced Prediction for Anticipatory Features
Urban traffic is non-stationary, especially during peak hours. To improve anticipatory decision-making under partial observability, we use a sustainability-enhanced spatio-temporal graph predictor to produce short-horizon forecasts (e.g., arrivals or inflows) at each intersection:
where denotes historical traffic measurements over a window of length T, and denotes sustainability-related covariates (e.g., emission proxies, vehicle composition indicators, environmental context signals). The predicted sequence is appended to the controller input as an additional feature block (see Section 4.2).
The proposed signal control framework does not rely on any particular forecasting architecture. When enabled, it provides extra anticipatory features; when disabled, the controller operates on standard sensing and V2X/context features only.
3.4. Hierarchical Partially Observable Markov Game
We model network-wide signal control as a hierarchical partially observable Markov game. Each intersection i is a local agent. At base control step t, agent i selects an action according to its policy based on an information state history :
For scalable coordination, each region k has a region-level coordinator operating at a slower timescale. Let L be the coordination interval in base steps and define the slow-time index,
At slow step , the coordinator outputs a coordination signal :
where aggregates information from intersections in region (e.g., pooled embeddings or summary statistics). Each local policy may condition on its region signal:
3.5. Action Space and Feasibility Constraints
We consider discrete phase control consistent with standard signal controllers. Each intersection i has a phase set and a time-varying feasible action set determined by operational constraints:
- Minimum/maximum green constraints;
- Inter-green clearance requirements (amber/all-red);
- Pedestrian clearance constraints.
We enforce feasibility through action masking so the executed action always satisfies controller rules:
3.6. Sustainability Objectives and Reward Design
The learning objective balances traffic efficiency, environmental impact, and equity-related regularization. We use a scalarized sustainability-aware reward:
where trade off the three objectives.
Efficiency term. We penalize network delay, queues, and stop-and-go behavior:
Environmental term. We penalize emissions and fuel consumption:
where can denote aggregate CO2 (or total emissions proxy) over the control interval, consistent with the environmental metrics reported in Section 5.2.7.
Equity term (regularizer). We penalize dispersion of service across user groups to discourage solutions that improve averages by systematically disadvantaging specific movements or vulnerable road users. Let be a predefined set of service groups. Each group index corresponds to a disaggregated service category, such as:
- An approach/movement group (e.g., eastbound through, northbound left);
- A road-class group (major vs. minor approaches);
- A mode group (vehicles vs. pedestrians, or pedestrian crossings by leg).
For each group g, define a group-level service measure at time t (e.g., average delay/waiting time, or normalized queueing burden for that group during the interval). The equity regularizer is:
A practical choice is the normalized standard deviation:
where avoids division by zero.
3.7. USD-Oriented Evaluation Metrics
In addition to reward components used for learning, we report the USD-oriented outcomes for evaluation: (i) Efficiency: average travel time (ATT), average delay (AVD), throughput (IT/Q), (ii) Environment: total emissions (TE/Etotal), fuel consumption (FC), (iii) Safety proxies: accident risk index (ARI), conflict rate (CR), and (iv) Socio-economic and reliability: economic productivity index (EPI), commute time variability (CTV), monetized cost savings , and environmental quality index (see Section 5.2.7).
3.8. Learning Objective
The objective is to learn hierarchical policies that maximize expected discounted return:
where is the discount factor.
3.9. Notation Summary
Table 1 summarizes the key notation used throughout the paper for readability and reproducibility.

Table 1.
Notation summary used in the formulation.
4. Methodology
We propose SERL-H, a sustainability-aware hierarchical MARL framework for network-wide traffic signal control. SERL-H integrates the following:
- Multi-source perception with optional SUT-GNN prediction features;
- An adaptive graph-attention encoder for dynamic interdependency modeling under bounded communication;
- Region-level hierarchical coordination for scalable cooperation across heterogeneous urban regions.
The controller is trained under CTDE paradigm with feasibility constraints enforced by action masking.
4.1. Framework Overview
As shown in Figure 2, at each base control step t, each intersection agent i fuses heterogeneous sensing signals (infrastructure detectors, controller status, pedestrian calls, V2X probes, and region context) into a structured feature vector . And a sustainability-enhanced spatio-temporal predictor provides short-horizon arrival or inflow forecasts that are appended as anticipatory features. A graph-attention encoder produces a neighbor-aware embedding , capturing dynamic coupling with bounded neighborhood size. In parallel, each region coordinator outputs a slow-timescale coordination signal (every L steps), conditioned on pooled region summaries and region context . The local actor then outputs a feasible signal action distribution over phases, with infeasible actions masked.
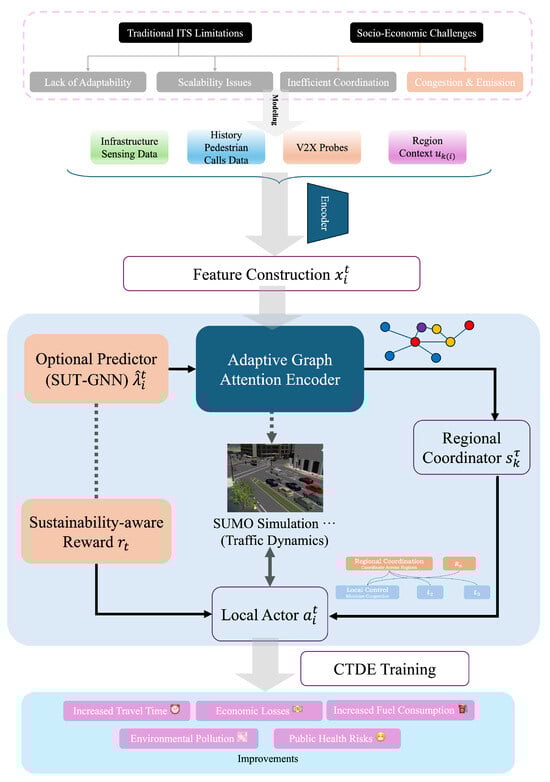
Figure 2.
Overall architecture of SERL-H. A region-level coordinator produces slow-timescale coordination signals that condition intersection-level controllers (CTDE). Local controllers encode bounded neighborhood interactions using an adaptive graph-attention encoder and output feasible phase actions via action masking. The sustainability-enhanced spatio-temporal predictor (SUT-GNN) is an optional auxiliary module trained offline; when enabled, it provides short-horizon forecasts/representations as additional perception features.
Figure 2 makes explicit the hierarchical roles (region coordinator vs. intersection controller), observed signals at each level, and the information flow used to decompose network-wide objectives into feasible intersection decisions. In our experiments, SUT-GNN is trained offline (Track I) and then frozen; SERL-H is trained and evaluated both with and without this auxiliary predictor to isolate its marginal contribution.
4.2. Perception and Feature Construction
4.2.1. Multi-Source Inputs
For each intersection i at time t, we collect:
- Queue-related features: lane/approach queue length, occupancy, density proxies;
- Demand/arrival proxies: counts, inflow estimates, turning-ratio proxies when available;
- Signal-phase features: current phase ID, elapsed green, clearance timers, min/max-green remaining;
- Pedestrian features: call states, waiting time proxies, crossing phase flags;
- V2X probe features (optional): probe speed/headway, inferred platoon arrival hints, penetration ;
- Region context: socio-economic/environmental context vector (slowly varying).
4.2.2. SUT-GNN Predictor
To avoid ambiguity, we emphasize that the sustainability-enhanced predictor SUT-GNN is an auxiliary module and is not required by SERL-H strictly. We append short-horizon arrival or inflow forecasts as Equation (3) as anticipatory features. Placement and interface. The predictor is an external module that takes historical traffic measurements and sustainability covariates as inputs and outputs a forecast vector for each intersection; the forecast is then concatenated into the controller input as Equation (15). Training scheme. In this study, the predictor is trained separately with supervised learning on historical data and then kept fixed (frozen) during SERL-H training and inference. This design avoids leakage across control policies and improves modularity. Why it is not redundant. The actor–critic networks approximate policies/value functions for control, but they do not necessarily learn calibrated short-horizon arrival forecasts under regime shifts. The prediction module is introduced to reduce reaction lag and partial observability (e.g., anticipating imminent platoons), and can be replaced by any other forecasting model or disabled if forecasts are unavailable or unreliable.
The final controller input is:
where denotes vector concatenation. If the predictor is disabled, is removed from .
4.2.3. Optional Filtering for Noisy Sensing
When sensing is noisy or incomplete, we optionally apply lightweight filtering (e.g., exponential smoothing or missing-value imputation) to stabilize queue/arrival estimates before forming . This step is optional and does not change the control architecture.
4.3. Adaptive GAT for Interdependency Modeling
To capture dynamic coupling among intersections with bounded communication, we compute a neighbor-aware embedding using adaptive GAT. First, we project local features:
For each neighbor , we compute attention logits and weights:
Here, is a trainable attention vector and denotes transpose, so maps a feature vector to a scalar compatibility score. encodes optional edge attributes (e.g., distance, travel time, turning ratios). The softmax ensures .
The neighbor embedding is:
where is a nonlinearity. Multi-head attention can be used for stability by concatenating or averaging heads. Communication constraints are respected by bounding (e.g., top- neighbors).
4.4. Hierarchical Multi-Agent Control with Regional Coordination
4.4.1. Region-Level Coordinators (Slow Timescale)
Each region k maintains a coordinator producing a coordination signal every L base steps. Using , we build a region summary by pooling intersection embeddings:
where can be derived from and (e.g., for any t with ). can be mean/max pooling or attention pooling.
4.4.2. Local Actors (Fast Timescale)
Each intersection i uses a local actor conditioned on local features, neighbor embedding, and region signal:
where is a discrete phase in . To ensure operational safety, we enforce feasibility by masking infeasible actions in .
4.5. CTDE Discrete Off-Policy Actor–Critic Learning
SERL-H is trained under CTDE, as shown in Figure 3 and Algorithm 1: training can use aggregated information (e.g., region summaries) to stabilize learning, while execution remains decentralized.
| Algorithm 1 Training with hierarchy and adaptive GAT (CTDE discrete actor-critic) |
|
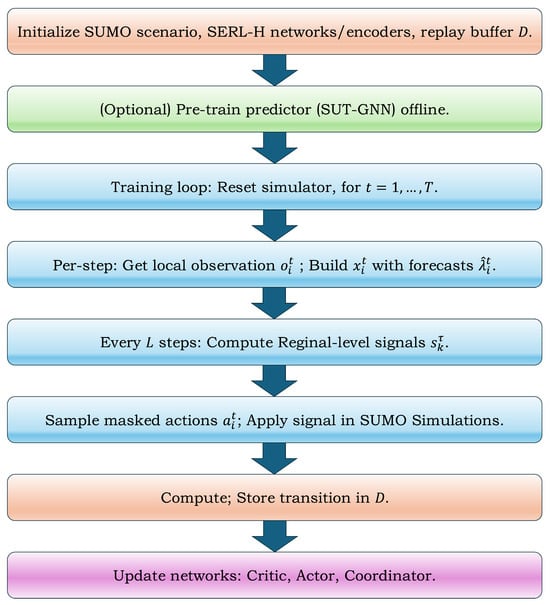
Figure 3.
Training and deployment pipeline of SERL-H. During training, the SUMO environment provides observations; optional SUT-GNN generates short-horizon features; region coordinator and intersection controllers act (with feasibility enforced by action masking); transitions are stored and used for off-policy updates under CTDE. Training stops when validation performance stabilizes or a maximum number of episodes is reached. During deployment, the learned policy runs in a real-time control loop at each decision step, using the same observation and masking logic, with the region coordinator updated at a slower interval.
4.5.1. Critic and TD Target
We learn a critic that evaluates the expected return for agent i:
Transitions are stored in a replay buffer . The critic is trained by minimizing a TD loss:
with TD target
where is a target critic. For discrete actions, the expectation can be computed exactly as a sum over feasible actions:
Feasible-action masking is applied consistently in both action sampling and the expectation above.
4.5.2. Actor Update
The actor outputs a categorical distribution over discrete phases. We update to maximize the expected critic value (optionally with entropy regularization):
4.5.3. Stabilization and Hyperparameters
We adopt replay buffer, target networks, and feasible-action masking. Hyperparameters follow the reported experimental setup, including discount factor , actor learning rate , critic learning rate , replay buffer size , and batch size B.
4.6. Constraint Handling and Safety
We enforce operational constraints through feasible-action masks . For a discrete phase policy, we mask infeasible actions by setting their logits to before sampling/selection. This guarantees that executed actions satisfy minimum/maximum green constraints, clearance times, and pedestrian safety rules.
4.7. Complexity and Scalability
With bounded neighborhoods, GAT scales as per step for embedding dimension d. Local actor inference is per intersection. Region coordination adds overhead proportional to region size and executes every L steps, making SERL-H tractable for city-scale subnetworks under sparse communication.
5. Experimental Setup
This section describes datasets, simulation environments, compared methods, evaluation metrics, and implementation details for assessing the proposed sustainability-oriented ITS framework. Signal control SERL-H is the main experimental track, while traffic prediction SUT-GNN is reported as an auxiliary track that provides supporting evidence when anticipatory features are enabled.
All empirical results in this manuscript are obtained in a SUMO-based microscopic simulation testbed (a digital-twin style evaluation) calibrated using real-world traffic demand patterns and network statistics. We do not claim field deployment results. To avoid ambiguity, we treat the real-world dataset as a source for demand generation, parameter calibration, and external realism checks, while all control interventions and counterfactual comparisons are executed in simulation under identical demand realizations. Section 7.7 further discusses practical deployment requirements (sensing reliability, latency, safety fallback, and compute constraints).
5.1. Evaluation Tracks and Scope
Track I (main): Sustainability-aware traffic signal control. We evaluate SERL-H in a microscopic simulation environment at city scale, reporting traffic efficiency, environmental outcomes (emissions/fuel), and USD-oriented indicators (safety proxies and socio-economic/reliability metrics).
Track II (auxiliary): Sustainability-enhanced traffic prediction. We evaluate a sustainability-integrated spatio-temporal graph predictor as an anticipatory module. This predictor is not required by SERL-H; it is reported to demonstrate that reliable short-horizon forecasts can be obtained when such features are appended to the controller input.
5.2. Track I (Main): City-Scale Signal Control Setup
5.2.1. Simulation Platform and Control Cycle
All signal control experiments are conducted in SUMO v1.20.0 with a microscopic time step and a signal control interval (an integer multiple of ). Each decision step selects a discrete phase subject to feasibility constraints (minimum/maximum green, clearance times, and pedestrian safety), enforced via action masking (Section 4.6).
5.2.2. City-Scale Network and Region Partition
The primary setting uses a 100-intersection grid network, partitioned into regions to represent heterogeneous socio-economic/environmental contexts. Each region is associated with a context vector (slowly varying), and each intersection i is assigned to region (Section 3).
5.2.3. Traffic Demand and Scenario Regimes
Traffic demand patterns are derived from real urban traffic data (Hengyang, Hunan Province, China; 2019–2023) used in the original studies and instantiated as SUMO flows/routes. We evaluate multiple demand regimes (e.g., low/medium/high, peak/off-peak, and surge-like perturbations) using the same demand-generation pipeline across all compared methods to ensure fairness.
5.2.4. Sensing, Partial Observability, and V2X Probes
Each intersection agent observes multi-source local signals (queues/occupancy/flows, controller status, pedestrian calls). V2X probe features are included via a penetration rate , contributing trajectory-derived statistics (e.g., speed/headway and inferred arrivals). Unless otherwise specified, SERL-H does not assume full observability and operates with bounded neighborhood communication.
5.2.5. Vehicle Classes and Emissions and Fuel Accounting
To reflect sustainability outcomes, the simulation includes heterogeneous vehicle types (e.g., passenger cars, buses, trucks) with corresponding emission classes. Environmental impacts are computed from microscopic trajectories by aggregating per-vehicle emissions and fuel consumption over time:
We report total emissions as a mass metric (e.g., kg over the evaluation horizon), which is consistent with SUMO trajectory-based emission outputs. If external air-quality station measurements (concentration, e.g., g/m3) are available, they are reported separately as external validation rather than being mixed into the simulator mass-based emission totals.
5.2.6. Baselines for Track I
We compare SERL-H against conventional and DL/RL-based baselines under matched simulator settings and evaluation horizons, and also as shown in Table 2:
Table 2.
Summary of compared signal control methods.
- FTC: Fixed-Time Control with pre-determined timing plans;
- ASC: Conventional Adaptive Signal Control baseline;
- IDQN: Independent DQN agents (no explicit coordination);
- MADQN: Multi-Agent DQN baseline with standard MARL training but without the proposed hierarchy/sustainability-aware design;
- MonitorLight [29]: representative MARL baseline emphasizing pressure/monitoring mechanisms;
- CoSLight [28]: representative MARL baseline using graph-based coordination;
- SERL-H: Hierarchical coordination + adaptive graph attention + sustainability-aware reward.
Rationale for baselines under sustainability objectives. We include both efficiency-oriented and coordination-centric MARL baselines because they represent widely used operational benchmarks in traffic signal control. However, since SERL-H optimizes a multi-objective sustainability reward, we avoid interpreting results solely through a single efficiency metric. Instead, we report a consistent set of efficiency, environmental, equity-proxy, and USD-oriented indicators for all methods, and we discuss trade-offs using multi-metric comparisons and sensitivity analysis on reward weights. This design clarifies when a method excels in efficiency-only terms versus when it provides more balanced sustainability outcomes.
5.2.7. Evaluation Metrics
We report metrics aligned with efficiency, environment, and USD-oriented outcomes. Learning uses the sustainability-aware reward in Equation (9), while reporting emphasizes interpretable outcomes.
- Traffic efficiency: Average Travel Time (ATT), mean travel time over trips in the evaluation set; Average Vehicle Delay (AVD), additional travel time relative to free-flow (s/veh); Intersection Throughput (IT), vehicles served per hour (veh/h);
- Environmental sustainability: Total emissions (TE), aggregated emission mass (e.g., kg over horizon), optionally by pollutant (CO2, NOx, PM). Fuel consumption (FC), aggregated fuel usage (e.g., L over horizon);
- USD-oriented indicators: Safety proxies, Accident Risk Index (ARI), Conflict Rate (CR), derived from trajectory-based surrogate safety measures (reported as indices/events per hour); Socio-economic and reliability: Economic Productivity Index (EPI), Commute Time Variability (CTV), and monetized cost savings as defined in Section 6 (with parameters explicitly stated where used).
Each training episode runs for a fixed simulated duration . A warm-up period is used to reduce initialization bias; metrics are computed after warm-up.
We train and evaluate using multiple random seeds. Results are reported as mean ± standard deviation across seeds. Where appropriate, confidence intervals can be estimated by bootstrap resampling.
5.2.8. Socio-Economic and Composite Indicators
We report two deployment-oriented composite indicators to support interpretation of sustainability trade-offs.
Monetized Cost Savings
For a given method, we compute monetized savings relative to a reference controller (e.g., fixed-time) by combining reductions in network-wide travel time, fuel, and emissions:
where is the reduction in total travel time (veh·h), is the reduction in total fuel consumption (L), and is the reduction in total CO2-equivalent emissions (t). Unit costs reflect the value of time, fuel price, and the social cost of carbon; Table 3 lists the parameterization used in our case study (values can be replaced by local policy settings).
Table 3.
Unit costs used to compute monetized indicators in Equation (27).
Environmental Quality Index
To summarize environmental improvements in a single interpretable score, we define a normalized index (0–100):
where are the corresponding values under the same reference controller, and weights satisfy (we use ). When pollutant-resolved emissions are available, can be replaced by a weighted sum across pollutants (e.g., CO2, NOx, PM) using the same normalization idea.
Each training episode runs for a fixed simulated duration . A warm-up period is used to reduce initialization bias; metrics are computed after warm-up.
We train and evaluate using multiple random seeds. Results are reported as mean ± standard deviation across seeds. Where appropriate, confidence intervals can be estimated by bootstrap resampling.
5.2.9. Implementation Details
Models are implemented in PyTorch v2.4.1 (Python v3.10.12). Training is performed on 8× NVIDIA GeForce RTX 4090D. Hyperparameters follow Section 4.5 (e.g., , learning rates, replay buffer size, and batch size). All baselines are run under matched simulation horizons and demand realizations.
5.2.10. Robustness Protocol
We evaluate robustness along two axes:
- (i)
- Scalability. We evaluate subnetworks or scaled networks with different numbers of intersections (e.g., 10/20/30) under the same generation pipeline and compare SERL-H with a strong coordination baseline (e.g., CoSLight) to assess performance degradation with network size.
- (ii)
- Demand variations. We test multiple demand regimes (low/medium/high, peak/off-peak, and surges) and compare SERL-H with a representative MARL baseline (e.g., MADQN) to assess robustness under non-stationary arrivals.
5.3. Track II (Auxiliary): Traffic Prediction Dataset and Protocol
5.3.1. Dataset and Features
The prediction task uses historical traffic time series collected in an urban area (Hengyang, Hunan Province, China; 2019–2023), paired with sustainability-related covariates. Each time step includes traffic variables (e.g., flow/speed/occupancy or their proxies) and sustainability variables derived from operations (e.g., emission-related covariates). The model predicts short-horizon future traffic targets over horizon H.
5.3.2. Train/Validation/Test Split and Temporal Stratification
Data are split into training/validation/test sets by time to avoid leakage. To assess regime stability, we additionally stratify errors by time segments (e.g., morning peak, evening peak, off-peak), consistent with Section 6.2.
5.3.3. Baselines for Track II
We compare the sustainability-enhanced predictor against representative baselines:
- HA: Historical Average;
- ARIMA: statistical time-series model;
- LSTM [43]: recurrent neural baseline;
- GCN [16]: graph convolutional baseline;
- DCRNN [19]: diffusion convolution recurrent neural network;
- ST-GCN [20]: spatio-temporal graph convolution baseline.
All models are evaluated on the same test set using MAE, RMSE, MAPE, and score.
- Mean Absolute Error (MAE) measures the average magnitude of errors between the predicted and actual values, without considering their direction. It is calculated as , where is the true value, is the predicted value, and N is the total number of observations;
- Root Mean Squared Error (RMSE) is another common metric for model evaluation, placing a higher penalty on larger errors compared to MAE. It is particularly useful when larger errors are less desirable. RMSE is defined as: ;
- Mean Absolute Percentage Error (MAPE) expresses prediction errors as a percentage, allowing for scale-independent comparison across different datasets or domains. It is calculated as ;
- R-squared () score, or coefficient of determination, indicates the proportion of the variance in the dependent variable that is predictable from the independent variables. It is computed as , where is the mean of the observed values. An score of 1 indicates perfect prediction, while a score of 0 indicates that the model performs no better than simply predicting the mean of the observed data.
6. Results
This section reports empirical results of the proposed framework. We emphasize that network-wide signal control (SERL-H) is the primary contribution and constitutes the main evaluation. Results are therefore organized as follows: (i) core city-scale control performance, robustness, and USD-oriented outcomes of SERL-H; and (ii) supporting evidence on an optional sustainability-enhanced predictor (SUT-GNN), reported to validate that reliable short-horizon anticipatory signals can be obtained when such a module is enabled. Importantly, SERL-H does not depend on SUT-GNN and can operate purely with multi-source sensing inputs.
6.1. Track I: SERL-H Control Performance
We evaluate SERL-H on a microscopic simulation setting with 100 signalized intersections arranged in a grid topology and partitioned into 10 regions. Baselines include FTC, ASC, IDQN, MADQN, and representative MARL methods MonitorLight [29] and CoSLight [28]. SERL-H follows the CTDE off-policy actor–critic instantiation described in Section 4.5.
6.1.1. Data Snapshot and Heterogeneity Context
Figure 4 illustrates a representative traffic data sample used to derive demand patterns and heterogeneity signals across regions, motivating region-aware coordination and sustainability-aware objective design.
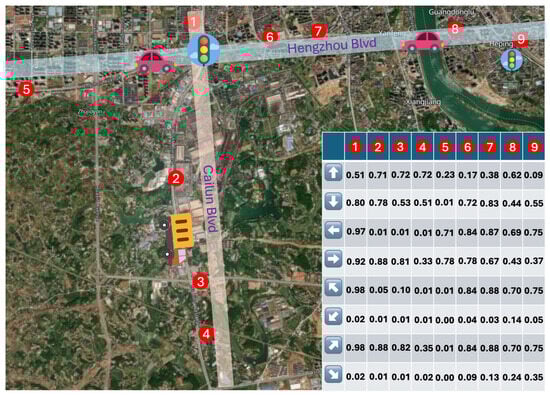
Figure 4.
Traffic data sample of the Hengyang city illustrating heterogeneous directional states across intersections. The matrix and arrows represent the probability distribution of the directional states of different vehicles at multiple intersections. Adapted with permission from Ref. [44] with permission.
6.1.2. Overall Performance
Table 4 summarizes average travel time (A), average delay (), throughput (Q), and total emissions (; reported as aggregated emission mass from microscopic trajectories, e.g., kg over the evaluation horizon).
Table 4.
Overall performance comparison of traffic control methods (mean ± std).
Against FTC, SERL-H reduces A from 120 s to 88 s (a decrease), reduces from 45 s to 29 s (a decrease), increases throughput from 1800 to 2250 veh/h (a increase), and reduces from 4800 kg to 3950 kg (a decrease). Against MADQN, SERL-H reduces delay by about (32→29) and reduces emissions by about (4050→3950), indicating that the proposed sustainability-aware coordination provides consistent gains beyond standard MARL.
Notably, CoSLight attains the smallest A in this comparison (87 s), while SERL-H achieves the best (lowest) and and the highest throughput, reflecting the intended sustainability-oriented trade-off.
6.1.3. Socio-Economic Impact (Annualized, Relative to a Reference Scenario)
To connect operational improvements to broader USD outcomes, we report annualized socio-economic indicators in Table 5. The “reduction/savings” metrics in this table are computed relative to an unoptimized business-as-usual reference scenario (e.g., the pre-intervention plan), not relative to FTC in Table 4. This avoids mixing two different reference frames.
Table 5.
Annualized socio-economic indicators (relative to a business-as-usual reference scenario).
6.1.4. Robustness and Scalability
We assess scalability by evaluating smaller subnetworks/scaled networks with 10, 20, and 30 intersections under the same generation pipeline. Table 6 shows that SERL-H maintains competitive travel time while consistently improving throughput and emissions compared to CoSLight as network size increases.
Table 6.
Scalability test results under increased network size (mean ± std).
We test low-, medium-, and high-demand regimes (including peak/off-peak patterns and surges). Table 7 shows that SERL-H consistently improves A, , and over MADQN across all demand levels, and the advantage remains under high demand where spillback risk is most pronounced.
Table 7.
Performance under different traffic demand levels (mean ± std).
6.1.5. USD-Oriented Outcomes (Broader Sustainability Profile)
To connect operational improvements with USD objectives, we report a broader set of USD-oriented indicators. Table 8 summarizes efficiency, environment, safety proxies, and socio-economic/reliability indicators. Units are explicitly indicated to avoid ambiguity (e.g., ATT/CTV in minutes; AVD in seconds; TE in kg; FC in liters).
Table 8.
USD-oriented performance metrics comparison across models (units shown in headers).
A key observation is that while a coordination-focused baseline (CoSLight) achieves the best raw travel-time metrics (ATT/AVD), SERL-H yields the best overall USD profile on emissions (TE), fuel (FC), safety proxies (ARI/CR), and socio-economic/reliability indicators (EPI/CTV), consistent with the sustainability-aware objective.
6.2. Track II: SUT-GNN Predictor Evaluation
SERL-H does not depend on any particular forecasting model. Nevertheless, when an anticipatory predictor is enabled as an auxiliary input, its accuracy and stability become practically relevant. We therefore report forecasting results for an instantiated sustainability-enhanced predictor to demonstrate that it can supply reliable short-horizon signals under peak-hour volatility.
6.2.1. Quantitative Forecasting Performance
Table 9 summarizes forecasting performance on the test set. Relative to ST-GCN, the sustainability-enhanced predictor reduces MAE from 4.55 to 3.85 (a decrease) and improves to 0.93.
Table 9.
Traffic prediction performance comparison. Reproduced from Ref. [45] with permission.
6.2.2. Ablation Study
To quantify component contributions, we remove sustainability covariates (w/o S), temporal modeling (w/o T), and spatial graph modeling (w/o G). Table 10 shows that removing any component increases error, confirming that accurate forecasting benefits from jointly modeling sustainability signals, temporal dynamics, and spatial interdependencies.
Table 10.
Ablation study for the sustainability-enhanced predictor.
6.3. Summary of Findings
Across city-scale control and robustness tests, SERL-H consistently improves delay, throughput, and emission outcomes and remains robust under scaling and demand shifts. The SUT-GNN predictor results provide supporting evidence that reliable short-horizon forecasts can be obtained when anticipatory features are enabled.
7. Discussion
This section interprets why the proposed sustainability-oriented ITS framework performs well, clarifies the trade-offs observed in the results, and discusses deployment considerations and limitations. We focus on signal control (SERL-H) as the primary contribution, while the forecasting module is discussed as an auxiliary component.
7.1. What Drives the Performance Gains in City-Scale Control
The overall results (Table 4) indicate that SERL-H achieves the best average delay and emissions while maintaining competitive travel time and the highest throughput among compared methods. We attribute these gains to two design elements.
- Structured coordination through hierarchy. Urban signal control is naturally multi-scale: local phase switching requires fast reaction, whereas corridor progression and spillback mitigation benefit from slower, region-level coordination. SERL-H explicitly separates these roles via regional coordination signals, which can reduce policy oscillations commonly observed in large-scale MARL and improve network consistency under strong coupling;
- Adaptive interdependency modeling with graph attention. Traffic coupling is time-varying: upstream feeders dominate under demand surges, while downstream bottlenecks dominate under spillback. The adaptive attention mechanism allows each intersection to reweight neighbor influence dynamically, rather than relying on fixed aggregation. This provides a compact yet expressive way to exploit network structure under bounded neighborhood communication.
7.2. Interpreting Trade-Offs: Efficiency vs. Sustainability Objectives
The USD-oriented evaluation (Table 8) reveals a consistent pattern: a coordination-centric baseline (CoSLight) achieves the best raw travel-time metrics (ATT/AVD), whereas SERL-H yields the strongest sustainability-oriented profile on emissions (TE), fuel consumption (FC), safety proxies (ARI/CR), and socio-economic/reliability indicators (EPI/CTV).
This is not a contradiction; it reflects the intended objective. Minimizing travel time alone can produce policies with more stop-and-go behavior, aggressive queue oscillations, or service reallocation that is suboptimal for emissions and safety proxies. By embedding environmental and (optionally) equity regularization into the learning objective Equation (9), SERL-H biases the policy toward smoother and more balanced operations, which can slightly relax the single objective of travel time while improving the broader USD dimensions that matter for sustainable development.
Practically, the results suggest that agencies can select reward weights to navigate the Pareto frontier between pure efficiency and sustainability. In deployments, these weights can be treated as transparent policy levers aligned with stakeholder priorities.
7.3. Deployment and Governance Considerations Beyond Technical Feasibility
Real-world adoption of sustainability-aware signal control depends on constraints that extend beyond algorithmic performance. First, data availability varies substantially across cities; SERL-H is designed to operate with conventional detector inputs, while V2X is optional and can be incorporated progressively as penetration increases. Second, deployment requires strict safety compliance and fail-safe operation: feasibility masks enforce signal constraints by design, and a conservative fallback plan (e.g., actuated or fixed-time logic) can be used when sensing degrades or communication drops.
Third, governance and institutional adoption require transparent policy levers. Reward weights provide an explicit mechanism for aligning controller behavior with stakeholder priorities (e.g., emission reduction targets, pedestrian service standards). Finally, interpretability tools (e.g., analyzing attention weights and region-level coordination signals) can support auditing and public accountability, which is essential under a sustainability framing.
7.4. Robustness Under Scaling and Demand Shifts
Robustness tests demonstrate two deployment-relevant properties.
Scalability. As network size increases (Table 6), SERL-H maintains advantages in throughput and emissions relative to a strong graph-coordination baseline. This supports the claim that bounded neighborhoods plus adaptive attention provide a scalable coordination mechanism without requiring full-network centralized information at execution time.
Demand variation. Under low-/medium-/high-demand regimes (Table 7), SERL-H consistently improves delay and emissions over MADQN. This is important because real cities experience recurrent peaks and surges. The combination of hierarchy and sustainability-aware regularization appears to discourage brittle policies that exploit narrow operating regimes but degrade under shifts.
7.5. Role of Optional SUT-GNN Prediction
SERL-H does not depend on any particular predictor. Nonetheless, the optional sustainability-enhanced SUT-GNN predictor (Section 6.2) can provide short-horizon anticipatory signals that reduce partial observability and reaction lag, particularly during volatile demand periods. When enabled, these forecasts can help local agents act preemptively (e.g., clearing an imminent platoon) rather than purely reacting to instantaneous queue proxies. Importantly, the design is modular: if forecasting is unavailable or unreliable, SERL-H remains executable using conventional sensing and bounded neighbor information.
7.6. Deployment Considerations
Several issues are central for real-world deployment.
Safety and compliance. The feasibility/action-masking mechanism enforces minimum/maximum green constraints, clearance times, and pedestrian safety rules at every step, making the learned policy compatible with standard controller constraints.
Data availability and privacy. The framework can operate under conventional sensing. V2X signals are treated as optional enhancements and can be aggregated in privacy-preserving ways (e.g., anonymized probes and edge processing), avoiding storage of raw trajectory identifiers.
Compute and maintainability. Training can be compute-intensive, but execution is lightweight: each intersection computes local/neighbor embeddings and selects an action using bounded neighborhood messages and low-dimensional region signals.
7.7. Limitations
Several limitations should be acknowledged.
Simulation-to-reality gap. Although microscopic simulation enables controlled evaluation, real traffic includes incidents, weather effects, enforcement, and behavioral shifts. Bridging the gap will require calibration with field data, domain randomization, and robust online adaptation.
Metric and proxy coverage. Emissions, fuel, and safety outcomes are estimated from simulation-based or surrogate measures. Real-world validation would benefit from integration with established emissions modeling pipelines and empirically grounded safety assessment.
Equity measurement scope. Our equity consideration is currently represented via service dispersion regularization (Section 3). Richer equity metrics grounded in accessibility, exposure, and demographic distributions should be explored in future work.
7.8. Future Work
Future research directions include the following:
- Field-oriented generalization: domain adaptation, continual learning, and calibration with streaming detector/probe data;
- Richer sustainability objectives: pollutant-specific modeling (NOx, PM), exposure-aware equity, and multimodal accessibility;
- Incident-aware control: integrating anomaly detection and robust policies for crashes, roadworks, and severe weather disruptions;
- Joint multimodal coordination: coupling signal control with transit priority, pedestrian safety strategies, and freight constraints;
- Interpretability and governance: attention–weight diagnostics, counterfactual evaluation, and policy-facing dashboards for transparent trade-offs.
Overall, the results support the conclusion that hierarchical, attention-based multi-agent control with sustainability-aware objectives can deliver robust improvements beyond pure efficiency optimization, enabling a practical pathway toward cleaner, safer, more reliable, and more equitable urban mobility.
8. Conclusions
This paper investigated how Intelligent Transportation Systems (ITSs) can be optimized toward Urban Sustainable Development (USD) objectives when traffic efficiency, environmental externalities, and socio-economic considerations must be jointly addressed. We proposed a sustainability-oriented, city-scale signal control framework, SERL-H, which integrates hierarchical multi-agent reinforcement learning (MARL) with adaptive graph attention to enable scalable coordination under partial observability and heterogeneous regional contexts. A sustainability-enhanced spatio-temporal graph predictor was also evaluated as an auxiliary anticipatory module, but the control framework itself does not depend on any specific forecasting model.
Empirical results support three main conclusions.
First, sustainability-aware hierarchical MARL improves city-scale control outcomes beyond conventional and representative MARL baselines. In a 100-intersection grid network partitioned into 10 socio-economically heterogeneous regions, SERL-H reduces average travel time and delay while increasing throughput and lowering total emissions relative to fixed-time and conventional adaptive control, and it further improves over independent and standard multi-agent deep RL baselines (Table 4). These gains translate into measurable socio-economic benefits, including increased annualized cost savings and improved environmental quality indices (Table 5).
Second, the framework delivers robust USD-oriented improvements, highlighting the importance of multi-objective optimization. While a coordination-centric baseline can achieve the best raw travel-time metrics in USD comparisons, SERL-H provides the strongest overall profile on emissions and fuel, safety proxies, and reliability/socio-economic indicators (Table 8, Table 9 and Table 10). The meta-analysis indicates that these improvements are statistically significant and consistent across simulation runs, supporting the view that ITS should be evaluated as a multi-objective socio-technical intervention rather than a single-metric optimization problem.
Third, the proposed coordination design scales and remains effective under demand shifts. Scalability tests show that SERL-H maintains advantages as the network size increases, and demand-variation experiments confirm that benefits persist across low/medium/high demand regimes (Table 6 and Table 7). These findings are important for real-world deployment, where traffic demand is non-stationary, and network coupling effects intensify during peaks.
Finally, we reported results for a sustainability-enhanced predictor to demonstrate that reliable short-horizon signals can be obtained when anticipatory features are enabled. This module can reduce reaction lag under volatile conditions, but SERL-H remains deployable with conventional sensing and bounded neighborhood communication.
Future work should prioritize field-oriented generalization and governance: bridging the simulation-to-reality gap through calibration and online adaptation; enriching sustainability objectives with pollutant-specific, exposure-aware, and accessibility-grounded equity metrics; incorporating incident-aware robust control; and developing interpretable, policy-facing tools to support transparent trade-offs among efficiency, environment, and equity. Taken together, this work provides a principled and scalable pathway for deploying sustainability-aware learning-based signal control to advance cleaner, safer, more reliable, and more equitable urban mobility.
Author Contributions
Conceptualization, Q.C. and P.T.; methodology, J.L.; software, J.L.; validation, Q.C. and J.L.; formal analysis, J.L.; investigation, P.T.; resources, Q.C. and J.L.; data curation, Q.C.; writing—original draft preparation, Q.C.; writing—review and editing, J.L.; visualization, J.L.; supervision, P.T.; project administration, P.T.; funding acquisition, Q.C. and P.T. All authors have read and agreed to the published version of the manuscript.
Funding
This research received no external funding.
Institutional Review Board Statement
Not applicable.
Informed Consent Statement
Not applicable.
Data Availability Statement
The datasets used in this work are publicly accessible as follows: the daily multi-sector socio-economic data are available at: https://sthjj.hengyang.gov.cn/ (accessed on 20 December 2025). SUMO (Simulation of Urban MObility) platform v1.20.0 and its dataset can be accessed at the official repository. The traffic flow, vehicle speed, road capacity, and signal timing detail data from 2019 to 2023 of Hengyang, Hunan Province, China, processed data, and derived results supporting the findings of this study are available from the author upon reasonable request.
Acknowledgments
We thank the anonymous reviewers for their helpful comments and suggestions that substantially helped in improving the paper. This work received partial support from the Institute for Industrial Innovation and Finance (IIIF), Tsinghua University. During the preparation of this manuscript, the authors used ChatGPT 5.2 for the purposes of polishing the language. The authors have reviewed and edited the output and take full responsibility for the content of this publication.
Conflicts of Interest
Author Qian Cao was employed by the company Mogo Co., Ltd. The remaining authors declare that the research was conducted in the absence of any commercial or financial relationships that could be construed as a potential conflict of interest.
References
- Gerland, P.; Raftery, A.E.; Ševčíková, H.; Li, N.; Gu, D.; Spoorenberg, T.; Alkema, L.; Fosdick, B.K.; Chunn, J.; Lalic, N.; et al. World population stabilization unlikely this century. Science 2014, 346, 234–237. [Google Scholar] [CrossRef]
- Khalili, S.; Rantanen, E.; Bogdanov, D.; Breyer, C. Global transportation demand development with impacts on the energy demand and greenhouse gas emissions in a climate-constrained world. Energies 2019, 12, 3870. [Google Scholar] [CrossRef]
- Cao, Q.; Li, J.; Trucco, P. Intelligent Transportation Aiding Urban Sustainability: An Empirical Analysis with Reinforcement and Deep Learning. In Proceedings of the 2025 28th International Conference on Computer Supported Cooperative Work in Design (CSCWD), Compiegne, France, 5–7 May 2025; IEEE: Piscataway, NJ, USA, 2025; pp. 7–12. [Google Scholar]
- Huang, W.; Zhang, P.; Xu, D.; Hu, J.; Yuan, Y. Sector-Specific Carbon Emission Forecasting for Sustainable Urban Management: A Comparative Data-Driven Framework. Sustainability 2026, 18, 19. [Google Scholar] [CrossRef]
- Li, J.; Yu, C.; Shen, Z.; Su, Z.; Ma, W. A survey on urban traffic control under mixed traffic environment with connected automated vehicles. Transp. Res. Part C Emerg. Technol. 2023, 154, 104258. [Google Scholar] [CrossRef]
- Bastarianto, F.F.; Hancock, T.O.; Choudhury, C.F.; Manley, E. Agent-based models in urban transportation: Review, challenges, and opportunities. Eur. Transp. Res. Rev. 2023, 15, 19. [Google Scholar] [CrossRef]
- Njoku, J.N.; Nwakanma, C.I.; Amaizu, G.C.; Kim, D.S. Prospects and challenges of Metaverse application in data-driven intelligent transportation systems. IET Intell. Transp. Syst. 2023, 17, 1–21. [Google Scholar] [CrossRef]
- Oladimeji, D.; Gupta, K.; Kose, N.A.; Gundogan, K.; Ge, L.; Liang, F. Smart transportation: An overview of technologies and applications. Sensors 2023, 23, 3880. [Google Scholar] [CrossRef]
- Akhtar, M.; Moridpour, S. A review of traffic congestion prediction using artificial intelligence. J. Adv. Transp. 2021, 2021, 8878011. [Google Scholar] [CrossRef]
- Mall, P.K.; Narayan, V.; Pramanik, S.; Srivastava, S.; Faiz, M.; Sriramulu, S.; Kumar, M.N. FuzzyNet-Based Modelling Smart Traffic System in Smart Cities Using Deep Learning Models. In Handbook of Research on Data-Driven Mathematical Modeling in Smart Cities; IGI Global: Hershey, PA, USA, 2023; pp. 76–95. [Google Scholar]
- Tan, X.; Wang, C.; Zhang, Z.; Ping, Z.; Pan, J.; Shan, H.; Li, R.; Chi, M.; Cui, Z. Enhancing Sustainable Intelligent Transportation Systems Through Lightweight Monocular Depth Estimation Based on Volume Density. Sustainability 2025, 17, 11271. [Google Scholar] [CrossRef]
- Jabeur, N. Toward Sustainable Mobility: A Hybrid Quantum–LLM Decision Framework for Next-Generation Intelligent Transportation Systems. Sustainability 2025, 17, 11336. [Google Scholar] [CrossRef]
- Zhang, J.; Wang, F.Y.; Wang, K.; Lin, W.H.; Xu, X.; Chen, C. Data-driven intelligent transportation systems: A survey. IEEE Trans. Intell. Transp. Syst. 2011, 12, 1624–1639. [Google Scholar] [CrossRef]
- Vadivel, G.; Hussain, M.J.M.; Sangeetha, S.T. Smart transportation systems: IoT-connected wireless sensor networks for traffic congestion management. Int. J. Adv. Signal Image Sci. 2023, 9, 40–49. [Google Scholar] [CrossRef]
- Abdel-Aty, M.; Zheng, O.; Wu, Y.; Abdelraouf, A.; Rim, H.; Li, P. Real-time big data analytics and proactive traffic safety management visualization system. J. Transp. Eng. Part A Syst. 2023, 149, 04023064. [Google Scholar] [CrossRef]
- Kipf, T.N.; Welling, M. Semi-supervised classification with graph convolutional networks. arXiv 2016, arXiv:1609.02907. [Google Scholar]
- Veličković, P.; Cucurull, G.; Casanova, A.; Romero, A.; Lio, P.; Bengio, Y. Graph attention networks. arXiv 2017, arXiv:1710.10903. [Google Scholar]
- Guo, S.; Lin, Y.; Feng, N.; Song, C.; Wan, H. Attention based spatial-temporal graph convolutional networks for traffic flow forecasting. In Proceedings of the AAAI Conference on Artificial Intelligence, Honolulu, HI, USA, 29–31 January 2019; Volume 33, pp. 922–929. [Google Scholar]
- Li, Y.; Yu, R.; Shahabi, C.; Liu, Y. Diffusion convolutional recurrent neural network: Data-driven traffic forecasting. arXiv 2017, arXiv:1707.01926. [Google Scholar]
- Yan, S.; Xiong, Y.; Lin, D. Spatial temporal graph convolutional networks for skeleton-based action recognition. In Proceedings of the AAAI Conference on Artificial Intelligence, New Orleans, LA, USA, 2–7 February 2018; Volume 32. [Google Scholar]
- Zhang, W.; Zhang, L.; Han, J.; Liu, H.; Fu, Y.; Zhou, J.; Mei, Y.; Xiong, H. Irregular Traffic Time Series Forecasting Based on Asynchronous Spatio-Temporal Graph Convolutional Networks. In Proceedings of the 30th ACM SIGKDD Conference on Knowledge Discovery and Data Mining, Barcelona, Spain, 25–29 August 2024; pp. 4302–4313. [Google Scholar]
- Zheng, C.; Fan, X.; Pan, S.; Jin, H.; Peng, Z.; Wu, Z.; Wang, C.; Philip, S.Y. Spatio-temporal joint graph convolutional networks for traffic forecasting. IEEE Trans. Knowl. Data Eng. 2023, 36, 372–385. [Google Scholar] [CrossRef]
- Mei, H.; Lei, X.; Da, L.; Shi, B.; Wei, H. Libsignal: An open library for traffic signal control. Mach. Learn. 2024, 113, 5235–5271. [Google Scholar] [CrossRef]
- Mushtaq, A.; Haq, I.U.; Sarwar, M.A.; Khan, A.; Khalil, W.; Mughal, M.A. Multi-agent reinforcement learning for traffic flow management of autonomous vehicles. Sensors 2023, 23, 2373. [Google Scholar] [CrossRef] [PubMed]
- Chen, D.; Hajidavalloo, M.R.; Li, Z.; Chen, K.; Wang, Y.; Jiang, L.; Wang, Y. Deep multi-agent reinforcement learning for highway on-ramp merging in mixed traffic. IEEE Trans. Intell. Transp. Syst. 2023, 24, 11623–11638. [Google Scholar] [CrossRef]
- Kolat, M.; Kővári, B.; Bécsi, T.; Aradi, S. Multi-agent reinforcement learning for traffic signal control: A cooperative approach. Sustainability 2023, 15, 3479. [Google Scholar] [CrossRef]
- Wu, T.; Zhou, P.; Liu, K.; Yuan, Y.; Wang, X.; Huang, H.; Wu, D.O. Multi-agent deep reinforcement learning for urban traffic light control in vehicular networks. IEEE Trans. Veh. Technol. 2020, 69, 8243–8256. [Google Scholar] [CrossRef]
- Ruan, J.; Li, Z.; Wei, H.; Jiang, H.; Lu, J.; Xiong, X.; Mao, H.; Zhao, R. Coslight: Co-optimizing collaborator selection and decision-making to enhance traffic signal control. In Proceedings of the 30th ACM SIGKDD Conference on Knowledge Discovery and Data Mining, Barcelona, Spain, 25–29 August 2024; pp. 2500–2511. [Google Scholar]
- Fang, Z.; Zhang, F.; Wang, T.; Lian, X.; Chen, M. MonitorLight: Reinforcement learning-based traffic signal control using mixed pressure monitoring. In Proceedings of the 31st ACM International Conference on Information & Knowledge Management, Atlanta, GA, USA, 17–21 October 2022; pp. 478–487. [Google Scholar]
- Lv, Z.; Shang, W. Impacts of intelligent transportation systems on energy conservation and emission reduction of transport systems: A comprehensive review. Green Technol. Sustain. 2023, 1, 100002. [Google Scholar] [CrossRef]
- Sun, X.; Xiang, P.; Ngoduy, D.; Zhang, B. Can Transportation Network to the Sustainable Development of Urban Agglomeration Spatial Structures? Available online: https://ssrn.com/abstract=4930283 (accessed on 2 February 2026).
- Guo, Y.; Zhang, Q.; Lai, K.K.; Zhang, Y.; Wang, S.; Zhang, W. The impact of urban transportation infrastructure on air quality. Sustainability 2020, 12, 5626. [Google Scholar] [CrossRef]
- Sultana, S.; Salon, D.; Kuby, M. Transportation sustainability in the urban context: A comprehensive review. Urban Geogr. 2019, 40, 279–308. [Google Scholar] [CrossRef]
- Shah, P.; Gupta, A.; Bhatt, K. Public transport as a means of sustainable development: Reasons for adoption and non-adoption. World Rev. Entrep. Manag. Sustain. Dev. 2024, 20, 355–373. [Google Scholar] [CrossRef]
- Carlton, G.; Sultana, S. Transport equity considerations in electric vehicle charging research: A scoping review. Transp. Rev. 2023, 43, 330–355. [Google Scholar]
- Li, Z.; Liu, A.; Shang, W.L.; Li, J.; Lu, H.; Zhang, H. Sustainability assessment of regional transportation: An innovative fuzzy group decision-making model. IEEE Trans. Intell. Transp. Syst. 2023, 24, 15959–15973. [Google Scholar] [CrossRef]
- Zhang, T.; Niu, C.; Nair, D.J.; Robson, E.N.; Dixit, V. Transportation resilience optimization from an economic perspective at the pre-event stage. Sustain. Anal. Model. 2023, 3, 100027. [Google Scholar] [CrossRef]
- Chen, Z.; Rose, A. Economic resilience to transportation failure: A computable general equilibrium analysis. Transportation 2018, 45, 1009–1027. [Google Scholar] [CrossRef]
- Poliak, M.; Poliakova, A.; Zhuravleva, N.A.; Nica, E. Identifying the impact of parking policy on road transport economics. Mob. Netw. Appl. 2023, 28, 203–210. [Google Scholar] [CrossRef]
- Eppenberger, N.; Richter, M.A. The opportunity of shared autonomous vehicles to improve spatial equity in accessibility and socio-economic developments in European urban areas. Eur. Transp. Res. Rev. 2021, 13, 32. [Google Scholar] [CrossRef]
- Tran, C.N.; Tat, T.T.H.; Tam, V.W.; Tran, D.H. Factors affecting intelligent transport systems towards a smart city: A critical review. Int. J. Constr. Manag. 2023, 23, 1982–1998. [Google Scholar] [CrossRef]
- Neverauskienė, L.O.; Novikova, M.; Kazlauskienė, E. Factors determining the development of intelligent transport systems. Bus. Manag. Econ. Eng. 2021, 19, 229–243. [Google Scholar] [CrossRef]
- Hochreiter, S.; Schmidhuber, J. Long Short-Term Memory. Neural Comput. 1997, 9, 1735–1780. [Google Scholar] [CrossRef]
- Cao, Q.; Li, J.; Trucco, P. Optimizing Intelligent Transportation Systems with Multi-agent Reinforcement Learning: A Socio-economic Impact Assessment. In Proceedings of the International Conference on Intelligent Transport Systems, Pisa, Italy, 5–6 December 2024; Springer: Berlin/Heidelberg, Germany, 2024; pp. 209–224. [Google Scholar]
- Cao, Q.; Li, J.; Trucco, P. Modeling Interdependencies in Intelligent Traffic Systems and Sustainable Urban Development Using Graph Neural Networks. In Proceedings of the International Symposium on Intelligent Technology for Future Transportation, Helsinki, Finland, 19–21 October 2024; Springer: Berlin/Heidelberg, Germany, 2024; pp. 406–415. [Google Scholar]


Disclaimer/Publisher’s Note: The statements, opinions and data contained in all publications are solely those of the individual author(s) and contributor(s) and not of MDPI and/or the editor(s). MDPI and/or the editor(s) disclaim responsibility for any injury to people or property resulting from any ideas, methods, instructions or products referred to in the content. |
© 2026 by the authors. Licensee MDPI, Basel, Switzerland. This article is an open access article distributed under the terms and conditions of the Creative Commons Attribution (CC BY) license.