Abstract
Reducing urban–rural income inequality is a central objective of sustainable development and a critical challenge for inclusive growth in emerging economies. This study examines the impact of the digital economy on urban–rural income inequality in China. Using panel data across 279 cities in China and Chinese Household Income Project (CHIP) data, we find that the digital economy significantly widens urban–rural income inequality. Specifically, digital industries and innovations are the main drivers, contrasting with inclusive infrastructure. Although we observe a positive association between the digital economy and educational attainment among rural residents, such improvements do not appear to be fully translated into higher income. One possible explanation is that the digital economy is more effective in alleviating skill mismatch among urban residents than among their rural counterparts. Finally, our results suggest that Public Employment Services may help mitigate this negative effect through channels such as fiscal subsidies and improving skills training accessibility. Our findings highlight the need for caution regarding the inequality implications of digital economy development in emerging economies and underscore the crucial role of institutional arrangements in promoting socially sustainable and inclusive development.
1. Introduction
The United Nations 2030 Agenda for Sustainable Development identifies poverty eradication and the reduction in income inequality as core global objectives (SDGs 1 and 10) [1]. Specifically, item 10 of the SDGs aims to reduce inequalities, and the urban–rural income inequality is a key manifestation of inequality in China [2]. In this context, persistent urban–rural income disparities pose a major challenge to social sustainability and inclusive development in the Chinese economy. As China’s digital economy accelerates, structural issues between urban and rural incomes have become evident. From 2008 to 2019, the urban–rural per capita disposable income gap widened progressively. Figure 1 shows that the absolute income gap widened from 8733 CNY in 2008 to 24,061 CNY in 2019; simultaneously, the income ratio remaining high at 2.6:1—well above the widely accepted threshold of 1.7:1 [3]. This persistent inequality poses challenges to economic growth, social equity, and rural revitalization. Achieving common prosperity requires a more equitable distribution of the gains from digital economic development.
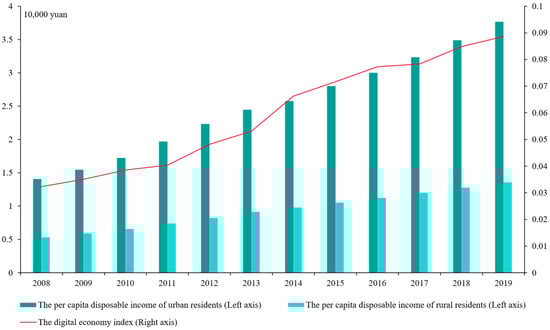
Figure 1.
Times trends in the per capita disposable income and the digital economy index. The bar chart reports the annual average per capita disposable income of urban and rural residents (in 10,000 yuan) from 2008 to 2019. The data are drawn from the China Statistical Yearbook, and all income values are deflated using 2008 as the base year. The line chart reports the annual average value of the digital economy index from 2008 to 2019, which is constructed by the authors based on city-level indicators (See Section 3.2.2).
As a new economic paradigm, the digital economy presents both opportunities and challenges for promoting inclusive and sustainable development, particularly through its effects on urban–rural income inequality. It focuses on both efficiency and inclusiveness through integration with other economic forms, expanding employment opportunities and boosting residents’ incomes [4]. Nevertheless, persistent constraints including lagging digital infrastructure in rural areas and limited digital capabilities among rural residents remain significant barriers to realizing these benefits [5]. Therefore, it is essential to investigate whether and how the digital economy influences urban–rural income gap. Research on these issues can deepen the understanding of the digital economy’s income distribution effects, thus promoting more inclusive growth in emerging economies.
There are growing discussions on the distributional consequences of digital development, although no agreement has been achieved. Several studies argue that the digital economy significantly reduces urban–rural income gap, attributing this to increased urbanization and industrial upgrading [6], improved factor allocation efficiency [7], financial development [8], and human capital accumulation [9]. These structural transformations create employment and entrepreneurial opportunities for surplus rural labor, thereby increasing farmers’ incomes [10]. Conversely, some research cites the uneven digital development [11], skill-biased technological progress [12], employment in the information service industry [13], and limited integration of digital technologies in rural areas [14], thereby widening income gaps. These findings reflect persistent disparities in digital infrastructure and human capital between urban and rural areas.
While the literature examining the effects of the digital economy on urban–rural income inequality is extensive, several limitations remain. First, some studies equate digital-driven rural income growth with narrowed urban–rural income inequality, while overlooking the possibility that urban incomes may rise at a faster pace. Second, most of the studies investigate urban–rural income inequality from the macro perspective. This limitation highlights the need for future research to employ micro-level datasets encompassing both urban and rural demographics, enabling more credible causal inference. Third, with regard to the digital economy index construction, the existing literature have predominantly utilized unidimensional indicators, including ICT sector output, internet penetration rates, or “Broadband China” policy, which fail to capture the multidimensional nature of the digital economy.
In this study, we employ panel data from 279 Chinese cities between 2008 and 2019 to analyze the relationship between the digital economy an income disparity between urban and rural areas. Based on the comprehensive index system, we show that it exacerbates urban–rural income gap, with heterogeneous effects across specific dimensions. Specifically, the industrial and innovation dimensions of the digital economy tend to exacerbate inequality, while basic infrastructure, including internet and mobile phone penetration, show no consistent effect. Furthermore, exploiting data from the 2007, 2013, and 2018 CHIP, we find that while the digital economy is positively associated with education upgrading among rural residents relative to their urban counterparts, such improvements do not appear to be translated into commensurate income gains. One possible explanation is that urban sectors possess stronger digital-transformation capacity and more mature systems for digital-skills training, which may grant urban residents broader access to digitally intensive, qualification-matched positions as well as relevant training opportunities. These advantages may help explain why urban workers are better to convert educational improvements into productivity gains and higher income returns. Finally, our results suggest that China’s Public Employment Services (PES) initiative may provide a crucial institutional buffer against digital economy-driven inequalities.
The possible contributions of this paper are as follows. First, the paper further examines the distributional consequences of digital expansion, showing that it is associated with a widening urban–rural income gap. In this sense, our findings have policy implications for promoting inclusive growth in the digital economy. Second, we introduce micro-level data to examine the mechanism through which the digital economy influences urban–rural income inequality. While most prior research relies on macro-level indicators [11,14,15], we use CHIP data to show that the digital economy has adverse effects on income growth among educated rural residents. This micro-level evidence points to persistent structural constraints in China’s rural labor markets driven by digital transformation. Third, it underscores the necessity of constructing a comprehensive and multidimensional measure of the digital economy to more accurately assess its impact on income inequality. While the existing literature often focus on individual components such as internet infrastructure, industrial digitalization, or digital inclusive finance [8,16,17], our study adopts a more integrated framework. Finally, we find that improvement in PES can moderate the inequality-enhancing effects of the digital economy, suggesting that employment-related institutions play a role in safeguarding social sustainability and preventing the digital divide from further widening in China and other emerging economies.
The remainder of this study is organized as follows: Section 2 provides the theoretical analysis and research hypothesis. Section 3 details the research design. Section 4 presents the empirical results. Section 5 explores the mechanism analysis. Section 6 discusses the further analysis. Section 7 shows the discussions. Finally, Section 8 concludes the study and discusses policy implications.
2. Theoretical Analysis and Research Hypothesis
2.1. The Digital Economy and Urban–Rural Income Inequality
The digital economy refers to a novel economic structure that is distinguished by its strong data dependence, high interconnectivity, rapid scalability, and disruptive innovation capacity [18]. It has the potential to significantly reshape production, entrepreneurship, distribution, and consumption patterns, deeply penetrating both urban and rural economies, and exerting a profound impact on the income of urban and rural residents [19]. Research on how the digital economy affects the income difference between urban and rural areas is currently expanding and adding to the body of knowledge. While existing studies generally agree that digital economy contributes to income growth, there remains considerable debate regarding its distributional effects between urban and rural areas.
From a theoretical perspective, the digital economy can shape urban–rural income inequality by altering rural households’ access to markets and economic opportunities. Developments in platform-based activities, digital finance, big data, and artificial intelligence reduce information frictions and transaction costs, thereby strengthening farmers’ participation in production, employment, and market exchange. The expansion of rural e-commerce links farmers to broader markets, shortens supply chains, and reduces intermediary losses, enhancing value creation and bargaining power [20]. Additionally, the diffusion of digital finance extends financial services to rural areas by enabling more accurate credit assessment through big data and artificial intelligence, thereby facilitating access to credit, supporting production expansion, and improving operational efficiency [21]. As digital technologies become embedded in production and daily life, rural residents gradually acquire digital skills, enabling more effective information use, participation in platform-based labor allocation, and entry into non-agricultural employment [22]. Through these channels, digital development may generate stronger income effects for rural residents, with implications for narrowing urban–rural income inequality.
By contrast, the digital economy may widen urban–rural income inequality through the digital divide. This divide reflects unequal access to and effective use of digital technologies across regions and population groups, thereby reinforcing pre-existing socioeconomic disparities. Relying on their advantages in technology, education, and talent resources, cities secured an early digital dividend, whereas rural regions lagged behind, with the digital village strategy not launched until 2018 [5]. Improvements in agricultural labor productivity have been hampered by the low level of agricultural informatization brought about by the digital divide [23]. Additionally, uneven digital infrastructure distribution has raised communication and information search costs in rural areas [24]. Hence, farmers struggle with basic digital connectivity, facing information asymmetries, market failures, and platform inaccessibility [25,26]. This has constrained rural residents market participation, entrepreneurship, and employment, thus negatively affecting their income and widening urban–rural income disparity [27]. As urban groups continue to accumulate digital dividends, rural populations are increasingly excluded from the benefits of digitalization, thus leading to the emergence of the Matthew effect, resulting in the situation of “the poor getting poorer and the rich getting richer” [22,28].
Overall, the relationship between the digital economy and urban–rural income inequality is context dependent, and may either widen or narrow the gap depending on how digital technologies diffuse, the policy environment, and patterns of social adaptation.
Empirical evidence suggests that the relationship between the digital economy and urban–rural income inequality is multifaceted. Existing studies show that its effects vary across stages of development, regions, and industries. In the early stages, information technologies may help reduce digital disparities, whereas deeper integration with manufacturing and service sectors tends to favor urban economies, potentially widening the urban–rural income gap [14]. In China, in particular, the distributional effects of the digital economy display pronounced regional heterogeneity [29]. Moreover, although digital development can raise overall income levels by enhancing productivity and economic growth, such effects often materialize gradually over time [30]. Based on these divergent empirical findings, we propose the first hypothesis:
H1.
The digital economy has a significant impact on urban–rural income inequality.
2.2. The Digital Economy, Education, and Urban–Rural Income Inequality
Returns to education play a crucial role in shaping urban–rural income inequality, and their effects have varied markedly across different periods. In the late 20th century, China was characterized by relatively low overall educational attainment alongside comparatively high returns to education, while urban–rural disparities in educational attainment remained limited [31]. As educational attainment gradually improved, individuals increasingly benefited from human capital accumulation in terms of income growth [32]. Currently, income sources during this period were relatively concentrated, mainly in agriculture and manufacturing, where income differentials across sectors were modest. Consequently, improvements in human capital not only promoted income growth but also contributed, to some extent, to narrowing urban–rural income inequality [31].
In the 21st century, however, continued educational expansion has been accompanied by declining relative educational attainment and growing heterogeneity in returns to education [33]. In particular, returns to education—both in quantity and quality—remain significantly higher in urban areas than in rural areas [34]. Owing to pronounced urban–rural disparities in returns to education, the persistent expansion of urban–rural income inequality has gradually emerged as a major policy concern [35]. Consistent with the theory of Maximally Maintained Inequality (MMI), high-income groups are better positioned to secure educational opportunities by leveraging their superior economic and social resources, thereby generating a Matthew effect in educational attainment [36]. Consequently, the widening urban–rural income gap can be attributed in part to unequal educational returns shaped by disparities in infrastructure, teacher quality, and access to learning platforms between urban and rural areas [37].
With the rapid expansion of the digital economy, the link between returns to education and urban–rural income inequality has attracted increasing attention. In theory, digital development can reshape income outcomes by altering educational attainment and the returns to education across different labor groups in urban and rural areas.
The digital economy can facilitate human capital accumulation among rural workers by expanding access to educational resources, lowering learning costs, and improving information accessibility. Digitalization centered on information technologies has created new opportunities to address the relative educational disadvantages faced by rural areas. Digital platforms, in particular, provide convenient and low-cost channels for enhancing education and skill acquisition in rural areas. The effectiveness of these channels depends on individuals’ ability to use digital platforms to acquire and apply relevant knowledge and information [38]. In response to skill demand driven by technological change, rural workers may engage in online learning and web-based training to upgrade skills, enhance competitiveness, and reduce the risk of labor market displacement [4]. Taken together, the digital economy may be associated with enhanced opportunities for human capital accumulation among rural laborers, particularly by expanding access to educational resources and lowering the costs of learning and skill acquisition.
Nevertheless, within the context of digitalization, returns to education may differ across urban and rural areas. Consistent with Kuznets’ theory of industrial transformation, economic development shifts labor demand toward the tertiary sector, where digitally intensive and skill-complementary activities are increasingly concentrated [4]. In China, the tertiary sector has developed more rapidly in urban regions, providing urban residents with greater access to high-skill and high-income occupations that more closely match their educational qualifications. In urban labor markets—characterized by a dense concentration of digital industries, advanced service sectors, and technology-complementary firms—the expansion of digitally intensive occupations increases the demand for highly educated workers [39]. As a result, the digital economy strengthens the returns to education among urban residents, enabling them to access high-productivity and high-paying positions.
By contrast, rural workers may experience weaker income returns to education, not necessarily due to lower educational attainment, but rather reflecting more limited opportunities to convert education into digitally aligned jobs. In contrast to metropolitan regions, rural areas are distinguished by a variety of traditional activities, mostly in the primary sector associated with farming, forestry, fishing, and extraction, which rely on natural conditions, such as crops, livestock, climate, and soil [40]. These factors make standardization difficult, hinder the adoption of new technologies, compromise the potential for digitalization, and necessitate manual tasks in most segments [41]. Moreover, rural residents have far more limited access to digital-skills training and technology-oriented vocational programs, further weakening their ability to translate education into productivity gains. As digital industries and digitally intensive tasks remain predominantly clustered in urban areas, while rural labor markets offer fewer positions that reward higher education. This geographic concentration amplifies the productivity and wage premium enjoyed by educated urban workers but offers only limited gains to similarly educated rural workers. Consequently, differences in the income returns to education between urban and rural residents may persist or widen under digital economy development. Such disparities in educational returns are likely to be reflected in divergent income outcomes across space, thereby contributing to observed patterns of urban–rural income differentials. Based on these considerations, the following hypotheses are formulated:
H2a.
Under the digital economy development, the income returns to educational attainment may differ between urban and rural residents.
H2b.
Unequal returns to education between urban and rural residents under digitalization may partly stem from widened employment disparities.
2.3. The Role of PES in Alleviating Digital Economy-Driven Inequality
Next, this study examines whether improvements in PES can mitigate the adverse effects of unequal educational returns caused by employment disparities among rural residents in the context of rapid digital economy development. While the digital economy has expanded access to information, skills, and high-quality jobs, rural workers continue to face limited local employment opportunities and fewer suitable job matches. They remain disadvantaged in accessing digitally enabled jobs and may be less responsive to new labor market opportunities created by digitalization compared with urban residents.
PES may play an important moderating role in the relationship between the digital economy and urban–rural income inequality. It improves rural workers’ access to employment information and job matching, thereby helping farmers better understand labor market demand and align their skills with available positions [42]. Additionally, training institutions often cooperate with employers to provide direct recruitment information or referral channels, which is valuable given the limited availability of digitally enabled jobs in rural areas [43]. Moreover, PES increasingly targets emerging areas such as rural revitalization and the digital economy, enabling farmers to access new employment opportunities beyond traditional sectors, and strengthening their competitiveness in digitally transforming labor markets [44]. Thus, strengthening PES may offer an important institutional buffer against digital economy-driven inequalities. Based on the above analysis, the third hypothesis is proposed:
H3.
The improvement of PES can moderate the widening effect of the digital economy on urban–rural income inequality.
3. Research Design
3.1. Empirical Model
3.1.1. Baseline Analysis Approach
This study employs a two-way fixed effects panel model to examine the impact of the digital economy on urban–rural income inequality. The baseline model is specified as follows:
where i represents the city, t the year. URIIit is the dependent variable, which represents urban–rural income inequality. DEit, the digital economy development index at the city level, is the core explanatory variable of this paper. Xit represents a set of control variables. μi and ξt are the fixed effect of city and time, respectively, while εit represents the random disturbance term. α0 is the constant term and α1 represents parameters to be estimated.
URIIit = α0 + α1 × DEit + λXit + μi + ξt + εit
To further quantify the impact of the digital economy on urban–rural income inequality, this study builds the following model based on the micro data:
where i denotes the individual, j the city, and Incomeijt the monthly wage income of individual i. DEj(t − 1) is an index for city j’s development level of DE in the prior year, to alleviate potential reverse causality concerns. Ruralijt is a dummy variable, where rural residents are assigned 1, and urban residents are assigned 0. μj indicates city fixed effects, and ξpt indicates province-by-year fixed effects. The coefficient on the interaction term β3 is of our interest, which indicates the differential effect of the digital economy on rural versus urban residents. Based on our discussion in Section 2, we hypothesize that β3 is negative, implying that the income gains from DE are weaker for rural residents than for urban residents; in other words, the digital economy widens urban–rural income inequality.
Incomeijt = β0 + β1 × DEj(t − 1) + β2 × Ruralijt + β3 × DEj(t − 1) ×Ruralijt + λXijt + μj + ξpt + εijt
3.1.2. Mechanism Analysis Approach
To examine whether the digital economy is associated with changes in individual educational attainment across urban and rural residents, we first analyze how educational upgrading varies with local digital economy conditions. In particular, we focus on whether the relationship between the digital economy and educational attainment differs between rural and urban individuals. We estimate the following specification:
where Eduattijt is an indicator for individual educational attainments. If an interviewee has a high school diploma or above, Eduattijt is set to 1, otherwise 0. Specifically, we categorize individuals with a junior high school education or below as low-educated residents; those with a secondary technical, vocational, technical, or general high school education as medium-educated residents; and those with an associate degree or higher as highly educated residents. The coefficient γ3 captures whether the association between the digital economy and educational attainment differs systematically between rural and urban residents. A positive γ3 indicates that educational upgrading is more strongly associated with digital economy development among rural residents relative to their urban counterparts.
Eduattijt = γ0 + γ1 × DEj(t − 1) + γ2 × Ruralijt + γ3 × DEj(t − 1) ×Ruralijt + λXijt + μj + ξpt + εijt
Furthermore, we examine whether the association between educational attainment and individual income varies with the digital economy across urban and rural residents. Specifically, we focus on whether digital economy conditions are associated with differential income returns to education for rural and urban individuals. To this end, we estimate the following extended specification:
Incomeijt = δ0 + δ1 × DEj(t − 1) + δ2 × Ruralijt + δ3 × DEj(t − 1) ×Ruralijt + δ4 × Eduattijt + δ5 × Ruralijt × Eduattijt + δ6 × DEj(t − 1) ×Eduattijt + δ7 × DEj(t − 1) ×Ruralijt × Eduattijt + λXijt + μj + ξpt + εijt
The coefficient of primary interest is δ7, which captures whether the relationship between educational attainment and income varies systematically with digital economy development between rural and urban residents. A negative estimate of δ7 indicates that, under stronger digital economy conditions, the income returns associated with educational attainment are relatively weaker for rural residents compared to their urban counterparts.
3.2. Variables
3.2.1. Dependent Variable
The dependent variable, URII, which is typically measured by the urban-to-rural per capita disposable income ratio, the Gini coefficient, and the Theil index. However, the income ratio is limited because it only compares average incomes, ignoring income distribution, population sizes, and regional differences. The Gini coefficient, while useful for overall inequality, fails to distinguish urban–rural disparities, reducing its policy relevance. To address these limitations, we use the Theil index (Theil), which is decomposable and better suited for analyzing urban–rural income inequality [15]. The equation is as follows:
where t represents the year. Iit represents the disposable income of urban and rural residents, It represents the total disposable income. Pit represents the total population of urban and rural residents, Pt represents the total population. A high Theil index indicates high urban–rural income inequality. Furthermore, this paper splits the dependent variable and directly uses the indicators of per capita disposable income of urban residents (Urban_income) and per capita disposable income of rural residents (Rural_income) to measure their relationship with the digital economy. Another dependent variable is Income, the individual monthly wage income, used in the micro-level analysis.
3.2.2. Independent Variable
The key independent variable is DE. Initially, the added value of ICT core industries is used by the OECD and the UN to gauge the digital economy [45]. However, the ICT is merely a portion of DE. Some scholars have employed diverse evaluation methodologies to assess the digital economy through various index systems. Five essential aspects are among the most widely utilized indicators: Mobile phone penetration rate, associated employment, related production, internet penetration rate, and digital inclusive finance [11,15]. This indicator system operates on two fundamental premises: (1) ICT development serves as a core driver of digital economy growth, and (2) digital financial inclusion represents an emerging model that evolves alongside digital economic development. By measuring these dimensions, the system aims to evaluate the overall progress of digital economy development.
As policymakers increasingly emphasize the digital economy, an expanding body of literature has adopted more comprehensive indicator systems to measure its development. Some scholars emphasize the role of a region’s innovation environment and institutional foundations in fostering and sustaining the digital economy development, beyond digital infrastructure [46,47]. Specifically, innovation-related and institutional indicators capture the enabling conditions that shape a region’s capacity to generate, absorb, and diffuse digital technologies. These conditions influence not only the pace of digital transformation but also the extent to which digital economic activities can be sustained and scaled over time.
Accordingly, academics prefer and acknowledge the full assessment index method over the single index. Drawing on the above research and other relevant studies [48,49], our index comprises six primary dimensions: digital infrastructure, digital industrialization, industrial digitization, digital innovation, digitization potential, and government digital attention (See Figure 2). Each includes several sub-indicators, with a total of 11 components detailed in Table A1 of Appendix A.1. Furthermore, additional details on the theoretical rationale, construction logic, and relevant literature underlying the selection of indicators are provided in Appendix A.2.
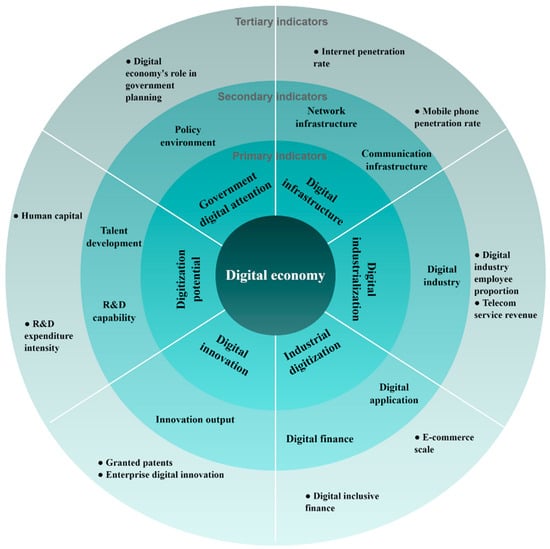
Figure 2.
The digital economy evaluation indicator system.
We standardize the data using a min–max normalization method:
where xij denotes the value of indicator j for city i. max{xj} and min{xj} represent the maximum and minimum values of indicator j across all cities. We apply the entropy weight method, under which indicator weights are determined by cross-city variability, reducing reliance on subjective weighting. The resulting composite index systematically captures the multidimensional development of the digital economy at the city level in China.
In addition, we reconstruct the digital economy index (DE_PCA) using principal component analysis. This approach helps to mitigate potential transparency and measurement concerns associated with proxy-based indicators by deriving weights from the covariance structure of the underlying variables. We then employ the resulting index as an alternative measure in robustness checks to assess the sensitivity of our findings to proxy selection and weighting assumptions.
3.2.3. Control Variables
We include the following city-level control variables: economic development (Econ), which significantly influences URII due to the urban bias in economic growth management [2]; urbanization (Urb), which accounts for URII by transferring surplus rural labor to urban employment [50]; education inputs (Edu), which plays a moderating role in the relationship between DE and URII [15]; financial development (Fin), which can narrow URII by stimulating employment [51]; share of primary and tertiary industries (Priind and Terind), which capture industrial structure and profoundly impact URII through transformation and upgrading [52].
Additionally, we select individual, household, and city characteristics that may affect Income. At the individual level, control variables include gender (Gen), age (Age), square of the age (Agesquared), marital status (Mar), ethnicity (Eth), health condition (Health), and educational attainment (Eduatt). At the household level, variables such as household size (Hsize), household labor structure (Hlab), household educational structure (Hedu), and household income surplus (Hinc) are considered. At the city level, we further control for Econ, Urb, Edu, and Indup. Definitions of variables are presented in Table A2 of Appendix A.1.
3.3. Data
The data used in this paper include both macro and micro data. The macro panel data, spanning 279 cities in China from 2008 to 2019, are primarily sourced from China Urban Statistical Yearbook, various provincial and municipal statistical annual reports, China Statistical Yearbook for Regional Economy, Peking University Digital Financial Inclusion Index, and China National Intellectual Property Administration. Missing values are addressed using linear interpolation, and all monetary values are deflated with 2008 as the base year.
The micro data is collected from CHIP, which aims to track the dynamics of income distribution. The project has conducted six rounds of surveys in 1988, 1995, 2002, 2007, 2013, and 2018. To align with the macro sample’s time frame, this study includes only the 2007, 2013, and 2018 data. We also calculate the digital economy index for the period 2006–2019 and use the 2006 values for the micro-level analysis. Our sample includes all residents who were employed and earned income in the survey year. After removing observations with missing values, the final sample consists of 69,405 residents across 169 cities. Table 1 displays the descriptive statistics for the primary variables.

Table 1.
Descriptive statistics.
4. Empirical Results
4.1. Baseline Results
In Table 2, we present the baseline results from the estimation of Equation (1). As shown in columns (1) and (2), the coefficient of DE is positive and significant, with or without additional controls, indicating that the higher levels of digital economy are associated with greater urban–rural income inequality. Interpreted in standard deviation terms, a one–standard deviation increase in DE (0.047) raises the Theil index by 8.59% relative to its mean (0.047 × 0.159/0.087).
Table 2.
Baseline regression results.
We further assess the association between the digital economy and residents’ incomes (Urban_income and Rural_income). The estimated effects are positive and significant in both cases, but larger for urban residents (3.991 in column (3)) than for rural residents (2.680 in column (4)), suggesting a stronger income response to digital development in urban areas. This pattern is consistent with a widening urban–rural income gap.
Turning to the control variables, column (2) indicates that both economic development and urbanization reduce urban–rural income inequality, whereas education inputs widen it, possibly reflecting unequal access to educational resources between urban and rural areas [15]. The other control variables exert little influence on urban–rural income inequality in the sample.
4.2. Robustness Analysis
4.2.1. Instrumental Variable Method
There may be endogeneity concerns caused by reverse causality and measurement errors. For instance, while the digital economy may influence urban–rural income inequality, it is also plausible that cities with certain income distribution characteristics or development trajectories tend to exhibit more advanced digital economy development. In addition, the DE index we constructed may involve measurement errors. To mitigate potential endogeneity concerns, we construct two instrumental variables (IV) based on topographic relief.
The topographic relief is a natural geographic characteristic that affects the cost of building digital infrastructure. Regions with more complex terrain face higher marginal costs for laying optical fiber and deploying base stations, which may hinder digital economy development. This provides support for the relevance of topographic relief as a source of exogenous variation in digital economy development.
Meanwhile, topographic relief is a time-invariant feature determined by geography. It is less likely to affect changes in urban–rural income inequality directly, other than through channels related to digital infrastructure and digital economy development. Nevertheless, since topographic conditions may be related to historical development patterns and long-run income structures, we further examine whether the proposed instruments affect urban–rural income inequality through alternative channels.
Differences in employment allocation and labor productivity across industries reflect the industrial paths and income structures formed over long-term regional development and are widely recognized as important determinants of urban–rural income inequality [53]. Accordingly, we assess whether the instrumental variables are systematically associated with industrial employment structure or sectoral productivity. As shown in Table A3 of Appendix A.1, the topography-based instruments are not significantly related to either inter-industry employment allocation or labor productivity in non-agricultural sectors. These results suggest that the instruments are unlikely to affect urban–rural income inequality through industrial structure or long-run income-related channels, thereby helping to alleviate concerns regarding the potential endogeneity.
As topographic relief is time-invariant, we follow Nunn and Qian (2014), using the interaction between topographic relief and the lagged logarithm of the national number of internet users as IV1, and the interaction between topographic relief and the average digital economy index of all cities in the same year as IV2 [54]. The results are reported in Table 3. Columns (1) and (3) indicate that regions with flatter terrain are more conducive to the development and activation of local digital economies. Furthermore, we find that coefficients of DE in columns (2) and (4) are significantly positive, indicating that the benchmark regression result remains robust.
Table 3.
Instrumental variable method.
4.2.2. The Digital Economy and the Annually Changes in Urban–Rural Income Inequality
To assess robustness, alongside using the absolute level of URII, we use its annual change rate ((URIIt−URIIt−1)/URIIt−1) to examine short-term dynamics in Table 4. While the significance of DE decreases (columns (1)–(3)), the coefficients on its lagged term, DEat t = −1, remain positive and statistically significant in columns (4)–(6), pointing to a delayed association between digital economy development and changes in urban–rural income inequality. Specifically, the lagged digital economy measure is positively related to urban income growth, whereas its association with rural income growth is statistically insignificant. This pattern suggests that the income-related association of the digital economy is stronger for urban residents than for rural residents, which is consistent with a widening urban–rural income inequality.
Table 4.
The digital economy’s impact on the growth rate of urban–rural income inequality.
4.2.3. The Dynamic Effects of the Digital Economy on Urban–Rural Income Inequality
The baseline estimates reflect the average effect of the digital economy, but do not capture its temporal evolution [55]. To examine the time variation, we include an interaction term between DE and Year in Equation (1). As shown in Figure 3, in the early stages of the digital economy development (2008), it reduces urban–rural income inequality. However, since 2009, this effect weakens. The increasing gradient observed from 2013 to 2019 suggests that the association between digital economy development and urban–rural income inequality becomes more adverse in later stages.
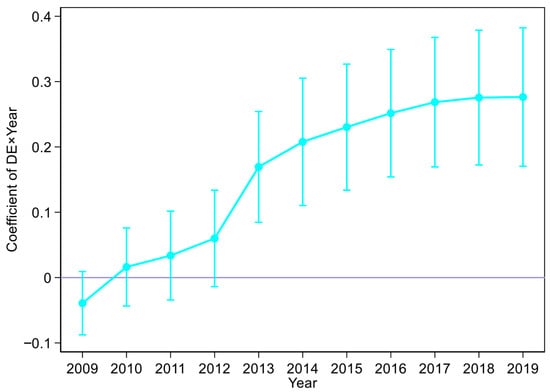
Figure 3.
The dynamic effects of the digital economy on urban–rural income inequality. The detailed coefficients are reported in Table A4 of Appendix A.1.
This pattern highlights the evolving nature of the digital economy’s distributional impact. In its initial phase, the digital economy may have facilitated information access, reduced transaction costs, and expanded market opportunities in rural areas. However, 2013 marked a significant turning point in its development, driven by the “Broadband China” policy. These initiatives accelerated the rise of mobile internet, platform economy, and digital industries. As the sectors are both skill- and capital-biased, they disproportionately benefited urban residents with stronger human capital and digital literacy, while rural areas with weaker infrastructure and fewer high-skill jobs lagged behind. Consequently, without targeted policy interventions to promote rural digital inclusion, the digital economy risks reinforcing structural inequalities.
4.2.4. Controlling for Common Time Trends
To rule out the possibility that the estimated impact of the digital economy reflects common time trends rather than substantive effects, we control for linear (Year) and quadratic (Year2) time trends in Equation (1). As shown in Table 5, the coefficients of DE remain significantly positive, indicating that our results are not simply artifacts of common temporal dynamics, but rather remain robust after accounting for common time trends.
Table 5.
Controlling for common time trends.
4.2.5. Alternative Measures of the Digital Economy
To alleviate potential transparency and measurement concerns related to proxy-based indicators, we perform robustness checks using alternative measures of the digital economy. The results, reported in Table 6, confirm that the main findings are not driven by specific proxy choices or weighting schemes.
Table 6.
Alternative measures of the digital economy.
First, we replace the baseline digital economy index (DE) with a principal component analysis–based measure (DE_PCA) in column (1). This approach partially alleviates concerns related to subjectivity and transparency in index construction by deriving weights from the covariance structure of the underlying indicators rather than from predefined weighting rules.
Second, we reconsider the measurement of the e-commerce component in column (2). While the baseline index uses city-level postal service revenue as a proxy for e-commerce development, this indicator may imperfectly capture the spatial distribution of online transaction activities. To address this limitation, we allocate provincial e-commerce transaction values to prefecture-level cities using each city’s share of provincial express delivery volume as weighting factors. The underlying data are compiled from China Statistical Yearbook, provincial and prefecture-level statistical yearbooks, and government work reports. Based on this alternative city-level e-commerce measure, we reconstruct the DE index (DE_alter) and re-estimate the baseline specification.
Third, we introduce an alternative DE measurement approach using the number of digital patent applications in cities (DE_patent)) in column (3). Digital patents reflect the technological innovation dimension of the digital economy and are less dependent on administrative or reporting-based indicators.
Finally, in column (4), we further conduct a conservative robustness check by excluding indicators subject to potential measurement ambiguity—specifically, postal service revenue and the frequency of digital economy–related keywords in city government reports—and reconstruct the digital economy index accordingly (DE_delete).
The calculated coefficients of the digital economy variable are consistent with the baseline results in both sign and statistical significance across all potential specifications. These findings suggest that our conclusions are robust to alternative measurement strategies and are not driven by particular proxy choices or indicator selections, thereby alleviating concerns regarding the transparency and validity of the digital economy index construction.
4.2.6. Other Robustness Analysis
Columns (1)–(4) of Table 7 present four robustness analyses. First, considering that there is inertia in most macroeconomic variables, we control for the first-order lag term of Theil and DE separately in columns (1) and (2). Second, we introduce an alternative URII measurement approach using the urban-to-rural per capita disposable income ratio (Gap) in column (3). Finally, we incorporate city fixed effects, time fixed effects, and province-by-year fixed effects (HD FE) in column (4). The results of these four robustness analyses are still hold across different specifications, data sources, and measurement approaches.
Table 7.
Other robustness analysis.
4.3. Heterogeneity Analysis
Eleven disaggregated variables can be used to measure the digital economy, as we covered in Section 3.2.2. We estimate the impact of each variable on income disparity between urban and rural areas.
Table 8 reports the results. We find that the impact of DE is not uniform across its different dimensions. The coefficients for basic infrastructure in columns (1) and (2) show no significant impact on urban–rural income inequality, suggesting that connectivity alone does not alter distributional outcomes. Furthermore, as shown in column (4), (6), and (11), telecom revenue, digital finance, and government planning attention exhibit no significant effects. These results indicate that these dimensions are not significantly associated with changes in urban–rural income inequality within our empirical framework. One possible interpretation is that these aspects of the digital economy are more broadly accessible across regions, which may limit their association with unequal income dynamics.
Table 8.
Heterogeneity analysis: specific dimensions of the digital economy.
By contrast, in columns (3) and (5), the share of employment in the digital industry and the scale of e-commerce are positively and significantly associated with inequality. Columns (7)–(10) focus on innovation-related indicators, such as the number of patents, enterprise digital innovation, R&D expenditure, and human capital, also enlarge the gap, as innovation rents accrue mainly to urban firms and skilled workers. Overall, the heterogeneity analysis highlights that industrial and innovation dimensions of the digital economy are more strongly correlated with widening urban–rural income gaps than basic or inclusive dimensions.
5. Mechanism Analysis: A Micro Perspective
5.1. The Digital Economy and Urban–Rural Income Inequality: At the Individual Level
Our analysis thus far has relied on city-level data. We therefore complement it with an individual-level specification, clustering standard errors at the city level. As shown in column (1) of Table 9, the coefficient on DE remains positive and statistically significant (β1= 5.340), suggesting a robust association between the digital economy and individual income.
Table 9.
The digital economy and urban–rural income inequality: a micro perspective.
Column (2) reports estimates from Equation (2) with an interaction between the digital economy and rural residence. While the coefficient on DE is positive, the interaction term is negative and significant (β3 = −7.650), indicating a weaker association between digital economy development and income growth for rural residents relative to urban residents. This differential aligns with an expanding urban–rural income disparity.
The model definition gradually incorporates individual, household, and geographical factors in columns (3)–(5). Regression coefficients on the interaction item between rural inhabitants and the digital economy are statistically significant and negative in every column. These results again suggest that the income-related association of the digital economy is significantly weaker for rural residents than for urban residents. Additionally, for brevity, detailed regression results including the full set of covariates are reported in Table A5 of Appendix A.1.
5.2. The Digital Economy, Educational Attainment, and Income Differentials Between Urban and Rural Residents
As we discussed in Section 2.2, differences in educational attainment and the income returns associated with education may be related to how the digital economy is associated with urban–rural income inequality. In this section, we provide decomposed evidence along two related dimensions. First, we examine whether educational attainment is differentially associated with the digital economy between rural and urban residents (Equation (3)). Second, we investigate whether the relationship between educational attainment and income varies with the digital economy across rural and urban residents (Equation (4)).
5.2.1. The Digital Economy and Educational Attainment
Panel A, Table 10 reports the first result. The interaction between the digital economy and rural residence is positive and statistically significant, suggesting a stronger association between digital economy development and educational attainment among rural residents. This pattern suggests that improvements in local digital economy conditions are accompanied by relatively greater educational upgrading in rural areas, a finding that is consistent with the notion that digital technologies may help relax informational and institutional constraints related to education access in rural areas, including access to information, remote learning opportunities, and administrative procedures for applications, examinations, and credentialing.
Table 10.
Mechanism analysis: the digital economy, educational attainment, and income differentials between urban and rural residents.
5.2.2. The Digital Economy, Educational Attainment, and Income Differentials
As shown in Panel B, the coefficient on the triple interaction between the digital economy, rural residence, and educational attainment is negative and statistically significant, indicating that the association between educational attainment and income varies with digital economy development across urban and rural residents. In particular, under stronger digital economy conditions, the income gains associated with educational attainment are relatively weaker for rural residents than for their urban counterparts.
In summary, these results document a systematic urban–rural difference in how educational attainment is associated with income under the digital economy. While educational attainment appears to be more strongly linked to the digital economy among rural residents, the corresponding income differentials associated with education are comparatively smaller in rural areas. This pattern is consistent with the view that the benefits of the digital economy may be unevenly reflected in income outcomes across space, with stronger complementarities between education and digital economy conditions in urban labor markets.
5.3. Skill Mismatch and Asymmetric Labor Market Adjustment Under the Digital Economy
The results in Section 5.2 document a systematic divergence between educational upgrading and income differentials under the digital economy: while educational attainment is more strongly associated with digital economy development among rural residents, the income gains associated with education remain relatively weaker in rural areas. This section provides complementary evidence on labor market structure that may help interpret this pattern.
A potential explanation lies in differences in education–occupation matching across urban and rural labor markets. As we discussed in Section 2.2, digital industries and digitally intensive occupations are disproportionately concentrated in urban areas, where high-skill and professional positions are more readily available. In contrast, rural labor markets remain dominated by traditional and labor-intensive activities, limiting the availability of occupations that reward higher educational attainment. As a result, educational upgrading in rural areas may not be accompanied by commensurate improvements in job matching.
To delve deeper into this possibility, we examine whether the digital economy is associated with changes in skill mismatch, which is the term used to describe workers who work in jobs that call for different training or expertise [56]. In particular, we focus on overeducation, defined as cases in which workers with relatively higher levels of education are employed in occupations with lower skill requirements [57]. This analysis allows us to assess whether improvements in digital economy conditions are accompanied by more effective education–occupation matching across urban and rural labor markets.
The literature has proposed several approaches to measuring overeducation, including objective, statistical, and subjective measures [58]. There is no consensus on an optimal definition, and empirical choices are often shaped by data availability and practical constraints [57]. The CHIP data include information that allows for the construction of an objective measure of overeducation. Therefore, following Jones et al. (2025), we adopt an objective approach that evaluates workers’ educational attainment relative to occupational qualifications [57].
We utilize CHIP data to construct a variable, Overeducation_ind, which captures whether rural workers are over-educated relative to their industry’s skill intensity. More concretely, we define the variable Overeducation_ind = 1 as medium-educated residents are employed in low-skilled industries, or highly educated residents work in medium- to low-skilled industries; otherwise, Overeducation_ind = 0.
To construct the Overeducation variable, we also need to define industry skill levels. We measure this based on the relative industry-median wage income, as workers’ income reflects the skill level of their occupations [59]. We classify China’s sectoral categories into three categories: low-skilled industries if their median wage falls within the bottom 40%, medium-skilled industries if in the middle 20%, and high-skilled if in the top 40%. Overall, Farming, Forestry, Animal Husbandry and Fishery is low-skill industries, while Information Transmission, Software, and Information Technology Service, along with Scientific Research and Technical Services, are high-skill industries.
Moreover, to investigate how sensitive our results are to the measurement problems involved, we compare our results among overeducation measures. The CHIP survey also provides detailed information on workers’ occupational categories, which are described in Appendix A.3. Based on the International Standard Classification of Occupations (ISCO), we classify principals in government agencies and enterprises as well as professional and technical personnel as medium- to high-skill occupations, with all remaining occupations categorized as low-skill. Using this occupation-based classification, we construct an alternative indicator, Overeducation_occ, which equals 1 if medium- or highly educated individuals are employed in low-skill occupations, and 0 otherwise.
Table 11 reports probit estimates of the association between the digital economy and overeducation under two alternative measurements. Column (1) shows that higher digital economy development is associated with a significantly lower probability of overeducation among urban residents when skill mismatch is defined using industry-based skill intensity (Overeducation_ind). In contrast, the corresponding estimate for rural residents in column (2) is statistically insignificant. Columns (3) and (4) present results based on an occupation-based measure of overeducation (Overeducation_occ). The results remain qualitatively similar.
Table 11.
Skill mismatch and asymmetric labor market adjustment under the digital economy.
Overall, the results suggest that the digital economy is associated with a reduced likelihood that highly educated workers are employed in low-skilled positions, with this association being more evident in urban labor markets. In rural areas, however, industrial upgrading appears to lag behind educational expansion, limiting the availability of skill-intensive jobs and constraining effective education–occupation matching. Barrios (2008) notes that while education may initially raise non-farm income, continued educational upgrading can exceed the skill requirements of the local economy, leading to underutilization of human capital [60].
6. Further Analysis: PES as a Moderating Institutional Context
While the digital economy has widened disparities in access to digital jobs and training opportunities between urban and rural residents, PES represent an important institutional context for labor market adjustment. By improving job matching, skill training, and information provision, PES may shape how the inequality-enhancing effects of the digital economy manifest across regions. In line with H3, this section examines whether variation in PES environments is associated with heterogeneity in the relationship between the digital economy and urban–rural income inequality.
We first construct a provincial-level evaluation framework for PES from three dimensions: fiscal support, service provision, and service outcomes. Owing to data availability, the PES indicators are compiled at the provincial level to characterize differences in the broader employment service environment. The data are obtained from the China Statistical Yearbook, the China Labor Statistical Yearbook, and various provincial statistical yearbooks. Due to severe data gaps for Shanghai, Yunnan, and Tibet, these provinces are excluded from the final sample. The detailed evaluation framework is presented in Table A6 of Appendix A.1. As mentioned in Section 3.2.2, we also standardize the data using a min–max normalization method and calculate the PES index employing the entropy weight method. We then split the macro sample into two groups. Specifically, we construct a dummy variable PES; if the PES Index of a city’s province is above the 75th percentile, indicating a relatively comprehensive PES system, PES is set to 1, otherwise 0.
Table 12 reports the results after incorporating the PES dummy variable as an interaction term in Equation (1). The results show that the digital economy is associated with a significant increase in the Theil index. By contrast, the interaction term between DE and PES is significantly negative, suggesting that the inequality-enhancing effect of the digital economy is weaker in regions characterized by more comprehensive PES environments. This pattern is consistent with the view that differences in PES environments may condition how digital transformation translates into distributional outcomes, potentially through improved access to employment-related information, training opportunities, and reemployment support.
Table 12.
Further analysis: the role of PES in alleviating digital economy-driven inequality.
7. Discussion
This study combines macro-level inequality metrics with micro-level income dynamics to investigate the link between the digital economy and urban–rural income disparity. The findings demonstrate that, despite encouraging income increases for both urban and rural inhabitants, the rise of the digital economy is linked to an increasing income disparity between urban and rural areas. This data emphasizes that understanding patterns of overall inequality requires taking into account how income increases are produced and allocated at the individual level. The study offers complementary insights into the distributional effects of digital economic development by connecting micro-level income responses with city-level inequality results.
Beyond documenting aggregate effects, this study sheds light on the mechanisms through which the digital economy translates into urban–rural income inequality. A key insight is that educational upgrading among rural residents does not translate into proportional income gains under digitalization. While improvements in digital economic conditions are associated with higher educational attainment in rural areas, the corresponding income returns to education remain significantly weaker than those observed among urban residents. This divergence highlights unequal returns to education as a central micro-level mechanism linking digital economic development to income inequality. Unlike prior studies that infer transmission channels primarily from macro indicators—such as innovation intensity, industrial structure, or digital infrastructure—this analysis directly examines how education is rewarded in urban and rural labor markets under digitalization [8,29]. The results suggest that human capital accumulation alone is insufficient to narrow income disparities when local employment structures fail to provide education-matched opportunities.
Evidence from skill mismatch analysis further supports this interpretation. Digital economy development is associated with improved education–occupation matching in urban labor markets, whereas similar adjustments are largely absent in rural areas. This asymmetric labor market response reflects persistent structural constraints in rural economies, where digitally intensive and skill-complementary jobs remain scarce. As a result, the digital economy strengthens the complementarities between education and employment primarily in urban settings, while rural regions face difficulties in absorbing educated labor. These findings refine existing debates by demonstrating that the inequality-enhancing effects of digitalization are not driven solely by differences in educational attainment, but by spatial disparities in the ability of labor markets to convert education into income.
Importantly, the moderating role of PES highlights how labor market institutions shape the distributional outcomes of digital transformation. In regions with more comprehensive PES systems, the positive association between the digital economy and urban–rural income inequality is significantly weaker. This suggests that improved access to employment information, training opportunities, and job matching services can help mitigate the structural disadvantages faced by rural workers. By facilitating the alignment between skills and labor demand, PES can enhance rural residents’ capacity to translate educational improvements into income gains. This finding extends the literature by moving beyond technology-centered explanations and emphasizing the institutional conditions under which digitalization affects income distribution.
7.1. Research Contributions
This study contributes to the literature in three main respects. First, it provides further evidence that the digital economy is associated with changes in urban–rural income inequality. Previous studies have examined the distributional effects of the digital economy and its various dimensions, including overall digital development [14,61], industrial digitalization [29], digital government [62], digital inclusive finance [63], artificial intelligence adoption and rural E-commerce [64]. Collectively, this literature suggests that digital technologies and related institutional arrangements can reshape income distribution between urban and rural areas, highlighting the multidimensional nature of the digital economy. However, most existing studies approach this issue primarily from a macro-level perspective, focusing on identifying aggregate effects on urban–rural income disparities. By integrating macro-level inequality outcomes with micro-level individual income dynamics, this study provides complementary macro- and micro-level evidence on the distributional consequences of digital economic development, linking aggregate inequality patterns with individual-level income dynamics.
Second, this study extends the existing literature by examining the mechanisms linking the digital economy to urban–rural income inequality from a micro-level perspective, offering a more granular view of income growth patterns, particularly among rural residents. Several studies have discussed the inequality-enhancing effects of the digital economy, while differing in their treatment of underlying mechanisms. Peng and Dan (2023) show that digital economic development in later stages is associated with a widening urban–rural income gap, but do not empirically test the potential transmission channels [11]. Shen et al. (2025) identify a U-shaped relationship between the digital economy and urban–rural income inequality, emphasizing the role of the digital divide as an indirect channel that interacts with the direct effects of digitalization [14]. Xia et al. (2024) find that the digital economy may increase urban–rural income disparities in most regions of China through human capital accumulation [61]. Wang et al. (2025) highlight innovation as a key mediating factor, showing that industrial digitalization raises innovation levels and indirectly widens the urban–rural income gap by approximately 3.1% [29]. While these studies provide valuable insights into potential mechanisms, they primarily rely on macro-level indicators to infer transmission channels. By contrast, this study complements the existing literature by drawing on micro-level data to examine whether the income returns to educational attainment differ systematically between urban and rural residents under digital economic development. In line with this perspective, our analysis further explores the extent to which unequal returns to education are associated with widening employment disparities, thereby providing micro-level evidence on how digitalization may translate into urban–rural income inequality.
Third, our findings suggest that the inequality-enhancing effect of digital economic development is not unconditional, but varies systematically with labor market institutions such as PES. While existing studies draw policy implications from aggregate inequality patterns [15,16,17], our micro-level evidence suggests that unequal returns to education and constrained employment opportunities among rural residents may play role in shaping these outcomes. This implies that policies aimed solely at promoting digitalization may be insufficient, and that strengthening employment-related institutions such as PES is essential for mitigating digital economy-driven inequality.
7.2. Limitations and Future Research
Several limitations should be acknowledged. First, the measurement of some key variables relies on proxy indicators, which may not fully capture the underlying concepts of digital economy development and labor market conditions. Although multiple robustness checks using alternative measures are conducted, future research could benefit from more direct and fine-grained data to further improve measurement accuracy. Second, the measurement of skill mismatch is constrained by available industry- and occupation-level classifications, which may not fully capture task-level heterogeneity. Third, PES indicators are constructed at the provincial level, potentially masking local variation in service provision. Future studies could address these limitations by using more granular labor market data and exploring additional institutional mechanisms that shape the inclusiveness of digital economic development.
8. Conclusions and Policy Implications
The government and academic community have long been concerned in closing China’s urban–rural income divide because it has important implications for long-term socioeconomic development. In this research, we investigate how China’s urban–rural income inequality is affected by the digital economy. Based on CHIP data and panel data from 279 cities between 2008 and 2019, we discover that the digital economy greatly increases income disparity between urban and rural areas. After performing a number of robustness tests, this finding is still reliable. The heterogeneity analysis indicates that digital industries and innovations tend to exacerbate inequality, while basic digital infrastructure shows no consistent effect, reflecting its inclusive characteristics. Furthermore, the mechanism analysis suggests that the income returns to education in the digital economy are much weaker for rural residents than for their urban counterparts; one possible explanation is that the digital economy is more effective in alleviating skill mismatch among urban workers, thereby allowing them to convert educational gains into higher-income positions more effectively than rural workers. Finally, our results suggest that PES may play a moderating role in mitigating digital economy-driven inequality.
Our findings have several policy implications for China and other emerging economies. First, while the digital economy provides significant growth opportunities, it also risks reinforcing structural inequality if inclusiveness is neglected. Second, policymakers may consider development strategies that not only expand the scale of digitalization but also ensure equitable access. Consistent with our finding that basic digital infrastructure does not exhibit a systematic inequality-enhancing effect, greater emphasis is needed on universal digital infrastructure, such as broadband networks and cloud service facilities, which may help enhance connectivity without intensifying income disparities. Third, narrowing the returns-to-education gap requires policy efforts that improve skill matching for rural workers rather than focusing solely on educational attainment. Our micro-level evidence shows that the digital economy primarily alleviates skill mismatch among urban workers, implying that without complementary labor-market and training policies, rural residents may struggle to convert educational gains into income improvements. In this context, greater attention should be paid to employment opportunities. Targeted measures—such as strengthening rural vocational training systems, improving alignment between curricula and digitally intensive occupations, and expanding access to qualification-matched job opportunities—may help mitigate this imbalance and contribute to more inclusive and sustainable patterns of income growth.
Author Contributions
Conceptualization, J.Z. and J.S.; methodology, J.Z.; software, J.Z.; validation, J.Z.; formal analysis, J.Z.; investigation, J.Z.; resources, J.Z.; data curation, J.Z.; writing—original draft preparation, J.Z.; writing—review and editing, J.Z. and J.S.; visualization, J.Z.; supervision, J.S.; project administration, J.S.; funding acquisition, J.S. All authors have read and agreed to the published version of the manuscript.
Funding
This research was funded by National Social Science Foundation of China, grant number 21VGQ005.
Institutional Review Board Statement
Not applicable.
Informed Consent Statement
Not applicable.
Data Availability Statement
The data presented in this study are available on request from the corresponding author. The data are not publicly available due to institutional and licensing restrictions of the China Household Income Project (CHIP) database and other confidential data agreements.
Conflicts of Interest
The authors declare no conflicts of interest.
Appendix A
Appendix A.1
Table A1.
The digital economy evaluation indicators and weights.
Table A1.
The digital economy evaluation indicators and weights.
| Primary Indicators | Secondary Indicators | Tertiary Indicators | Calculation or Description of the Indicators | Weights |
|---|---|---|---|---|
| Digital infrastructure | Network infrastructure | Internet penetration rate | Number of broadband internet users per 100 people | 0.056 |
| Communication infrastructure | Mobile phone penetration rate | Number of mobile phone users per 100 people | 0.044 | |
| Digital industrialization | Digital industry | Proportion of employees in the digital industry | Proportion of employees in information transmission, computer services, and software industry within the tertiary sector | 0.039 |
| Telecom service revenue | Telecommunication service revenue (10,000 yuan) | 0.094 | ||
| Industrial digitization | Digital applications | E-commerce scale | Postal service revenue (10,000 yuan) | 0.160 |
| Digital finance | Digital inclusive finance index | The Peking University Digital Financial Inclusion Index of China | 0.052 | |
| Digital innovation | Innovation output | Number of patents granted | Number of patents granted in the current year for inventions, utility models, and designs (unit) | 0.149 |
| Enterprise digital innovation level | Average number of digital patent applications by listed companies (unit) | 0.197 | ||
| Digitization potential | R&D capability | R&D expenditure intensity | Proportion of science and technology expenditure in local general public budget spending | 0.062 |
| Talent development | Human capital level | Number of college students per 10,000 people | 0.082 | |
| Government digital attention | Policy environment | The importance of the digital economy in government planning | Number of occurrences of digital economy-related terms in prefecture-level city government reports (count) | 0.066 |
Table A2.
Definitions of variables.
Table A2.
Definitions of variables.
| Variable Characteristics | Variables | Definitions |
|---|---|---|
| City-level | URII | The theil index, see Section 3.2.1 for the calculation method |
| DE | The digital economy: see Section 3.2.2 for the calculation method | |
| Econ | Economic development: the natural logarithm of GDP per capita | |
| Urb | Urbanization: proportion of urban permanent residents in the total population | |
| Edu | Education inputs: proportion of education expenditure in local general public budget spending | |
| Fin | Financial development: ratio of the financial deposit and loan balances to GDP at the end of the year | |
| Priind | Share of primary industry: proportion of primary industry added value in GDP | |
| Terind | Share of tertiary industry: proportion of tertiary industry added value in GDP | |
| Indup | Industrial structure upgrading: share of tertiary industry/share of secondary industry | |
| Individual-level | Income | Total income from the primary job of the interviewee in the year of interview, including various monetary subsidies, divided by the number of working months (1000 yuan). |
| Gen | Gender: male = 1, female = 0 | |
| Age | Age | |
| Agesqu | Square of the age | |
| Mar | Marital status: married, cohabited = 1, unmarried, divorced, separation, widowed = 0 | |
| Eth | Ethnicity: Han = 1, non-Han = 0 | |
| Health | Health condition: very good = 1, good = 2, fair = 3, poor = 4, very poor = 5 | |
| Eduatt | Educational attainment: if the interviewee has a high school diploma or above, it is set to 1, otherwise 0 | |
| Rural | Rural resident = 1, urban resident = 0 | |
| Household-level | Hsize | Household size: total household population |
| Hlab | Household labor structure: share of labor force (16–64 years old) in total household population | |
| Hedu | Household educational structure: share of household members with high school education or above | |
| Hinc | Household income surplus: household disposable income net of consumption expenditures (1000 yuan) |
Table A3.
Tests for alternative channels of the instrumental variables.
Table A3.
Tests for alternative channels of the instrumental variables.
| Variables | (1) | (2) | (3) | (4) | (5) | (6) |
|---|---|---|---|---|---|---|
| Share of Employment in Secondary and Tertiary Sector | Ratio of Secondary and Tertiary to Primary Employment | Secondary and Tertiary Sector Labor Productivity | ||||
| IV1 | −0.001 (0.002) | −0.003 (0.004) | −0.904 (0.900) | |||
| IV2 | −0.016 (0.042) | −0.032 (0.084) | −19.786 (20.493) | |||
| Controls | Yes | Yes | Yes | Yes | Yes | Yes |
| City FE | Yes | Yes | Yes | Yes | Yes | Yes |
| Year FE | Yes | Yes | Yes | Yes | Yes | Yes |
| N | 3348 | 3348 | 3348 | 3348 | 3348 | 3348 |
| R2 | 0.120 | 0.120 | 0.120 | 0.120 | 0.539 | 0.540 |
Note: The regressions presented in this table investigate whether the instrumental factors have an impact on urban–rural income disparity through different pathways associated with productivity and industrial structure. The dependent variable in columns (1)–(2) is the percentage of employment in the secondary and tertiary industries. The ratio of secondary and tertiary employment to primary employment is taken into account in columns (3)–(4). The ratio of combined value added to total employment in the secondary and tertiary sectors is used to quantify labor productivity, which is examined in columns (5)–(6). City fixed effects, year fixed effects, and a set of time-varying city-level control variables are included in every specification. Parentheses are used to report robust standard errors that are grouped at the city level. The China City statistics Yearbook and other city-level statistics yearbooks are the sources of the data.
Table A4.
The dynamic effects.
Table A4.
The dynamic effects.
| Variables | (1) |
|---|---|
| Theil | |
| DE | −0.237 *** (0.071) |
| DE × Year2009 | −0.039 (0.025) |
| DE × Year2010 | 0.016 (0.030) |
| DE × Year2011 | 0.034 (0.035) |
| DE × Year2012 | 0.034 (0.035) |
| DE × Year2013 | 0.169 *** (0.043) |
| DE × Year2014 | 0.208 *** (0.049) |
| DE × Year2016 | 0.252 *** (0.050) |
| DE × Year2017 | 0.269 *** (0.050) |
| DE × Year2018 | 0.276 *** (0.052) |
| DE × Year2019 | 0.276 *** (0.054) |
| Controls | Yes |
| City FE | Yes |
| Year FE | Yes |
| N | 3348 |
| R2 | 0.662 |
Note: *** represents the significance levels of 1%, with standard errors clustered at the city level in parentheses.
Table A5.
The digital economy and urban–rural income inequality: a micro perspective with detailed regression results.
Table A5.
The digital economy and urban–rural income inequality: a micro perspective with detailed regression results.
| Variables | (1) | (2) | (3) | (4) | (5) |
|---|---|---|---|---|---|
| Income | Income | Income | Income | Income | |
| DEat t = −1 | 5.340 ** (2.340) | 6.298 *** (2.039) | 6.878 *** (1.999) | 5.345 *** (1.913) | 3.561 ** (1.773) |
| Rural | 0.085 (0.070) | 0.330 *** (0.073) | 0.580 *** (0.072) | 0.571 *** (0.071) | |
| DEat t = −1 × Rural | −7.650 *** (0.628) | −7.668 *** (0.589) | −6.339 *** (0.516) | −6.254 *** (0.494) | |
| Gen | 0.947 *** (0.031) | 0.938 *** (0.031) | 0.938 *** (0.031) | ||
| Age | 0.136 *** (0.008) | 0.114 *** (0.008) | 0.114 *** (0.008) | ||
| Agesqu | −0.002 *** (0.000) | −0.002 *** (0.000) | −0.002 *** (0.000) | ||
| Mar | 0.299 *** (0.038) | 0.292 *** (0.039) | 0.292 *** (0.039) | ||
| Eth | −0.210 * (0.114) | −0.162 (0.106) | −0.160 (0.106) | ||
| Health | −0.193 *** (0.022) | −0.161 *** (0.020) | −0.161 *** (0.020) | ||
| Eduatt | 0.555 *** (0.061) | 0.087 (0.054) | 0.089 (0.054) | ||
| Hsize | −0.245 *** (0.029) | −0.245 *** (0.029) | |||
| Hlab | −0.432 *** (0.120) | −0.434 *** (0.120) | |||
| Hedu | 0.954 *** (0.110) | 0.953 *** (0.110) | |||
| Hinc | 0.014 *** (0.002) | 0.014 *** (0.002) | |||
| Econ | −0.419 (0.332) | ||||
| Urb | −0.419 (1.076) | ||||
| Edu | 2.248 (1.956) | ||||
| Indup | 0.044 (0.187) | ||||
| City FE | Yes | Yes | Yes | Yes | Yes |
| Province × Year FE | Yes | Yes | Yes | Yes | Yes |
| N | 69,405 | 69,405 | 69,405 | 69,405 | 69,405 |
| R2 | 0.075 | 0.084 | 0.117 | 0.154 | 0.154 |
Note: *, ** and *** represent the significance levels of 10%, 5% and 1%, with standard errors clustered at the city level in parentheses.
Table A6.
The PES evaluation indicators and weights.
Table A6.
The PES evaluation indicators and weights.
| Primary Indicators | Secondary Indicators | Tertiary Indicators | Calculation or Description of the Indicators | Weights |
|---|---|---|---|---|
| Fiscal support | Training subsidies | Subsidies for training centers | Number of training subsidies received by employment training centers in the current year/total number of trainees at the centers | 0.064 |
| Subsidies for training institutions | Number of training subsidies received by vocational training institutions in the current year/total number of trainees at the institutions | 0.469 | ||
| Service provision | Teacher capacity | Teacher–trainee ratio at training centers | Total number of teachers at employment training centers/total number of trainees in the current year | 0.095 |
| Teacher–trainee ratio at training institutions | Total number of teachers at vocational training institutions/total number of trainees in the current year | 0.064 | ||
| Service coverage | Service coverage of training centers | Number of trainees receiving training at employment training centers/local labor force | 0.056 | |
| Service coverage of training institutions | Number of trainees receiving training at vocational training institutions/local labor force | 0.062 | ||
| Service outcomes | Certification rate | Certification rate of training centers | Number of trainees at employment training centers obtaining vocational qualification certificates/total number of program completers | 0.034 |
| Certification rate of training institutions | Number of trainees at vocational training institutions obtaining vocational qualification certificates/total number of program completers | 0.038 | ||
| Success rate | Employment success rate of training centers | Number of trainees at employment training centers who become employed/total number of program completers | 0.057 | |
| Employment success rate of training institutions | Number of trainees at vocational training institutions who become employed/total number of program completers | 0.062 |
Appendix A.2
In Section 3.2.2, we provide an overview of the indicators and measurement approach used to construct the digital economy index. In this appendix, we offer a more detailed discussion of the theoretical rationale, indicator selection, and construction process underlying each component of the index.
- Digital infrastructure. Digital infrastructure development is crucial for driving the growth of the digital economy. As its foundational layer, digital infrastructure has become a key determinant of disparities in digital access and, consequently, income inequality between urban and rural areas [12]. The rapid expansion of internet and mobile phone users in both urban and rural regions is closely associated with sustained investments in digital infrastructure [65]. Accordingly, we include core indicators capturing internet and communication infrastructure development—namely, the internet penetration rate and the mobile phone penetration rate.
- Digital industrialization. Digital industrialization reflects the development and expansion of core digital industries, which constitute a central component of the digital economy [66]. Digital industries shape the scale and intensity of digital economic activity and influence regional economic performance by fostering digital production activities and generating employment opportunities [67]. In particular, the concentration of digital industry employment captures the extent to which labor resources are allocated toward information transmission, computer services, and software-related sectors, while telecommunication service revenue reflects the market scale and utilization intensity of digital services. Therefore, these indicators characterize the industrial foundation of the digital economy and its capacity to support digital transformation across regions. Accordingly, we include the proportion of employees in the digital industry and telecommunication service revenue as key indicators of digital industrialization.
- Industrial digitization. The term industrial digitization describes how digital technologies are incorporated into financial services, production, and distribution, changing conventional economic operations [68]. A key manifestation of this transformation is the digitalization of market transactions, whereby digital platforms increasingly mediate exchanges between firms and consumers. Online transactions have specifically changed consumer behavior and market access for businesses and families due to the quick growth of e-commerce platforms [69]. In order to connect online purchases to the movement of tangible items, logistics and expedited delivery services are essential. To address potential concerns regarding proxy selection, we further reconstruct the digital economy index using city-level e-commerce transaction values derived from the disaggregation of provincial-level data as an alternative measure for robustness checks.
Additionally, the efficiency and accessibility of financial resources have significantly increased due to the deep integration of digital technology with financial services [21]. Digital finance speeds up industrial digitalization by enabling online payments, credit access, and financial inclusion, especially for consumers and small enterprises. As a result, the digital inclusive finance index is used to gauge the growth of digital finance, and postal service revenue is used as a stand-in for digital applications.
- Digital innovation. Digital innovation reflects the capacity of an economy to generate, apply, and diffuse new digital technologies, and constitutes a core driving force of digital economy development [70]. Through promoting technical advancement, productivity growth, and the development of new business models, it plays a crucial role in influencing regional economic performance and structural transformation. Both innovation outputs and the volume of businesses’ digital technical activity are indicators of digital innovation at the municipal level [71]. Consequently, we use two complimentary indicators to capture this feature. The first metric, which captures overall innovation output, is the number of patents awarded, which is calculated as the total number of invention, utility model, and design patents granted in the current year. The average number of digital patent applications submitted by listed businesses serves as a proxy for the enterprise digital innovation level, which is the second indication of enterprises’ involvement in digital technology invention and application.
- Digitization potential. A key requirement for the long-term growth of the digital economy is digitization potential, which measures a region’s ability to create, absorb, and use digital technology. The unequal spread of digital technology across areas is shaped by differences in digitization potential, which may also lead to differences in income distribution and economic prospects. The degree of innovation investment and the availability of qualified human resources, which support businesses’ capacity to engage in digital transformation and innovation, are major determinants of digitization potential at the municipal level [72]. Accordingly, we construct this dimension using two core indicators: R&D expenditure intensity, capturing the commitment of resources to innovation activities, and human capital level, reflecting the stock of skilled labor.
- Government digital attention. The degree to which local governments acknowledge, prioritize, and strategically support digital development is reflected in the government’s focus on the digital economy. As an important institutional and policy-related dimension of the digital economy, government digital attention shapes the policy environment for digital infrastructure deployment, digital innovation, and industrial digital transformation [73]. Previous studies suggest that government emphasis on digital development, as revealed in official policy documents, can influence local digital investment and implementation outcomes [74]. In order to determine the relative relevance of the digital economy in local government planning, we assess government digital attention using the policy environment, which is proxied by the frequency of phrases relevant to the digital economy that occur in city government work reports at the prefecture level [47].
Appendix A.3
In Section 5.3, we further examine the robustness of our results by adopting an alternative measure of overeducation based on workers’ occupational skill requirements. The CHIP survey provides detailed information on respondents’ occupations, which enables us to classify jobs according to their skill intensity. Specifically, the CHIP questionnaire categorizes respondents’ occupations into several broad groups, including (but not limited to): principals in government agencies or enterprises, professional and technical personnel, clerical and related staff, commercial and service workers, agricultural, forestry, animal husbandry, fishery and water conservancy workers, production and transportation equipment operators, and other related occupations.
References
- United Nations. The Sustainable Development Goals Report 2024; United Nations: New York, NY, USA, 2024; pp. 1–48. [Google Scholar]
- Yan, D.; Sun, W.; Li, P.; Liu, C.; Li, Y. Effects of Economic Growth Target on the Urban–Rural Income Gap in China: An Empirical Study Based on the Urban Bias Theory. Cities 2025, 156, 105518. [Google Scholar] [CrossRef]
- Wang, Z.; Zheng, X.; Wang, Y.; Bi, G. A Multidimensional Investigation on Spatiotemporal Characteristics and Influencing Factors of China’s Urban-Rural Income Gap (URIG) since the 21st Century. Cities 2024, 148, 104920. [Google Scholar] [CrossRef]
- Liu, J.; Wang, X. Exploring the Driving Effect of the Digital Economy on Rural Labor Force’s Occupational Transformation: Based on Analysis of CFPS Panel Data. Int. Rev. Financ. Anal. 2025, 101, 104010. [Google Scholar] [CrossRef]
- Bai, C.; Guan, W.; Wang, D.; Chen, X. Digital Village Construction and the Quality of Life of Rural Residents. Int. Rev. Econ. Financ. 2024, 96, 103729. [Google Scholar] [CrossRef]
- Gao, X.; Li, M.-S. The Impact of the Digital Economy on the Urban-Rural Income Gap: Evidence from Provincial Panel Data in China. Appl. Econ. Lett. 2024, 31, 2233–2236. [Google Scholar] [CrossRef]
- Zhang, B.; Dong, W.; Yao, J.; Cheng, X. Digital Economy, Factor Allocation Efficiency of Dual-Economy and Urban-Rural Income Gap. Sustainability 2023, 15, 13514. [Google Scholar] [CrossRef]
- Li, X.; He, P.; Liao, H.; Liu, J.; Chen, L. Does Network Infrastructure Construction Reduce Urban–Rural Income Inequality? Based on the “Broadband China” Policy. Technol. Forecast. Soc. Change 2024, 205, 123486. [Google Scholar] [CrossRef]
- Duanmu, X.; Yu, J.; Yuan, X.; Zhang, X. How Does Digital Infrastructure Mitigate Urban–Rural Disparities? Sustainability 2025, 17, 1561. [Google Scholar] [CrossRef]
- Guo, P.; Yin, Z.; Zhu, H.; Gou, K. The Impact of Governments’ Digital Economy Procurement on Rural Household Entrepreneurship. Emerg. Mark. Financ. Trade 2024, 60, 2703–2718. [Google Scholar] [CrossRef]
- Peng, Z.; Dan, T. Digital Dividend or Digital Divide? Digital Economy and Urban-Rural Income Inequality in China. Telecommun. Policy 2023, 47, 102616. [Google Scholar] [CrossRef]
- Cao, Q.; Ni, P.; Guo, J. Broadband Internet and Income Inequality among the Floating Population: Evidence from the “Broadband China” Strategy in China. China Econ. Rev. 2025, 90, 102369. [Google Scholar] [CrossRef]
- Deng, X.; Guo, M.; Liu, Y. Digital Economy Development and the Urban-Rural Income Gap: Evidence from Chinese Cities. PLoS ONE 2023, 18, e0280225. [Google Scholar] [CrossRef]
- Shen, C.; Wu, X.; Shi, L.; Wan, Y.; Hao, Z.; Ding, J.; Wen, Q. How Does the Digital Economy Affect the Urban–Rural Income Gap? Evidence from Chinese Cities. Habitat Int. 2025, 157, 103327. [Google Scholar] [CrossRef]
- Zhang, Y.; Hainan, L.; Feng, F.; Wu, X. Digital Economy, Education, Human Capital and Urban–Rural Income Disparity. Financ. Res. Lett. 2025, 71, 106464. [Google Scholar] [CrossRef]
- Lin, X.; Jiang, Y. The Impact of Industrial Digitalization on the Urban-Rural Income Gap. PLoS ONE 2025, 20, e0335065. [Google Scholar] [CrossRef] [PubMed]
- Liu, Y.; Dong, C. Digital Finance, Social Welfare Investment, and Urban–Rural Income Inequality: Moderating Role of Regional Economics and Regional Disparities. Financ. Res. Lett. 2025, 77, 107077. [Google Scholar] [CrossRef]
- Publishing House of Electronics Industry. China Internet Development Report 2022: Blue Book for World Internet Conference; Springer Nature: Cham, Switzerland, 2023; ISBN 978-981-9951-30-7. [Google Scholar]
- Zhang, X.; Fang, C.; Ma, H.; Hu, X. How Does Digital Economy Affect Urban-Rural Integration? An Empirical Study from China. Habitat Int. 2024, 154, 103229. [Google Scholar] [CrossRef]
- Luo, Z.; Jin, H. Will E-Commerce in Rural Areas Increase Farmers’ Income? The Intermediary Mechanism Based on the Popularity of Inclusive Loans. Int. Rev. Financ. Anal. 2026, 110, 104856. [Google Scholar] [CrossRef]
- Zhan, Y.; Gao, D.; Feng, M.; Yan, S. Digital Finance, Non-Agricultural Employment, and the Income-Increasing Effect on Rural Households. Int. Rev. Financ. Anal. 2025, 98, 103897. [Google Scholar] [CrossRef]
- Chen, Z.; Cui, R.; Tang, C.; Wang, Z. Can Digital Literacy Improve Individuals’ Incomes and Narrow the Income Gap? Technol. Forecast. Soc. Change 2024, 203, 123332. [Google Scholar] [CrossRef]
- de Clercq, M.; D’Haese, M.; Buysse, J. Economic Growth and Broadband Access: The European Urban-Rural Digital Divide. Telecommun. Policy 2023, 47, 102579. [Google Scholar] [CrossRef]
- Murthy, K.V.B.; Kalsie, A.; Shankar, R. Digital Economy in a Global Perspective: Is There a Digital Divide? Transnatl. Corp. Rev. 2021, 13, 1–15. [Google Scholar] [CrossRef]
- Braesemann, F.; Lehdonvirta, V.; Kässi, O. ICTs and the Urban-Rural Divide: Can Online Labour Platforms Bridge the Gap? Inf. Commun. Soc. 2022, 25, 34–54. [Google Scholar] [CrossRef]
- Fafchamps, M.; Minten, B. Impact of SMS-Based Agricultural Information on Indian Farmers. World Bank Econ. Rev. 2012, 26, 383–414. [Google Scholar] [CrossRef]
- Huang, T.; Quan, Y. Narrowing the Digital Divide: The Growth and Distributional Effect of Internet Use on Income in Rural China. China Econ. Rev. 2025, 91, 102387. [Google Scholar] [CrossRef]
- Tewathia, N.; Kamath, A.; Ilavarasan, P.V. Social Inequalities, Fundamental Inequities, and Recurring of the Digital Divide: Insights from India. Technol. Soc. 2020, 61, 101251. [Google Scholar] [CrossRef]
- Wang, Y.; Wang, X.; Zhou, H.; Chen, X.; Mao, X. Industrial Digitalization and Urban-Rural Income Gap: An Empirical Analysis Based on Data from 30 Provinces in China. Econ. Anal. Policy 2025, 87, 2023–2042. [Google Scholar] [CrossRef]
- Qian, C.; Zhu, C.; Huang, D.-H.; Zhang, S. Examining the Influence Mechanism of Artificial Intelligence Development on Labor Income Share through Numerical Simulations. Technol. Forecast. Soc. Change 2023, 188, 122315. [Google Scholar] [CrossRef]
- Luo, H.; Hu, Q. A Re-Examination of the Influence of Human Capital on Urban-Rural Income Gap in China: College Enrollment Expansion, Digital Economy and Spatial Spillover. Econ. Anal. Policy 2024, 81, 494–519. [Google Scholar] [CrossRef]
- Yuchtman, N. Teaching to the Tests: An Economic Analysis of Traditional and Modern Education in Late Imperial and Republican China. Explor. Econ. Hist. 2017, 63, 70–90. [Google Scholar] [CrossRef]
- Wang, R.; Zameer, H.; Feng, Y.; Jiao, Z.; Xu, L.; Gedikli, A. Revisiting Chinese Resource Curse Hypothesis Based on Spatial Spillover Effect: A Fresh Evidence. Resour. Policy 2019, 64, 101521. [Google Scholar] [CrossRef]
- Oryoie, A.R.; Vahidmanesh, A. The Rate of Return to Education in Iran. J. Knowl. Econ. 2022, 13, 813–829. [Google Scholar] [CrossRef]
- Weng, Y.; Li, M.; Foo, C.-T. Education inside China: A Longitudinal (1989–2011) Analysis. Chin. Manag. Stud. 2016, 10, 217–241. [Google Scholar] [CrossRef]
- Bar Haim, E.; Shavit, Y. Expansion and Inequality of Educational Opportunity: A Comparative Study. Res. Soc. Stratif. Mobil. 2013, 31, 22–31. [Google Scholar] [CrossRef]
- Bahl, S.; Sharma, A. Heterogeneity among Migrants, Education–Occupation Mismatch and Returns to Education. Reg. Stud. 2022, 57, 1851–1865. [Google Scholar] [CrossRef]
- Chen, Z.; Li, X.; Xia, X. Measurement and Spatial Convergence Analysis of China’s Agricultural Green Development Index. Environ. Sci. Pollut. Res. 2021, 28, 19694–19709. [Google Scholar] [CrossRef]
- Valenduc, G. New Forms of Work and Employment in the Digital Economy. In The Deconstruction of Employment as a Political Question: ‘Employment’ as a Floating Signifier; Serrano-Pascual, A., Jepsen, M., Eds.; Springer International Publishing: Cham, Switzerland, 2019; pp. 63–80. ISBN 978-3-319-93617-8. [Google Scholar]
- Millard, J. Rural Areas in the Digital Economy. In Winning and Losing; Routledge: New York, NY, USA, 2005; ISBN 978-1-351-14308-0. [Google Scholar]
- Malecki, E.J. Digital Development in Rural Areas: Potentials and Pitfalls. J. Rural. Stud. 2003, 19, 201–214. [Google Scholar] [CrossRef]
- Zeng, X.; Bai, Y.; Wu, J.; Qiu, Y.; Zhang, L. The Impact of Vocational Skills Training of Public Employment Services on Off-Farm Employment: Evidence from Rural China. J. Asian Econ. 2026, 102, 102095. [Google Scholar] [CrossRef]
- Mergele, L.; Weber, M. Public Employment Services under Decentralization: Evidence from a Natural Experiment. J. Public Econ. 2020, 182, 104113. [Google Scholar] [CrossRef]
- Xiong, B.; Li, J. The Impact of Public Employment Services Efficiency on the Urban Rural Income Gap and Its Spatial Spillover Effect. Sustainability 2025, 17, 1012. [Google Scholar] [CrossRef]
- OECD. OECD Digital Economy Outlook 2024 (Volume 1): Embracing the Technology Frontier; OECD Publishing: Paris, France, 2024. [Google Scholar]
- Dong, F.; Hu, M.; Gao, Y.; Liu, Y.; Zhu, J.; Pan, Y. How Does Digital Economy Affect Carbon Emissions? Evidence from Global 60 Countries. Sci. Total Environ. 2022, 852, 158401. [Google Scholar] [CrossRef] [PubMed]
- Li, Z.; Chen, L.; Sun, W.; Zhang, Y.; Lin, G. Multiscale Spatial Heterogeneity and Interactions of Digital Economy Development and Urban-Rural Income Inequality on Energy-Related Carbon Emissions in Chinese Cities. Energy 2026, 342, 139739. [Google Scholar] [CrossRef]
- Li, M.; Yang, J. Can Digital Economy Mitigate Vertical Fiscal Imbalances in Chinese Local Government? The Role of Fiscal Transparency. Int. Rev. Financ. Anal. 2024, 96, 103713. [Google Scholar] [CrossRef]
- Qian, J.; Zhou, Y.; Hao, Q. The Effect and Mechanism of Digital Economy on Green Total Factor Productivity—Empirical Evidence from China. J. Environ. Manag. 2024, 372, 123237. [Google Scholar] [CrossRef]
- Su, C.-W.; Liu, T.-Y.; Chang, H.-L.; Jiang, X.-Z. Is Urbanization Narrowing the Urban-Rural Income Gap? A Cross-Regional Study of China. Habitat Int. 2015, 48, 79–86. [Google Scholar] [CrossRef]
- Su, C.; Song, Y.; Ma, Y.; Tao, R. Is Financial Development Narrowing the Urban–Rural Income Gap? A Cross-regional Study of China. Pap. Reg. Sci. 2019, 98, 1779–1801. [Google Scholar] [CrossRef]
- Wang, Y.; Zhou, J.; Zhang, R. Market Accessibility, Agglomeration, and Spatial Location of Digital Enterprises. Int. Rev. Econ. Financ. 2025, 98, 103842. [Google Scholar] [CrossRef]
- Zhong, S.; Huang, X.; Mao, X. Deciphering China’s Urban-Rural Income Gap: A Multi-Level Analysis, 2006–2020. Cities 2026, 168, 106488. [Google Scholar] [CrossRef]
- Nunn, N.; Qian, N. US Food Aid and Civil Conflict. Am. Econ. Rev. 2014, 104, 1630–1666. [Google Scholar] [CrossRef]
- Chen, W.; Xu, J.; Chen, X.; Hu, X. Creating Cities and Food Security Challenge: Evidence from the City–County Merger Policy in China. China Econ. Rev. 2024, 88, 102257. [Google Scholar] [CrossRef]
- Garibaldi, P.; Gomes, P.; Sopraseuth, T. Output Costs of Education and Skill Mismatch in OECD Countries. Econ. Lett. 2025, 250, 112278. [Google Scholar] [CrossRef]
- Jones, M.; Kaya, E.; Nan, J. Overeducation, Earnings and Job Satisfaction among Graduates in China. China Econ. Rev. 2025, 93, 102448. [Google Scholar] [CrossRef]
- McGuinness, S.; Pouliakas, K.; Redmond, P. Skills Mismatch: Concepts, Measurement and Policy Approaches. J. Econ. Surv. 2018, 32, 985–1015. [Google Scholar] [CrossRef]
- Acemoglu, D.; Autor, D. Skills, Tasks and Technologies: Implications for Employment and Earnings. In Handbook of Labor Economics; Card, D., Ashenfelter, O., Eds.; Elsevier: Amsterdam, The Netherlands, 2011; Volume 4, pp. 1043–1171. [Google Scholar]
- Barrios, E.B. Infrastructure and Rural Development: Household Perceptions on Rural Development. Prog. Plan. 2008, 70, 1–44. [Google Scholar] [CrossRef]
- Xia, H.; Yu, H.; Wang, S.; Yang, H. Digital Economy and the Urban–Rural Income Gap: Impact, Mechanisms, and Spatial Heterogeneity. J. Innov. Knowl. 2024, 9, 100505. [Google Scholar] [CrossRef]
- Chen, Y.; Ye, Q. Is the Digital Government Achieving Its Sustainability Goals? The Impact of Urban Mobile Government Apps on the Urban-Rural Income Gap. Cities 2025, 165, 106073. [Google Scholar] [CrossRef]
- Wang, S.; Wu, C.; Fu, B. The Dual Effects of Digital Inclusive Finance on the Urban-Rural Income Gap: An Empirical Investigation in China’s Yangtze River Delta Region. Financ. Res. Lett. 2024, 69, 106049. [Google Scholar] [CrossRef]
- Wang, L.; Sun, Y. Digital Dividends? Rural E-Commerce Policy and Urban-Rural Income Disparity in China. Telecommun. Policy 2025, 49, 103058. [Google Scholar] [CrossRef]
- Chen, N.; Hu, Y. The Critical Role of Digital Infrastructure in Inequality: New Evidence from Urban-Rural Consumption in China. Int. Rev. Econ. Financ. 2025, 104, 104766. [Google Scholar] [CrossRef]
- Li, Z.; Wu, L.; Li, J.; Zhang, Y. The Impact of Digital Industrialization on the Level of Green Development. Int. Rev. Econ. Financ. 2025, 101, 104193. [Google Scholar] [CrossRef]
- Zhang, Z. The Impact of the Artificial Intelligence Industry on the Number and Structure of Employments in the Digital Economy Environment. Technol. Forecast. Soc. Change 2023, 197, 122881. [Google Scholar] [CrossRef]
- Gao, P.; Zhang, K.; Zheng, P. The Impact of Industrial Digitization on the Global Value Chains Position: Evidence from China’ s Industry Sectors. Econ. Anal. Policy 2024, 82, 147–162. [Google Scholar] [CrossRef]
- Wei, B.; Zhao, C.; Luo, M. Online Markets, Offline Happiness: E-Commerce Development and Subjective Well-Being in Rural China. China Econ. Rev. 2024, 87, 102247. [Google Scholar] [CrossRef]
- Yu, S.; Zheng, X.; Liu, M.J. Board Digital Expertise and Digital Innovation: Evidence from Commercial Banks in China. Res. Int. Bus. Financ. 2025, 76, 102854. [Google Scholar] [CrossRef]
- Sun, Y.; Hu, L.; He, F.; Chen, L. Digital Innovation and Green Productivity Gap. Sci. Rep. 2025, 15, 40932. [Google Scholar] [CrossRef] [PubMed]
- Kong, X.; Zhang, J. Digital Government Governance, Financial Technology, and Regional Digital Economy Development: A Quasi-Natural Experiment Based on Big Data Management Agency Reform. Financ. Res. Lett. 2026, 89, 109143. [Google Scholar] [CrossRef]
- Zhang, P.; Wang, S.; Li, B. Harnessing Government Digital Attention: Reducing Carbon Emissions through the Pathways of Digitalization. Struct. Change Econ. Dyn. 2025, 74, 1008–1019. [Google Scholar] [CrossRef]
- Li, X.; Yue, S. Does the Government Digital Attention Improve China’s Digital Economy Output Efficiency: Accelerator or Inhibitor. Econ. Anal. Policy 2025, 85, 607–625. [Google Scholar] [CrossRef]


Disclaimer/Publisher’s Note: The statements, opinions and data contained in all publications are solely those of the individual author(s) and contributor(s) and not of MDPI and/or the editor(s). MDPI and/or the editor(s) disclaim responsibility for any injury to people or property resulting from any ideas, methods, instructions or products referred to in the content. |
© 2026 by the authors. Licensee MDPI, Basel, Switzerland. This article is an open access article distributed under the terms and conditions of the Creative Commons Attribution (CC BY) license.