Abstract
Monitoring construction-phase settlement of estuary-crossing tunnels founded on coastal soft soils is critical for risk management, yet dense in situ measurements are often unavailable along linear corridors. This study uses Sentinel-1A ascending SAR imagery (65 scenes, September 2022–August 2025) to retrieve time-series deformation along the Sanya Estuary Channel tunnel (China) using Permanent Scatterer InSAR (PS-InSAR) and Small Baseline Subset InSAR (SBAS-InSAR). The two approaches reveal a consistent subsidence hotspot at Tunnel Section D (DK0+000–DK0+330), while most of the corridor remains within ±5 mm/a. The line-of-sight deformation rates range from −24 to 17.7 mm/year (PS-InSAR) and −29.9 to 18.7 mm/a (SBAS-InSAR). Time-series analysis at representative points in Section D indicates a maximum cumulative settlement of −75.7 mm and a clear acceleration after May 2023. By integrating the deformation results with geological reports, construction logs and rainfall records, we infer that compressible marine clays and interbedded sand/aquifer zones control the hotspot, whereas excavation/dewatering and rainfall-related groundwater fluctuations further promote consolidation. The results provide a practical basis for subsidence risk screening and monitoring prioritization for estuary-crossing infrastructure in coastal soft-soil settings. From a sustainability perspective, the proposed joint PS–SBAS InSAR framework provides a scalable and cost-effective tool for continuous deformation surveillance, supporting preventive maintenance and risk-informed management of urban underground infrastructure.
1. Introduction
Coastal cities built on thick soft deposits are facing increasing geohazard risks due to the combined effects of rapid urbanization, land subsidence and accelerated sea-level rise. Recent global assessments indicate that land subsidence already affects hundreds of coastal and deltaic cities worldwide and may expose up to 1.6 billion people and trillions of dollars in assets to intensified coastal flooding by 2040 [1]. At the same time, the latest IPCC Sixth Assessment Report confirms that the rate of global mean sea-level rise has accelerated to about 3.7 mm/a over the past decades, with particularly high vulnerability in low-lying tropical coasts [2,3]. In this context, estuary-crossing tunnels and channels act as lifeline infrastructures that concentrate traffic, tourism and emergency functions; their long-term stability is therefore a key prerequisite for sustainable coastal development.
Many coastal corridors in East and Southeast Asia are founded on thick layers of marine soft clay and reclaimed fill, which are characterized by high water content, high void ratio, low shear strength and pronounced creep and secondary consolidation [4,5,6,7]. Recent experimental and numerical studies have demonstrated that marine soft clays under cyclic loading and long-term surcharge exhibit large time-dependent deformation and degradation of stiffness, especially when the soil is under-consolidated or partially saturated [8,9,10]. These rheological properties, together with complex stratigraphic alternations of soft clay, sand and silt, make deep excavations and tunnel construction in such environments highly susceptible to excessive settlement, lateral displacement and seepage-induced instability.
Engineering practice shows that construction activities can significantly amplify deformation in soft-soil coastal settings. Large-scale open-cut excavation and deep dewatering disturb the in situ stress and pore-pressure fields, leading to base heave, wall deflection and accelerated consolidation of underlying soft layers [11,12]. For shield or frozen-soil tunnelling, frost heave and thaw settlement may further contribute to differential deformation of the lining and surrounding ground [13]. In coastal zones subject to intense monsoonal rainfall, the interaction between construction-induced pore-pressure changes and rainfall-driven groundwater fluctuations can give rise to delayed and cumulative settlement responses, yet these coupled mechanisms are still poorly quantified for many estuarine projects [14,15]. Traditional geodetic techniques such as spirit leveling and GNSS provide millimeter-level point measurements, but they are difficult to deploy densely along multi-kilometre corridors crossing rivers, reclaimed platforms and built-up areas, and thus cannot fully capture the spatially continuous and temporally evolving deformation patterns.
Over the past two decades, multi-temporal interferometric synthetic aperture radar (MT-InSAR) has emerged as a powerful tool for wide-area monitoring of slow ground deformation with millimeter accuracy [16,17,18]. Time-series InSAR techniques such as the small baseline subset (SBAS) and persistent scatterer interferometry (PS-InSAR) have been extensively reviewed and continuously improved in terms of pixel selection strategies, baseline configuration, deformation modelling and error mitigation [19,20,21,22]. Recent advances in tropospheric delay modelling, atmospheric phase screen estimation and big-data processing frameworks have further enhanced the reliability of MT-InSAR products over large regions [23]. With the routine acquisition of Sentinel-1 data, long time series of C-band SAR images are now freely available, enabling operational deformation monitoring for infrastructure management at regional to national scales [24]. Previous studies have compared Sentinel-1 time-series InSAR (PSI/SBAS) results with independent geodetic measurements (e.g., GNSS and leveling) and reported good agreement, supporting the use of Sentinel-1 InSAR for infrastructure deformation monitoring [25].
Consequently, MT-InSAR has been increasingly applied to monitor deformation of transportation and hydraulic infrastructures founded on soft soils. Case studies have reported detailed subsidence patterns and structural responses for reclaimed coastal airports [26], highways and embankments [27], metro systems in large coastal megacities [28], and hydropower dams and reservoirs [29]. Several works have also explored integrated frameworks that combine InSAR with LiDAR, GNSS, engineering geological information and machine-learning models to improve the interpretation and prediction of land subsidence in coastal environments [30,31]. Nevertheless, most existing applications focus on planar infrastructures such as airports or on buried metro lines within urban plains. Systematic MT-InSAR analyzes dedicated to estuary-crossing tunnels and channels—especially those constructed in thick marine soft soils using combined open-cut and pipe-curtain freezing methods in tropical climates—remain scarce.
Despite these advances, several important gaps remain. The first concerns how construction techniques such as deep open-cut excavation, dewatering and ground freezing jointly control the spatiotemporal evolution of deformation in marine soft-soil settings at the scale of an entire estuary channel; this coupling is still poorly quantified. In addition, only a limited number of studies have explicitly examined the delayed and stage-dependent response of tunnel or channel settlement to rainfall-induced groundwater fluctuations in tropical estuarine environments. Furthermore, the complementary strengths of PS-InSAR and SBAS-InSAR have rarely been fully exploited in mixed urban–estuarine terrains, where engineered structures, reclaimed platforms and natural soft-soil surfaces coexist, especially under warm-humid coastal conditions.
The Sanya Estuary Channel in southern China provides a representative case study to address these gaps. The project spans the Sanya River estuary and connects the Hexi urban area with the Luhuitou Peninsula, crossing thick sequences of saturated marine soft clay, sand and artificial fill under a warm-humid monsoon climate. An innovative construction scheme combining freeze-wall tunnelling beneath the estuary with open-cut excavation on both banks was adopted, making the project highly sensitive to geotechnical and hydrological disturbances. In this study, we jointly apply PS-InSAR and SBAS-InSAR to 65 Sentinel-1A ascending SAR images acquired between September 2022 and August 2025 to obtain high-resolution deformation time series over the entire estuary corridor. From an engineering risk-management perspective, the key uncertainty is the spatiotemporal localization and timing of settlement along the corridor during construction, especially when dense and continuous in situ monitoring is not feasible. By providing deformation-rate and cumulative-settlement maps together with time-series displacement at critical sections, the proposed framework supports risk-based decisions, including ranking sections by settlement hazard, prioritizing monitoring and inspection, and identifying stages that may require intensified management actions. By integrating InSAR-derived deformation fields with geological investigation data, construction records and rainfall statistics, we aim to (1) delineate the spatial distribution and temporal evolution of settlement along the Sanya Estuary Channel, with a particular focus on Tunnel Section D; (2) quantify the consistency and complementary strengths of PS-InSAR and SBAS-InSAR in a complex coastal soft-soil environment; and (3) elucidate the coupled roles of marine soft soil stratigraphy, construction activities and rainfall-induced groundwater fluctuations in driving the observed settlement. The findings are expected to provide methodological and practical insights for deformation monitoring and risk assessment of estuary-crossing infrastructures in similar tropical coastal regions.
2. Study Area and Data Sources
2.1. Study Area and Project Background
The Sanya Estuary Channel Project is located in Tianya District, Sanya City, southern China (Figure 1). It spans the Sanya River estuary and connects the Hexi urban area on the north bank with the Luhuitou Peninsula on the south bank. The main line has a total length of approximately 3.1 km and is designed as an urban arterial road with a four-lane, bidirectional carriageway and a design speed of 40 km/h. To safely cross the estuary under complex geological and hydrological conditions, the project adopts a combined construction scheme of “freeze-wall tunneling beneath the estuary + open-cut excavation on both banks”. The underwater tunnel section beneath the river is constructed using a pipe-curtain freezing method to form a continuous frozen wall, with a maximum freezing depth of about 25 m, while the two land-based approach sections on both banks are built by open-cut excavation. The two working shafts, located in the Hexi and Luhuitou areas, reach excavation depths of approximately 28 m and 29 m, respectively.
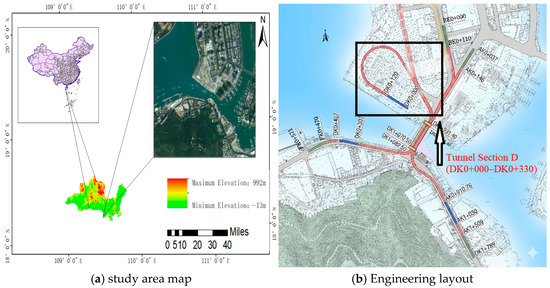
Figure 1.
Study area and engineering background.
The geological conditions within the project area are highly complex. The strata are dominated by Quaternary marine deposits and artificial fill, among which a widely distributed flowing-plastic silty clay layer with a thickness of roughly 3.8–8.5 m is present. This marine soft soil is characterized by high natural water content, large void ratio, high compressibility and low shear strength. Typical parameters derived from site investigation indicate a natural water content of about 45–65%, a void ratio of 1.2–1.8, and a compression coefficient in the range of 0.5–1.2 MPa−1, classifying it as a highly compressible soft-soil layer. Under deep foundation pit excavation and the repeated freeze–thaw cycles associated with the pipe-curtain freezing method, such soils are prone to long-term creep settlement and differential deformation, posing potential risks to the stability of the tunnel lining, shafts and adjacent surface structures.
The combination of thick marine soft soils, deep excavations and complex construction procedures makes the Sanya Estuary Channel particularly sensitive to deformation. Conventional geodetic techniques such as spirit leveling and GNSS can provide millimeter-level accuracy at discrete benchmarks, but they are difficult to deploy with sufficient density and continuity along a 3.1 km estuarine corridor that crosses waterways, reclaimed platforms and densely built-up areas. In contrast, time-series interferometric synthetic aperture radar (InSAR) offers wide-area coverage, millimeter-scale sensitivity and all-weather acquisition capability, enabling the detection of subtle surface and structural deformations over the entire corridor. In this study, we therefore employ a joint PS- and SBAS-InSAR framework to obtain long-term, high-resolution deformation fields as the basis for construction safety assessment and subsequent operation and maintenance of the Sanya Estuary Channel.
2.2. Data Sources
For the Sanya Estuary Channel study area, a total of 65 Sentinel-1A ascending-orbit SAR images covering the Sanya region from September 2022 to August 2025 were collected as the primary data source. Sentinel-1A operates in C-band and, in this study, the Interferometric Wide Swath (IW) mode with VV polarization is used, providing a nominal ground-range by azimuth resolution of approximately 5 m × 20 m, a 12-day revisit interval, and an incidence angle of about 39°.
To ensure high processing accuracy, several auxiliary datasets were also employed. Precise orbit ephemerides obtained from the Copernicus data hub were used to reduce orbital errors, and the ASTER GDEM v3 with a spatial resolution of 30 m, downloaded from the Geospatial Data Cloud, served as the digital elevation model (DEM) for removing topographic phase contributions. In addition, geological investigation reports, construction logs and daily rainfall records for the Sanya Estuary Channel were compiled and used to assist the interpretation of deformation patterns and to analyze the potential driving factors. Sentinel-1A has a nominal 12-day repeat cycle. However, over our study area the Sentinel-1 archive does not provide acquisitions for every nominal cycle (i.e., some scenes are simply not available in the archive for the corresponding dates). Therefore, the acquisition dates used in this study are not strictly spaced by 12 days, as shown in Table 1.

Table 1.
Sentinel Data Schedule.
3. Methodology
This study integrates SBAS-InSAR and PS-InSAR time-series analysis techniques and utilizes Sentinel-1A SAR imagery acquired between September 2022 and August 2025. Through a series of processing steps—including precise orbit correction, phase unwrapping, and atmospheric delay mitigation—surface deformation across the study area was systematically retrieved. Methodologically, PS-InSAR focuses on the high-precision detection of permanent scatterers such as buildings and road structures, whereas SBAS-InSAR enhances deformation monitoring over natural surfaces by optimizing the combination of short spatiotemporal baseline interferometric pairs. On this basis, representative feature points were selected for time-series deformation analysis to reveal their dynamic evolutionary behavior. Finally, InSAR-derived deformation results were integrated with geological investigation data, rainfall records, and construction information for multi-source data integration and spatial correlation analysis, enabling systematic identification of dominant deformation drivers and providing scientific guidance for safety risk prevention of the Sanya Estuary Channel Project. To improve engineering transparency, we provide an overall workflow diagram (Figure 2) summarizing the complete pipeline from data inputs to InSAR processing, engineering interpretation, and management-oriented outputs. Auxiliary engineering/geological and construction information (Table 2 and Table 3) is used as input for the interpretation stage.
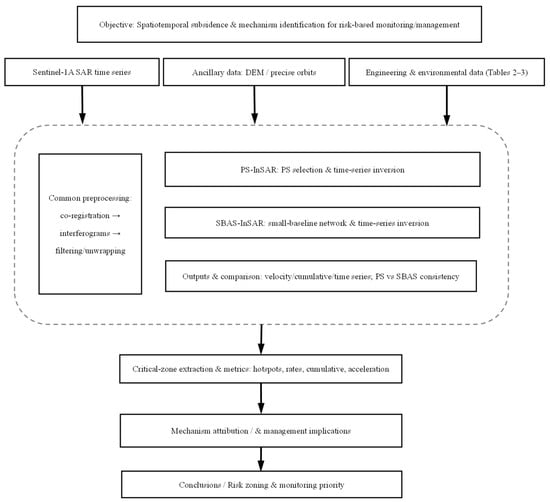
Figure 2.
Overall workflow of the study (from data inputs to InSAR processing, engineering interpretation, and management-oriented outputs).
Table 2.
Burial Depths and Elevations of Various Strata.
Table 3.
Construction Method Table.
3.1. PS-InSAR Processing Methodology
Permanent scatterers (PS points) were identified using a dual-threshold approach based on the amplitude dispersion index and the temporal coherence. The amplitude dispersion threshold was set to ≤0.35 and the temporal coherence threshold to ≥0.75 in order to select scatterers with stable backscattering characteristics throughout the observation period. The Sentinel-1A acquisition on 21 January 2024 was chosen as the super master image (Figure 3), and PS candidates were connected using Delaunay triangulation to construct the interferometric network.
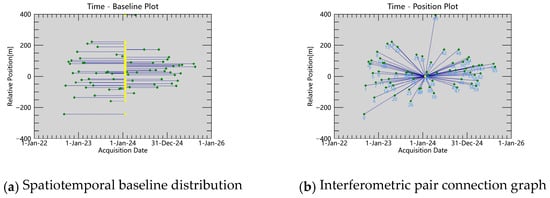
Figure 3.
Spatial and temporal baselines of PS-InSAR interferometric pairs.
Each interferometric pair was then subjected to standard differential interferometric processing. Multi-looking was applied with 4 looks in range and 1 look in azimuth. The topographic phase component was removed using the 30 m resolution ASTER GDEM, and the flat-earth phase was eliminated by polynomial fitting. Two-dimensional phase unwrapping was performed with an improved minimum-cost-flow algorithm, with an unwrapping coherence threshold of 0.30; pixels with lower coherence were masked out.
A spatiotemporal phase observation model was constructed to jointly estimate the linear deformation rate and elevation residual for each PS point by means of singular value decomposition (SVD). Spatiotemporal filtering was applied to separate nonlinear deformation, atmospheric delay and residual orbital errors: atmospheric components were isolated using spatial low-pass and temporal high-pass filtering, whereas orbit-related ramps were corrected with a quadratic polynomial model. Finally, LOS deformation time series for each PS point were estimated using iterative regression. Because Sentinel-1 InSAR measures displacement along the radar line of sight (LOS), we projected LOS deformation into the vertical direction using the local incidence angle, assuming that deformation in the study area is predominantly vertical (i.e., the horizontal component is small for settlement-dominated motion). The results were then geocoded to the WGS 84 geographic coordinate system (Figure 4). Because InSAR deformation is relative, the PS time series were referenced to a stable point automatically selected by SARscape (v5.7) based on multi-temporal stability (e.g., temporal coherence). All PS displacements and velocities are reported relative to this reference.
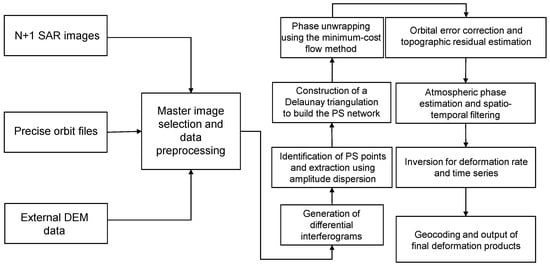
Figure 4.
PS-InSAR processing workflow.
3.2. SBAS-InSAR Processing Methodology
For the SBAS-InSAR analysis, we used a temporal baseline threshold of ±180 days and a perpendicular baseline threshold of 750 m, which corresponds to about 15% of the Sentinel-1 critical baseline (approximately 5 km), to construct the small-baseline interferometric network. Multi-looking was applied with 4 looks in range and 1 look in azimuth. All Sentinel-1A images were grouped into several small-baseline subsets using a hierarchical clustering algorithm (Figure 5), and a multi-master strategy was applied to maximize coherence within each subset. Each interferometric pair was precisely co-registered and differentially processed, and the Goldstein adaptive filter was used to enhance the quality of the interferograms. Phase unwrapping was carried out using a Delaunay minimum-cost-flow (MCF) algorithm.
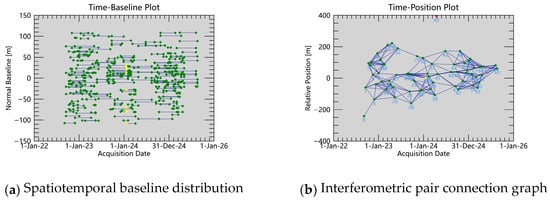
Figure 5.
Spatial and temporal baselines of SBAS-InSAR interferometric pairs.
Reference area definition and inter-method alignment. Because InSAR provides relative deformation, we defined a stable reference area outside the construction influence zone using coherence/stability criteria (high coherence and no evident deformation signal in preliminary solutions). SBAS time series were referenced by removing the mean displacement of this stable area. For comparability, the PS-InSAR results were further aligned to the same reference area (zero-mean over the reference area), so that the two solutions can be compared in terms of spatial pattern and temporal evolution. This study uses PS and SBAS results for cross-consistency assessment rather than producing a pixel-level fused displacement product. A three-dimensional polynomial model was employed for orbit refinement and re-flattening of the interferometric phase, effectively reducing residual topographic components and systematic orbital ramps. On the basis of all unwrapped interferograms, a set of linear observation equations was established to relate wrapped phase to deformation, and the deformation time series relative to a reference epoch were retrieved using singular value decomposition (SVD).
To optimize the SBAS solution, a two-step inversion procedure was implemented. In the first step, linear deformation rates and nonlinear deformation components were estimated from the unwrapped phase time series. In the second step, the residual atmospheric phase screens were modelled and removed, mainly through spatial low-pass and temporal high-pass filtering. Finally, the SBAS-derived deformation rates and LOS displacement time series were geocoded to the WGS 84 geographic coordinate system, and, where needed, projected into the vertical direction to obtain the subsidence field and the mean deformation velocity map for the study area (Figure 6).
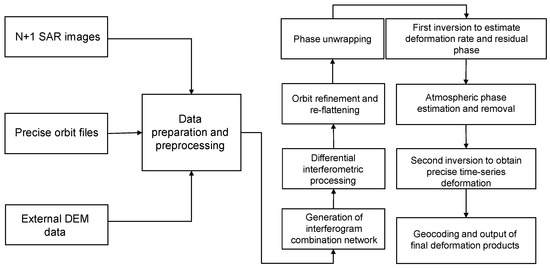
Figure 6.
SBAS-InSAR processing workflow.
4. Results
4.1. Spatiotemporal Distribution Characteristics
To accurately characterize the spatiotemporal distribution of construction-induced surface deformation along the Sanya Estuary Channel, this study integrates SBAS-InSAR and PS-InSAR for high-precision deformation-rate monitoring. The mean deformation fields and multi-epoch cumulative displacement maps are presented in Figure 7, Figure 8 and Figure 9. Here, the multi-epoch cumulative settlement maps in Figure 9 are derived from the SBAS-InSAR time-series results (referenced to the first acquisition epoch), rather than a fused product of PS-InSAR and SBAS-InSAR, because SBAS provides spatially dense coverage suitable for map representation, while PS-InSAR is used for cross-checking at stable scatterers.
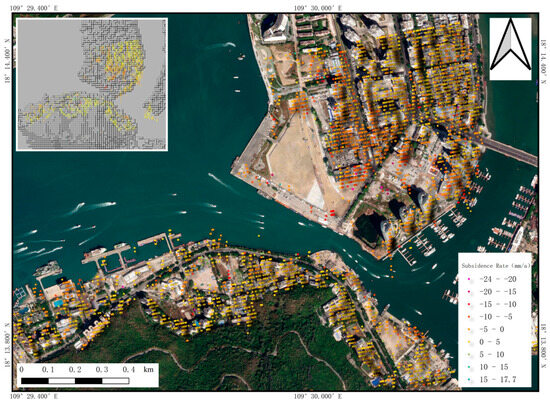
Figure 7.
Vertical deformation rate map of the study area based on PS-InSAR.
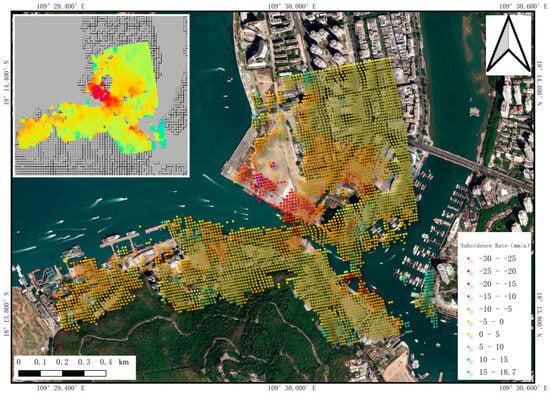
Figure 8.
Vertical deformation rate map of the study area using SBAS-InSAR.
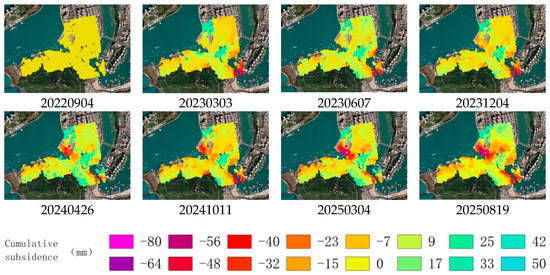
Figure 9.
Multi-epoch cumulative vertical deformation (settlement) maps of the study area derived from SBAS-InSAR time-series results.
Spatial pattern. Both methods reveal a very similar settlement distribution. Pronounced subsidence is concentrated in Tunnel Section D (DK0+000.00–DK0+330.00), where construction activities are most intensive. The maximum settlement rate detected by PS-InSAR is approximately −10 to −24 mm/a, while that derived from SBAS-InSAR reaches about −20 to −30 mm/a. Most of the corridor exhibits deformation rates between −5 and 5 mm/a, indicating generally stable conditions. In addition, both datasets identify several small uplift zones, with maximum uplift rates of 17.7 mm/a (PS-InSAR) and 18.7 mm/a (SBAS-InSAR). Overall, the deformation-rate ranges obtained from PS- and SBAS-InSAR are −24 to 17.7 mm/a and −29.9 to 18.7 mm/a, respectively.
Temporal evolution. Based on the cumulative settlement from September 2022 to August 2025, the deformation process shows clear stage-dependent behavior. During the early stage, the spatial extent of settlement is limited, the deformation magnitude is small, and overall changes remain gentle. From the middle to late stages (after June 2023), subsidence intensifies markedly: the affected area gradually expands, whereas the location of the subsidence centre remains essentially stable. Tunnel Section D (DK0+000.00–DK0+330.00) experiences a pronounced increase in deformation, with a sharp rise in cumulative settlement and further outward expansion of the subsidence boundary, indicating a continuously developing and strengthening deformation trend in this section.
4.2. Time-Series Settlement Characteristics in the Severely Subsiding Area
To systematically investigate the time-series settlement characteristics in the most severely affected part of the Sanya Estuary Channel, namely Tunnel Section D (DK0+000.00–DK0+330.00), four representative settlement points (P1–P4) were selected on the basis of the deformation-rate map and high-resolution satellite imagery (Figure 10). For each point, time-series deformation from September 2022 to August 2025 was extracted, and the corresponding cumulative settlement curves were derived (Figure 11).
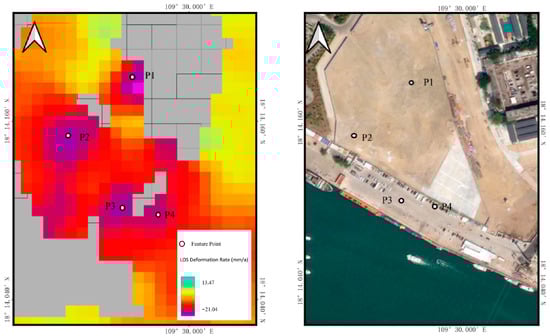
Figure 10.
Feature-point selection diagram. (Feature-point selection diagram. P1–P4 denote four representative settlement points selected in Tunnel Section D for time-series analysis.)
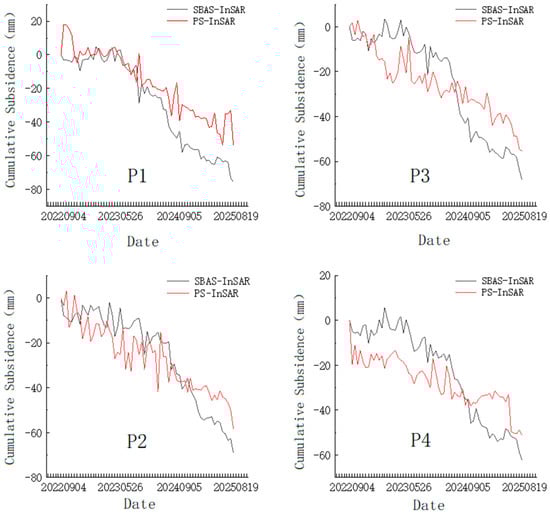
Figure 11.
Feature-point temporal deformation map.
The monitoring results show that all feature points experienced continuous settlement throughout the observation period, with cumulative subsidence ranging from approximately −75.7 to −17.9 mm. Among them, P1 and P2 exhibit the largest deformation, with maximum cumulative settlement values approaching −80 mm. The settlement histories at all points display clear stage-dependent behavior: before May 2023, settlement rates remain relatively low and changes are gentle, whereas an obvious acceleration occurs thereafter, indicating a progressively intensifying deformation process. This acceleration phase coincides well with key construction stages, underscoring the strong influence of engineering activities on the evolution of settlement.
From a methodological perspective, the time-series curves obtained from SBAS-InSAR and PS-InSAR are broadly consistent in terms of overall trend at all points, which supports the reliability of the InSAR monitoring results. Nevertheless, noticeable discrepancies occur during certain periods, mainly due to the different sensitivities of the two techniques to various surface types—PS-InSAR is generally more stable over built-up structures, whereas SBAS-InSAR provides better spatial continuity over natural and reclaimed surfaces.
The observed time-series settlement characteristics clearly indicate that surface deformation in Tunnel Section D is neither linear nor uniform. Instead, it exhibits a stage-wise acceleration pattern, reflecting a typical dynamic deformation process driven by the coupling between construction disturbances and the response of the coastal soft-soil foundation.
4.3. Mechanism Analysis
4.3.1. Influence of Rainfall
By comparing the time-series settlement curves of the four representative feature points (P1–P4) with monthly rainfall data (Figure 12), a typical delayed response of settlement to rainfall can be identified. Specifically, the settlement rate significantly increases approximately 1–2 months after each major rainfall peak, producing a step-like downward pattern in the time-series deformation. This indicates a coupled hydrological–geotechnical mechanism underlying the observed deformation.
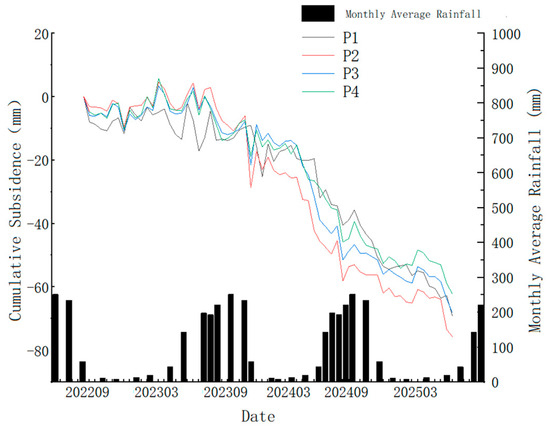
Figure 12.
Comparison of monthly rainfall and cumulative settlement time series.
First, concentrated rainfall infiltrates the shallow loose strata, increasing the self-weight of the soil and softening the structure of silty clay and residual soils, resulting in additional compression. More importantly, continuous rainfall recharge raises the phreatic water level. This elevated groundwater condition, on the one hand, increases downward seepage pressure, and on the other hand, as groundwater levels gradually fall after the rainy season, the effective stress in the soil increases again, thereby triggering and accelerating delayed consolidation of highly compressible soft soils. During extreme rainfall events, elevated pore-water pressure may also reduce anti-floating stability and intensify piping risks in fine sand layers.
Therefore, the observed settlement does not occur synchronously with rainfall events. Instead, it represents a delayed and cumulative response of the groundwater system to rainfall recharge, which subsequently affects the underlying high-compressibility soil layers and accelerates settlement processes.
4.3.2. Geological Factors
The strata in the Sanya Estuary Channel project area are dominated by Quaternary loose sedimentary layers overlying Ordovician bedrock. The upper sequence mainly comprises artificial fill (Q4ml) and marine deposits (Q4m), with lithologies including mixed fill, fine sand, silty clay, gravelly sand and clay. The underlying bedrock consists of Ordovician (O) quartz sandstone, fault breccia and fault gouge. A detailed lithostratigraphic description of the site is provided in (Table 2).
Settlement in Tunnel Section D (DK0+000.00–DK0+330.00) is primarily controlled by the unfavourable engineering geological conditions of the underlying strata. The site is characterised by a typical interlayered sequence of soft soil, sand and cohesive soil. Near-surface soft-soil layers with thicknesses of about 6–8 m are laterally continuous and exhibit high natural water content and large void ratios. These layers are highly compressible and prone to significant primary and secondary consolidation under engineering loads, and their spatial distribution largely governs the extent and magnitude of settlement. The multi-layered alternation of soft clay, sand and other cohesive soils leads to pronounced vertical contrasts in permeability and compressibility. During long-term groundwater level decline, the effective stress in the soil gradually increases, which triggers and accelerates delayed consolidation in the soft-soil layers.
During extreme rainfall events, elevated pore-water pressures may further reduce anti-floating stability and intensify piping risks in fine sand layers. Consequently, the observed settlement does not occur synchronously with individual rainfall events but rather reflects the delayed and cumulative response of the groundwater system to rainfall recharge and the associated redistribution of effective stress. From a monitoring perspective, small differences in deformation magnitude and rate retrieved by SBAS-InSAR and PS-InSAR are mainly observed near lithological boundaries, which is consistent with the differential deformation behavior of different lithologic units under external loading and hydrological forcing. Overall, the pronounced settlement in Tunnel Section D is essentially the result of the combined influence of highly compressible soft soils, water-rich sand layers and the multi-layered stratigraphic structure, together with groundwater processes.
4.3.3. Construction Factors
Construction-induced deformation in the study area mainly results from the combined use of the open-cut method and the pipe-curtain freezing method. In the open-cut sections, large-scale excavation of deep foundation pits disrupts the original stress equilibrium of the strata. The shallow loose fill and flowing–soft silty clay exhibit poor self-stability; without timely and adequate support, excavation may lead to slope collapse or significant lateral displacement. In deeper sand layers, unloading can induce basal heave or additional settlement. If dewatering is not properly staged, the resulting increase in effective stress within the soil accelerates consolidation settlement in soft-soil layers, while rapid lowering of the groundwater table may trigger sand migration and loss in fine sand layers.
In the pipe-curtain freezing sections, frost heave of the frozen soil exerts additional pressure on the pipe curtain and the surrounding strata. During the subsequent thawing stage, soil contraction may induce thaw-settlement, and insufficient post-thaw grouting can further amplify this effect. Moreover, defects in temporary or permanent support structures, as well as inadequate protection of adjacent pipelines and facilities, may introduce additional deformation. The construction methods adopted for each section of the Sanya Estuary Channel are summarised in (Table 3).
Tunnel Section D (DK0+000.00–DK0+330.00) emerges as the core settlement zone primarily because of the strong coupling between unfavourable engineering geological conditions and disturbances induced by the open-cut construction method. Large-scale excavation first disrupts the in situ stress balance, leading to unloading-induced upward rebound and heave of the pit base. At the same time, lateral stress release causes plastic inward deformation of the pit walls, resulting in substantial lateral displacement and surface settlement.
More critically, continuous dewatering operations, which are necessary to maintain dry working conditions, cause a rapid reduction in pore-water pressure. The associated increase in effective stress accelerates consolidation within the deeper soft-soil layers and is the main driver of the widespread and persistent settlement observed in this section. In addition, the hydraulic gradient generated during dewatering elevates the risk of piping in fine sand layers, allowing fine particles to be transported with groundwater and further enhancing soil compression and settlement.
Consequently, the pronounced settlement in Tunnel Section D (DK0+000.00–DK0+330.00) is the combined result of intrinsic geological weaknesses—such as highly compressible soft soils and water-bearing sand layers—and strong external disturbances generated by open-cut excavation, dewatering and unloading. The interaction of these internal and external factors ultimately leads to the largest settlement magnitudes being concentrated in this section.
5. Discussion
5.1. Overall Deformation Characteristics in a Tropical Coastal Tunnel
In this study, the maximum subsidence rates and cumulative settlement observed in Tunnel Section D (see Section 4.1 and Section 4.2 and Figure 6, Figure 7, Figure 8, Figure 9 and Figure 10) can be considered moderate compared with extreme subsidence documented in rapidly subsiding deltas and large Asian coastal cities [32]. However, when viewed in the context of relative sea-level rise along the Chinese coast—where the combined effects of land subsidence and climate-induced sea-level rise can produce effective rates of 11–20 mm/a [33]—the observed deformation is clearly non-negligible for long-term serviceability and flood safety. Similar SBAS-InSAR studies in Zhuhai and other coastal cities have found settlement concentrated in zones of intensive construction and reclaimed ground, while most of the urban area remains relatively stable. The Sanya Estuary Channel behaves in a comparable way, acting as a localized high-subsidence strip embedded within a broader, weakly deforming coastal belt.
5.2. Performance and Complementarity of PS-InSAR and SBAS-InSAR
From a methodological perspective, the good agreement between PS-InSAR and SBAS-InSAR in both spatial pattern and temporal evolution confirms that the adopted processing workflow is robust and consistent with current best practice in time-series InSAR [34]. PS-InSAR, rooted in the permanent-scatterer concept of Ferretti et al. [35], provides dense and highly precise measurements along the tunnel alignment, particularly over engineered structures, road surfaces and nearby buildings. SBAS-InSAR, following the small-baseline strategy proposed by Berardino et al. and subsequent developments [36], effectively complements PS-InSAR by recovering deformation over vegetated riverbanks, reclaimed platforms and other decorrelating surfaces. Local discrepancies between the two solutions are mainly confined to areas with rapidly varying coherence or mixed land cover, which is consistent with findings from PSI/SBAS comparison studies and large-area subsidence monitoring. Overall, the combined PS–SBAS framework used here illustrates the value of integrating multiple InSAR time-series techniques for monitoring complex coastal infrastructure corridors. Note on relative referencing. InSAR displacement is inherently relative to a chosen reference. If different reference points/areas are used, an offset may be introduced, and direct comparison becomes less meaningful. Here, comparability was ensured by aligning both PS-InSAR and SBAS-InSAR solutions to the same stable reference area (zero-mean deformation over that area). Therefore, the observed agreement between the two methods mainly reflects robust deformation patterns rather than reference-dependent shifts.
5.3. Geotechnical and Hydrological Controls on Settlement in Tunnel Section D
The deformation mechanisms inferred for Tunnel Section D are also consistent with the known behavior of marine soft soils subjected to combined loading, dewatering and environmental forcing. The Sanya estuary is underlain by highly compressible marine silty clays interbedded with sand layers, similar to soft-clay sequences reported in other Chinese coastal cities [37]. Laboratory and microstructural investigations indicate that such marine clays exhibit pronounced primary and secondary consolidation, strong sensitivity of compressibility to salinity and stress history, and significant microstructural evolution under long-term loading [38]. In the present case, open-cut excavation and deep dewatering create pronounced unloading at the ground surface and increased effective stress at depth, which together accelerate consolidation and creep in the soft-clay layers. At the same time, a clear 1–2 month delay between rainfall peaks and settlement acceleration at representative points reveals a hydrological contribution: rainfall infiltration raises the phreatic surface and pore-water pressure, followed by a gradual groundwater-level decline that increases effective stress and promotes delayed consolidation. This coupled hydro–geotechnical response is broadly comparable to subsidence processes in other coastal plains, where groundwater-level fluctuations and soft-soil consolidation jointly control long-term settlement [39].
5.4. Engineering Implications, Limitations and Future Work
The combined “freeze-wall beneath the estuary + open-cut on both banks” construction scheme introduces additional complexity to the deformation field. Frost heave during freezing and thaw settlement during warming can induce non-uniform vertical and horizontal displacements near the frozen curtain, superimposed on consolidation-induced settlement in the surrounding soft soils. Similar interactions between deep excavation, dewatering and InSAR-observed deformation have been reported in other urban construction projects [40], but there is still limited experience for tropical estuarine tunnels in thick marine soft clays. The Sanya Estuary Channel case therefore provides a useful reference for understanding how geological conditions, construction techniques and environmental factors jointly shape deformation in such lifeline projects.
Several limitations of the present work should be acknowledged. First, only ascending Sentinel-1A data were used, and deformation was mainly interpreted as vertical; lateral components, which can be important near deep excavations and retaining structures, may be underestimated. Incorporating both ascending and descending tracks, together with GNSS or leveling measurements, would enable recovery of full 3D displacement fields and reduce projection-related uncertainties [41]. Second, the relationship between settlement and rainfall was analyzed using rainfall records only; continuous groundwater-level and pore-pressure observations along the corridor are lacking, which restricts quantitative attribution of delayed settlement to specific hydrological processes. Third, the present analysis is essentially observational; coupling InSAR-derived time series with numerical consolidation models or data-driven forecasting frameworks could help predict future deformation trajectories and assess the effectiveness of mitigation measures. Addressing these aspects would further enhance the reliability and applicability of time-series InSAR for the design, construction and operation of coastal soft-soil tunnels and estuary channels.
6. Conclusions
In this study, SBAS-InSAR and PS-InSAR time-series techniques were jointly employed to perform high-resolution surface deformation monitoring over the Sanya Estuary Channel Project area, and the spatiotemporal characteristics of deformation and its multi-factor coupled mechanisms were systematically investigated. The main conclusions are as follows:
Based on two independent time-series approaches (PS-InSAR and SBAS-InSAR), the deformation maps show highly consistent spatial patterns. The dominant subsidence is concentrated in Tunnel Section D (DK0+000.00–DK0+330.00), while most segments outside this zone remain close to stable conditions (Figure 6, Figure 7 and Figure 8). This cross-consistency increases confidence that the identified hotspot reflects a robust deformation signal rather than a method-dependent artifact.
The representative-point time series in Section D shows continuous settlement throughout the observation period, with a noticeable acceleration after May 2023 (Figure 10). The maximum cumulative settlement reaches approximately −75.7 mm, indicating non-negligible construction-phase deformation in the estuary soft-soil setting. These findings support prioritizing monitoring and inspection resources on Section D and during stages associated with accelerated settlement.
By combining InSAR observations with geological information, construction records and rainfall, the subsidence hotspot and its temporal evolution are interpreted as the coupled effects of compressible coastal soft soils, local hydrogeological conditions and construction disturbance. These results support practical risk screening and monitoring prioritization for estuary-crossing tunnels in coastal soft-soil settings.
This study contributes to sustainable urban infrastructure management by providing an integrated, remote-sensing-based approach to monitor tunnel-related ground deformation and diagnose its driving mechanisms in a tropical coastal environment. The deformation products and identified triggers (e.g., rainfall and local engineering activities) support risk zoning and maintenance prioritization, enabling preventive interventions rather than reactive repairs. Such evidence-based management can extend asset service life, reduce disruption and safety risks, and enhance the resilience of rapidly urbanizing coastal cities.
Author Contributions
Conceptualization, J.H. and Z.S.; methodology, Z.S.; validation, Z.S.; formal analysis, Z.S.; investigation, Z.S. and J.H.; resources, J.H. and Z.S.; writing—original draft preparation, Z.S.; writing—review and editing, Z.S., J.H., Y.Z., K.W., B.L., and Q.L.; visualization, Z.S.; supervision, Q.L.; project administration, J.H.; funding acquisition, Q.L. and J.H. All authors have read and agreed to the published version of the manuscript.
Funding
This work was partially supported by the Hainan Province Science and Technology Special Fund under Grants ZDYF2025GXJS173 and ZDYF2024GXJS289, the National Natural Science Foundation of China under Grant 52471281, the Key R&D Program of the Department of Science and Technology of Hainan Province (High-tech Field) under Grant ZDYF2024GXJS001, the Hainan Provincial Natural Science Foundation Enterprise Talent Project under Grant 525QY918, and the 2025 Hainan Province Construction Science and Technology Program under Grant NO.12.
Institutional Review Board Statement
Not applicable.
Informed Consent Statement
Not applicable.
Data Availability Statement
The original contributions presented in this study are included in the article. Further inquiries can be directed at the corresponding author.
Acknowledgments
We thank the European Space Agency (ESA) for providing us with the Sentinel-1 dataset for research purposes in this project. We also thank the Alaska Satellite Facility (ASF) of the University of Alaska for providing us with the platform for downloading Sentinel-1 data.
Conflicts of Interest
Authors Kai Wei and Bing Liu were employed by the company China Railway Construction Urban Transportation Development Company Limited. Author Qiong Liu was employed by the company Hainan Provincial Hydrogeological and Engineering Geological Survey Institute Co., Ltd. The remaining authors declare that the research was conducted in the absence of any commercial or financial relationships that could be construed as a potential conflict of interest.
References
- Zhang, T.; Yu, Y.-Q.; Xiao, C.-D.; Hua, L.-J.; Yan, Z. Interpretation of IPCC AR6 Report: Monitoring and Projections of Global and Regional Sea Level Change. Adv. Clim. Change Res. 2022, 18, 12. [Google Scholar] [CrossRef]
- Herrera-García, G.; Ezquerro, P.; Tomás, R.; Béjar-Pizarro, M.; López-Vinielles, J.; Rossi, M.; Mateos, R.M.; Carreón-Freyre, D.; Lambert, J.; Teatini, P.; et al. Mapping the Global Threat of Land Subsidence. Science 2021, 371, 34–36. [Google Scholar] [CrossRef]
- Fox-Kemper, B.; Hewitt, H.T.; Xiao, C.; Aðalgeirsdóttir, G.; Drijfhout, S.S.; Edwards, T.L.; Golledge, N.R.; Hemer, M.; Kopp, R.E.; Krinner, G.; et al. Ocean, Cryosphere and Sea Level Change. In Climate Change 2021: The Physical Science Basis. Contribution of Working Group I to the Sixth Assessment Report of the Intergovernmental Panel on Climate Change; Cambridge University Press: Cambridge, UK; New York, NY, USA, 2021; pp. 1211–1362. [Google Scholar] [CrossRef]
- Wang, B.; Huang, Y.; Zhu, E.; Xiao, X.; Wu, Q. Experimental Study on the Thixotropic Strength of the Marine Soft Clay from the Yangtze River Estuary. Front. Mar. Sci. 2024, 11, 1462550. [Google Scholar] [CrossRef]
- Song, X.; Du, G.; Wang, Z.; Wang, Z.; Zhu, M.; Bai, W.; Xie, S.; Xia, K.; Zheng, G.; Cheng, X. Study on Engineering Properties of Deep Marine Soft Clay in Guangdong-Hong Kong-Macao Greater Bay Area. J. Phys. Conf. Ser. 2021, 2021, 012032. [Google Scholar] [CrossRef]
- Zhou, Y.; Lai, Y.; Chen, X.; Han, X.; Peng, Y. Research on Consolidation and Settlement Characteristics of Soft Soil with High Initial Water Content. J. Ocean Eng. Mar. Energy 2025, 11, 467–481. [Google Scholar] [CrossRef]
- Liu, Y.; Fang, N.; Zheng, Y.; Wu, K.; Chen, R.; Lu, H.; Vuong, V.Q. Creep Behavior and Quantitative Prediction of Marine Soft Clay Based on a Nonlinear Elasto-Plastic–Viscous Element Assembly Model. J. Mar. Sci. Eng. 2025, 13, 1142. [Google Scholar] [CrossRef]
- Pan, K.; Yuan, Z.H.; Zhao, C.F.; Tong, J.H.; Yang, Z.X. Undrained Shear and Stiffness Degradation of Intact Marine Clay under Monotonic and Cyclic Loading. Eng. Geol. 2022, 297, 106502. [Google Scholar] [CrossRef]
- Xia, C.; Zhu, M.; Chen, W.; Peng, Y.; Xie, K. Large-Strain Rheological Consolidation Analysis of Multi-Layered Marine Soft Clays Exhibiting Natural Structural Characteristics. Mar. Georesour. Geotechnol. 2023, 41, 1142–1155. [Google Scholar] [CrossRef]
- Wang, Y.; Li, S.; Duan, G.; Yin, J.; Wang, Y. Study on Dynamic Properties of Ultrasoft Clay Based on Large Amplitude Oscillatory Shear Tests. Soil Dyn. Earthq. Eng. 2023, 172, 107989. [Google Scholar] [CrossRef]
- Peng, T.; Ren, D.; Kang, C.; Liu, H.; Xue, P.; Huang, H. Deformation Characteristics of Soft Soil Induced by Deep Excavation and Its Impact on Adjacent Tunnels: A Case Study in Shanghai. KSCE J. Civ. Eng. 2024, 28, 1715–1728. [Google Scholar] [CrossRef]
- Liu, N.-W.; Peng, C.-X.; Li, M.-G.; Chen, J.-J. Hydro-Mechanical Behavior of a Deep Excavation with Dewatering and Recharge in Soft Deposits. Eng. Geol. 2022, 307, 106780. [Google Scholar] [CrossRef]
- Hong, R.; Cai, H.; Li, M. Improved Prediction Method for Ground Surface Thawing Settlement Caused by the Melting of Tunnel Horizontal Frozen Wall. SN Appl. Sci. 2021, 3, 797. [Google Scholar] [CrossRef]
- Yang, X.; Yao, Y.; Jia, C.; Yang, T. Spatiotemporal Prediction of Land Subsidence and Its Response Patterns to Different Aquifers in Coastal Areas. Ocean Coast. Manag. 2024, 253, 107148. [Google Scholar] [CrossRef]
- Zhao, L.; Jiang, X.-W.; Li, Y.-M.; Luo, Y.; Lei, K.-C.; Kou, W.-J.; Tian, F.; Tian, M.-Z.; Sha, T.; Wang, S.-F. Mechanisms of Groundwater Recovery and Land Subsidence Mitigation in a Piedmont Plain. J. Hydrol. 2025, 658, 133165. [Google Scholar] [CrossRef]
- Chen, J.; Wu, J.; Zhang, L.; Zou, J.; Liu, G.; Zhang, R.; Yu, B. Deformation Trend Extraction Based on Multi-Temporal InSAR in Shanghai. Remote Sens. 2013, 5, 1774–1786. [Google Scholar] [CrossRef]
- Macchiarulo, V.; Milillo, P.; Blenkinsopp, C.; Reale, C.; Giardina, G. Multi-Temporal InSAR for Transport Infrastructure Monitoring: Recent Trends and Challenges. Proc. Inst. Civ. Eng.-Bridge Eng. 2023, 176, 92–117. [Google Scholar] [CrossRef]
- Li, S.; Xu, W.; Li, Z. Review of the SBAS InSAR Time-Series Algorithms, Applications, and Challenges. Geod. Geodyn. 2022, 13, 114–126. [Google Scholar] [CrossRef]
- Zhang, J.; Duan, W.; Fu, X.; Yun, Y.; Lv, X. The Stepwise Multi-Temporal Interferometric Synthetic Aperture Radar with Partially Coherent Scatterers for Long-Time Series Deformation Monitoring. Remote Sens. 2025, 17, 1374. [Google Scholar] [CrossRef]
- Chen, Y.; Ding, C.; Huang, P.; Yin, B.; Tan, W.; Qi, Y.; Xu, W.; Du, S. Research on Time Series Monitoring of Surface Deformation in Tongliao Urban Area Based on SBAS-PS-DS-InSAR. Sensors 2024, 24, 1169. [Google Scholar] [CrossRef]
- Zhang, J.; Gao, J.; Gao, F. Time Series Land Subsidence Monitoring and Prediction Based on SBAS-InSAR and GeoTemporal Transformer Model. Earth Sci. Inf. 2024, 17, 5899–5911. [Google Scholar] [CrossRef]
- Ma, P.; Zheng, Y.; Zhang, Z.; Wu, Z.; Yu, C. Building Risk Monitoring and Prediction Using Integrated Multi-Temporal InSAR and Numerical Modeling Techniques. Int. J. Appl. Earth Obs. Geoinf. 2022, 114, 103076. [Google Scholar] [CrossRef]
- Kirui, P.K.; Reinosch, E.; Isya, N.; Riedel, B.; Gerke, M. Mitigation of Atmospheric Artefacts in Multi Temporal InSAR: A Review. PFG-J. Photogramm. Remote Sens. Geoinf. Sci. 2021, 89, 251–272. [Google Scholar] [CrossRef]
- Bakon, M.; Czikhardt, R.; Papco, J.; Barlak, J.; Rovnak, M.; Adamisin, P.; Perissin, D. remotIO: A Sentinel-1 Multi-Temporal InSAR Infrastructure Monitoring Service with Automatic Updates and Data Mining Capabilities. Remote Sens. 2020, 12, 1892. [Google Scholar] [CrossRef]
- Hussain, S.; Pan, B.; Hussain, W.; Sajjad, M.M.; Ali, M.; Afzal, Z.; Abdullah-Al-Wadud, M.; Tariq, A. Integrated PSInSAR and SBAS-InSAR Analysis for Landslide Detection and Monitoring. Phys. Chem. Earth Parts A/B/C 2025, 139, 103956. [Google Scholar] [CrossRef]
- Xiong, Z.; Deng, K.; Feng, G.; Miao, L.; Li, K.; He, C.; He, Y. Settlement Prediction of Reclaimed Coastal Airports with InSAR Observation: A Case Study of the Xiamen Xiang’an International Airport, China. Remote Sens. 2022, 14, 3081. [Google Scholar] [CrossRef]
- Zhao, D.; Yao, H.; Gu, X. Highway Deformation Monitoring by Multiple InSAR Technology. Sensors 2024, 24, 2988. [Google Scholar] [CrossRef] [PubMed]
- Li, C.; Ding, L.; Guo, Z.; Wang, Z.; Wei, L.; Zheng, Y.; Cui, X.; Wang, J. Spatiotemporal Evolution of Surface Deformation Based on MT-InSAR and Mechanism Analysis along Zhengzhou Metro, China. Tunn. Undergr. Space Technol. 2025, 156, 106182. [Google Scholar] [CrossRef]
- Pang, Z.; Jin, Q.; Fan, P.; Jiang, W.; Lv, J.; Zhang, P.; Cui, X.; Zhao, C.; Zhang, Z. Deformation Monitoring and Analysis of Reservoir Dams Based on SBAS-InSAR Technology—Banqiao Reservoir. Remote Sens. 2023, 15, 3062. [Google Scholar] [CrossRef]
- An, B.; Jiang, Y.; Wang, C.; Shen, P.; Song, T.; Hu, C.; Liu, K. Ground Infrastructure Monitoring in Coastal Areas Using Time-Series inSAR Technology: The Case Study of Pudong International Airport, Shanghai. Int. J. Digit. Earth 2023, 16, 355–374. [Google Scholar] [CrossRef]
- Chen, Y.; Guo, L.; Xu, J.; Yang, Q.; Wang, H.; Zhu, C. Monitoring and Cause Analysis of Land Subsidence along the Yangtze River Utilizing Time-Series inSAR. ISPRS Int. J. Geo-Inf. 2024, 13, 230. [Google Scholar] [CrossRef]
- Sun, H.; Peng, H.; Zeng, M.; Wang, S.; Pan, Y.; Pi, P.; Xue, Z.; Zhao, X.; Zhang, A.; Liu, F. Land Subsidence in a Coastal City Based on SBAS-InSAR Monitoring: A Case Study of Zhuhai, China. Remote Sens. 2023, 15, 2424. [Google Scholar] [CrossRef]
- Wu, P.; Wei, M.; D’Hondt, S. Subsidence in Coastal Cities Throughout the World Observed by InSAR. Geophys. Res. Lett. 2022, 49, e2022GL098477. [Google Scholar] [CrossRef]
- Cigna, F.; Esquivel Ramírez, R.; Tapete, D. Accuracy of Sentinel-1 PSI and SBAS InSAR Displacement Velocities against GNSS and Geodetic Leveling Monitoring Data. Remote Sens. 2021, 13, 4800. [Google Scholar] [CrossRef]
- Ferretti, A.; Prati, C.; Rocca, F. Permanent Scatterers in SAR Interferometry. IEEE Trans. Geosci. Remote Sens. 2002, 39, 8–20. [Google Scholar] [CrossRef]
- Berardino, P.; Fornaro, G.; Lanari, R.; Sansosti, E. A New Algorithm for Surface Deformation Monitoring Based on Small Baseline Differential SAR Interferograms. IEEE Trans. Geosci. Remote Sens. 2003, 40, 2375–2383. [Google Scholar] [CrossRef]
- Wang, X.; Sun, H.; Niu, F. Microstructure Study of Natural Marine Clay in Loading and Unloading Processes. Eng. Geol. 2023, 327, 107363. [Google Scholar] [CrossRef]
- Liang, Z.; Sun, H.; Huang, Z.; Niu, F. The Influences of Natural Structure Damage and Stress Path on Mechanical Behaviors of Soft Clay. Bull. Eng. Geol. Environ. 2023, 82, 208. [Google Scholar] [CrossRef]
- Liu, X.; Wang, J.; Yang, T.; Wang, L.; Xu, N.; Long, Y.; Huang, X. Dewatering-Induced Stratified Settlement around Deep Excavation: Physical Model Study. Appl. Sci. 2022, 12, 8929. [Google Scholar] [CrossRef]
- Zhang, S.; Chen, B.; Gong, H.; Lei, K.; Shi, M.; Zhou, C. Three-Dimensional Surface Displacement of the Eastern Beijing Plain, China, Using Ascending and Descending Sentinel-1A/B Images and Leveling Data. Remote Sens. 2021, 13, 2809. [Google Scholar] [CrossRef]
- Chen, Y.; Yu, S.; Tao, Q.; Liu, G.; Wang, L.; Wang, F. Accuracy Verification and Correction of D-InSAR and SBAS-InSAR in Monitoring Mining Surface Subsidence. Remote Sens. 2021, 13, 4365. [Google Scholar] [CrossRef]


Disclaimer/Publisher’s Note: The statements, opinions and data contained in all publications are solely those of the individual author(s) and contributor(s) and not of MDPI and/or the editor(s). MDPI and/or the editor(s) disclaim responsibility for any injury to people or property resulting from any ideas, methods, instructions or products referred to in the content. |
© 2026 by the authors. Licensee MDPI, Basel, Switzerland. This article is an open access article distributed under the terms and conditions of the Creative Commons Attribution (CC BY) license.