Abstract
The integration of environmental, social, and governance (ESG) principles into investment strategies represents a potential pathway for advancing financial sustainability and long-term market resilience. The usage of ESG screening techniques in portfolio construction is currently a subject of debate among practitioners and policymakers. This paper introduces a methodology that incorporates ESG scores into a low-volatility, Standard & Poor’s 500 index-based strategy without relying on traditional exclusionary screening. Rather than removing firms based solely on low ESG scores, we treat ESG as a predictive sustainability factor in identifying firms likely to experience extreme return volatility in the subsequent year, using a probit model and Fama–Macbeth estimation techniques. Firms with high ESG scores are found to be less likely to exhibit such behavior, suggesting an inverse relationship between ESG and risk. Our results show that portfolios constructed using this approach achieve higher average ESG scores, maintain returns equivalent to the benchmark, and reduce annualized return volatility by approximately 1.0%, a statistically significant reduction. By reframing ESG from a moral filter into a measurable risk mitigation mechanism, this study demonstrates how sustainability integration can enhance portfolio stability while supporting both financial and societal objectives. The proposed framework offers practical alternative for investors seeking exposure to sustainability-focused strategies while preserving traditional performance objectives.
Keywords:
environmental; social; governance (ESG) investing; volatility; extreme returns; portfolio strategies JEL Classification:
G10; G11; G17
1. Introduction
In the last few years, a vigorous debate has emerged between those promoting ESG investment strategies and those concerned about the potential for subpar returns. The tension between growing demand for sustainable investment dollars and the fiduciary responsibility to meet investor’s risk-return preferences has been the central focus of this debate. It is well established that constraining the investment opportunity set can adversely impact performance. Sorensen, Chen, and Mussalli [1] note that “the professional investing acronym ESG has become a portfolio goal; it introduces a utility preference that is orthogonal to and perhaps complicates the now age-old modern portfolio theory paradigm.” While much of the existing literature has focused on the empirical relation between ESG measures and returns to assess whether such concerns are valid in practice, we propose an alternative approach to incorporating sustainability concepts without unnecessarily limiting the investment opportunity set.
Previous research tended to explore the impact various ESG-based screening approaches have on investment returns. For example, Hasaj and Scherer [2] select four ESG indexes that “are chosen to resemble the current practice of smart beta and ESG investing in the asset management industry.” These four indexes include the MSCI ESG Screened Index (which excludes firms involved in areas of common concern), MSCI ESG Enhanced Focus Index (which seeks to reduce carbon exposure while maintaining risk-return characteristics similar to the parent index), MSCI ESG Leaders Index (which selects the highest ESG firms in each sector), and MSCI SRI Index (which has the greatest exposure to firms with the highest ESG ratings). Elsewhere, Fabozzi, Ma, and Oliphant and Hong and Kacperczyk [3,4] focus on the exclusions of firms commonly classified as sin stocks.
Research examining the relationship between ESG and portfolio returns provides mixed evidence. For example, Fulton, Kahn, and Sharples [5] find evidence of a positive link between ESG and market performance, while Fabozzi, Ma, and Oliphant and Hong and Kacperczyk [3,4] find that sin stocks actually overperform. This finding is consistent with Statman and Glushkov [6], who show that tilting a portfolio toward high-ESG stocks while shunning stocks in socially controversial industries can generate negative consequences by limiting investors’ opportunity sets.
This paper shares a goal similar to Henriksson, Livnat, Pfeifer, and Stumpp [7], who develop an “investment approach integrating ESG into portfolio construction that should have negligible effects on the performance of the ESG portfolio.” That said, their approach follows the usual ‘high-ESG versus low-ESG’ analysis, whereas we develop a model that adopts a more agnostic view of ESG scores. Our approach combines findings from the low-volatility portfolio literature with the ESG literature. Giese, Nagy, and Lee [8] examine each pillar of ESG separately and find that governance is most related to returns because it strongly reflects event risks like fraud. Such events may act as drivers of extreme return behavior, which we seek to mitigate as part of our low-volatility approach. This is consistent with Kim, Li, and Li [9], who find that high-ESG firms are less likely to hoard bad news and thus have lower stock price crash risk, and Clark, Krieger, and Mauck [10], who find that high-ESG firms are less likely to experience extreme returns.
In this paper’s primary contribution, we include ESG scores as factors in a low-volatility model to create a low-volatility S&P 500 Index fund that does not constrain performance maximization motives. Rather than eliminating firms with the lowest ESG scores (or firms of greatest concern), as is typically performed, we incorporate ESG measures into a predictive regression designed to identify and exclude extreme return firms that increase portfolio risk without a sufficient offsetting increase to returns. While we find that firms with higher ESG scores are less likely to be among the riskiest S&P 500 firms, we do not eliminate low-ESG firms unless their overall predicted probability of exhibiting extreme returns exceeds an established threshold. Thus, our strategy improves the risk-to-return profile by reducing return volatility without an offsetting reduction in expected returns. This result is consistent with insights from the low-volatility literature, including Blitz and Van Vilet [11,12], who examine the portfolio benefits associated with holding low-volatility stocks.
While our approach is intentionally designed to be intuitive and implementable for practitioners, we anchor it in the broader literature on financial time series modeling (Hamilton [13]; Tsay, [14]). Our emphasis on return predictability via firm characteristics is consistent with stylized facts identified by Cont [15], especially regarding volatility clustering and non-Gaussian return behavior. Although our model is not a time-series model in structure (e.g., GARCH), our choice of variables and forecasting methodology respects these well-documented return dynamics.
While many ESG-focused investment strategies rely on direct exclusion or reweighting of firms based on ESG thresholds, our model reframes ESG not as a standalone screening tool but as a risk-relevant variable within a predictive framework. This distinction is important: rather than treating ESG as a moral or normative constraint, we position ESG as a forward-looking signal of firm-level return risk, particularly in identifying outliers. This approach contributes to the growing literature exploring ESG’s informational content, particularly as it relates to tail risk and crash exposure.
Recent studies further support the notion that ESG-related information contains valuable signals about firm-level risk. ESG characteristics, particularly governance scores, have been associated with lower levels of crash risk and volatility. For instance, Albuquerque et al. [16] argue that ESG reduces firm-specific risk by aligning incentives and improving stakeholder management, which may help to explain our findings. Khan, Serafeim, and Yoon [17] demonstrate that firms performing well on financially material ESG issues, as defined by SASB standards, significantly outperform their peers, both in terms of risk-adjusted returns and profitability. Their findings emphasize the importance of focusing on material ESG dimensions, reinforcing our approach that treats ESG not as a moral filter but as a practical input in risk-based portfolio construction. In a related vein, Ilhan, Sautner, and Vilkov [18] identify carbon exposure as a tail-risk driver, showing that carbon-intensive firms carry a higher downside risk premium, particularly during market downturns. This aligns with our finding that ESG characteristics can help predict which firms are more likely to exhibit extreme returns, especially during volatile periods.
Our approach to ESG is apolitical. Ultimately, the increased focus on ESG in the investment industry is primarily centered on better understanding risk. We do not attempt to screen stocks based on the ESG score but rather examine the relationship between ESG scores and risk. We make use of ESG ratings as a factor to limit volatility in an S&P 500-based index fund by eliminating the firms predicted to be the most likely to experience extreme volatility in the subsequent year. This usage of ESG scores is consistent with Melas [19], who notes that the key to integrating sustainability strategies into the investment process is using forward-looking analysis.
Our results show improved average ESG scores, lower risk, and unchanged returns relative to an otherwise passive strategy. This portfolio technique yields an average return equivalent to the S&P 500 while delivering an average annual standard deviation of returns that is 1.0% lower. Our approach produces a portfolio with higher ESG scores than the market but lower ESG scores than a screening strategy that seeks to eliminate low-ESG firms. Importantly, firms are not screened out explicitly because of “bad behavior” but rather based on the relationship between ESG and risk. We differ from other approaches in that we focus on S&P 500 firms with the goal of developing a low-volatility index fund/passive approach to ESG investing that is driven by firms’ impact on portfolio risk rather than specific ESG screens. This model is attractive for investors desiring sustainable investments without sacrificing risk-return performance.
This study contributes to the sustainability literature by positioning ESG factors as empirical indicators of financial sustainability, rather than as moral constraints. Sustainable financial systems depend on the stability and resilience of capital allocation mechanisms. By demonstrating that higher ESG performance is associated with lower firm-level volatility and a reduced likelihood of extreme returns, our model links corporate sustainability behavior to systemic market stability. This reframing expands the traditional notion of sustainability beyond environmental or social outcomes to include financial durability as an essential component of sustainable economic systems.
2. Related Literature
2.1. ESG and Firm-Level Risk: Empirical Foundations
A growing body of literature investigates the relationship between ESG characteristics and firm-level risk. Numerous studies suggest that strong ESG profiles are associated with improved risk management, lower idiosyncratic volatility, and reduced likelihood of adverse events. Kim, Li, and Li [9] find that high-ESG firms are less likely to hoard bad news, reducing stock price crash risk. Similarly, Clark, Krieger, and Mauck [10] show that ESG ratings are inversely related to extreme return behavior, suggesting a stabilizing effect on equity returns. Bouslah, Kryzanowski, and M’Zali [20] further demonstrate that certain ESG dimensions, particularly governance, are negatively associated with firm risk.
The literature linking ESG characteristics to lower firm-level risk rests on several interconnected theories. Stakeholder theory posits that firms attending to environmental, social, and governance stakeholders beyond simply focusing on shareholders are able to mitigate so-called stakeholder risk or conflicts that could disrupt operations, cause reputational damage, incur regulatory penalties, etc., resulting in tail risk (Becchetti, Ciciretti, and Hasan [21]). Giese et al. [22] formalize three transmission channels: (1) the cash-flow channel (ESG enhances profitability by averting adverse events); (2) the idiosyncratic risk channel (reduces firm-specific exposures like crashes); and (3) the systematic risk channel (lowers cost of capital via stability).
Agency theory complements this, as strong governance curbs managerial opportunism, such as bad news hoarding, aligning with Kim, Li, and Li [9]. ESG also acts as a signal of superior risk oversight, according to signaling theory, stabilizing returns by reducing information asymmetry, as explained by Pedersen, Fitzgibbons, and Pomorski [23]. Empirical mechanisms include fewer environmental incidents post-ESG engagement, cutting downside risk by 9% of the standard deviation according to Hoepner et al. [24].
Beyond firm-level studies, research on ESG during periods of market stress reinforces the risk-mitigating properties of ESG. Lins, Servaes, and Tamayo [25] find that firms with strong corporate social responsibility (CSR) profiles outperformed others during the 2008 financial crisis, consistent with ESG acting as a form of social capital that mitigates downside risk. Hoepner et al. [24] also document that ESG-focused shareholder engagement reduces firms’ downside risk exposure. Together, these findings support our premise that ESG characteristics provide valuable information about future risk, aligning with our model’s focus on predicting extreme return behavior rather than screening for ESG “virtue.”
2.2. Low-Volatility Anomaly in Asset Pricing
The low-volatility anomaly presents a challenge to traditional asset pricing theory: stocks with lower historical volatility or beta have been shown to outperform their high-volatility counterparts on a risk-adjusted basis. Blitz and Van Vliet [11,12] were among the first to systematically document this pattern, showing that low-volatility strategies deliver superior Sharpe ratios despite contradicting the Capital Asset Pricing Model (CAPM). Ang, Hodrick, Xing, and Zhang [26] further find that stocks with higher idiosyncratic volatility deliver lower subsequent returns, suggesting that removing high-volatility stocks can enhance portfolio performance. Baker, Bradley, and Wurgler [27] explain this anomaly through behavioral and institutional constraints, arguing that benchmarking pressures and delegated portfolio management create persistent demand for high-beta, high-volatility stocks, leaving low-volatility stocks underpriced.
Our paper contributes to this literature by offering a complementary angle: rather than simply selecting low-volatility stocks, we develop a predictive model to exclude firms likely to experience future extreme returns. By incorporating ESG scores into this framework, we integrate insights from two strands of the literature: low-volatility investing and ESG-risk modeling. We generate a rules-based approach that reduces risk without sacrificing returns.
2.3. ESG as a Risk-Based Signal vs. Normative Screen
A key contribution of this paper lies in its treatment of ESG not as a screen that filters out firms based on ethical criteria, but as an informational signal relevant for predicting financial risk. Traditional ESG investment strategies such as exclusionary screens or tilting toward high-ESG portfolios often carry the tradeoff of reduced diversification or constrained opportunity sets (Statman and Glushkov [6]; Hong and Kacperczyk [4]). Our model avoids this tradeoff by treating ESG as a predictive input within a probabilistic framework to identify firms at elevated risk of extreme return behavior.
This reframing aligns with Melas [19], who argues that ESG’s most effective applications involve forward-looking integration into decision-making, rather than backward-looking compliance exercises. Khan et al. [17] further demonstrate that performance on financially material ESG issues, as defined by SASB standards, is especially informative for both returns and risk. Similarly, Ilhan et al. [18] highlight the importance of carbon intensity in driving tail risk, reinforcing the role of ESG as a tool for identifying risk factors that traditional financial metrics may overlook. By positioning ESG as a risk-based variable rather than a normative constraint, our approach provides a practical middle ground for investors seeking to balance fiduciary duty and sustainability considerations.
The implications of this perspective extend beyond portfolio construction to the broader objective of sustainable economic systems. Integrating ESG information into risk forecasting supports capital allocation toward firms exhibiting long-term stability, transparency, and responsible governance, which are foundational traits of sustainable development. In this sense, the proposed framework operates as both a financial and sustainability tool: it channels investment toward firms that embody enduring business practices while maintaining efficiency and diversification.
2.4. Conceptual Framework
We propose that ESG ratings serve as multifaceted inputs capturing firm-level commitments to environmental, social, and governance practices, consistent with Giese et al. [22]. These inputs influence firm risk and performance via three primary transmission mechanisms:
- Stakeholder risk mitigation (stakeholder theory): Strong ESG reduces conflicts with non-shareholder groups, averting operational disruptions and reputational harm that elevate idiosyncratic volatility and crash risk—Becchetti, Ciciretti, and Hasan [21].
- Agency alignment (agency theory): Superior G mitigates managerial bad news hoarding and opportunism, thereby stabilizing returns—Kim, Li, and Li [9] and Bouslah, Kryzanowski, and M’Zali [20].
- Signaling and systematic risk reduction: ESG signals quality management, lowering the cost of capital through investor preferences and reduced tail risk—Pedersen, Fitzgibbons, and Pomorski [23] and Hoepner et al. [24].
Intermediate outcomes include lower idiosyncratic volatility, reduced crash risk and adverse events, and fewer environmental incidents. These feed into ultimate outcomes: enhanced firm performance (e.g., Tobin’s Q and returns) and risk-adjusted value. Figure 1 provides a visual depiction of this process.
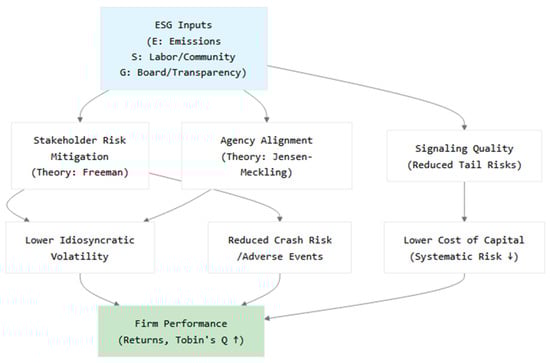
Figure 1.
Conceptual framework.
The testable implications are as follows: higher ESG predicts lower risk metrics (H1: negative relation between ESG and extreme volatility), and ESG-based risk screening improves portfolio risk outcomes (H2: portfolios composed of firms with lower crash probability will exhibit superior risk-return metrics).
3. Data and Methodology
We begin our analysis by building value-weighted portfolios constrained to the member firms of the S&P 500 Index both with and without those firms which we forecast to be most likely to have a subsequent ‘extreme’ return. Furthermore, we specifically consider whether ESG level is a useful tool for predicting which firms might ultimately realize such an extreme return. Our sample is based on the coverage of ESG data from Thomson Refinitiv ESG/Asset4, particularly the summary score (Score) dating from 2002 to 2020 for identifiable members of the S&P 500. These data are then linked to next-year firm returns based on the monthly returns gathered from the Center for Research in Security Prices (CRSP). For simplicity, we utilize a calendar-year framework to conduct our study so that Score at the very end of, for example, 2017 is used, along with other established characteristics, described below, to help predict which firms are most likely to exhibit an extreme return over the full, upcoming calendar year of 2018. We classify firms in either the highest or lowest 3% of realized returns in a year to be ‘extreme.’ We then track the performance of our S&P 500-like portfolios both with and without such ‘predicted extreme’ firms. We adopt a top and bottom 3% return threshold to define extreme return firms, which reflects a conservative approach that isolates the tails of the distribution while avoiding excessive model noise. This mirrors the convention in the crash risk literature (e.g., Chen et al. [28]; Kim et al. [9]), where researchers focus on extreme left-tail events and price discontinuities.
Our inclusion of both tails reflects an interest in general volatility rather than downside risk alone, which we recognize would otherwise represent the ideal screening approach from the perspective of a rational investor seeking to avoid downside risk. However, Fodor et al. [29] find that when modeling extreme returns, the model (upon which our base model is built) shows superior predictive ability when focusing on extreme returns in both directions compared to single-direction return prediction. Further, such non-direction extreme return screening yields improved risk-adjusted returns in subsequent portfolios, such that our approach is consistent with prior work on extreme returns and portfolio formation.
Along with the measurement of returns, CRSP data are used to construct other predictors of extreme returns beyond Score. Size is the natural log of market capitalization in millions of dollars. Age is the natural log of firm age in years. Vol is the natural log of the average monthly trading volume over the prior calendar year. Price is the natural log of firm price. BM is the book-to-market ratio based on market cap from the end of the calendar year, along with the most recent book value of equity data taken from Compustat.
Our approach is to relate characteristics predictive of extreme stock return performance via a probit model:
where Pr is the probability that the indicator Ij = 1. The indicator is equal to one in cases where the realized return in the upcoming calendar year is extreme (in the top or bottom 3% of the calendar year). is the error term (when Fama–Macbeth coefficients are calculated using annual probit coefficients, we utilize Newey–West standard errors in statistical testing). We describe below the results of Fama–Macbeth regressions, which use Equation (1) to predict extreme returns in the following calendar year. To ensure our modeling approach avoids spurious regression concerns, we conduct augmented Dickey–Fuller (ADF) tests for each independent variable. All predictors in our probit model, are stationary at conventional significance levels. These results confirm that the combination of variables does not violate the assumption of stationarity critical to the interpretation of our probit model.
All predictors must be measurable, ex ante, to forecast which firms are most likely to exhibit extreme returns in the upcoming calendar year (we acknowledge that, due to varying fiscal calendars, book value of equity data and thus our BM measure are more current for some observations than others). Thus, we estimate coefficients from year t and use these coefficients, along with new data on the characteristics described above, to predict which firms are most likely to exhibit extreme returns in the year t + 1. The characteristic data ranges from 2002 to 2020, while our return data spans calendar-year performances from 2003 to 2021. Occasionally, additions or deletions are made to the S&P 500 list midyear (approximately 5–20 additions/deletions of S&P 500 members are processed, per year, over our sample period, and these are generally not announced in advance), which will result in our benchmark not perfectly aligning with the actual index. For simplicity of reporting full, one-year, buy-and-hold performance, we do not alter our potential ‘S&P 500’ sample until the end of each calendar year. Between the S&P 500 not always having exactly 500 stocks and the constraint of data availability between the various sources, our portfolios typically contain fewer than 500 stocks. Portfolio sizes have increased over time as ESG data has improved. As a result, full-model estimation based on 2020 measured characteristics and 2021 return performance allowed for 481 observations, while our predictions for 2003 returns, emanating from 2002 characteristics, are based on 282 observations.
4. Results
4.1. Model Inputs
Descriptive statistics for our sample are reported in Panel A of Table 1. Roughly 6% of the sample firms are designated as “extreme return” firms each year, representing the top and bottom 3% of realized returns (we see similar results when considering, for robustness, a 1% or 5% threshold to identify extreme returns). The mean and median Score is lower for extreme return firms, and this difference is statistically significant at the 1% level. Thus, consistent with prior research, higher ESG scores are negatively related to extreme return status. BM and Vol (Size and Age) are positively (negatively) related to extreme return status, and the differences are statistically significant at the 5% level or below. Smaller and younger firms, as well as those with higher valuations and greater recent volatility are most associated with extreme returns.

Table 1.
Descriptive statistics and correlations.
Panel B of Table 1 presents the correlation matrix for our predictor variables. ESG Score is positively correlated with Size and Age, consistent with the idea that more mature, stable firms are more likely to exhibit strong ESG profiles. While some correlation exists among predictors, variance inflation factors (not reported for brevity) do not indicate severe multicollinearity.
The results of our probit regressions are reported in Table 2. Score is negatively related to the extreme return indicator at the 1% level of significance. This result is consistent with Clark, Krieger, and Mauck [10], who find that ESG is negatively related to stock price crash risk, as well as Gougler and Utz [30], who find that higher sustainability-rated firms have lower idiosyncratic risk. Consistent with Fodor et al. [29], we find that Size and Age are negatively related to the extreme return indicator, while Vol is positively related.
Table 2.
Fama-Macbeth Regressions.
These results highlight the role of ESG as a risk-relevant variable rather than a purely normative screening tool. This finding is consistent with prior evidence linking ESG to reduced downside risk (Bouslah et al. [20]; Hoepner et al. [24]) and aligns with Lins, Servaes, and Tamayo [25], who document that firms with stronger ESG profiles exhibit greater resilience during periods of market stress. Thus, our probit model integrates ESG into a forward-looking risk framework rather than a backward-looking exclusionary approach.
4.2. Effectiveness of Identifying Extreme Returns
The probit model provides the portfolio selection criteria used in Table 3. Table 3 presents prediction accuracy results based on our methodology, which utilizes the estimated coefficients from Equation (1). The prediction approach starts on the last day of each calendar year. The regression coefficients from the previous year’s probit regression are combined with the values of each predictor available at that time in order to identify the firms most likely to exhibit extreme returns in the following year. We measure the accuracy of this framework as follows. We define firms predicted to exhibit extreme returns that, in fact, realize extreme return years as correct predictions. For our measure, we use the term “recognized” in Table 3 to denote the percentage of firms correctly predicted to be extreme movers. We divide the number of correct firm predictions by the total number of firms that actually exhibited extreme movement. Panel A reports year-by-year results, while Panel B aggregates results over our entire sample period.
Table 3.
Accuracy results of predictions.
With our ex ante focus in mind, 2003 is the first year for which prediction accuracy results are available. In 2003, we evaluate 266 firms for which all required data were available. Sixteen of these firms actually experienced extreme returns in 2003 (i.e., approximately 6%, consistent with our extreme return definition). Two of the actual ‘extreme return’ firms were correctly identified by our model corresponding to a “recognized” value of 12.5%.
The predictive accuracy of our model varies over time. The worst performance is in the early part of the financial crisis, 2008, with 0% accuracy. However, by 2009, accuracy rates are back up to 25%. The most accurate year came later in the sample with 2017 seeing almost 35% accuracy.
Panel B of Table 3 displays the cumulative accuracy over the full period, which equals 18.94%. While the accuracy levels of this model may seem low in absolute terms, it is helpful, for context, to compare them to a random prediction scheme. For instance, if 6% of the sample was randomly selected as predicted extreme return firms, then, on average, the correctly “recognized” accuracy rate would also be 6%.
While our model’s cumulative recognition rate of 18.94% exceeds random chance by more than 200% (18.94% versus 6%), the results also suggest scope for further improvement. Future research could explore refinements such as incorporating sector-level ESG interactions or nonlinear modeling techniques to further improve predictive accuracy. However, the current model’s outperformance relative to random selection highlights its practical value for risk-aware portfolio construction.
4.3. Portfolio Implications
In Table 4, we present annual portfolio returns and standard deviations for three value-weighted portfolios. The first portfolio consists of all firms with the required data. Thus, this portfolio is similar to a typical, value-weighted market portfolio of S&P 500 firms with available data. The second portfolio excludes the 6% of firms predicted to be most likely to experience extreme returns in the following year, based on the methodology described above. As a simple, third alternative we consider the naïve approach of eliminating the 6% of firms (highest 3% and lowest 3%) that exhibited the most extreme returns in the prior year, under the assumption that extreme volatility may persist over time.
Table 4.
Portfolio performances.
For the entire sample period, the geometric mean returns of the first two portfolios are nearly identical. The “all firms” portfolio average is an annual return of 11.7%, the same as the portfolio that excludes those firms in the uppermost 6% of predicted extreme return scores. Moreover, across the 19 year-by-year results, the mean returns of the two portfolios only differ by more than 1% on four occasions, and only once does the difference exceed 2%. Thus, we conclude that portfolio performance is not materially impacted by the exclusion of predicted “extreme movement” firms. The naïve approach of eliminating the prior year’s extreme movement firms also provides a nearly identical mean annual return of 11.6%.
Before interpreting our results, we benchmark our volatility estimates against CRSP-derived annualized standard deviations for the S&P 500 Index. Over the 2003–2021 period, our constructed “all firms” portfolio volatility ranges from 14 to 33% annually, with the highest levels during the 2008 financial crisis and 2020 pandemic, consistent with known historical volatility spikes. The full-period average of 19.9% is directionally aligned with established benchmarks.
While the return results for the portfolios are similar, there are notable differences in the standard deviations across three portfolios. Over the full period, the average annualized standard deviation of monthly returns of the portfolio excluding predicted “most likely” extreme return firms (18.9%) is 1.0% lower than that of the portfolio of all available S&P 500 firms (19.9%) The p-value of null hypothesis tests of no difference in annualized standard deviations between the “exclude predicted extreme firms” and all firms is <0.001 for both means and medians of annualized standard deviations, and annualized standard deviations are smaller for the “exclude predicted extreme firms” sample in 18 of the 19 sample years. Meanwhile, the standard deviation of the portfolio excluding the prior year’s extreme movers (19.9%) shows no improvement over the baseline portfolio. Combining the return and standard deviation results, our portfolio formation demonstrates that excluding predicted extreme return firms lowers portfolio risk without an offsetting reduction in returns.
As an additional robustness check, we re-estimate our model using alternative extreme-return thresholds (top and bottom 5% and 10%). While prediction accuracy declines modestly as the threshold widens, the risk-reducing benefits of excluding predicted extreme-return firms remain consistent. These results reinforce the stability of our core findings. Further, we examine the performance of our portfolio formation when ESG is excluded from the variables used to predict extreme return firms. In the results presented in Appendix A, we find that excluding ESG from the screening criteria results in nearly identical portfolio returns; however, the average standard deviation is roughly 0.7% higher (18.9% versus 19.6%) when ESG is excluded from the model. Thus, the inclusion of ESG is associated with a lower portfolio standard deviation.
Appendix B provides a breakdown for each year of correctly identified extreme return movement firms. As noted above, predictions focused on the direction of returns are more challenging than our emphasis on extreme returns. That said, we find that 49 firms that are successfully identified as extreme returns are negative return firm-years compared to the 38 correctly identified positive firm-years.
5. Conclusions
The findings presented here offer a quantitative pathway for integrating sustainability considerations into mainstream financial decision-making. By demonstrating that ESG metrics can serve as predictors of return stability, we show that sustainable investing can be rigorously defined, measured, and implemented through risk-based models. This approach contributes to the development of sustainability tools that reconcile fiduciary responsibility with the goals of long-term socio-economic resilience.
Much of the controversy involving ESG investing stems from the observation that limiting the investment opportunity set by excluding low-ESG firms is likely to counter the return-risk maximization that many investors prioritize. Yet the demand for incorporating ESG into portfolios remains strong among investors. Our portfolio approach attempts to reframe these issues and reduce this controversy not through traditional screening techniques, but by leveraging the inverse relationship between ESG scores and the expected likelihood of experiencing extreme returns in the subsequent year. This is accomplished by including ESG scores as a factor in a model used to forecast which firms are likely to exhibit extreme performance in the subsequent year. Our results provide portfolios that have higher ESG scores, lower risk, and returns comparable to the benchmark. This portfolio construction process allows portfolio managers to incorporate ESG into the investment decision process without adversely impacting risk-return objectives.
As the investment industry grapples with integrating ESG mandates without violating fiduciary standards, our approach offers a principled middle ground. By anchoring ESG considerations in risk-based frameworks rather than normative exclusions, asset managers can satisfy growing stakeholder interest in sustainability while adhering to return-maximizing mandates.
This study may have limitations, particularly related to sample selection, as we chose to focus on an S&P 500 Index approach. Firms included in the S&P 500 may well have different risk characteristics and ESG–risk relationships compared to firms that are smaller, trade in countries other than the U.S., and are not as widely included in passive investment strategies. Further, while liquidity and transaction costs in S&P 500 firms are expected to be minimal, the inclusion of such practical considerations could weaken the overall results experienced by actual investors. Possible extensions of this paper include (a) expanding to a larger sample of firms, (b) sector-level analysis, (c) expansion to non-U.S. firms, and (d) focusing on individual ESG components.
Author Contributions
Conceptualization, J.C. and N.M.; methodology, K.K., and N.M.; software, J.C., K.K., and N.M.; validation, J.C., K.K., and N.M.; formal analysis, K.K. and N.M.; investigation, K.K. and N.M.; resources, J.C., K.K., and N.M.; data curation, K.K. and N.M.; writing—original draft preparation, J.C., K.K., and N.M.; writing—review and editing, J.C., K.K., and N.M.; visualization, J.C. and N.M.; project administration, N.M. All authors have read and agreed to the published version of the manuscript.
Funding
This research received no external funding.
Institutional Review Board Statement
Not applicable.
Informed Consent Statement
Not applicable.
Data Availability Statement
The datasets presented in this article are not readily available because the data are part of additional, ongoing studies. Requests to access the datasets should be directed to the corresponding author.
Acknowledgments
We would like to thank Steve Pruitt, Matt Ankrum, and seminar participants at the University of Missouri-Kansas City and the University of West Florida.
Conflicts of Interest
The authors declare no conflicts of interest.
Appendix A
Table A1.
Comparing results by year with and without ESG included as a predictor, compared to excluding the prior year’s extreme movers.
Table A1.
Comparing results by year with and without ESG included as a predictor, compared to excluding the prior year’s extreme movers.
| All Firms | With ESG as Predictor | Difference | NO ESG as Predictor | Difference | NO Last Extreme 6% | Difference | ||||||||
|---|---|---|---|---|---|---|---|---|---|---|---|---|---|---|
| Year | Return | Ann SD | Return | Ann SD | Return | Ann SD | Return | Ann SD | Return | Ann SD | Return | Ann SD | Return | Ann SD |
| 2003 | 27.1% | 22.2% | 27.1% | 21.6% | 0.0% | −0.6% | 27.1% | 22.0% | 0.0% | −0.2% | 26.9% | 22.3% | −0.2% | 0.1% |
| 2004 | 9.2% | 18.2% | 9.4% | 17.4% | 0.2% | −0.8% | 9.4% | 17.9% | 0.2% | −0.3% | 9.2% | 18.2% | 0.0% | 0.0% |
| 2005 | 5.6% | 14.5% | 5.4% | 13.7% | −0.2% | −0.8% | 5.5% | 13.7% | −0.1% | −0.8% | 5.6% | 14.5% | 0.0% | 0.0% |
| 2006 | 16.2% | 15.4% | 16.4% | 14.8% | 0.2% | −0.6% | 16.4% | 15.3% | 0.2% | −0.1% | 16.1% | 15.4% | −0.1% | 0.0% |
| 2007 | 7.7% | 24.5% | 6.1% | 21.3% | −1.7% | −3.2% | 6.4% | 23.4% | −1.3% | −1.1% | 7.7% | 24.5% | 0.0% | 0.0% |
| 2008 | −34.7% | 19.9% | −33.5% | 19.6% | 1.2% | −0.3% | −33.7% | 19.9% | 1.0% | 0.0% | −34.7% | 19.9% | 0.0% | 0.0% |
| 2009 | 25.3% | 32.9% | 29.0% | 31.6% | 3.7% | −1.3% | 28.1% | 32.6% | 2.8% | −0.3% | 25.1% | 32.9% | −0.2% | 0.0% |
| 2010 | 14.6% | 16.8% | 14.6% | 16.0% | 0.0% | −0.8% | 14.6% | 16.5% | 0.0% | −0.3% | 14.5% | 16.8% | −0.1% | 0.0% |
| 2011 | 2.6% | 19.7% | 3.1% | 19.2% | 0.5% | −0.5% | 2.9% | 19.6% | 0.3% | −0.1% | 2.6% | 19.7% | 0.0% | 0.0% |
| 2012 | 16.1% | 16.3% | 15.1% | 14.6% | −1.0% | −1.7% | 15.3% | 15.2% | −0.8% | −1.1% | 16.0% | 16.3% | −0.1% | 0.0% |
| 2013 | 31.8% | 19.4% | 31.5% | 18.0% | −0.3% | −1.4% | 31.5% | 19.1% | −0.3% | −0.3% | 31.4% | 19.4% | −0.4% | 0.0% |
| 2014 | 13.4% | 14.7% | 13.3% | 13.9% | −0.1% | −0.8% | 13.3% | 14.1% | −0.1% | −0.6% | 13.5% | 14.7% | 0.1% | 0.0% |
| 2015 | 1.3% | 19.0% | 1.6% | 19.3% | 0.3% | 0.3% | 1.5% | 19.3% | 0.2% | 0.3% | 1.0% | 18.9% | −0.3% | −0.1% |
| 2016 | 12.1% | 15.2% | 11.9% | 14.7% | −0.2% | −0.5% | 12.0% | 15.1% | −0.1% | −0.1% | 12.5% | 15.2% | 0.4% | 0.0% |
| 2017 | 22.2% | 20.5% | 21.9% | 19.2% | −0.3% | −1.3% | 22.1% | 20.1% | −0.1% | −0.4% | 22.2% | 20.5% | 0.0% | 0.0% |
| 2018 | −4.4% | 16.8% | −4.1% | 15.5% | 0.4% | −1.3% | −4.3% | 16.5% | 0.1% | −0.3% | −4.5% | 16.8% | −0.1% | 0.0% |
| 2019 | 31.5% | 19.5% | 30.9% | 19.2% | −0.7% | −0.3% | 31.1% | 19.4% | −0.4% | −0.1% | 31.5% | 19.5% | 0.0% | 0.0% |
| 2020 | 19.1% | 29.9% | 18.2% | 28.7% | −0.9% | −1.2% | 18.4% | 29.7% | −0.7% | −0.2% | 18.7% | 29.9% | −0.5% | 0.0% |
| 2021 | 27.9% | 23.6% | 26.5% | 21.5% | −1.5% | −2.1% | 26.5% | 23.0% | −1.4% | −0.6% | 28.3% | 23.6% | 0.4% | 0.0% |
| Geo Mean | 11.7% | 19.9% | 11.7% | 18.9% | 0.0% | −1.0% | 11.7% | 19.6% | 0.0% | −0.3% | 11.6% | 19.9% | −0.1% | 0.0% |
Appendix B
Table A2.
Breakdown of correctly identified predicted extreme movement firms by year.
Table A2.
Breakdown of correctly identified predicted extreme movement firms by year.
| Correctly Identified, by Year | ||
|---|---|---|
| Positive Extreme | Negative Extreme | |
| 2003 | 0 | 2 |
| 2004 | 1 | 0 |
| 2005 | 0 | 1 |
| 2006 | 2 | 4 |
| 2007 | 3 | 1 |
| 2008 | 0 | 0 |
| 2009 | 3 | 3 |
| 2010 | 1 | 4 |
| 2011 | 2 | 2 |
| 2012 | 2 | 4 |
| 2013 | 5 | 4 |
| 2014 | 2 | 3 |
| 2015 | 2 | 2 |
| 2016 | 1 | 5 |
| 2017 | 6 | 3 |
| 2018 | 2 | 2 |
| 2019 | 1 | 2 |
| 2020 | 2 | 2 |
| 2021 | 3 | 5 |
References
- Sorensen, E.; Chen, M.; Mussalli, G. The quantitative approach for sustainable investing. J. Portf. Manag. 2021, 47, 38–49. [Google Scholar] [CrossRef]
- Hasaj, M.; Scherer, B. Covid-19 and smart beta: A case study on the role of sectors. Financ. Mark. Portf. Manag. 2021, 35, 515–532. [Google Scholar] [CrossRef]
- Fabozzi, F.; Ma, K.; Oliphant, B. Sin stock returns. J. Portf. Manag. 2008, 35, 82–94. [Google Scholar] [CrossRef]
- Hong, H.; Kacperczyk, M. The price of sin: The effects of social norms on markets. J. Financ. Econ. 2009, 93, 15–36. [Google Scholar] [CrossRef]
- Fulton, M.; Kahn, B.; Sharples, C. Sustainable Investing: Establishing Long-Term Value and Performance; Report, Climate Change Advisors; Deutsche Bank: Hong Kong, China, 2012. [Google Scholar]
- Statman, M.; Glushkov, D. The wages of social responsibility. Financ. Anal. J. 2009, 65, 33–46. [Google Scholar] [CrossRef]
- Henriksson, R.; Livnat, J.; Pfeiffer, P.; Stumpp, M. Integrating ESG in portfolio construction. J. Portf. Manag. 2019, 45, 67–81. [Google Scholar] [CrossRef]
- Giese, G.; Nagy, Z.; Lee, L. Deconstructing ESG ratings performance: Risk and return for E, S, and G by time horizon, sector, and weighting. J. Portf. Manag. 2021, 47, 94–111. [Google Scholar] [CrossRef]
- Kim, Y.; Li, H.; Li, S. Corporate social responsibility and stock price crash risk. J. Bank. Financ. 2014, 43, 1–13. [Google Scholar] [CrossRef]
- Clark, J.; Krieger, K.; Mauck, N. Lowering portfolio risk with corporate social responsibility. J. Invest. 2019, 28, 43–52. [Google Scholar] [CrossRef]
- Blitz, D.; Van Vilet, P. The volatility effect: Lower risk without lower return. J. Portf. Manag. 2007, 34, 102–113. [Google Scholar] [CrossRef]
- Blitz, D.; Van Vilet, P.; Baltussen, G. The volatility effect revisited. J. Portf. Manag. 2020, 46, 45–63. [Google Scholar] [CrossRef]
- Hamilton, J.D. Time Series Analysis; Princeton University Press: Princeton, NJ, USA, 1994. [Google Scholar]
- Tsay, R.S. Analysis of Financial Time Series, 3rd ed.; Wiley: Hoboken, NJ, USA, 2010. [Google Scholar]
- Cont, R. Empirical Properties of Asset Returns: Stylized Facts and Statistical Issues. Quant. Financ. 2001, 1, 223–236. [Google Scholar] [CrossRef]
- Albuquerque, R.; Koskinen, Y.; Zhang, C. Corporate social responsibility and firm risk: Theory and empirical evidence. Manag. Sci. 2020, 65, 4451–4469. [Google Scholar] [CrossRef]
- Khan, M.; Serafeim, G.; Yoon, A. Corporate Sustainability: First Evidence on Materiality. Account. Rev. 2016, 91, 1697–1724. [Google Scholar] [CrossRef]
- Ilhan, E.; Sautner, Z.; Vilkov, G. Carbon Tail Risk. Rev. Financ. Stud. 2021, 34, 1540–1571. [Google Scholar] [CrossRef]
- Melas, D. The future of factor investing. J. Portf. Manag. 2022, 48, 15–25. [Google Scholar] [CrossRef]
- Bouslah, R.; Kryzanowski, L.; M’Zali, B. The Impact of the Dimensions of Social Performance on Firm Risk. J. Bank. Financ. 2013, 37, 1258–1273. [Google Scholar] [CrossRef]
- Becchetti, L.; Ciciretti, R.; Hasan, I. Corporate social responsibility, stakeholder risk, and idiosyncratic volatility. J. Corp. Financ. 2015, 35, 297–309. [Google Scholar] [CrossRef]
- Giese, G.; Lee, L.E.; Melas, D.; Nagy, Z.; Nishikawa, L. Foundations of ESG investing: How ESG affects equity valuation, risk, and performance. J. Portf. Manag. 2019, 45, 69–83. [Google Scholar] [CrossRef]
- Pedersen, L.H.; Fitzgibbons, S.; Pomorski, L. Responsible investing: The ESG-efficient frontier. J. Financ. Econ. 2021, 142, 572–597. [Google Scholar] [CrossRef]
- Hoepner, A.G.F.; Oikonomou, I.; Sautner, Z.; Starks, T.; Zhou, Y. ESG Shareholder Engagement and Downside Risk. Rev. Financ. 2024, 28, 483–510. [Google Scholar] [CrossRef]
- Lins, K.V.; Servaes, H.; Tamayo, A. Social Capital, Trust, and Firm Performance: The Value of Corporate Social Responsibility during the Financial Crisis. J. Financ. 2017, 72, 1785–1824. [Google Scholar] [CrossRef]
- Ang, A.; Hodrick, R.J.; Xing, Y.; Zhang, X. The Cross-Section of Volatility and Expected Returns. J. Financ. 2006, 61, 259–299. [Google Scholar] [CrossRef]
- Baker, M.; Bradley, B.; Wurgler, J. Benchmarks as Limits to Arbitrage: Understanding the Low-Volatility Anomaly. Financ. Anal. J. 2011, 67, 40–54. [Google Scholar] [CrossRef]
- Chen, J.; Hong, H.; Stein, J.C. Forecasting crashes: Trading volume, past returns, and conditional skewness in stock prices. J. Financ. Econ. 2001, 61, 345–381. [Google Scholar] [CrossRef]
- Fodor, A.; Krieger, K.; Mauck, N.; Stevenson, G. Predicting extreme returns and portfolio management implications. J. Financ. Res. 2013, 36, 471–492. [Google Scholar] [CrossRef]
- Gougler, A.; Utz, S. Factor exposures and diversification: Are sustainably screened portfolios any different? Financ. Mark. Portf. Manag. 2020, 34, 221–249. [Google Scholar] [CrossRef]
Disclaimer/Publisher’s Note: The statements, opinions and data contained in all publications are solely those of the individual author(s) and contributor(s) and not of MDPI and/or the editor(s). MDPI and/or the editor(s) disclaim responsibility for any injury to people or property resulting from any ideas, methods, instructions or products referred to in the content. |
© 2026 by the authors. Licensee MDPI, Basel, Switzerland. This article is an open access article distributed under the terms and conditions of the Creative Commons Attribution (CC BY) license.