Abstract
Vegetation degradation in arid and semi-arid regions is intensifying due to rising temperatures, declining rainfall, soil exposure, and persistent human pressures. Drylands cover over 41% of the global land surface and support nearly two billion people, making their degradation a major environmental and socio-economic concern. However, many remote sensing and GIS-based assessment approaches remain fragmented and difficult to reproduce. This study proposes a Computational Sustainability Framework for vegetation degradation assessment that integrates multi-source satellite data, biophysical indicators, automated geospatial preprocessing, and the Analytical Hierarchy Process (AHP) within a transparent and reproducible workflow. The framework comprises four phases: data preprocessing, indicator extraction and normalization, AHP-based modeling, and spatial classification with qualitative validation. The framework was applied to the Al-Khunfah and Harrat al-Harrah Protected Areas in northern Saudi Arabia using multi-source datasets for the January–April 2023 period, including Sentinel-2, Landsat-8, CHIRPS precipitation, ESA-CCI land cover, FAO soil data, and SRTM DEM. High degradation zones were associated with low NDVI (<0.079), high BSI (>0.276), and elevated LST (>49 °C), whereas low degradation areas were concentrated near wadis and relatively more fertile soils. Overall, the proposed framework provides a scalable and interpretable tool for early-stage vegetation degradation screening in arid environments, supporting the prioritization of areas for ecological investigation and restoration planning.
1. Introduction
Computational sustainability has emerged as a multidisciplinary field that applies computational models, algorithms, and data-driven systems to address complex environmental challenges such as biodiversity loss, water scarcity, and land degradation [1]. Vegetation degradation and desertification represent complex, data-intensive environmental challenges that demand computational solutions capable of integrating diverse spatial, climatic, and ecological inputs. Recent global assessments indicate that drylands cover approximately 41% of the Earth’s land surface and are home to nearly two billion people, while nearly 24% of global land is already affected by varying levels of degradation, affecting hundreds of millions to billions of people through reduced productivity and ecosystem services [2]. These processes, driven by population growth, unsustainable land use, and climate change, threaten both the immediate and the long-term sustainability of ecosystems, especially in arid and semi-arid regions [3,4,5,6]. Climate change not only leads to rising temperatures and an increased risk of drought, but also to greater climate variability and a higher likelihood of extreme weather events that accelerate erosion and vegetation loss. In the Arabian Peninsula, degradation is accelerating under the combined effects of land-use pressures, and rising heat stress [7]. Recent reports from the Ministry of Environment, Water and Agriculture (MEWA) [8] estimate that more than 13,000 km2 of rangeland and natural vegetation are lost or severely degraded each year across Saudi Arabia. The Ministry also reports annual declines of 1.2–1.5% in shrub and tree cover within rangelands, indicating a rapid acceleration of vegetation loss and soil exposure at the national scale. These national trends are reflected strongly in the northern region, where MEWA [8] and National Center for Wildlife (NCW) assessments document elevated rates of shrub decline and recurrent bare-soil expansion in and around the Al-Khunfah and Harrat al-Harrah Protected Areas [9]. Studies focused on these specific reserves, though limited in number, highlight their ecological roles as habitats for Arabian oryx, sand and mountain gazelles, houbara bustards, and migratory raptors [10,11]. Recent NCW monitoring reports further documented habitat fragmentation, shrub-cover regression, and increased bare-soil patches within both reserves [12].
Saudi Arabia’s arid and semi-arid zones are broadly characterized by highly variable rainfall, fragile soils, and strong thermal stress, conditions that shape vegetation resilience across the Kingdom’s desert and steppe regions. These national-scale patterns are well-documented in regional climatology and vegetation studies and provide the broader ecological context for understanding land degradation processes in arid environments [9].
General studies of Saudi arid rangeland ecosystems have documented long-term shrub-cover decline and soil degradation, particularly in central regions of the country [13]. In contrast, the northern region—encompassing Al-Jawf, Tabuk, and the Northern Borders Provinces—constitutes a distinct ecological zone that differs markedly in geology, vegetation structure, and environmental pressures. Building on these condition assessments, recent NCW reports attribute ongoing vegetation degradation primarily to overgrazing, off-road vehicle disturbance, and intensifying heat stress, with emerging patterns of localized habitat fragmentation [14].
Within these protected areas, restoration interventions commonly implemented by the National Center for Vegetation Cover include controlled grazing management, rehabilitation of overused rangeland patches, reseeding of native shrubs and perennial grasses, erosion-control measures in highly exposed soils, and small-scale water-harvesting or wadi-enhancement techniques to improve soil moisture retention. These interventions are typically prioritized in areas where vegetation decline is detectable but ecological recovery remains feasible. Therefore, spatially explicit degradation mapping plays an important role in identifying candidate zones for early restoration action and supports national programs under the Saudi Green Initiative aimed at improving vegetation cover and stabilizing degraded rangelands.
1.1. Computational Need for Vegetation-Degradation Assessment
Vegetation degradation assessment in arid lands needs computational frameworks that integrate diverse environmental variables at scale, especially where field monitoring is limited or discontinuous.
Remote sensing (RS) has the potential to provide scalable, repeatable, and objective data for environmental indicators, supporting monitoring vegetation health and land degradation in arid ecosystems. Soil salinization also represents a major driver of vegetation stress in arid and semi-arid landscapes. Recent remote-sensing studies have demonstrated strong advances in detecting and modeling salinity dynamics, with Wang et al. [15] providing a comprehensive review of RS-based soil-degradation monitoring and Alqasemi et al. [16] showing how multispectral imagery can capture spatio-temporal variations in soil salinity across arid regions. As emphasized by Wang et al. [15], salinization is a dynamic process shaped by climate variability, land-use pressures, and groundwater extraction, highlighting the importance of incorporating temporal monitoring rather than relying solely on static soil datasets.
NDVI, BSI, and LST provide quantitative proxies for vegetation condition, soil exposure, and thermal stress [17]. Hydrological proximity (e.g., distance to wadis) and climatic datasets add context for vegetation resilience. Because these layers differ in structure, scale, and temporal frequency, they require integration and normalization within a unified workflow.
Many RS/GIS studies still depend on static overlays and manual steps, which limits scalability, transparency, and transferability across arid regions. A reproducible pipeline is needed that automates preprocessing, normalizes multiple indicators, and applies transparent weighting. MCDA—particularly AHP—supports this by assigning criterion weights with logical consistency checks [18], allowing expert judgment to be operationalized within an executable decision structure.
1.2. Remote Sensing and Environmental Indicators
Remote sensing (RS) provides scalable and repeatable environmental indicators for monitoring vegetation health and land degradation in arid ecosystems. Using multispectral and thermal sensors (e.g., Sentinel-2 and Landsat-8), RS supports quantitative estimation of vegetation vigor, soil exposure, and surface thermal conditions, commonly captured through NDVI, BSI, and LST. Remote-sensing approaches have also advanced in mapping soil salinity and surface mineralization, which are critical factors influencing vegetation resilience in drylands. Studies such as Wang et al. [15] and Alqasemi et al. [16] demonstrate the value of multispectral indicators for detecting salinity-driven degradation, while Wang et al. [15] highlight the need for temporal monitoring due to the non-static nature of salinization processes.
In arid ecosystems, degradation occurs through several interacting dimensions: (1) vegetation decline reflected by low NDVI, (2) soil exposure and surface crusting indicated by high BSI, (3) thermal amplification and reduced evapotranspiration shown through elevated LST, (4) hydrological disconnection from wadis or shallow groundwater, and (5) salinity-driven vegetation stress. These dimensions evolve at different temporal and spatial scales and cannot be reliably characterized using single indicators alone.
NDVI serves as a core vegetation index for monitoring changes in vegetation productivity and cover, while soil exposure and degradation patterns can be inferred using indices such as the Bare Soil Index (BSI). Land Surface Temperature (LST) further reflects surface thermal dynamics that are linked to vegetation stress and evapotranspiration processes. Together, these remote sensing–derived indicators provide a robust basis for characterizing vegetation condition and identifying early signs of land degradation in arid and semi-arid regions [19].
The integration of multiple remote sensing indicators enhances the interpretation of vegetation–soil–climate dynamics, as relying on individual indices alone often fails to capture the complex and non-linear processes that drive degradation. Evidence presented in [19], combining vegetation indices with complementary metrics such as soil exposure and surface temperature, improves the detection of spatial heterogeneity and strengthens the reliability of land degradation assessments across dryland environments. Despite its scalability, RS-only mapping has notable limitations. Spectral indices may saturate in sparsely vegetated areas, misclassify dark volcanic substrates, or fail to detect below-ground or early-stage degradation processes. Sensor differences, atmospheric correction issues, and seasonal timing can further affect interpretation. These limitations underscore the need to combine RS indicators with ancillary environmental datasets and structured decision frameworks.
An additional issue is that many RS-based studies still use univariate analysis, treating indices independently rather than modeling their interrelationships [20,21]. To address this, recent work advances multi-index fusion, time-series analysis, and machine-assisted modeling that combine NDVI, BSI, and LST to produce integrated degradation maps [22,23], often strengthened by machine-learning methods using multi-temporal satellite data [24]. Increasingly, these approaches are linked with MCDA frameworks such as AHP to weight indicators transparently for degradation assessment [25], improving interpretability and decision support across heterogeneous landscapes.
Recent work also stresses that RS indicators must be interpreted within ecological and land-use context. Castaneda-Camacho et al. [26] showed that spectral signals may underestimate degradation when grazing pressure, soil crusting, or disturbance are not optically detectable. Boland and Burwell [27] similarly note that RS-derived indices often require field validation to avoid misclassification in heterogeneous arid landscapes. Together, these studies highlight the need to situate RS data within broader computational or decision-analytic frameworks.
For the purpose of the present study, a major concern is that existing RS-based rarely combine automated preprocessing, unified normalization, and validated AHP weighting in one reproducible pipeline—an integration gap the proposed framework targets.
1.3. Geospatial Modeling and Data Integration
Geospatial modeling has moved beyond early GIS overlay mapping toward data-intensive workflows that integrate remote-sensing, climatic, and terrain data for multiscale environmental analysis [22,25,28]. Current GIS pipelines increasingly automate ingestion, preprocessing, and normalization of multi-temporal imagery (e.g., Sentinel-2 and Landsat-8), enabling reproducible fusion of spectral, thermal, and topographic indicators into consistent geospatial layers.
Recent work also introduces adaptive modeling, where spatial relationships are recalibrated using validation feedback and field observations [23], shifting GIS from descriptive mapping toward analytical decision support. However, many workflows remain semi-manual, relying on static thresholds and expert-driven weighting that reduces automation and cross-regional transferability.
The framework proposed in this study addresses these limitations by embedding geospatial automation within a Computational Sustainability Framework and coupling it with decision-analytic algorithms to support transparent and repeatable environmental modeling.
1.4. Multi-Criteria Decision Algorithms
Environmental decision-making in arid ecosystems requires integrating diverse variables such as vegetation cover, soil exposure, surface temperature, and climatic stress that interact nonlinearly across spatial and temporal scales. Multi-Criteria Decision Analysis (MCDA) offers a transparent structure for synthesizing heterogeneous data when both measurements and expert judgment are needed [25].
Among MCDA techniques, the Analytical Hierarchy Process (AHP) is widely used because it converts expert or empirical priorities into pairwise comparisons and produces normalized weights, with consistency checked using the Consistency Ratio (CR ≤ 0.1) [29].
Recent work combines MCDA with predictive modeling. Moradi et al. [30] integrate SVM with eDPSIR/ANP for land-degradation risk assessment, and Yagoub et al. [18] use an AHP–GIS approach to evaluate threats to oasis ecosystems, showing how expert-weighted RS indicators can support conservation planning.
However, many implementations still treat AHP/ANP as stand-alone GIS steps with manual inputs and static matrices, which limits reproducibility and the use of multi-temporal RS data. The proposed Computational Sustainability Framework embeds AHP within an automated geospatial pipeline to support repeatable weighting with continuous data integration and validation.
To avoid confusion with land suitability analysis, this study reports classification results as degradation status: High Degradation, Moderate Degradation, and Low Degradation.
1.5. Computational Sustainability Frameworks
Computational sustainability frameworks integrate remote-sensing analytics, geospatial modeling, and decision-support algorithms into scalable and reproducible architectures for sustainability research [1]. By combining automated data fusion with algorithmic reasoning, these frameworks extend traditional environmental analysis beyond descriptive mapping, but their outputs remain context-dependent and are most effective for guiding preliminary assessments rather than serving as stand-alone diagnostic tools.
In arid and semi-arid ecosystems, these frameworks help fuse spectral, climatic, and hydrological indicators for degradation screening. Prior work shows their value through hybrid MCDA–machine learning modeling for desertification assessment [30] and automated Sentinel-2 workflows for large-scale monitoring of desertification dynamics [23]. Studies illustrate how computational sustainability approaches can support environmental analytics when adapted to local ecological conditions, though their applicability remains constrained by context-specific factors, data availability, and the need for field validation.
Research applying such integrative frameworks to Saudi Arabia’s protected regions remains limited, and many regional studies still rely on static mapping or isolated index assessments with limited reproducibility. Broader analyses of protected-area management challenges in Saudi Arabia—including those conducted for regions outside the northern desert, such as the Al-Ahsa study by Chouari [31]—highlight national scale pressures related to land-use change, policy fragmentation, and uneven enforcement. These studies provide contextual insight into administrative constraints across the Kingdom, but they do not describe the specific ecological conditions of the Al-Khunfah or Harrat al-Harrah reserves. Accordingly, the present study addresses this gap by applying a computational sustainability framework tailored to the environmental characteristics of northern Saudi Arabia.
The framework is not intended to function as a cross-regional diagnostic model. Instead, it supports early-stage hotspot identification and prioritizes areas for field investigation. Its utility lies in guiding, not replacing, ground-based ecological assessment.
The present study proposes an integrated computational workflow that automate preprocessing, indicator normalization, AHP-based weighting, and degradation classification in one reproducible pipeline. Unlike approaches that rely on static overlays, manual thresholding, or opaque expert weighting, this framework standardizes preprocessing and normalization and executes the decision model within a documented, repeatable workflow. The framework provides a structured foundation for early identification of potential degradation hotspots. It achieves the following objectives:
- Derive key environmental indicators (NDVI, BSI, LST, Distance to Water/Wadis, Soil type, precipitation, and climate variables) from multispectral and thermal satellite imagery and open-source datasets.
- Integrate and normalize these indicators within a modular computational workflow using AHP-based decision modeling to assess their relative influence on degradation.
- Generate and validate degradation-classification maps delineating areas of low, moderate, and high vegetation degradation.
This work contributes to computational sustainability by showing how an integrated, reproducible pipeline can support scalable screening of vegetation degradation in arid landscapes.
In this study, we evaluate the proposed Computational Sustainability Framework using multi-source environmental datasets for the period January–April 2023, which corresponds to the seasonal window when vegetation in arid regions shows its strongest spectral response. All stages of the framework, including data acquisition, preprocessing, indicator derivation, AHP-based modeling, and spatial classification, were implemented using these standardized datasets. This evaluation demonstrates how the framework performs under real geospatial conditions and provides practical evidence of its applicability to initial vegetation-degradation screening in Saudi Arabia’s arid landscapes.
2. Materials and Methods
An integrated computational workflow was developed to structure the degradation assessment process, as shown in Figure 1. The workflow consists of four sequential phases: (1) data preprocessing and harmonization, (2) extraction and normalization of environmental indicators, (3) AHP-based weighting to determine relative criterion importance, and (4) spatial classification of vegetation degradation. This structured workflow ensures reproducibility and provides a transparent linkage between dataset preparation, analytical decisions, and final map outputs.
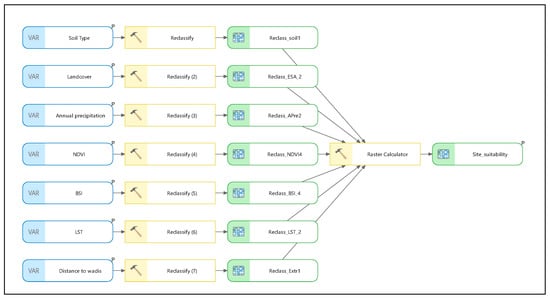
Figure 1.
Overview of the computational workflow used in the vegetation degradation assessment. ‘P’ refers to the parameter within the Model Builder workflow.
2.1. Study Area
The study focuses on two major protected areas in northern Saudi Arabia, Al-Khunfah and Harrat al-Harrah, both originally designated as part of the national protected-area system established during the late twentieth century [11] and now incorporated into the King Salman bin Abdulaziz Royal Natural Reserve under the management of the National Center for Wildlife (NCW) (Figure 2). The study-area boundary used in this research was digitized from publicly available OpenStreetMap (OSM) administrative layers and refined for cartographic accuracy. Together, the two reserves cover slightly above 32,700 km2, forming one of the largest conservation landscapes in the Kingdom [14,32,33].
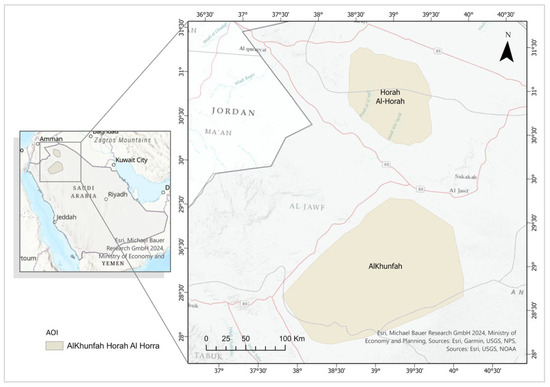
Figure 2.
Location of the study area within northern Saudi Arabia.
Ecologically, both reserves fall within the Arabian Desert and Xeric Shrublands ecoregion, characterized by extreme aridity, sparse perennial shrubs, and high sensitivity to rainfall variability [34].
Field-based vegetation surveys confirm that desert–steppe shrub communities dominate northern Saudi Arabia, particularly around Ha’il and adjacent basaltic plateaus [10]. Dominant vegetation documented in regional ecological surveys includes Haloxylon salicornicum, Rhanterium epapposum, Calligonum comosum, and Artemisia species, which form the characteristic desert–steppe assemblages of northern Saudi Arabia [10,11].
Recent climatological assessments focused specifically on northern Saudi Arabia demonstrate clear warming trends, increased thermal variability, and pronounced seasonal temperature shifts, particularly during summer and transitional periods [35]. Rainfall-trend analyses for the northern inland region, including Ha’il, reveal decreasing rainy-day frequencies and increased interannual variability, indicating an intensifying aridity regime across the northern desert–steppe environment [36]. These conditions, combined with documented pressures such as overgrazing and off-road vehicle disturbance reported by NCW, have contributed to measurable vegetation decline across both protected areas [9].
Ecological vulnerability across the northern volcanic landscapes of Saudi Arabia is evident in the documented decline of key shrub and tree species within ancient basaltic terrains. Vegetation studies conducted in protected volcanic areas—comparable in structure and ecological behavior to Harrat al-Harrah—show reductions in floristic diversity, increased exposure of bare substrates, and heightened sensitivity of dominant perennial associations to climatic stress and grazing pressures [37].
Topographically, the landscape consists of basaltic lava fields, gravel plains, and ephemeral drainage networks that strongly influence moisture distribution and vegetation patterns. These ecological, climatic, and geomorphological characteristics collectively justify the selection of Al-Khunfah and Harrat al-Harrah as suitable test sites for evaluating the Computational Sustainability Framework.
Al-Khunfah Protected Area.
Located in the northern part of the Tabuk Region (26°30′–28°00′ N, 39°00′–42°00′ E), Al-Khunfah covers ~19,000 km2 under the updated post-2018 reserve boundary. The landscape includes basaltic plateaus, gravel plains, and seasonal wadis, supporting sparse desert vegetation typical of hyper-arid environments.
Climate.
Al-Khunfah experiences a hot desert climate (BWh), characterized by very high summer temperatures, strong seasonal thermal variability, and low, highly irregular rainfall, consistent with climatological patterns reported for northern Saudi Arabia [7].
Historical climate trend (1991–2020).
Regional climate assessments indicate a persistent warming tendency and marked interannual rainfall variability, both of which affect vegetation resilience and soil exposure in hyper-arid rangelands [7].
Vegetation.
Dominant species include Haloxylon salicornicum, Rhanterium epapposum, Calligonum comosum, Launaea shawii, and ephemeral annuals that appear after winter rainfall.
Harrat al-Harrah Protected Area.
Harrat al-Harrah lies northeast of Al-Khunfah near the Al-Jawf Region and covers 13,775 km2 (post-2018 boundary). The area is characterized by basaltic lava fields, sandstone ridges, and ephemeral drainage systems.
Climate.
Harrat al-Harrah exhibits the same hot desert (BWh) conditions, marked by pronounced thermal extremes between seasons and winter-dominated, low-magnitude rainfall [7].
Historical climate trend (1991–2020).
Long-term analyses similarly indicate a warming pattern and substantial rainfall variability, factors that contribute to vegetation stress and soil exposure across protected rangelands in northern Saudi Arabia [7].
Vegetation.
Vegetation follows a desert-steppe pattern with perennial shrubs such as Haloxylon salicornicum, Anabasis articulata, Artemisia monosperma, and scattered grasses in run-on zones.
Grazing Pressure.
Livestock grazing represents one of the dominant environmental pressures influencing vegetation dynamics in northern Saudi Arabia. Overgrazing reduces perennial shrub cover, promotes bare-soil expansion, and accelerates surface erosion in hyper-arid landscapes. Previous studies have documented substantial grazing impacts in both protected and unprotected rangelands across the Arabian Desert [10,34]. Camel and goat grazing remains spatially variable but persistent across both reserves.
Ecological and Conservation Context.
Both reserves lie within the Arabian Desert and Xeric Shrublands ecoregion [38]. Earlier vegetation and wildlife surveys identify these northern Saudi landscapes as important habitats for Arabian oryx, sand and mountain gazelles, houbara bustards, and migratory raptors [10,11].
Although legally protected since the 1980s, field and NCW reports show increasing pressures from overgrazing, off-road driving, and wood collection, contributing to shrub-cover decline, bare-soil expansion, and localized vegetation collapse. These conditions make the two reserves ideal sites for evaluating a computational degradation-assessment framework.
Topographically, the study area forms a gently dissected basaltic plateau, with elevations ranging from 562 to 1131 m above sea level. The lower elevations are associated with broad wadi floors and gently undulating surfaces, whereas the higher elevations correspond to more elevated basaltic ridges and remnant plateaus. Slope analysis indicates predominantly gentle to moderate gradients, with the steepest slopes concentrated along incised wadis and escarpment margins, as shown in the slope map (Figure 3).
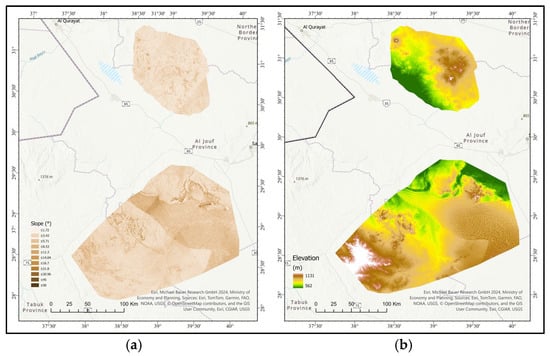
Figure 3.
Topographic maps of the study area. (a) Slope map (degrees) calculated from the same DEM. (b) Elevation map derived from the SRTM 30 m DEM.
2.2. Data Sources
The computational framework integrates multi-source environmental datasets, combining optical, thermal, topographic, and climatic information to generate a unified geospatial data stack for vegetation degradation assessment (Table 1).

Table 1.
Primary environmental datasets used in the computational framework for assessing vegetation degradation and desertification in the Al-Khunfah and Harrat al-Harrah Protected Areas in northern Saudi Arabia.
Each dataset was selected based on its spatial resolution, temporal coverage, and open-data accessibility to ensure methodological reproducibility and regional scalability.
Primary datasets used in this study were Sentinel-2 MSI imagery (10–20 m) for deriving spectral indices such as NDVI and BSI; Landsat-8 OLI/TIRS imagery for estimating LST; and CHIRPS v2.0 rainfall data for long-term precipitation analysis. The CHIRPS dataset used in this study corresponds to CHIRPS v2.0 [39], and the FAO soil dataset corresponds to SoilGrids 2.0 (2020 release).
Static datasets used in the analysis were the FAO Soil Grids of the World and ESA CCI Land-Cover dataset were used for soil classification and vegetation/land-use categorization, respectively. The SRTM DEM (30 m) was used to extract topographic derivatives, including slope, elevation, and distance to wadis, which are key hydrological and geomorphological indicators in arid environments.
Together, these datasets form a comprehensive, multi-dimensional foundation for modeling the biophysical, thermal, and hydrological dynamics that influence vegetation health and degradation across the study areas.
2.3. Environmental Variables
Seven environmental indicators derived from the integrated datasets were used to model vegetation degradation and desertification susceptibility. Together, they capture key biophysical, thermal, and hydrological stress dimensions in the study areas.
Each variable contributes distinct information to the computational model:
- NDVI (Normalized Difference Vegetation Index): Quantifies vegetation vigor and canopy density, enabling detection of healthy, transitional, and degraded vegetation conditions.
- BSI (Bare Soil Index): Highlights soil exposure and erosion-prone surfaces associated with vegetation decline.
- LST (Land Surface Temperature): Indicates surface heat stress, which strongly correlates with vegetation loss in arid climates.
- Precipitation: Represents annual rainfall variability as a proxy for moisture availability and drought severity.
- Soil Type: Defines textural and fertility differences that affect rooting conditions and plant survival.
- Land Cover: Describes the spatial distribution of vegetation, bare ground, and anthropogenic surfaces.
- Distance to Wadis: Measures proximity to ephemeral water channels that enhance soil moisture and promote localized vegetation growth. The hydrological parameter Distance to Wadis was derived through Euclidean-distance and flow-accumulation analyses using the SRTM DEM.
All variables were resampled to 10 m and min–max normalized to 0–1 for cross-indicator comparability before decision modeling. Each indicator was then reclassified into three degradation levels (Low, Moderate, High), producing the standardized input layers for the multi-criteria model.
The three-class scheme (Low, Moderate, High) follows commonly adopted arid-land degradation thresholds, where low values typically indicate healthier vegetation or lower soil exposure, moderate values denote transitional conditions, and high values represent severe degradation or bare-soil dominance (Table 2).
Table 2.
Vegetation degradation classification scheme.
The threshold intervals adopted for NDVI, BSI, and LST follow ranges commonly applied in arid-land vegetation studies, particularly those focused on rangeland condition and desertification dynamics in hyper-arid ecosystems [17]. These intervals were not designed for crop-based vegetation assessments but rather for sparsely vegetated drylands where shrub–grass mosaics dominate and vegetation response is strongly controlled by moisture pulses.
Nevertheless, their applicability may vary across arid regions due to differences in native species composition, soil texture, and ecohydrological functioning. Therefore, these thresholds should be interpreted as generalized ecological indicators rather than species-specific vegetation-health metrics. A corresponding discussion has been added to the Limitations section to clarify that local vegetation traits and ecosystem characteristics may influence threshold performance and introduce context-dependent uncertainty.
All reclassification thresholds used in the degradation model were standardized across indicators. Table 3 summarizes the unified threshold values applied to NDVI, BSI, and LST prior to multi-criteria weighting
Table 3.
Unified reclassification thresholds for NDVI, BSI, and LST used in the vegetation degradation model.
2.4. Data Preprocessing and Computational Environment
All preprocessing was implemented in a reproducible workflow combining Google Earth Engine (GEE) and ArcGIS Pro 3.6 (Esri, Redlands, CA, USA) to retrieve, correct, and harmonize the environmental datasets (Table 1) before modeling.
Seven indicators (soil type, land cover, annual precipitation, NDVI, LST, BSI, and distance to wadis) were used to represent the biophysical, climatic, and hydrological dimensions influencing vegetation stability (Table 1). Each dataset was standardized to a 10 m spatial resolution and projected to WGS 84/UTM Zone 38 N to ensure spatial consistency. Spectral indices were derived for the January–April period, corresponding to a seasonal window of heightened vegetation response in arid regions.
Atmospheric correction and cloud masking were applied to Sentinel-2 and Landsat-8 imagery to minimize atmospheric noise and ensure radiometric consistency. All raster datasets were resampled to a uniform 10 m spatial resolution, reprojected to WGS 84/UTM Zone 38N, and clipped to the boundaries of the Al-Khunfah and Harrat al-Harrah Protected Areas to maintain consistency across all datasets.
To enable spatial alignment during multi-criteria overlay, all layers were harmonized to a 10 m working grid. This grid harmonization was used for alignment with the 10 m Sentinel-2 indices (NDVI, BSI) and the Landsat-8–derived LST layer. Coarser-resolution variables were treated as contextual drivers during interpretation, and we note potential scale-related uncertainty from resampling as a limitation. NDVI, BSI, and LST were computed in GEE using standard band-based formulations, while Distance to Wadis was derived from the SRTM DEM using Euclidean distance and flow accumulation. All layers were min–max normalized to 0–1, then assembled into a seven-layer geospatial stack used as input to the AHP-based MCDA model. This standardized pipeline supports reproducibility by fixing preprocessing parameters (projection, grid resolution, and normalization) across all indicators.
Figure 4 illustrates the preprocessing workflow and the steps used to generate the standardized environmental layers for subsequent analysis.
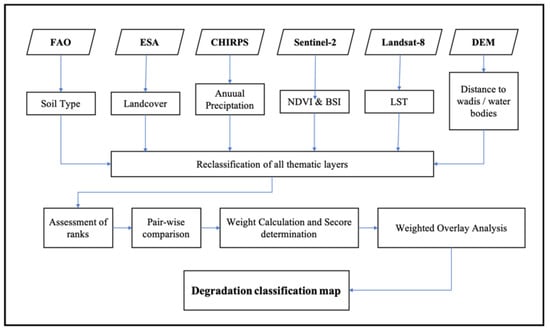
Figure 4.
Methodology for vegetation degradation and desertification classification, showing the integration of multi-source datasets, thematic-layer reclassification, AHP-based weighting, and weighted-overlay analysis.
2.5. Computational Modeling and Decision-Analysis Workflow
This study introduces a Computational Sustainability Framework that integrates environmental data, geospatial processing, and decision-modeling algorithms within a unified analytical pipeline for assessing vegetation degradation and desertification risk. As illustrated in Figure 5, the workflow operates through four computational phases that progressively transform raw geospatial data into validated, interpretable outputs.
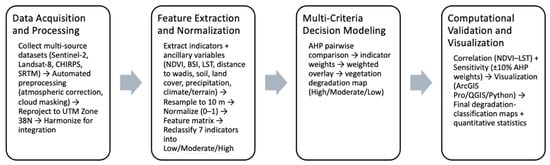
Figure 5.
Computational Sustainability Framework illustrating the four algorithmic phases: (1) Data Acquisition and Processing, (2) Feature Extraction and Normalization, (3) Multi-Criteria Decision Modeling, and (4) Computational Validation and Visualization.
Phase 1: Data Acquisition and Processing
Multi-source environmental datasets were collected and harmonized for integration. Sentinel-2 and Landsat-8 imagery provided optical and thermal data, CHIRPS contributed precipitation records, and SRTM supplied topographic derivatives. Atmospheric correction, cloud masking, and reprojection to UTM Zone 38 N were automated through Google Earth Engine (GEE) and ArcGIS Pro ModelBuilder, ensuring consistency and minimizing manual intervention.
Phase 2: Feature Extraction and Normalization
Indicators (NDVI, BSI, LST) and ancillary variables (distance to wadis, soil, land cover, precipitation, and climate/terrain parameters) were extracted from the processed datasets. All variables were resampled to 10 m and min–max normalized (0–1) to form a standardized feature matrix.
Following normalization, all seven indicators were reclassified into three degradation classes (Low, Moderate, High) to prepare inputs for the multi-criteria decision analysis. The classification scheme reflects commonly used thresholds in arid-land vegetation studies and was informed by NCW expert input. NDVI values < 0.079 were assigned to high degradation, 0.080–0.116 to moderate, and >0.117 to low degradation. BSI values < 0.177 represented low soil exposure, 0.178–0.275 moderate exposure, and >0.276 high exposure. LST thresholds (<45 °C, 45–49 °C, >49 °C) were derived from observed thermal stress levels in arid ecosystems. These standardized reclassification rules produced three categorical raster layers for NDVI, BSI, and LST, along with similarly classified soil, land cover, precipitation, and hydrological variables. All classified layers served as the thematic inputs for the AHP-based weighting in Phase 3.
Phase 3: Multi-Criteria Decision Modeling
The standardized indicators were integrated using the Analytical Hierarchy Process (AHP) to determine the relative contribution of each environmental factor to vegetation degradation. Pairwise comparisons were performed following Saaty’s 1–9 scale, where higher values denote stronger influence on degradation susceptibility. AHP weighting was explicitly configured to represent degradation-risk contribution rather than ecological suitability interpretation, ensuring semantic alignment with degradation-focused classification.
Detailed results of the pairwise comparison matrix and normalized weights are presented in Tables 4 and 5 (Section 3.2).
AHP was performed using judgments from two NCW specialists directly responsible for rangeland and habitat assessment in the study area. Each expert independently completed the pairwise comparison matrix. Their judgments were then aggregated using the arithmetic mean to produce a single composite matrix for the analysis. To ensure the logical coherence of the comparisons, the Consistency Index (CI) and Consistency Ratio (CR) were calculated. The final CR value fell within the acceptable threshold (≤0.10). The AHP consistency was evaluated using the Consistency Index (CI) and Consistency Ratio (CR) as per Salomon and Gomes [43]:
where n is the number of indicators, λmax is the maximum eigenvalue of the pairwise matrix, and RI is the random inconsistency index.
The final indicator weights were computed from the normalized eigenvector of the pairwise comparison matrix. BSI received the highest weight, followed by NDVI and LST, reflecting the experts’ consensus on variable importance based on field observations.
The validated weights were applied in the ArcGIS Pro Weighted Overlay Analysis (WOA) module to generate a composite Vegetation Degradation Classification Map, classifying the study areas into High, Moderate, and Low degradation zones.
Phase 4: Computational Validation and Visualization
Model reliability was assessed through correlation analysis between NDVI and LST and through sensitivity testing by varying AHP weights ±10%. Visualization was performed using ArcGIS Pro 3.6, QGIS 3.28(Chicago, IL, USA), and Python 3.10 (Wilmington, DE, USA) libraries (Matplotlib, GeoPandas). The final deliverables included high-resolution degradation-classification maps and quantitative statistics supporting transparent interpretation and reproducibility.
3. Results
3.1. Key Findings of the Degradation Assessment
A quantitative assessment of indicator contributions revealed clear statistical relationships among the variables. NDVI showed a strong negative correlation with both BSI (r = −0.71) and LST (r = −0.68), indicating that areas with sparse vegetation typically exhibit higher soil exposure and elevated surface temperature. In contrast, BSI demonstrated a positive correlation with LST (r = 0.64), confirming that exposed or degraded soils tend to accumulate more heat. These relationships reinforce the ecological interpretation of the degradation classes, where high-degradation zones correspond to low NDVI values (≤0.079), elevated LST (>49 °C), and high BSI levels (>0.276). The AHP-based indicator weighting revealed that BSI had the highest relative influence on vegetation degradation (33.6%), followed by NDVI (29.1%) and LST (15.9%). This ranking reflects expert assessment of degradation sensitivity in hyper-arid environments, where irreversible soil exposure represents a primary indicator of ecological stress, while vegetation greenness and surface temperature act as complementary but interacting drivers. Overall, the AHP-based weighting results provide a robust decision-oriented justification for the spatial patterns observed in Figure 6 and strengthen the analytical depth of the vegetation degradation assessment.
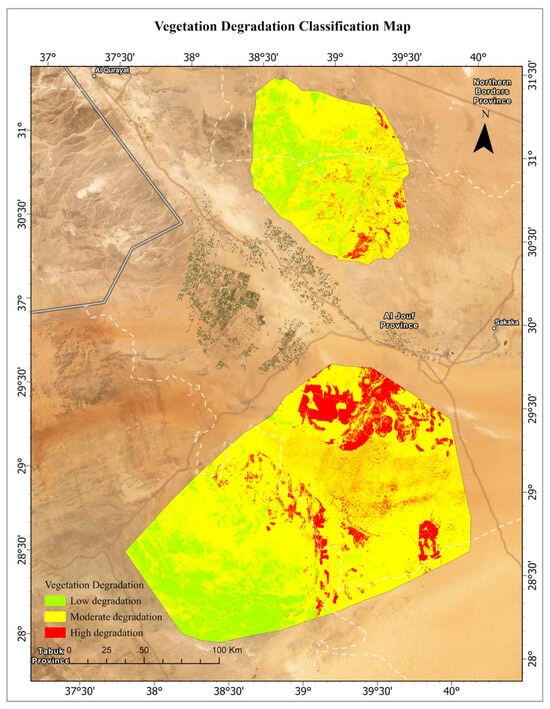
Figure 6.
Vegetation degradation classification map.
The resulting spatial output (Figure 6) shows a clear differentiation among the three vegetation degradation classes. Moderate-degradation zones represent the largest share of the landscape (≈26,707 km2), followed by low-degradation zones (≈6248 km2), while high-degradation zones occupy a relatively small portion of the area (≈390 km2). These spatial patterns reflect the combined influence of vegetation greenness (NDVI), soil exposure (BSI), land surface temperature (LST), and hydrological distance, which jointly determine ecological condition across the protected areas.
Minor discrepancies between the summed class areas and the reported total study area are attributable to raster-based pixel classification, boundary effects, and numerical rounding during area calculation. These differences remain within an acceptable margin (<2%) and do not affect the overall spatial interpretation of degradation patterns.
Correlation analysis revealed a strong inverse relationship between NDVI and LST (r = −0.68), alongside a similarly negative association between NDVI and BSI, confirming that surface-temperature stress and soil exposure are principal drivers of vegetation loss.
3.2. Spatial and Analytical Results
The outputs generated by the Computational Sustainability Framework, encompassing data preprocessing, feature extraction, normalization, and decision modeling, produced a coherent suite of spatial layers and analytical maps that describe vegetation degradation and desertification dynamics across Al-Khunfah and Harrat al-Harrah Protected Areas.
Each of the seven environmental indicators, BSI, NDVI, LST, soil type, land cover, precipitation, and distance to wadis, was converted into a thematic raster standardized to a 10 m working grid and classified into three degradation levels: Low, Moderate, and High.
Spectral Indicators
The Bare Soil Index (BSI) (Figure 7a) was derived from Sentinel-2 imagery using the short-wave infrared (SWIR), red, blue, and near-infrared (NIR) bands, following Equation (3) [44]:
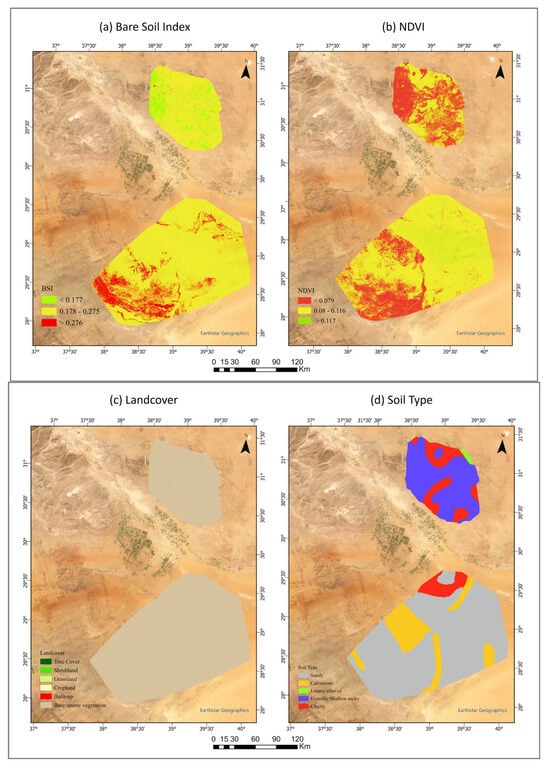
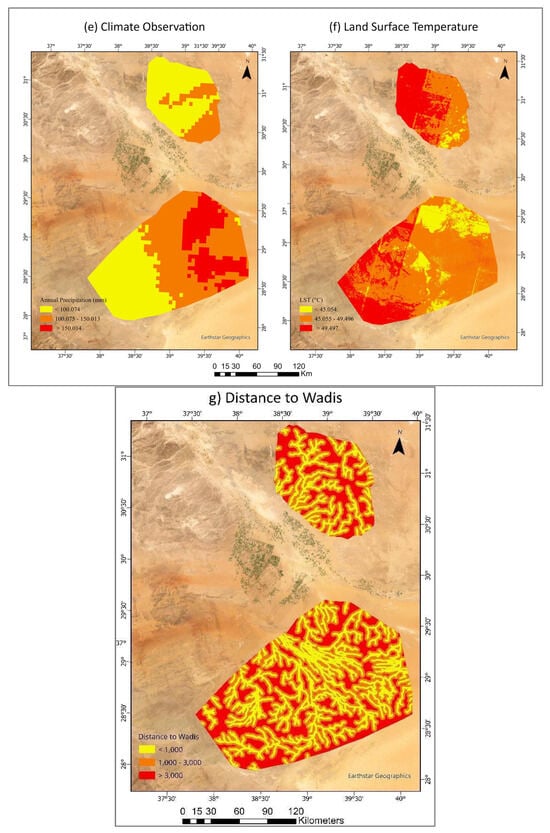
Figure 7.
Thematic layers representing (a) Bare Soil Index (BSI) and (b) Normalized Difference Vegetation Index (NDVI) for Al-Khunfah and Harrat al-Harrah Protected Areas. Higher BSI values (red zones) indicate exposed soil and degraded surfaces, while higher NDVI values (green zones) represent healthy vegetation cover. The southern region of Harrat al-Harrah exhibits high BSI and low NDVI, confirming severe degradation patterns. (c) Landcover; (d) Soil Type. (e) Annual precipitation (mm) derived from CHIRPS v2.0. (f) Land Surface Temperature (°C) derived from Landsat-8 OLI/TIRS. (g) Distance to wadis.
Values ranged from −1 to +1, with higher BSI indicating bare, highly reflective soil and degraded surfaces. Low BSI (<0.177) represented stable vegetated zones; 0.178–0.275 indicated moderately exposed surfaces; and >0.276 denoted severe degradation. Extensive high-BSI zones in southern Harrat al-Harrah confirm active desertification and soil exposure.
The Normalized Difference Vegetation Index (NDVI) (Figure 7b) was computed from the Sentinel-2 near-infrared (NIR) and red bands using Equation (4) [44]:
NDVI values below 0.079 represent high degradation, values between 0.080 and 0.116 represent moderate degradation, and values above 0.117 correspond to low degradation.
Spatial comparison of NDVI and BSI layers revealed a strong inverse pattern; low NDVI zones overlap with high BSI surfaces, highlighting the complementary sensitivity of both indices to vegetation stress and soil exposure.
The indicator layers capture complementary stress dimensions (vegetation greenness, soil exposure, thermal stress, and hydrological context) that jointly shape the mapped degradation patterns. This integration helps explain why the same landforms can exhibit different degradation classes across the two reserves.
In northern Al-Khunfah, small patches of high NDVI reflect localized moisture accumulation along wadis and depressions.
In the western part of Harrat al-Harrah, the co-occurrence of low NDVI and low BSI does not indicate the absence of vegetation and bare soil simultaneously but instead reflects the spectral behavior of volcanic basalt flows that dominate this region. These dark basaltic surfaces have inherently low reflectance across visible and shortwave infrared wavelengths, producing low index responses independent of vegetation presence. Therefore, the low NDVI–low BSI combination is a spectral property of the underlying lithology rather than a degradation signal.
Land-Cover, Soil, and Climate Factors
The land-cover map (Figure 7c), derived from ESA CCI, indicates that the study areas are predominantly characterized by bare/sparse vegetation, with extensive zones of sandy and rocky surfaces. Shrubland occupies a secondary proportion of the landscape, mainly distributed along the northern and central sectors. Other land cover types (such as grassland, cropland, or built-up areas) appear minimally or are absent within the reserve boundaries. This reflects the hyper-arid nature of the region and the limited vegetation structure typical of desert ecosystems.
The soil map (Figure 7d) illustrates a heterogeneous distribution of sandy, calcareous, loamy, gravelly, and clayey soils. Sandy and calcareous soils, dominant in southern Harrat al-Harrah, are highly permeable and nutrient-poor, making them prone to erosion and vegetation loss. Loamy and alluvial soils near wadis exhibit higher fertility and support temporary vegetation growth following rainfall events.
Annual precipitation patterns (Figure 7e), computed from the 2010–2023 CHIRPS v2.0 climatology, reveal higher rainfall concentrated along the elevated northern slopes of the Al-Khunfah Protected Area. These patterns reflect orographic influences, where cooler highlands intercept moist air and enhance precipitation, whereas the southern plains remain markedly drier.
Land Surface Temperature (Figure 7f), derived from Landsat-8 OLI/TIRS (January–April 2023), shows distinct thermal gradients across the study area. Higher LST values correspond to exposed surfaces and degraded vegetation, indicating intensified thermal stress and an increased susceptibility to vegetation desiccation.
Hydrological Indicator
The Distance-to-Wadis layer (Figure 7g) was derived via Euclidean distance analysis in ArcGIS Pro, measuring each pixel’s proximity to the nearest ephemeral channel. Proximity to wadis correlates positively with vegetation health, as these drainage systems facilitate soil moisture recharge and reduce degradation risk.
AHP-Based Decision Modeling
The AHP-based weighting produced the pairwise comparison matrix shown in Table 4 and the corresponding normalized weights in Table 5. BSI received the highest weight (33.6%), followed by NDVI (29.1%) and LST (15.9%), while soil type, distance to wadis, climate, and land cover contributed lower weights (7.3%, 6.7%, 5.2%, and 2.2%, respectively). The Consistency Ratio (CR = 0.0957) was below 0.10, indicating that the expert judgments were logically consistent.
Table 4.
Pairwise comparison matrix.
Table 4.
Pairwise comparison matrix.
| Criteria | NDVI | BSI | LST | Soil Type | Distance to Wadis | Climate Observation | Landcover |
|---|---|---|---|---|---|---|---|
| NDVI | 1 | 1 | 3 | 6 | 5 | 4 | 8 |
| BSI | 1 | 1 | 5 | 7 | 4 | 5 | 7 |
| LST | 0.33 | 0.20 | 1 | 4 | 5 | 3 | 6 |
| Soil Type | 0.17 | 0.14 | 0.25 | 1 | 1 | 3 | 6 |
| Distance to Wadis | 0.20 | 0.25 | 0.20 | 1 | 1 | 1 | 7 |
| Climate Observation | 0.25 | 0.20 | 0.33 | 0.33 | 1 | 1 | 3 |
| Landcover | 0.13 | 0.14 | 0.17 | 0.17 | 0.14 | 0.33 | 1 |
Table 5.
Analytical Hierarchy Process (AHP) ranking, weighting, and sub-criteria for vegetation degradation assessment.
Table 5.
Analytical Hierarchy Process (AHP) ranking, weighting, and sub-criteria for vegetation degradation assessment.
| Criteria | Weight (%) | Rank | Sub-Criterion | Score |
|---|---|---|---|---|
| BSI (value) | 33.6 | 1 | <0.177 | 3 |
| 0.178–0.275 | 2 | |||
| >0.276 | 1 | |||
| NDVI (value) | 29.1 | 2 | <0.079 | 1 |
| 0.08–0.116 | 2 | |||
| >0.117 | 3 | |||
| LST () | 15.9 | 3 | <45 | 3 |
| 45–49 | 2 | |||
| >49 | 1 | |||
| Soil Type (Class) | 7.3 | 4 | Sandy | 1 |
| Calcareous | 3 | |||
| Loamy/alluvial | 3 | |||
| Gravelly/Shallow rocky | 1 | |||
| Clayey | 2 | |||
| Distance to Wadis (meter) | 6.7 | 5 | <1000 | 3 |
| 1000–3000 | 2 | |||
| >3000 | 1 | |||
| Climate Observation (mm) | 5.2 | 6 | <100 | 1 |
| 100–150 | 2 | |||
| >150 | 3 | |||
| Landcover (class) | 2.2 | 7 | Tree Cover | 3 |
| Shrubland | 3 | |||
| Grassland | 2 | |||
| Cropland | 2 | |||
| Built-Up | 1 | |||
| Bare/sparse vegetation | 1 |
Composite Vegetation Degradation Mapping
The AHP-derived indicator weights (Table 4) show that BSI, NDVI, and LST are the dominant predictors of vegetation degradation, contributing 33.6%, 29.1%, and 15.9%, respectively. Soil type, distance to wadis, climate, and land cover contributed 7.3%, 6.7%, 5.2%, and 2.2%. The Consistency Ratio (CR = 0.0957) remains below the 0.10 threshold, indicating coherent expert judgments.
The weighted layers produced a composite Vegetation Degradation Classification Map (Figure 4). The final classification identifies three degradation levels across the study region. Low-degradation zones occur mainly in northeastern Al-Khunfah and central-north Harrat al-Harrah, where denser vegetation and proximity to wadis coincide with healthier surface conditions. Moderate-degradation zones dominate the intermediate terrain with mixed soil types and partial vegetation cover. High-degradation zones are concentrated in southern Harrat al-Harrah and western Al-Khunfah, characterized by low NDVI, high BSI and LST values, and greater distances from wadis.
Proportional distribution of vegetation degradation classes (Figure 8) shows that moderate-degradation zones represent the largest proportion of the landscape, covering approximately 26,707 km2. Low-degradation zones extend across about 6248 km2, while high-degradation zones occupy roughly 390 km2. This distribution confirms that most of the protected landscape is characterized by transitional ecological conditions, with limited areas exhibiting severe degradation.
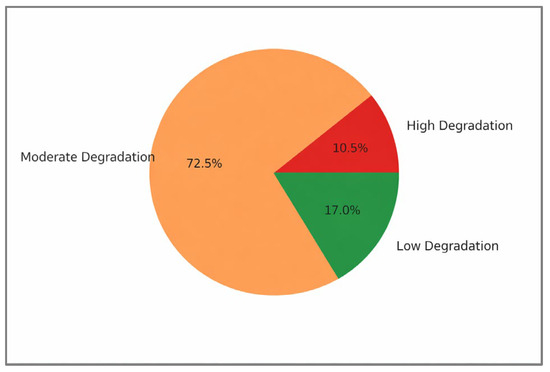
Figure 8.
Proportional distribution of vegetation degradation classes.
To provide a practical indication of the model’s reliability, a qualitative validation was performed using high-resolution Google Earth satellite imagery and visual comparison with known ground conditions reported by the Saudi National Center for Vegetation Cover. For this cross-check, 100 locations (approximately 33 per degradation class: Low, Moderate, and High) were selected using a stratified random sampling approach to ensure balanced representation across classes. Each point was visually inspected by two independent GIS analysts experienced in arid-land interpretation, using Sentinel-2 composites, Google Earth historical imagery, and Landsat archives as reference sources. Visual agreement between the model output and reference imagery was recorded as either ‘match’ or ‘mismatch’. The inspection results showed 91/100 matches (91%), indicating strong spatial coherence between predicted degradation classes and observed ground conditions. Figure 9 provides an illustrative example comparing modelled degradation classes with corresponding high-resolution imagery, demonstrating clear agreement in high-degradation zones.
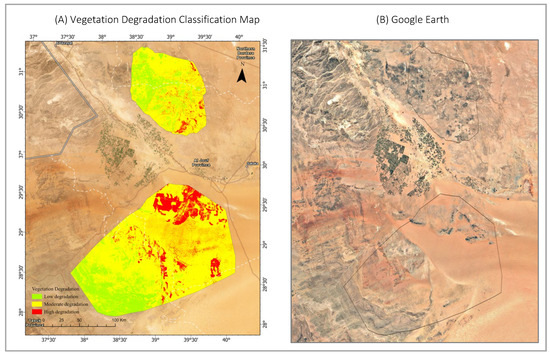
Figure 9.
Qualitative validation of degradation classes. (A) Modelled vegetation-degradation classification. (B) Corresponding high-resolution Google Earth imagery confirming the presence of barren and degraded surfaces in High-Degradation zones.
High-degradation zones consistently matched bare, eroded, or sparsely vegetated surfaces in the reference imagery, whereas low-degradation areas corresponded to greener and healthier vegetation cover. Although not a full accuracy assessment, this qualitative cross-checking supports the consistency of the spatial patterns identified by the model.
Overall, the findings show that vegetation degradation is primarily associated with the interaction between surface temperature, soil exposure, and hydrological distance. The integrated multi-source data provide a coherent and interpretable characterization of arid-land degradation patterns, supporting decision-making for ecological management under Saudi Arabia’s Vision 2030 environmental sustainability agenda.
4. Discussion
The results confirm that the Computational Sustainability Framework provides a consistent and scalable approach for integrating environmental indicators into an interpretable decision model. By combining optical, thermal, topographic, and climatic data within a reproducible computational workflow, the framework successfully captured the spatial variability of vegetation degradation across two large arid reserves. Its modular design enabled efficient data acquisition, feature extraction, and analytical modeling with minimal human intervention, an essential step toward automation in sustainability-oriented computing.
The observed inverse relationship between NDVI and LST (r = −0.68) suggests that thermal stress a key interacting factor in vegetation decline in arid Saudi ecosystems. This finding aligns with global patterns observed in desert and semi-arid landscapes, where rising land surface temperatures accelerate evapotranspiration and inhibit vegetation recovery. In parallel, elevated soil exposure, reflected by high BSI values, further contributes to vegetation degradation and was assigned the highest weight in the AHP results. The contrast between northern Al-Khunfah and southern Harrat al-Harrah highlights the role of local hydrology and soil composition in mediating resilience. Areas near wadis, where moisture retention is higher, showed improved vegetation stability and lower degradation risk, supporting the model’s inclusion of hydrological distance as a key criterion.
From a computational standpoint, this study provides an example of how multi-criteria decision analysis (MCDA) can be enhanced by integrating geospatial automation tools such as Google Earth Engine (GEE) and ArcGIS Pro ModelBuilder. The use of AHP provided a transparent weighting mechanism that translates expert knowledge into quantifiable parameters while maintaining consistency through the calculation of the Consistency Ratio (CR ≤ 0.10). This transparency supports reproducibility, allowing the framework to be easily adapted for different regions or environmental targets with minimal parameter adjustments when comparable indicators and class thresholds are available.
The framework’s outputs have direct implications for sustainable land management under Saudi Arabia’s Vision 2030 environmental goals. The degradation-classification maps serve as a decision-support tool for identifying priority zones for ecological restoration. Low-degradation zones represent ecologically stable areas with minimal restoration needs, whereas moderate-degradation zones present the most practical and cost-effective restoration opportunities. High-degradation zones indicate severe ecological stress but may require long-term or intensive rehabilitation interventions.
These outputs directly support national targets related to biodiversity conservation, protected-area management, restoration planning, and climate adaptation. National initiatives and agency plans emphasize land restoration, rangeland rehabilitation, and strengthened protected-area management, including in northern reserves. The framework also provides an evidence-based mechanism for government agencies, including the National Center for Wildlife and the National Center for Vegetation Cover, to prioritize interventions, allocate restoration resources, and monitor progress in a data-driven manner. Within this policy context, Al-Khunfah and Harrat al-Harrah are designated primarily for wildlife protection (e.g., Arabian oryx, sand and mountain gazelles, and raptors), habitat restoration, and soil-erosion reduction, with recent NCW plans introducing controlled ecotourism components and expanded monitoring obligations.
While the evaluations conducted in this case study suggest strong internal consistency and visual agreement with reference imagery for the proposed model, some limitations remain. The temporal scope of the data, restricted to a single seasonal window, does not capture interannual variability in vegetation behavior. The January–April period was selected because it represents the peak vegetation response in arid Saudi ecosystems, when spectral indices are most sensitive to vegetation changes and less affected by summer thermal saturation or winter dormancy. This timing also reduces atmospheric noise and increases index separability, improving classification accuracy for arid-land monitoring. Expert-based weighting in the AHP contributes a degree of subjectivity that could be reduced through additional expert panels, sensitivity analysis, or data-driven calibration. Future work should extend the framework toward multi-season and multi-year time-series analyses, as well as annual trend modeling using Landsat and Sentinel archives, to evaluate degradation trajectories rather than conditions from a single period.
Regional Transferability, Constraints, and Adaptation Recommendations
The transferability of the proposed framework to other arid and semi-arid regions is feasible due to its modular, data-driven structure and reliance on freely accessible satellite datasets. However, several factors may influence cross-regional performance. Variability in ecological conditions, such as soil composition, vegetation phenology, and local climate regimes, may require recalibration of indicator thresholds or adjustment of AHP weighting schemes. In regions where field data are limited or heterogeneous, validation procedures may also need adaptation through alternative sources such as high-resolution imagery or citizen-science observations.
Despite these challenges, the framework offers clear advantages for regional adoption. Its automated preprocessing workflow, reproducible weighting strategy, and transparent classification logic allow environmental agencies to integrate additional indicators, scale the assessment to larger extents, or update the analysis as new imagery becomes available. To support successful implementation, we recommend: (i) recalibrating model inputs using region-specific ecological datasets, (ii) incorporating local stakeholder knowledge into the AHP weighting process, and (iii) validating degradation outputs using multi-year or multi-season imagery to enhance temporal robustness. These considerations strengthen the framework’s adaptability and facilitate its application across diverse dryland landscapes.
Overall, the study advances the role of computational frameworks in environmental sustainability by establishing a transparent, reproducible, and scalable workflow. It illustrates how algorithmic modeling can extend beyond environmental monitoring and inform adaptive ecosystem management in arid regions.
5. Limitations
One limitation of this study is the use of the FAO soil dataset, which is static and does not capture temporal variability in soil salinity. Because salinization is a dynamic process influenced by climate variability, groundwater extraction, and land-use pressures, the lack of multi-temporal soil data constrains the ability to assess long-term salinity-driven degradation trends. Another limitation concerns the CHIRPS precipitation dataset. Although CHIRPS provides long-term, quasi-global rainfall estimates, its accuracy decreases in hyper-arid regions due to sparse ground-gauge networks and reliance on satellite-based retrievals. This may introduce uncertainty in representing localized rainfall variability across the study area. These limitations have been documented in previous evaluations of CHIRPS performance in dryland environments [39,45,46].
The ESA CCI Landcover dataset provides generalized classes at 300 m resolution, which may obscure fine-scale vegetation mosaics and overgeneralize shrub–grass transitions. As a result, the landcover distribution in Figure 6 should be interpreted as broad patterns rather than fine-scale vegetation structure.
Thresholds applied for NDVI, BSI, and LST represent generalized arid-land ecological conditions and may not fully capture species-level variations or micro-habitat processes. Local vegetation assemblages in northern Saudi Arabia differ from those in other drylands where some of the thresholds were originally developed. Future work should incorporate site-specific field calibration and locally validated thresholds.
6. Conclusions
This study suggests that the proposed Computational Sustainability Framework, built upon GIS-based multi-criteria decision analysis (MCDA) and the Analytical Hierarchy Process (AHP), could offer a systematic and reproducible approach for assessing vegetation degradation and desertification risk in arid environments. By integrating multi-source satellite data, including spectral indices (NDVI, BSI, LST) and environmental parameters such as soil type, land cover, precipitation, and hydrological proximity, the framework provides a holistic spatial evaluation of vegetation degradation levels across Al-Khunfah and Harrat al-Harrah Protected Areas.
The resulting degradation classification map reveals that most of the landscape falls under moderate degradation, representing transitional zones where vegetation remains partially degraded but retains ecological potential. Low-degradation zones, mainly concentrated in the northern and central parts of the reserves, indicate stable vegetation and favorable soil–moisture interactions and therefore require ecological protection and monitoring rather than active restoration. In contrast, high-degradation zones, primarily in southern Harrat al-Harrah, reflect severe degradation conditions associated with high surface temperatures and extensive soil exposure, indicating priority areas for long-term or intensive restoration planning.
Overall, the findings confirm that integrating geospatial analytics with computational modeling provides a scalable, transparent, and data-driven method for identifying and prioritizing restoration areas in arid ecosystems. The framework supports sustainable land management but also supports national environmental initiatives under Saudi Arabia’s Vision 2030, particularly those related to rangeland protection, biodiversity enhancement, and ecosystem resilience. Future extensions of this framework could incorporate temporal monitoring and explore data-driven or ensemble weighting to complement expert-based AHP, enabling assessment of degradation trajectories and supporting adaptive restoration strategies at broader spatial scales.
Author Contributions
Conceptualization, M.A. and O.A.; methodology, A.A., M.A. and O.A.; software, A.A.; validation, A.A., M.A. and O.A.; formal analysis, A.A.; investigation, A.A., M.A. and O.A.; resources, M.A. and O.A.; data curation, A.A.; writing—original draft preparation, A.A., M.A. and O.A.; writing—review and editing, A.A., M.A. and O.A.; visualization, A.A. and M.A.; supervision, M.A. and O.A.; project administration, M.A. and O.A.; funding acquisition, A.A. All authors have read and agreed to the published version of the manuscript.
Funding
This research received financial support from Ongoing Research Funding Program, (ORFFT-2025-152-1), King Saud University, Riyadh, Saudi Arabia.
Institutional Review Board Statement
Not applicable.
Informed Consent Statement
Not applicable.
Data Availability Statement
The original contributions presented in this study are included in the article. Further inquiries can be directed to the corresponding author.
Acknowledgments
The authors would like to thank Ongoing Research Funding Program, (ORFFT-2025-152-1), King Saud University, Riyadh, Saudi Arabia for financial support.
Conflicts of Interest
The authors declare no conflicts of interest.
References
- Gomes, C.; Dietterich, T.; Barrett, C.; Conrad, J.; Dilkina, B.; Ermon, S.; Fang, F.; Farnsworth, A.; Fern, A.; Fern, X.; et al. Computational sustainability: Computing for a better world and a sustainable future. Commun. ACM 2019, 62, 56–65. [Google Scholar] [CrossRef]
- Ahakwa, I. Towards land degradation neutrality: Does green energy and green human capital matter? Renew. Sustain. Energy Rev. 2024, 197, 114396. [Google Scholar] [CrossRef]
- Piao, J.; Chen, W.; Kug, J.-S.; Chen, S.; Oh, J.-H.; Wang, L.; Cai, Q. Land aridification persists in vulnerable drylands under climate mitigation scenarios. Commun. Earth Environ. 2025, 6, 732. [Google Scholar] [CrossRef]
- Mirghni, A.A.; Rahman, S.M.; Aziz, M.A. Resilience in arid landscapes: Enhancing disaster risk reduction in desert ecosystems. In Encyclopedia of Disaster Risk Reduction; Shaw, R., Ed.; Springer Nature: Singapore, 2025; pp. 1–6. ISBN 978-981-9745-47-0. [Google Scholar]
- Mirzabaev, A.; Stringer, L.C.; Benjaminsen, T.A.; Gonzalez, P.; Harris, R.; Jafari, M.; Stevens, N.; Tirado, C.M.; Zakieldeen, S. Climate Change 2022—Impacts, Adaptation and Vulnerability: Working Group II Contribution to the Sixth Assessment Report of the Intergovernmental Panel on Climate Change, 1st ed.; Cambridge University Press: Cambridge, UK, 2023; ISBN 978-1-00-932584-4. [Google Scholar]
- Quoreshi, A.M.; Madouh, T.A. Kuwait deserts and ecosystems in the context of changing climate. In Terrestrial Environment and Ecosystems of Kuwait; Suleiman, M.K., Shahid, S.A., Eds.; Springer Nature: Cham, Switzerland, 2023; pp. 341–359. ISBN 978-3-031-46261-0. [Google Scholar]
- Sayed, O.H.; Masrahi, Y.S. Climatology and phytogeography of saudi arabia: A review. Arid Land Res. Manag. 2023, 37, 311–368. [Google Scholar] [CrossRef]
- Ministry of Environment, Water and Agriculture. Annual Report 2023; Report No. 1030; Government of Saudi Arabia: Riyadh, Saudi Arabia, 2023.
- National Center for Wildlife. Annual Report 2022; National Center for Wildlife: Riyadh, Saudi Arabia, 2022.
- Harrison, D.L. The Large mammals in Arabia. Oryx 1968, 9, 357–363. [Google Scholar] [CrossRef]
- Child, G.; Grainger, J.D. A System Plan for Protected Areas for Wildlife Conservation and Sustainable Rural Development in Saudi Arabia; National Commission for Wildlife Conservation and Development: Riyadh, Saudi Arabia, 1990. [Google Scholar]
- National Center for Vegetation Cover and Combating Desertification. Protected Areas Monitoring and Assessment Reports; National Center for Vegetation Cover and Combating Desertification: Riyadh, Saudi Arabia, 2024.
- Al-Rowaily, S.R.; Assaeed, A.M.; Al-Khateeb, S.A.; Al-Qarawi, A.A.; Al Arifi, F.S. Vegetation and condition of arid rangeland ecosystem in central Saudi Arabia. Saudi J. Biol. Sci. 2018, 25, 1022–1026. [Google Scholar] [CrossRef]
- National Center for Wildlife. National Center for Wildlife (NCW) Annual Report 2023; National Center for Wildlife: Riyadh, Saudi Arabia, 2023.
- Wang, J.; Zhen, J.; Hu, W.; Chen, S.; Lizaga, I.; Zeraatpisheh, M.; Yang, X. Remote sensing of soil degradation: Progress and perspective. Int. Soil Water Conserv. Res. 2023, 11, 429–454. [Google Scholar] [CrossRef]
- Alqasemi, A.S.; Ibrahim, M.; Fadhil Al-Quraishi, A.M.; Saibi, H.; Al-Fugara, A.; Kaplan, G. Detection and modeling of soil salinity variations in arid lands using remote sensing data. Open Geosci. 2021, 13, 443–453. [Google Scholar] [CrossRef]
- Hasan, S.S.; Alharbi, O.A.; Alqurashi, A.F.; Fahil, A.S. Assessment of desertification dynamics in arid coastal areas by integrating remote sensing data and statistical techniques. Sustainability 2024, 16, 4527. [Google Scholar] [CrossRef]
- Yagoub, M.M.; AlSumaiti, T.; Tesfaldet, Y.T.; AlArfati, K.; Alraeesi, M.; Alketbi, M.E. Integration of analytic hierarchy process (ahp) and remote sensing to assess threats to preservation of the oases: Case of Al Ain, UAE. Land 2023, 12, 1269. [Google Scholar] [CrossRef]
- Higginbottom, T.; Symeonakis, E. Assessing land degradation and desertification using vegetation index data: Current frameworks and future directions. Remote Sens. 2014, 6, 9552–9575. [Google Scholar] [CrossRef]
- Zolfaghari, F.; Azarnivand, H.; Khosravi, H.; Zehtabian, G.; Sigaroudi, S.K. Monitoring the severity of degradation and desertification by remote sensing (Case study: Hamoun international wetland). Front. Environ. Sci. 2022, 10, 902687. [Google Scholar] [CrossRef]
- Cen, Y.; He, L.; He, Z.; Luo, F.; Zhao, Y.; Gan, J.; Bai, W.; Chen, X. Improving remote sensing ecological assessment in arid regions: Dual-index framework for capturing heterogeneous environmental dynamics in the tarim basin. Remote Sens. 2025, 17, 3511. [Google Scholar] [CrossRef]
- Forkuor, G.; Dimobe, K.; Serme, I.; Tondoh, J.E. Landsat-8 vs. Sentinel-2: Examining the added value of sentinel-2’s red-edge bands to land-use and land-cover mapping in burkina faso. GIScience Remote Sens. 2018, 55, 331–354. [Google Scholar] [CrossRef]
- Berdyyev, A.; Al-Masnay, Y.A.; Juliev, M.; Abuduwaili, J. Desertification monitoring using machine learning techniques with multiple indicators derived from Sentinel-2 in Turkmenistan. Remote Sens. 2024, 16, 4525. [Google Scholar] [CrossRef]
- Himmy, O.; Nguyen, T.T.; Hemmler, K.S.; Loulad, S.; Rhinane, H.; Buerkert, A. leveraging machine learning and landsat time series for high-resolution mapping of mining-induced vegetation changes in Ouagadougou, Burkina Faso. Environ. Chall. 2024, 17, 101026. [Google Scholar] [CrossRef]
- Malczewski, J. GIS-based multicriteria decision analysis: A survey of the literature. Int. J. Geogr. Inf. Sci. 2006, 20, 703–726. [Google Scholar] [CrossRef]
- Castaneda-Camacho, X. From land degradation to habitat loss: A qualitative assessment of vegetation cover in protected areas of arid lands. In The Changing Geography of National Parks and Protected Areas; Springer: Berlin/Heidelberg, Germany, 2024; pp. 37–61. [Google Scholar]
- Boland, C.R.J.; Burwell, B.O. Modelling habitat quality of high conservation priority vertebrates in an arid ecosystem with limited baseline data. Asian J. Conserv. Biol. 2022, 11, 106–131. [Google Scholar]
- Koldasbayeva, D.; Tregubova, P.; Gasanov, M.; Zaytsev, A.; Petrovskaia, A.; Burnaev, E. Challenges in data-driven geospatial modeling for environmental research and practice. Nat. Commun. 2024, 15, 10700. [Google Scholar] [CrossRef]
- Saaty, T.L. Analytic hierarchy process. In Encyclopedia of Operations Research and Management Science; Springer: Berlin/Heidelberg, Germany, 2013; pp. 52–64. [Google Scholar]
- Moradi, E.; Khosravi, H.; Rahimabadi, P.D.; Choubin, B.; Muchová, Z. Integrated approach to land degradation risk assessment in arid and semi-arid ecosystems: Applying SVM and eDPSIR/ANP Methods. Ecol. Indic. 2024, 169, 112947. [Google Scholar] [CrossRef]
- Chouari, W. Assessment of vegetation cover changes and the contributing factors in the Al-Ahsa Oasis using normalized difference vegetation index (NDVI). Reg. Sustain. 2024, 5, 100111. [Google Scholar] [CrossRef]
- Al-Naggar, A.A.A.; Prantner, Z. The Saudi green initiative: Facts and perspectives. Al-Ensaneyyat Period. 2024, 633–652. [Google Scholar]
- Alshehri, M.; Alharbi, O. Understanding the landscape of leveraging iot for sustainable growth in saudi arabia. arXiv 2024, arXiv:2407.04273. [Google Scholar] [CrossRef]
- Olson, D.M.; Dinerstein, E.; Wikramanayake, E.D.; Burgess, N.D.; Powell, G.V.N.; Underwood, E.C.; D’amico, J.A.; Itoua, I.; Strand, H.E.; Morrison, J.C.; et al. Terrestrial Ecoregions of the World: A New Map of Life on Earth. BioScience 2001, 51, 933. [Google Scholar] [CrossRef]
- Athar, H. Seasonal variability of the observed and the projected daily temperatures in northern Saudi Arabia. Clim. Change 2013, 119, 333–344. [Google Scholar] [CrossRef]
- As-Shamari, S.A. Rainfall and rainy days trends in context of climate change over Saudi Arabia: A case study of Ha’il region. Eng. Herit. J. 2024, 8, 13–25. [Google Scholar] [CrossRef]
- El-Sheikh, M.A.; Al-Shehri, M.A.; Alfarhan, A.H.; Alatar, A.A.; Rajakrishnan, R.; Al-Rowaily, S.L. Threatened prunus arabica in an ancient volcanic protected area of Saudi Arabia: Floristic diversity and plant associations. Saudi J. Biol. Sci. 2019, 26, 325–333. [Google Scholar] [CrossRef]
- tsammalex.clld.org Arabian Desert and East Sahero-Arabian Xeric Shrublands. Available online: https://tsammalex.clld.org/ecoregions/PA1303 (accessed on 15 October 2025).
- Funk, C.; Peterson, P.; Landsfeld, M.; Pedreros, D.; Verdin, J.; Shukla, S.; Husak, G.; Rowland, J.; Harrison, L.; Hoell, A.; et al. The climate hazards infrared precipitation with stations—A new environmental record for monitoring extremes. Sci. Data 2015, 2, 150066. [Google Scholar] [CrossRef]
- Xue, J.; Su, B. Significant remote sensing vegetation indices: A review of developments and applications. J. Sens. 2017, 2017, 1353691. [Google Scholar] [CrossRef]
- Bai, Z.G.; Dent, D.L.; Olsson, L.; Schaepman, M.E. Global Assessment of land Degradation and Improvement 1. Identification by remote Sensing; Report 2008/01, GLADA Report No. 5; ISRIC—World Soil Information: Wageningen, The Netherlands, 2008; Available online: https://files.isric.org/public/documents/isric_report_2008_01.pdf (accessed on 15 October 2025).
- Zhou, D.; Zhao, S.; Liu, S.; Zhang, L.; Zhu, C. Surface urban heat island in china’s 32 major cities: Spatial patterns and drivers. Remote Sens. Environ. 2014, 152, 51–61. [Google Scholar] [CrossRef]
- Salomon, V.A.P.; Gomes, L.F.A.M. Consistency improvement in the analytic hierarchy Process. Mathematics 2024, 12, 828. [Google Scholar] [CrossRef]
- Valentini, E.; Sapio, S.; Schiavon, E.; Righini, M.; Monteleone, B.; Taramelli, A. Development of a pre-automatized processing chain for agricultural monitoring using a multi-sensor and multi-temporal approach. Land 2024, 13, 91. [Google Scholar] [CrossRef]
- Helmi, A.M.; Abdelhamed, M.S. Evaluation of CMORPH, PERSIANN-CDR, CHIRPS V2.0, TMPA 3B42 V7, and GPM IMERG V6 satellite precipitation datasets in arabian arid regions. Water 2022, 15, 92. [Google Scholar] [CrossRef]
- Du, H.; Tan, M.L.; Zhang, F.; Chun, K.P.; Li, L.; Kabir, M.H. Evaluating the effectiveness of chirps data for hydroclimatic studies. Theor. Appl. Clim. 2024, 155, 1519–1539. [Google Scholar] [CrossRef]


Disclaimer/Publisher’s Note: The statements, opinions and data contained in all publications are solely those of the individual author(s) and contributor(s) and not of MDPI and/or the editor(s). MDPI and/or the editor(s) disclaim responsibility for any injury to people or property resulting from any ideas, methods, instructions or products referred to in the content. |
© 2026 by the authors. Licensee MDPI, Basel, Switzerland. This article is an open access article distributed under the terms and conditions of the Creative Commons Attribution (CC BY) license.