Article

Optimizing Forest Ecosystem Service Compensation Using Spillover Analysis: Evidence from Linyi’s Indicator Trading Policy, China


1
School of Environmental Science and Engineering, Shandong University, Qingdao 266237, China
2
Humanities Laboratory for the Theory and Mechanism Research on the Value Realizing of the Yellow River Ecosystem Products, Shandong University, Qingdao 266237, China
3
Modelling, Evidence and Policy Research Group, School of Natural and Environmental Sciences, Newcastle University, Newcastle upon Tyne NE1 7RU, UK
4
Institute of Humanities and Arts, Shandong University, Qingdao 266237, China
5
College of Geography and Remote Sensing, Hohai University, Nanjing 211000, China
6
Shandong Academy of Environmental Sciences Co., Ltd., Jinan 250013, China
*
Author to whom correspondence should be addressed.
Sustainability 2026, 18(2), 643; https://doi.org/10.3390/su18020643
Submission received: 25 November 2025 / Revised: 2 January 2026 / Accepted: 6 January 2026 / Published: 8 January 2026
(This article belongs to the Section Bioeconomy of Sustainability)

Abstract

Ecological compensation is an important policy tool for coordinating ecological protection and economic development and narrowing regional disparities. In China, Linyi, for the first time, applied a cap-and-trade policy to the forestry sector by implementing the Intergovernmental Forest Ecological Indicator Trading Policy (IFEITP)—a new ecological compensation policy—to increase the city’s overall forest coverage. However, the compensation standard for this policy was formulated solely by referring to provincial afforestation subsidy standards, resulting in excessively low indicator trading prices and making the policy difficult to sustain. This paper proposes a technical framework for ecological compensation based on the ecosystem service spillover value (ESSV), aiming to optimize the IFEITP. The results revealed that during the policy implementation period, Linyi’s total ecosystem service value (ESV) increased, and the proportion of ESV provided by forests in each district and county also increased. Under the new framework, there were minor changes in the ecosystem service supply zones and payment zones. The compensation received by supply zones increased by 116.2%, whereas the payments made by payment zones accounted for less than 0.2% of local fiscal revenue. The newly calculated indicator trading price under this framework not only reflects the value of ecosystem services but also remains within the acceptable range of government finances, demonstrating high operability and providing a basis for optimizing the IFEITP. This study offers broader insights for regions with similar ecological and socioeconomic conditions, enabling the application of analogous ecological compensation policies to maintain environmental justice and promote sustainable development.

1. Introduction

Rapid economic development has led to severe global ecological crises, such as climate change, biodiversity loss, land degradation, and resource depletion, while exacerbating regional development imbalances and resource conflicts. Payment for Ecosystem Services (PES), as a crucial policy tool for coordinating ecological conservation and economic development [1,2,3], addresses environmental externalities by integrating governmental and market-based approaches, effectively incentivizing various sectors of society to jointly protect the ecological environment [4]. The international community has implemented numerous PES programs, including Costa Rica’s Pago por Servicios Ambientales (PSA) program [5,6], the European Union’s Agri-Environmental Programs (AEPs) [7], the Wetland Mitigation Banking system in the United States, and the United Nations’ Reducing Emissions from Deforestation and Degradation (REDD+) framework [8], among others. These mechanisms aim to promote ecological conservation through economic incentives.
Influenced by the international PES concept, China has implemented a series of eco-compensation policies to address the conflict between ecological conservation and economic development, thereby promoting the harmonious coexistence of humans and nature. Forests, as a vital component of terrestrial ecosystems, play a key role in providing diverse ecosystem services (ESs), safeguarding ecological security, and enhancing the quality of habitats and human living environments [9]. Consequently, forests have become a key focus area for implementing eco-compensation policies in China, as exemplified by initiatives such as the Grain for Green Program, the Natural Forest Protection Program, and the Forest Ecological Benefit Compensation System. However, China’s forest eco-compensation approach relies primarily on vertical fiscal transfers led by the central government, with limited funding sources. This not only increases the financial burden on the central government but also fails to balance regional development disparities, thereby constraining the sustainability and effectiveness of eco-compensation efforts [10,11]. To address the aforementioned challenges and promote forest growth, Linyi City, China, pioneered the implementation of an innovative horizontal forest eco-compensation policy in 2018, namely the Intergovernmental Forest Ecological Indicator Trading Policy (IFEITP). Research has indicated that implementing the IFEITP in Linyi effectively increased forest coverage and the supply of ecosystem services [12,13]. However, when the compensation standard is set, this policy considers only the vertical subsidy criteria from the central government, neglecting the ecological benefits provided by the ecosystem. This resulted in an excessively low eco-compensation standard, hindering the mobilization of cross-county afforestation efforts and ultimately leading to the discontinuation of the policy in 2022.
Establishing a practical and enduring eco-compensation mechanism is highly challenging [14]. Setting a reasonable compensation standard is key to building such a mechanism. Previous research has primarily determined compensation standards using methods such as willingness surveys, opportunity-cost accounting, and ecosystem service valuation [15,16,17]. These methods provide a foundation for calculating eco-compensation standards, yet they have certain limitations. Willingness surveys are significantly influenced by stakeholders’ subjective biases [18] and fail to reflect the benefits derived from ecosystem services [19]. The opportunity cost method typically sets compensation standards based on the direct costs of ecological protection or the economic costs of forgone development. Still, this approach often underestimates the actual ecological benefits [20]. The ecosystem service value assessment method can reflect the benefits that the public gains from ecosystems [21] and serves as a basis for eco-compensation decision-making [22]. However, ecosystem service value assessment is directly used, as the compensation standard often exceeds local payment capacities [23]. Many studies have indicated that ecosystem services exhibit significant spatial spillover effects. Areas rich in ecological resources provide ecosystem services to resource-scarce regions. Establishing compensation standards based on the flow of ecosystem services can promote coordinated regional development and better uphold environmental equity and justice [15,24]. Therefore, identifying the supply and beneficiary areas of ecosystem services and formulating compensation standards based on these spillover effects have become urgent issues.
Linyi’s IFEITP is an innovative PES mechanism with significant potential for broader application. However, the policy only considers afforestation costs when setting transaction prices, neglecting the ecosystem service value (ESV) and its spillover effects, resulting in insufficient ecological compensation and hindering further policy implementation. To address these challenges, this study aims to achieve the following objectives: (1) conduct a theoretical analysis of the innovative mechanism of Linyi’s IFEITP; (2) identify the ecosystem service supply and payment zones based on the spillover effect of ESV across Linyi’s districts and counties; (3) construct an ecological compensation model to optimize the transaction price of Linyi’s IFEITP; and (4) propose optimization suggestions for Linyi’s IFEITP based on the compensation framework developed in this study, thereby providing a reference for the nationwide promotion of forest ecological indicator trading mechanisms.

2. Mechanism of Linyi’s IFEITP

Internationally, PES programs are divided into three types: government-financed PES, user-financed PES, and compliant PES [25]. Government-financed PES refers to a reliance solely on government subsidies to address positive environmental externalities, whereas user-financed PES means that private entities fully correct externalities through market transactions. Compliant PES refers to a model in which governments promulgate relevant environmental regulations and standards to create a scarcity of ESs or increase market demand, thereby facilitating market transactions in compliance credits between suppliers and beneficiaries. Compliant PES mechanisms, noted for their high transparency and operational efficiency [1], are widely employed to regulate energy consumption, reduce pollutant emissions, mitigate climate change, and sustain ecosystem services. During the afforestation process, Linyi, Shandong Province, faced systemic challenges, including slow progress, inadequate ecological investment, and low motivation. In response, the Linyi municipal government drew on experience with carbon emission trading and pollution discharge rights trading. By applying the cap-and-trade policy to the forestry sector, the IFEITP, a novel, compliant PES market mechanism, was proposed.
In the previous compliant PES models, the trading subjects were all private groups, such as individuals or enterprises, and the government’s main roles included establishing a regulated market and supervising trading. Unlike past user-regulated PES, Linyi’s IFEITP treats the government as the trading subject. In terms of policy, governments at different levels play different roles. The municipal government is responsible for establishing a regulated trading market, overseeing the status of forest resources in each county, and contributing a portion of the funds from regulated trading. In contrast, county governments, representing the beneficiary public, act as the primary trading entities. Linyi’s IFEITP operationalizes a market mechanism centered on forest coverage rates and newly afforested areas. By setting dynamic aggregate targets for forest coverage, the policy employs dual trading instruments—“stock” transactions (existing forest reserves) and “increment” transactions (new afforestation achievements)—to foster competitive incentives among counties. Within this transaction framework, counties with forest coverage rates below the municipal average serve as buyers. In contrast, counties with coverage rates above the municipal average or notable afforestation achievements act as sellers. The total transaction fund consists of both municipal financial support and beneficiary payments, with one quarter allocated to stock transactions and three quarters allocated to incremental transactions. The transaction price standard is determined in accordance with Shandong Province’s ecological forest compensation standard. Specifically, a 1% reduction in Linyi’s forest coverage corresponds to an average forest area loss of 16,100 mu per county. Based on the provincial compensation rate of CNY 20/mu/year, the ecological compensation value for each 1% of forest coverage is calculated at CNY 322,000 [26]. Accordingly, when Linyi’s forest coverage is used as the baseline, counties below the baseline pay CNY 300,000 per percentage point, whereas counties exceeding the baseline receive CNY 200,000 per percentage point. The price for incremental transactions is determined annually based on prevailing conditions.
Linyi’s IFEITP represents an innovative PES mechanism in China. The policy adopts the city’s annual average forest coverage rate as a dynamic total control target, which progressively increases with the advancement of afforestation efforts and adjusts over time. This design ensures the long-term operability of the policy and continuously incentivizes afforestation activities in the counties without requiring modification of the control targets. Moreover, the system eliminates the need for price negotiations between buyers and sellers, as transactions are executed automatically at a single price. This approach effectively addresses the high communication costs typically associated with traditional negotiation-based transaction mechanisms. However, the determination of forest indicator trading prices in Linyi’s IFEITP relies solely on provincial-level ecological forest compensation standards, without accounting for differences in ESV arising from variations in regional forest coverage rates. This method for setting compensation standards prevents ecological contribution areas from receiving commensurate compensation for the economic benefits they forego to protect forests. This leads to environmental “injustice,” ultimately resulting in an imbalance of interests that is detrimental to the policy’s sustainable operation.

3. Methods

3.1. Study Area

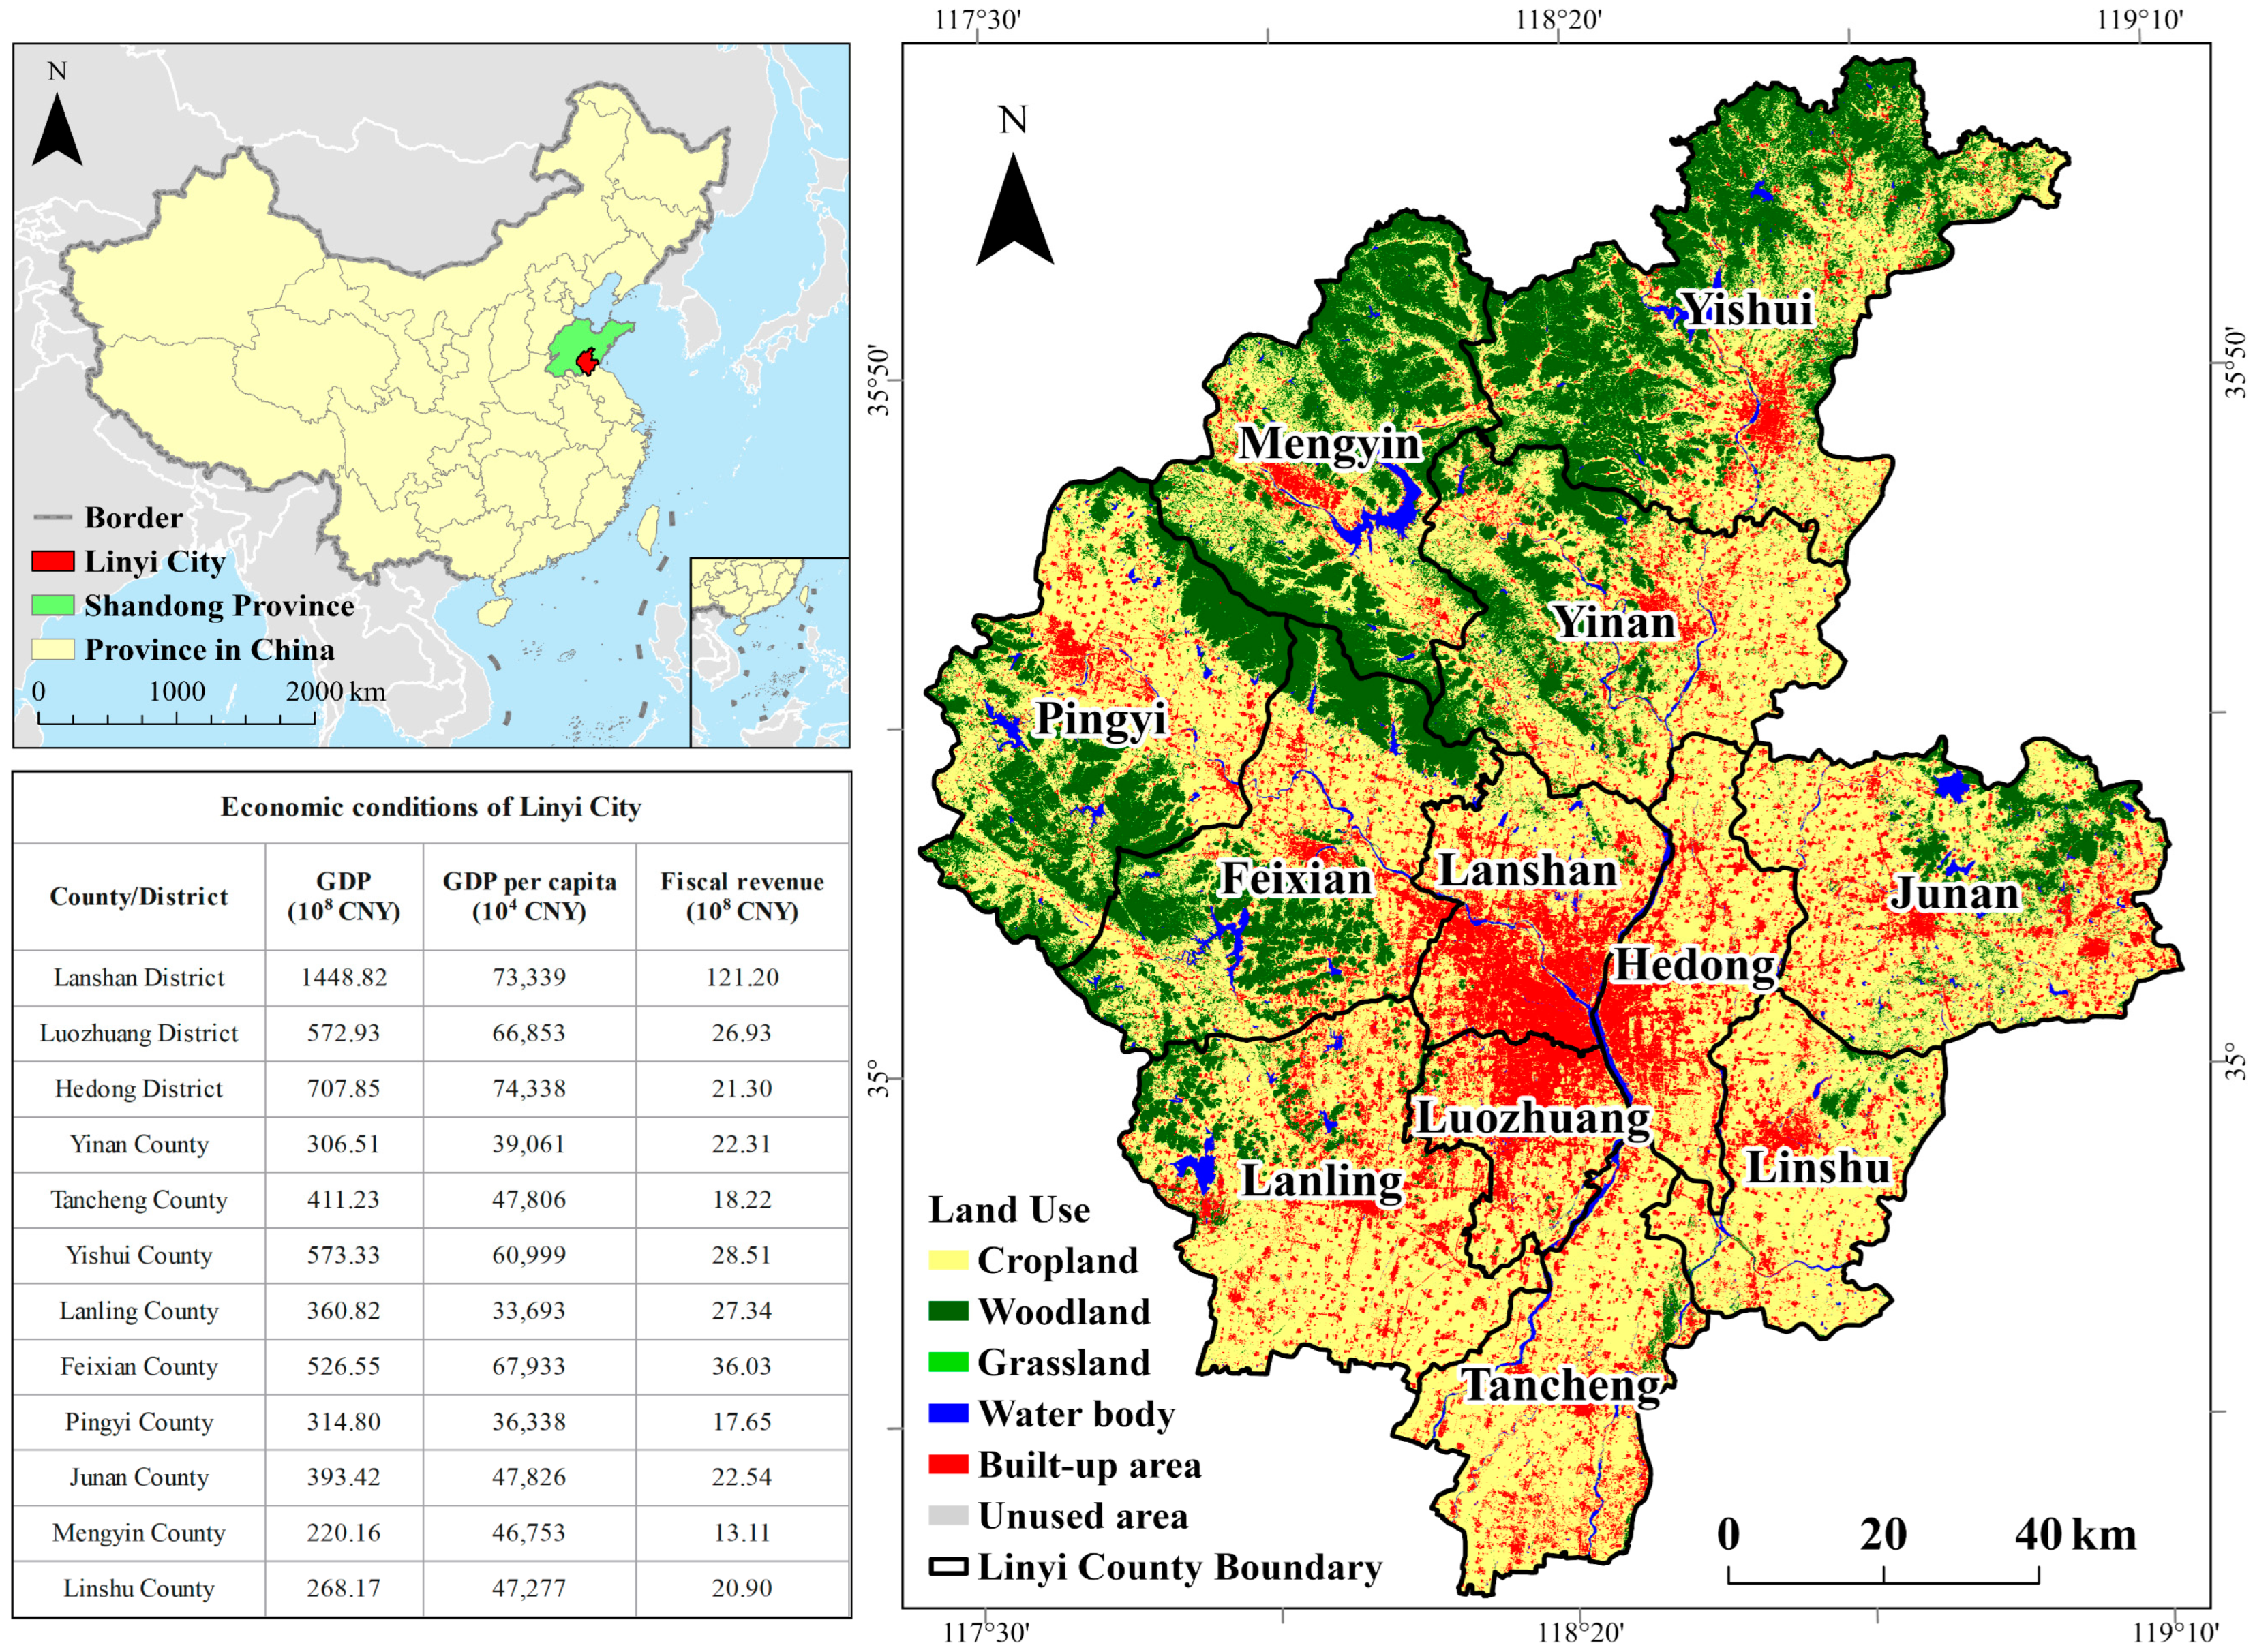
Linyi is a municipal-level city located in southeastern Shandong Province, China (Figure 1). Linyi lies between 34°22′ and 36°13′ N and between 117°24′ and 119°11′ E. The city has three districts—Lanshan District, Luozhuang District, and Hedong District—and nine counties—Yinan County, Tancheng County, Yishui County, Lanling County, Fei County, Pingyi County, Junan County, Mengyin County, and Linshu County—covering a total area of 17,191.2 km2. As the core area of the Yimeng Mountain region, Linyi serves as a crucial ecological barrier in southeastern Shandong Province. The territory is traversed by three major mountain ranges—Yishan, Mengshan, and Nishan—with mountainous and hilly terrain accounting for more than 60% of the total land area. It is a typical mountain city and forest city, with the greatest forest coverage in Shandong. The gross domestic product (GDP) of counties and districts ranges from CNY 20 billion to CNY 150 billion; per capita GDP ranges from CNY 33,000 to CNY 75,000; and fiscal revenue ranges from CNY 1.31 billion to CNY 12.11 billion. The GDP of Lanshan District (highest) was 6.5 times greater than that of Mengyin County (lowest), the per capita GDP of Hedong District (highest) was 2.5 times greater than that of Lanling County (lowest), and the fiscal revenue of Lanshan District (highest) was 9.2 times greater than that of Mengyin County (lowest), reflecting significant regional disparities in economic development.

3.2. Research Methods

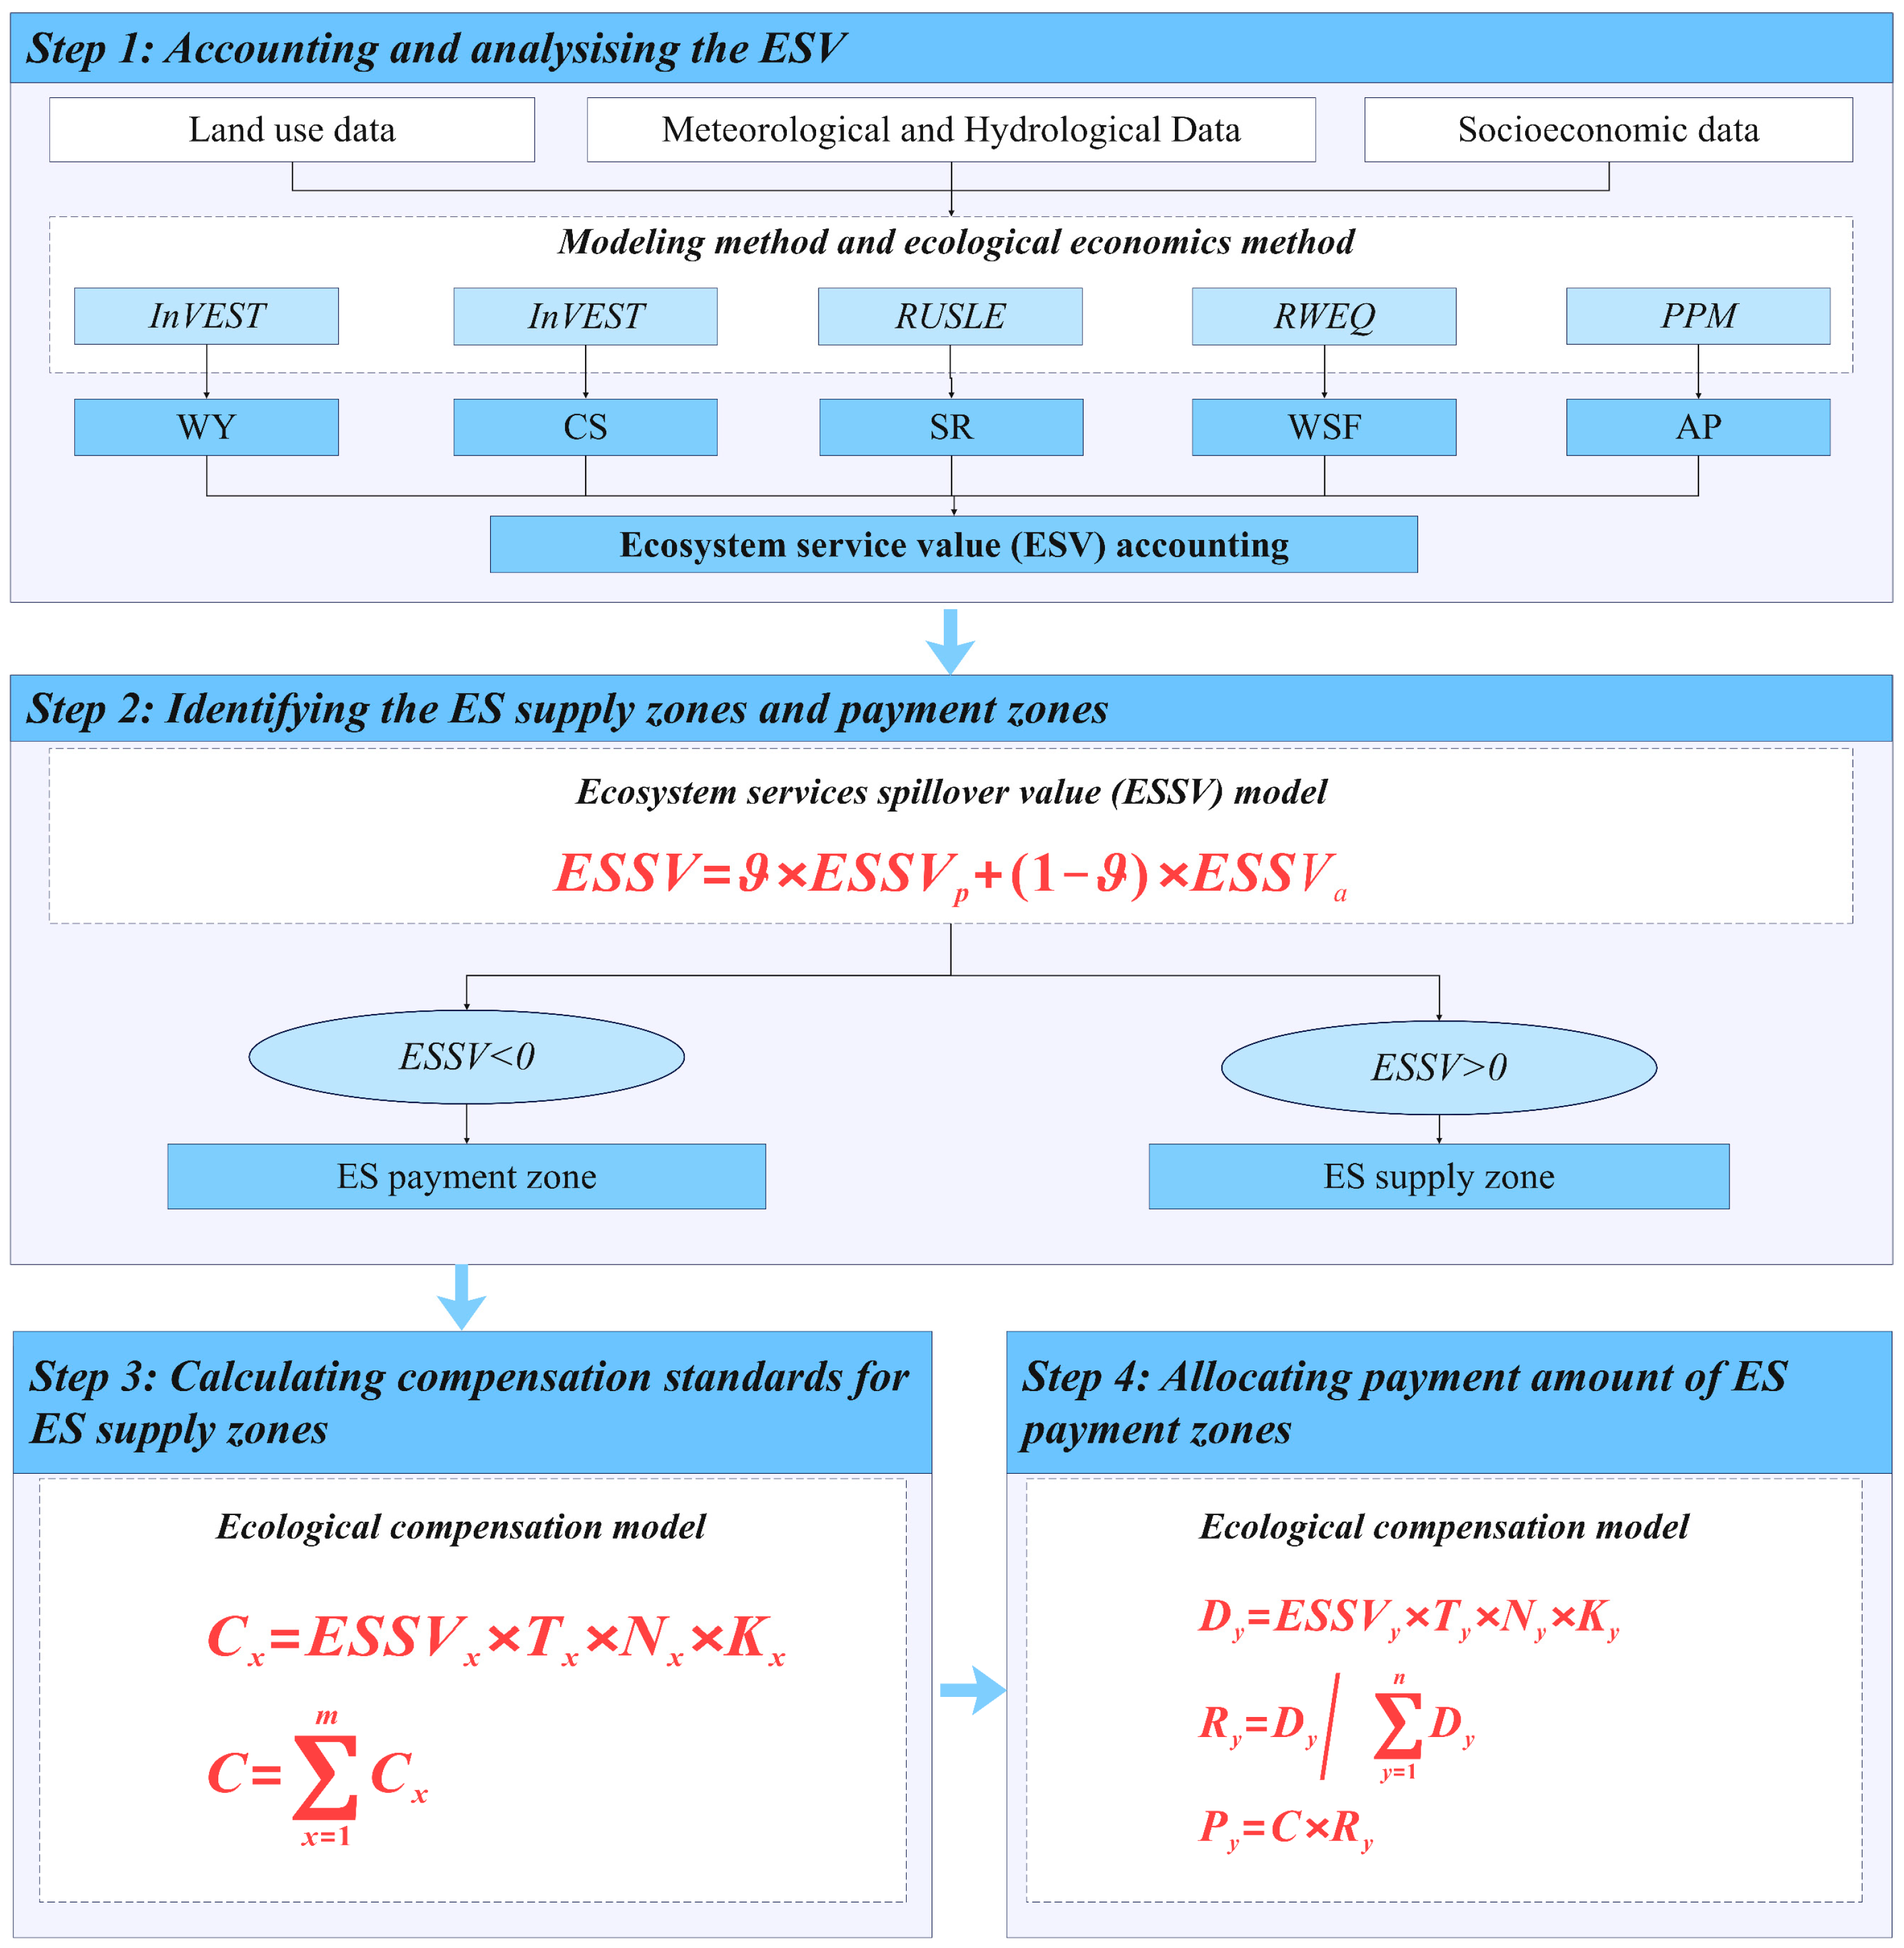
To achieve the aims outlined above, the research framework (Figure 2) encompasses the following key steps. The first step involves using land-use data generated through supervised classification on the Google Earth Engine (GEE) platform, as previously reported, to account for the ESV. Second, after the ESV was calculated and analyzed, we developed an ecosystem service spillover value (ESSV) model based on the ESV to identify supply and payment zones for ecosystem services. Third, we constructed an ecological compensation model grounded in the ESSV to determine the transaction amounts that supply zones should receive for the ecosystem services provided. Finally, we spatially allocated the ecosystem service transaction amounts based on ESV demand in the designated payment zones.

3.2.1. Estimation of ESV

Ecosystem services encompass supply services, regulatory services, and cultural services. The value of supply services and cultural services has already been monetized through existing market mechanisms and therefore does not require ecological compensation. From the perspective of ES supply, we selected five indicators of ecosystem regulatory services—water yield (WY), carbon storage (CS), air quality regulation (AQR), soil retention (SR), and windbreak and sand fixation (WSF)—as the basis for ecological compensation across counties in Linyi. Each service value was calculated using a combination of modeling methods and ecological economics approaches (Table 1). The total ESV was obtained by summing the individual values of the five services, utilizing auxiliary tools in ArcGIS 10.7.

3.2.2. Identification of the ES Supply and Payment Zones

According to the value spillover theory, in regions where ecosystem service values meet the basic living needs of local residents, development should be compensated accordingly [33]. Therefore, the transaction subjects of Linyi’s IFEITP are the spillover areas and beneficiary areas of ES. The spillover areas are the ES supply zones, and the beneficiary areas are the ES payment zones. The ecosystem service spillover value (ESSV) of each county was calculated on the basis of its resident population, land area, and ESV. When ESSV > 0, the region exhibits ecological spillover; when ESSV < 0, it benefits from ecosystem services; when ESSV = 0, supply and demand are balanced. The formulas are as follows:
E S S V p , i = E S V i P i × E p
E S S V a , i = E S V i A i × E a
E S S V i = θ × E S S V p , i + 1 θ × E S S V a , i
where E S V i is the ESV in the county (district) i ; E p denotes the optimal ESV per capita, which is replaced by the average value of ESV per capita in Linyi city; E a is the optimal ESV per unit area, which is replaced by the average value of ESV per unit area in Linyi city; P i is the resident population of the county (district) i ; A i is the land area of the county (district) i ; E S S V p , i and E S S V a , i are the ESSV of the county (district) i measured by the resident population and land area, respectively; E S S V i is the ESSV of the county (district) i obtained through comprehensive measurement; and θ is the weight, which is 50% with reference to relevant research findings [34,35].

3.2.3. Determination of Compensation Standards for the ES Supply Zones

The spillover ecological value deducted from the use of local ecosystem services is more reasonable for ecological compensation. However, if the broader ecosystem service spillover value is directly equated with the ecological compensation standard, it may exert significant economic pressure on the ES payment regions. In practice, the formulation of the ecological compensation standard should also consider whether the regional economic context reflects an urgent need for compensation or the capacity to provide it. The difference between the natural environment and the economic and social levels also has a certain impact on the ESV. Therefore, we constructed an ecological compensation model based on ESSV, along with natural and economic adjustment coefficients. The specific model is as follows:
C x = E S S V x × T x × N x × K x
C = x = 1 m C x
where C x is the amount of ecological compensation required by the supply zone x ; T x is the ecological compensation demand intensity for the supply zone x ; N x is the natural difference coefficient of the supply zone x ; and K x is the economic adjustment coefficient of the supply zone x .
(1) Ecological compensation demand intensity
The regional economy determines the degree of demand for ecological compensation. The lower the economic level and the higher the ESV are, the greater the demand for ecological compensation. This study constructed demand intensity for ecological compensation based on each county’s ESV and GDP.
T x = 2 × a r c t a n E S V x / G D P x / π
where G D P x is the gross domestic product of the supply zone x .
(2) Natural difference coefficient
Forest coverage is a key reference indicator for implementing Linyi’s IFEITP. Regional differences in forest coverage lead to inconsistencies in ecosystem services. Therefore, the difference in forest coverage should be considered when determining the compensation standard. In this work, the natural difference coefficient was calculated as the ratio of the forest coverage rate of each county (district) to the city’s average value. The calculation formula is as follows:
N x = F x / F
where F x represents the forest coverage of the supply zone x and where F represents the forest coverage of Linyi City.
(3) Economic adjustment coefficient
People’s willingness to pay for ecosystem services shows a pattern similar to the Peel growth curve, with improvements in economic development [36,37]. Therefore, the economic adjustment coefficient is determined by improving the Peel growth curve model in this paper. The formula is as follows:
K x = L x / 1 + a × e x p b ε
L x = G D P x / G D P
To simplify the model, a and b are taken as 1 [17].
K x = G D P x / G D P × e x p ε / 1 + e x p ε
where L x is the willingness to pay for ecosystem services in the supply zone x ; G D P x is the GDP of the supply zone x ; GDP is the GDP of Linyi City; ε is the Engel coefficient of the city; and e x p is the natural constant.

3.2.4. Fund Allocation for ES Payment Zones

For the ESs’ payment zones, the value calculated according to the ESSV model represents the ESs’ demand. In contrast, the value calculated under the ecological compensation model is the theoretical payment for the ESs’ demand. The theoretical payment amount for each county (or district) serves as the foundation for allocating ecological compensation funds within the ecosystem service payment area. The specific calculation formula is presented as follows:
D y = E S S V y × T y × N y × K y
N y = F / F y
where D y is the amount that the ES’s payment zone y theoretically needs to pay for its demand for ecosystem services. The calculation methods of T y and K y In the payment zones, the same rules apply as in the supply zones.
R y = D y / y = 1 n D y
P y = C × R y
where R y is the payment proportion of ecological compensation in the payment zone y and where P y is the payment amount of ecological compensation in the payment zone y .

3.3. Data Sources

The data used in this study include remote sensing product data, meteorological and hydrological data, and socioeconomic data. Remote sensing data include land use, digital elevation model (DEM), soil properties, and other data. Meteorological and hydrological data include temperature, precipitation, wind speed, and other data. Socioeconomic data cover the resident population, GDP, fiscal revenue, and other data. The specific data sources are shown in Table 2.

4. Results

4.1. Temporal and Spatial Variations in ESV

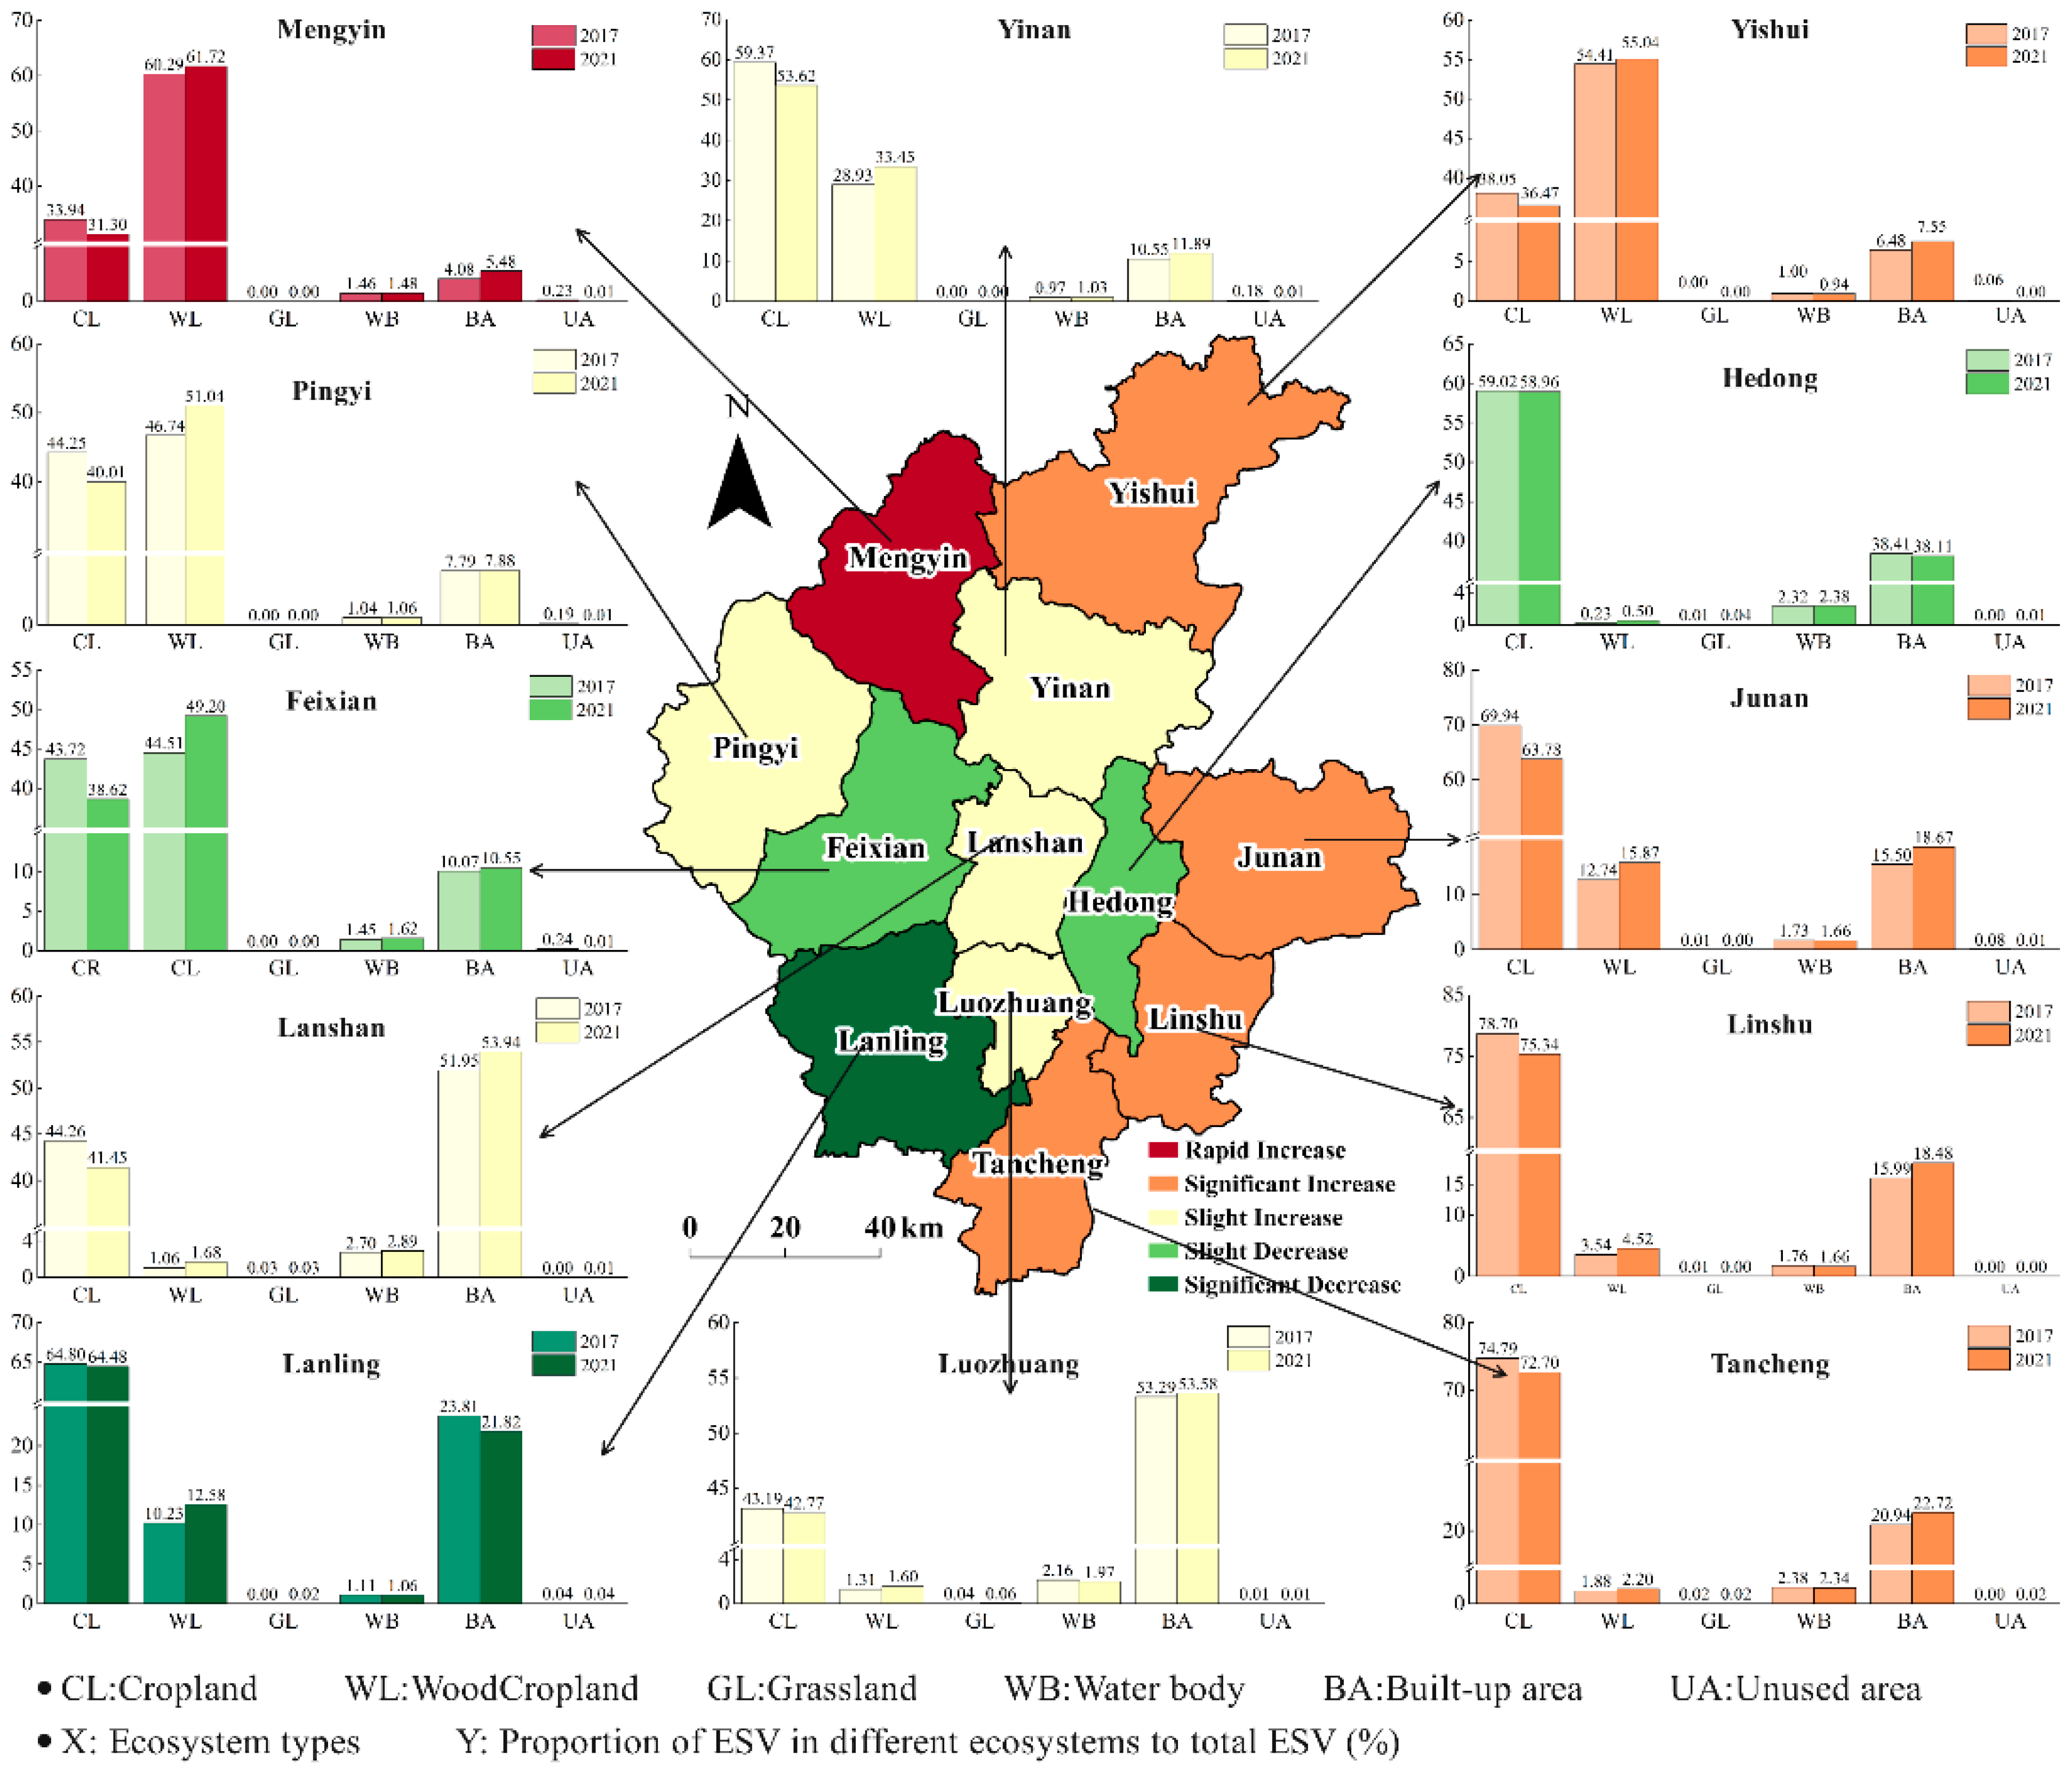
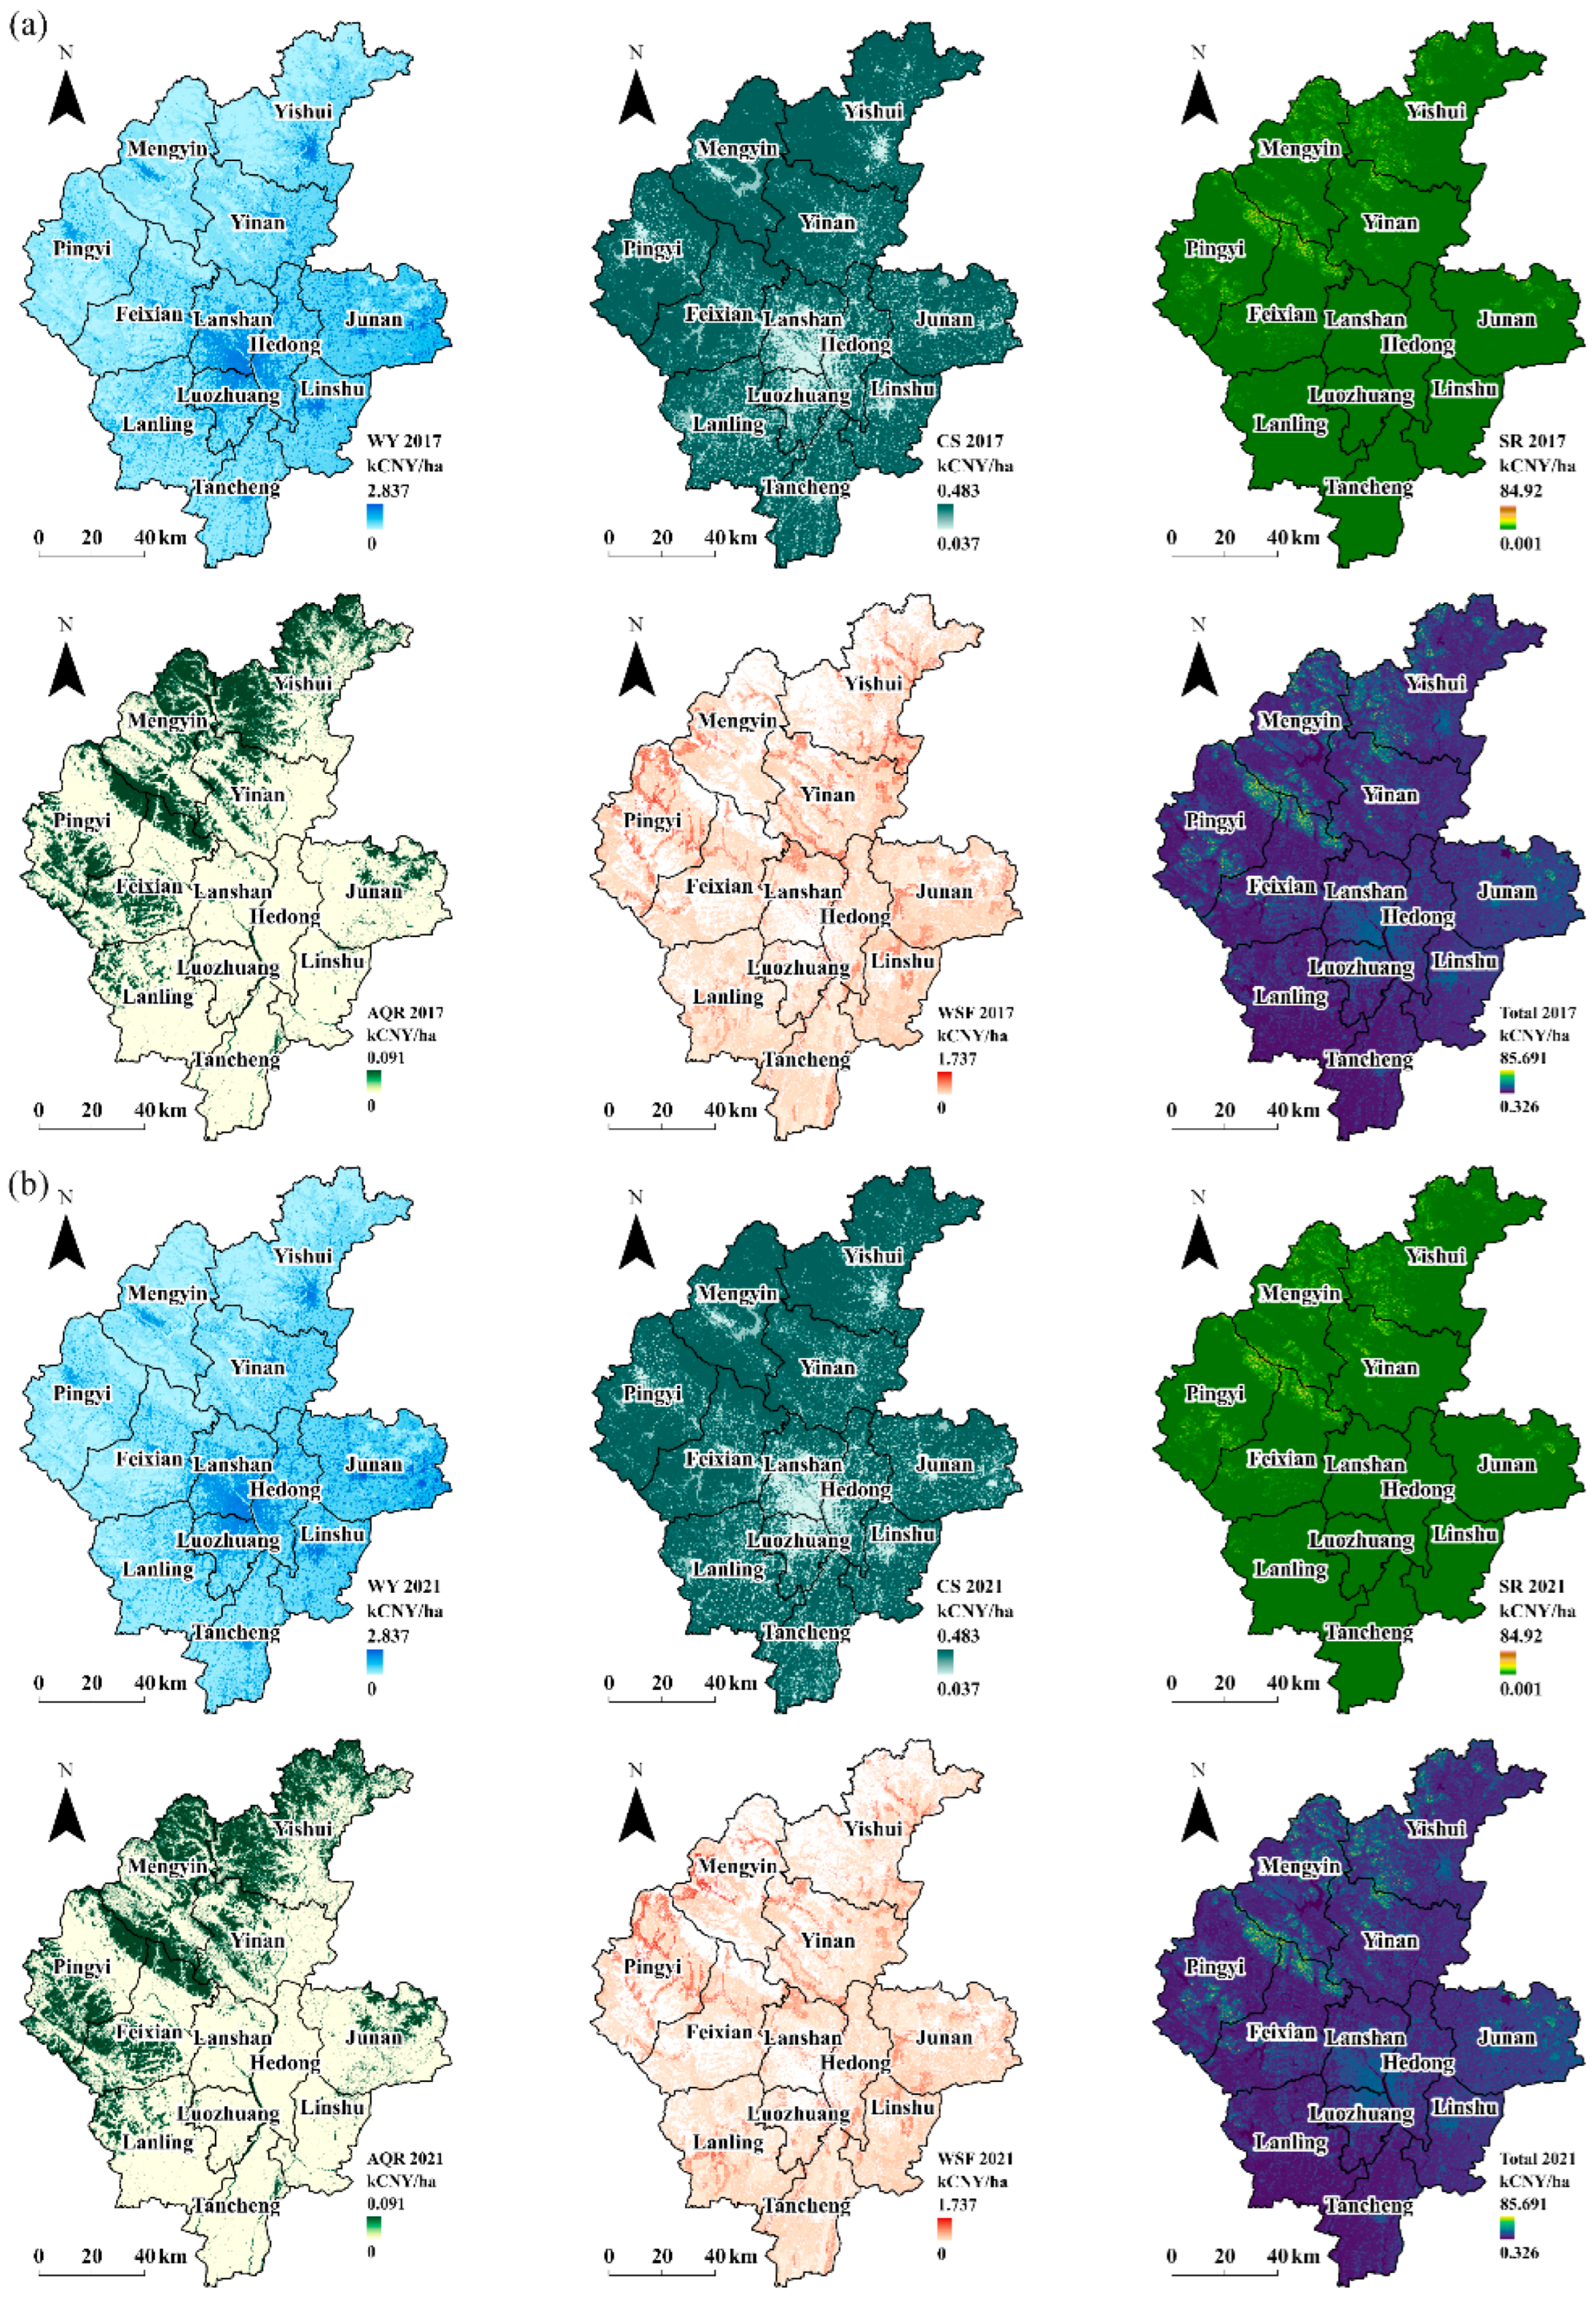
We calculated the ESV of Linyi for 2017 and 2021 (Figure 3). The results revealed that during the implementation of Linyi’s IFEITP from 2017–2021, the total ESV increased; however, the spatial distribution of the ESV remained unbalanced. The total ESV of the whole city increased from 153.17 × 10⁴ CNY/km2 CNY/km2 to 154.15 × 10⁴ CNY/km2. The total ESV of Lanling County, Hedong District, and Fei County presented slight downward trends, whereas the total ESV of the other nine counties and districts presented upward trends. The increase in the ESV in counties (districts) exceeded 0.5%, with the highest increase reaching 2.22%.
In terms of spatial distribution, the comprehensive ESV of Linyi showed a northwest-high, southeast-low pattern. High-value areas are concentrated primarily in northwestern counties, including Yishui County, Yinan County, Mengyin County, and Fei County. In contrast, low-value areas are mainly located in southeastern districts, including Lanshan District, Luozhuang District, and Hedong District. This pattern directly reflects each county’s land-use structure. The high-value areas are characterized by mountainous and hilly terrains, where forests contribute to more than 50% of the total ESV, with Mengyin County having the highest proportion of forest ecosystem service value at 61.72%. In contrast, the low-value areas are predominantly flat plains, where farmland accounts for more than 40% of the ESV, with Linshu County showing the highest proportion of farmland ecosystem service value at 75.34% (Figure 4). The ESV provided by forests in each district and county has increased to varying degrees, indicating that the forest area in each region has expanded, which is consistent with the actual situation.
The spatial distributions of different ecosystem services in Linyi exhibited spatial heterogeneity. Specifically, carbon storage, soil retention, windbreaks, and sand fixation, as well as air quality regulation, exhibited similar spatial distribution patterns. High-value areas were primarily distributed in the mountainous and hilly regions of the northern and western parts, as well as in the eastern hilly areas. In contrast, areas with relatively high water yields were located primarily in the central urban area of Linyi and in the built-up areas of various counties. In contrast, the water yields in the mountainous western and northern regions were relatively low.

4.2. Analysis of ESSV

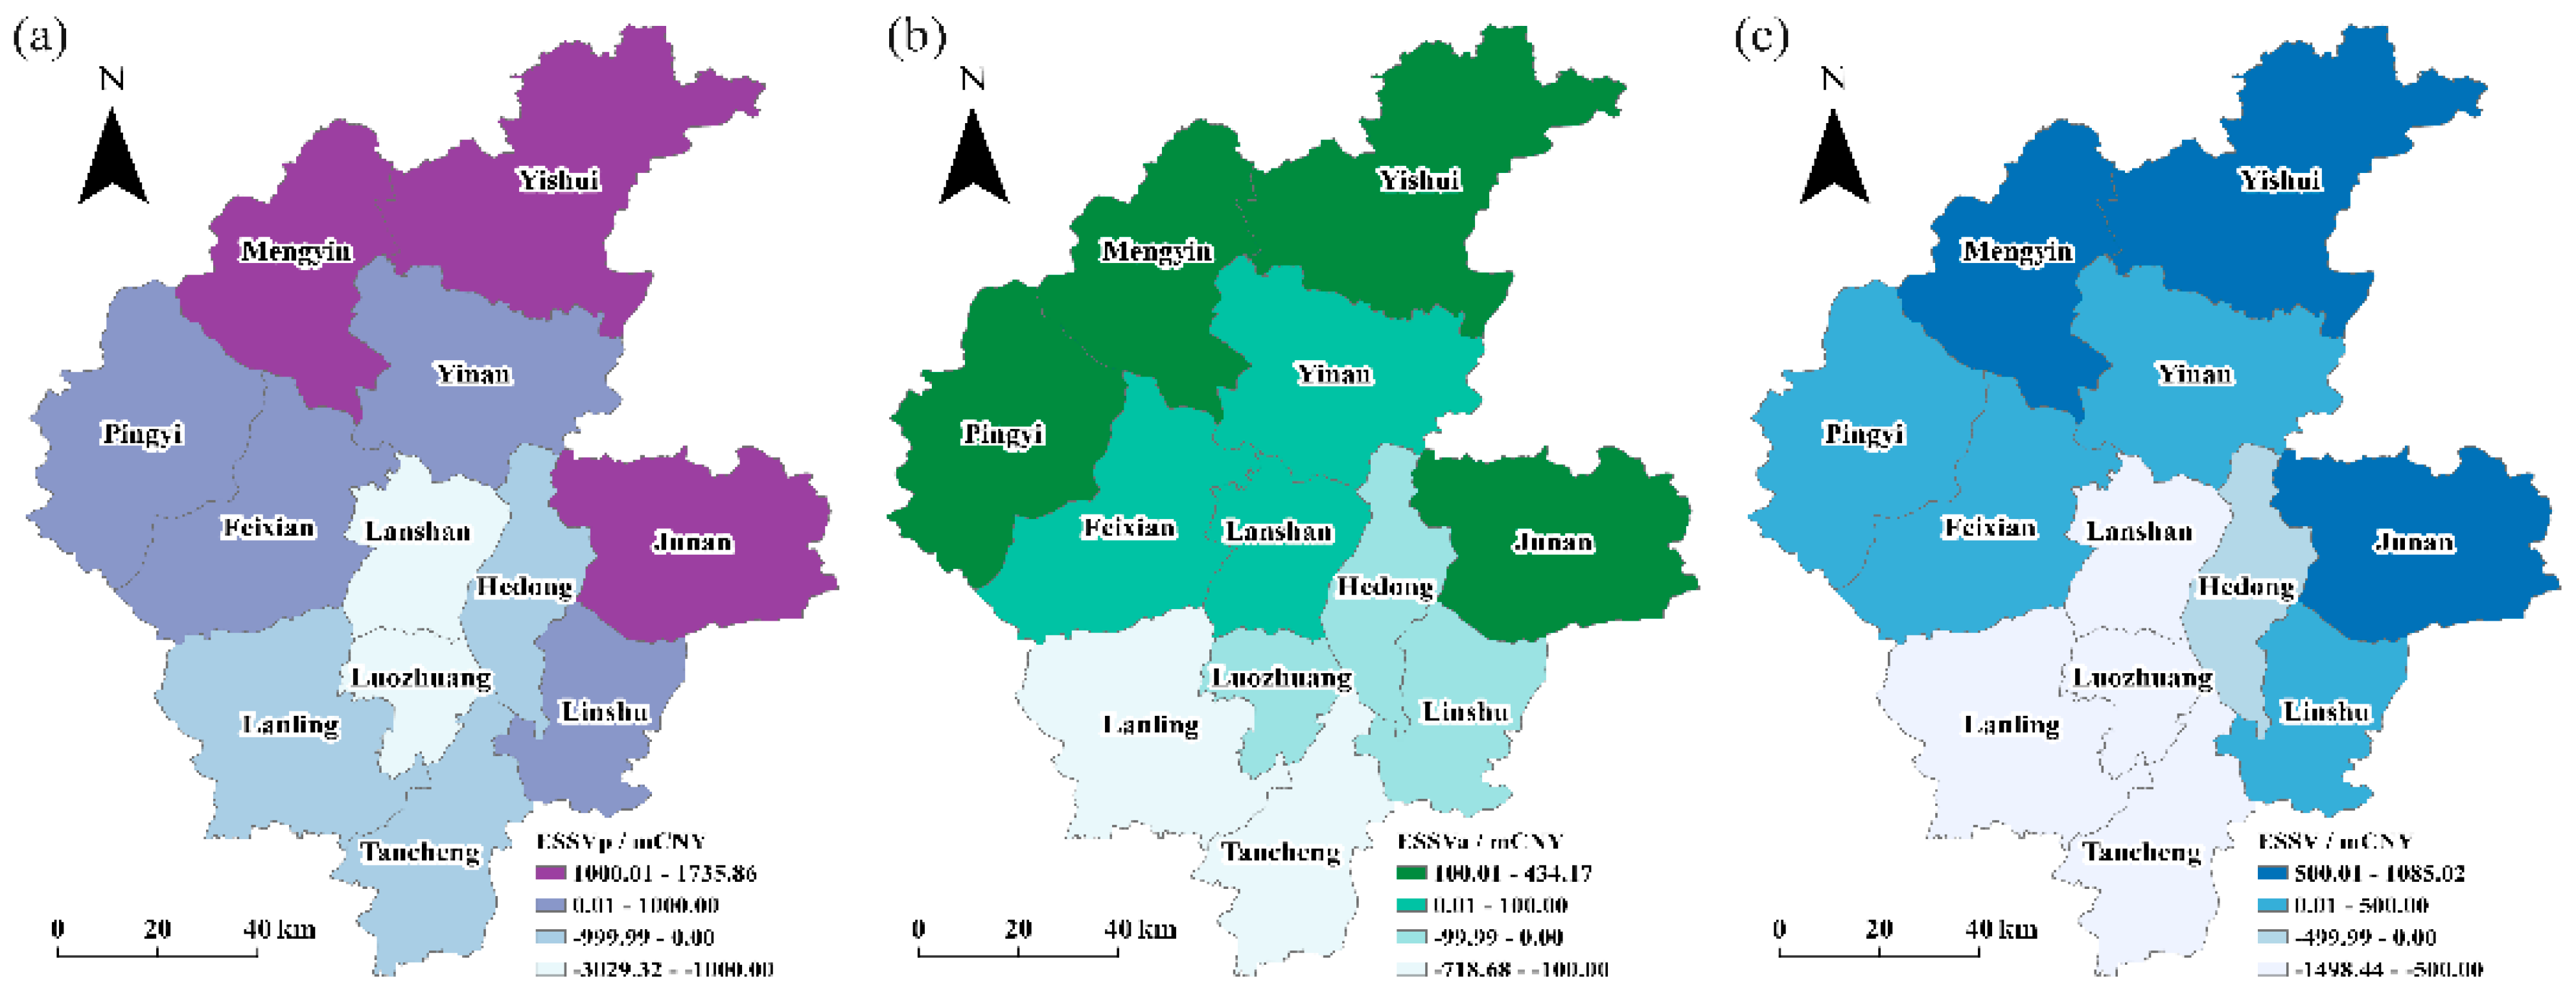
To identify the supply and payment zones of ecosystem services in Linyi City, we took 2021 as an example and used Formulas (1) and (2) to calculate the ecosystem service spillover values (ESSV) of each county based on the permanent population and land area, and spatialized them (Figure 5). The population-based ESSV (ESSVₚ) evaluation results indicate that seven counties and districts—Yishui County, Mengyin County, Pingyi County, Junan County, Yinan County, Fei County, and Lanling County—had ecosystem service value (ESV) spillovers. In contrast, the remaining five districts and counties, due to either low total ESV or high population density, which prevent a balance between service provision and consumption, were classified as ecological beneficiary areas. The ESSVa (area-based) evaluation results differed from those of E S S V p . Seven districts/counties—Yishui County, Mengyin County, Pingyi County, Lanshan County, Junan County, Yinan County, and Fei County—demonstrated ESV spillover, whereas other areas emerged as ecological beneficiaries. In Lanshan District and Luozhuang District, although the total ESV was relatively low, their small territorial areas resulted in relatively high ecosystem service values per unit area, leading to either ecological spillover or basic balance. Linshu County became an ecologically beneficial area due to its large territorial area, resulting in relatively low ecosystem service values per unit area.
By integrating both ESSVa and ESSVp, the comprehensive regional ESSV was calculated using Formula (3) (Figure 5). Compared with the original policy, the ES supply zones and payment zones identified in this study showed notable changes (Table 3). Given that the spatial distribution pattern closely aligns with ESSVp, seven counties and districts—Yishui County, Mengyin County, Pingyi County, Junan County, Yinan County, Fei County, and Lanling County—were designated as ES supply areas. In contrast, the remaining five counties and districts were classified as ES payment areas. These findings underscore that population exerts a stronger influence on the identification of ES supply and payment zones.

4.3. Analysis of the Amount of Ecological Compensation

In order to optimize the transaction price of Linyi policies, we constructed an ecological compensation model that comprehensively considers the spillover effects of ecosystem services, forest coverage, and economic and social conditions, and used it to recalculate the transaction price of forest indicators. According to Formulas (4) to (14), the ecosystem service payments and receipt amounts for each district and county in Linyi were calculated (Table 3). The payment zones provide all compensation funds for the ES supply zones. The total amount of ecological compensation that the seven supply areas should receive is 27.10 million CNY. Mengyin County has the highest compensation entitlement, receiving 11.02 million CNY. Yishui County, Junan County, Pingyi County, Fei County, and Yinan County are each entitled to compensation ranging from 1.2 to 6.1 million CNY. In contrast, Linshu County should receive a comparatively smaller amount, approximately 6000 CNY. The payment contributions from the five designated payment districts and counties—Lanshan District, Lanling County, Hedong District, Luozhuang District, and Tancheng County—are 31.7%, 29.1%, 15.6%, 13.1%, and 10.5%, respectively, based on their demand for ecosystem service values. This corresponds to payment amounts of 2.84 million CNY, 3.56 million CNY, 4.23 million CNY, 7.89 million CNY, and 8.58 million CNY, respectively.
Compared with the original standards (Table S2), the compensation received by each ES supply zone has increased by varying amounts, with the total amount rising by 116.2%. The payment amounts from each ES supply zone also increased, but the total payment amount decreased. When the economic levels of each county (district) were compared, ecosystem service payments or receipts were comparable to local GDP and fiscal revenue.

5. Discussion

5.1. Aligning Compensation Standards with ESSV

The primary aim of this study was to address the critically low and unsustainable compensation standard of Linyi’s IFEITP by developing a technical framework based on the ecosystem service spillover value (ESSV). Our findings demonstrate that the original standard, derived solely from provincial afforestation subsidies, failed to reflect the spatial heterogeneity and transboundary benefits of ecosystem services. This oversight resulted in a mismatch between the ecological contributions of forest-rich counties and the economic compensation they received, a phenomenon widely recognized in the literature as a failure to internalize positive environmental externalities, leading to interregional “environmental injustice” [15,24,38]. An effective PES mechanism must ensure that incentives align with actual ES provisions, requiring clear identification of the zones where ESs are produced and where they flow [39].
Our ESSV-based framework directly addresses this gap by moving beyond the simplistic forest-coverage-rate threshold of the original policy. In contrast, it systematically identifies functional ES supply and payment zones by quantifying the net spillover of ESV from each district and county (Table 3). This approach is grounded in the growing consensus that effective and fair ecological compensation must account for the direction and magnitude of ES flows [40,41]. Studies have emphasized that spatial targeting, which identifies specific providers and beneficiaries, is crucial for enhancing the cost-effectiveness and equity of PES programs [42,43]. By identifying counties such as Mengyin and Yishui as major suppliers and urban districts such as Lanshan as beneficiaries, our framework provides a transparent, quantitative basis for compensation that reflects actual ecological interdependencies.
A major challenge in PES design is to develop a compensation standard that is both ecologically significant and economically feasible. Previous studies have shown that using the total ESV as a standard can result in amounts exceeding the beneficiary’s ability to pay, making policies impractical [23,44]. Conversely, standards based solely on opportunity costs or administrative subsidies tend to undervalue ecological benefits and fail to provide sufficient incentives for protection [20,45]. Our ESSV model provides a practical solution to this dilemma. By paying special attention to the spillover portion of ESV, which exceeds local per capita and unit-area demand and benefits other regions, we isolate the component that justifies intergovernmental fiscal transfers. The newly calculated standard, which increases total compensation to supply zones by 116.2% while demanding less than 0.2% of the fiscal revenue from payment zones, achieved a critical balance. It more accurately reflects the marginal value of conserved forests to the wider region, as suggested by economic theory for efficient PES [46], while remaining within the fiscal constraints of local governments—a key determinant of policy sustainability [47].
Methodologically, our framework integrates multiple adjustment factors to refine the compensation standard. The inclusion of forest coverage (natural coefficient of variation, N) acknowledges that the quantity and quality of ecosystem services are inherently linked to the state of the forest ecosystem itself [48]. The economic adjustment coefficient (K), modeled on the relationship between economic development and willingness to pay, ensures that compensation demand is sensitive to regional carrying capacity, consistent with the observed pattern of increasing payment capacity with economic growth [36,37]. This multicriteria approach responds to people’s call for compensation mechanisms that not only have ecological foundations but also are socially adaptable [17]. It effectively operationalizes the three conditions for a reasonable compensation standard outlined by Pei et al. [49]: reflecting local ESV, capturing interregional ES transfers, and being commensurate with local economic development levels.
In summary, the discussion affirms that the ESSV-based framework represents a significant advancement over the original IFEITP standard. It translates the theoretical principle of “beneficiary pays” into a workable accounting method by quantifying spatial spillovers. By integrating ecological supply (via ESV and forest coverage) with socioeconomic demand and capacity (via population, area, and GDP), the framework generates a compensation standard that is more equitable, economically viable, and better equipped to motivate sustained forest conservation across jurisdictional boundaries. This provides a robust model for optimizing not only Linyi’s policy but also similar government-led compliant PES mechanisms elsewhere.

5.2. Optimization of the Operational Mechanism of Linyi’s IFEITP

Building on the rational standard set by the ESSV framework, we propose the following concrete optimizations for the IFEITP’s operational mechanism to ensure its longevity and effectiveness.
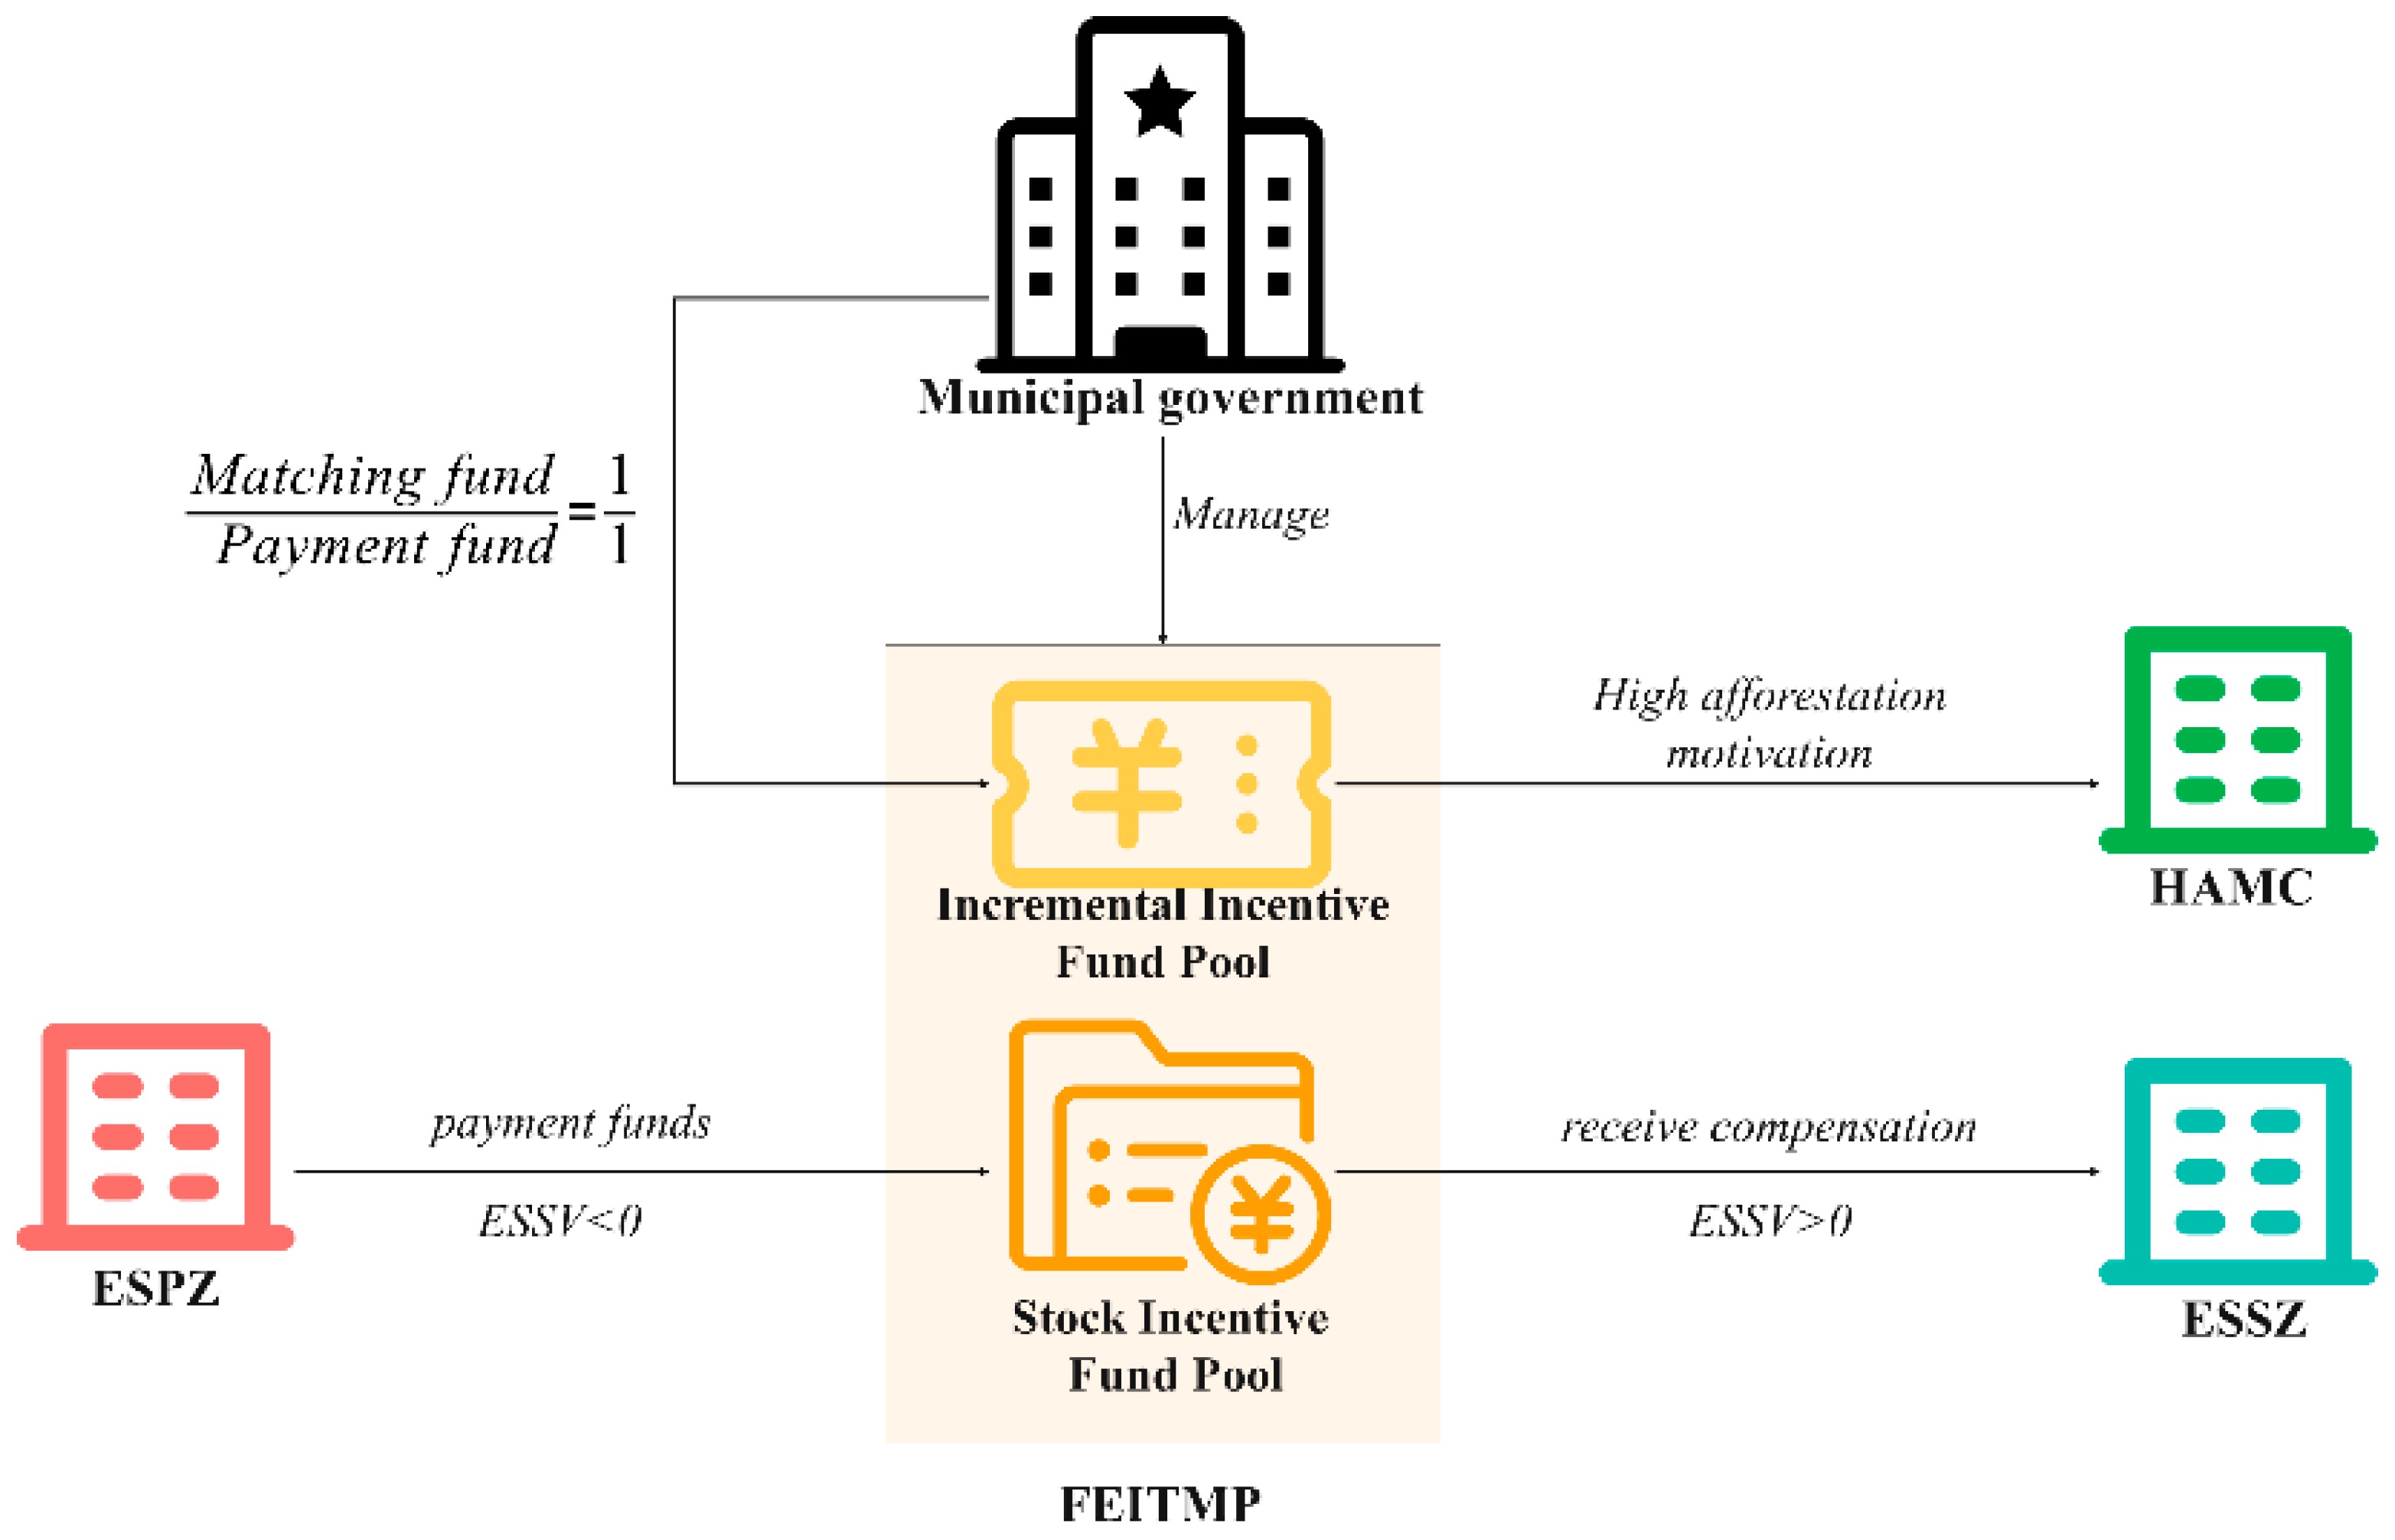
(1) Establish a Forest Ecological Indicator Trading Management Platform. To effectively raise funds from payment zones and efficiently use compensation funds in supply zones, the Linyi municipal government should establish a Forest Ecological Indicator Trading Management Platform to administer special funds and ensure their efficient use through standardized management. This platform consists of a “Stock Incentive Fund Pool” and an “Increment Incentive Fund Pool” (Figure 6). Purchasers of forest ecological indicators fully fund the Stock Incentive Fund Pool. In contrast, the Increment Incentive Fund Pool is allocated annually from the municipal budget equal to the amount in the Stock Fund Pool.
(2) A compensation mechanism is constructed on the basis of ecosystem service spillover effects. Forest coverage rates will no longer determine the designation of payment zones and supply zones for forest ecological indicators, but rather by the ESSV of each district and county. The trading price of indicators should be determined by comprehensively considering factors such as forest coverage, economic development levels, and ecosystem service spillover values in each region. This approach aims to ensure that supply zones receive adequate compensation while avoiding excessive financial burdens on payment zones.
(3) Optimize the allocation method of the fund pools. All funds paid by the forest ecological indicator payment zones are used to compensate for the ecosystem services generated by the existing stock of forests in the supply zones. Regarding incremental incentives, since newly planted forests cannot immediately provide stable ecosystem services, the original incentive standards will continue to apply. These incentives are determined by increases in forest coverage and forest area.
Figure 6. Optimized the operational mechanism of Linyi’s IFEITP. ESPZ: ecosystem service payment zones; ESSZ: ecosystem service supply zones; HAMC: county with high afforestation motivation; FEITMP: Forest Ecological Indicator Trading Management Platform.
Sustainability 18 00643 g006

6. Implications of the Study

6.1. Implications for Compliant PES Mechanism Design

Linyi’s IFEITP represents a novel, compliant PES mechanism in which governments are the primary trading entities, differing from user-financed models such as Costa Rica’s PSA [50] or regulatory markets such as the U.S. Wetland Mitigation Bank [51,52]. Our optimization proposal—establishing a dedicated trading platform and an ESSV-based pricing mechanism—addresses a key gap in compliant PES: how to set rational, automated prices without costly negotiations [1]. This finding supports Salzman et al.’s (2018) argument that government-regulated transactions can increase efficiency [1], but we extend it by providing a quantifiable method to replace arbitrary subsidy references with an ecological-economic basis. This could inform similar inter-governmental ecological indicator trading systems in China and beyond, particularly for public-owned resources.

6.2. Implications for Ecological Compensation Standard Setting

Our methodology bridges two common approaches in the literature: ecosystem service valuation and opportunity cost accounting. While the direct use of total ESV often leads to prohibitively high standards [23,43] and opportunity-cost methods underestimate ecological benefits [20], our ESSV model focuses on the spillover portion of ESV. This aligns with recent calls for spatially explicit compensation that tracks ES flows from suppliers to beneficiaries [15,24,53]. For example, similar to Chi et al. (2024), who used ecosystem service flow paths to determine compensation [54], our study identifies payment responsibilities based on received spillover benefits. However, we simplify complex flow modeling by using population and area as proxies for demand and supply capacity, a method supported by Huang et al. (2021) [33] for regional-scale assessments. This provides a pragmatic tool for policymakers needing operable models without excessive data requirements.

6.3. Broader Implications for Sustainable Development and Environmental Justice

The optimized framework promotes sustainable development by internalizing ecological externalities into local government decision-making. Linking fiscal payments to ES consumption creates a continuous incentive for payment zones to support regional ecological conservation, potentially reducing the “free-rider” problem noted in regional ecological governance [10]. Furthermore, it advances environmental justice by ensuring that counties such as Mengyin and Yishui, which provide high ESV (Figure 3), receive commensurately higher compensation (Table 3). This addresses the equity concerns raised in the context of China’s eco-compensation policies, which have historically relied on vertical fiscal transfers that may not correct horizontal imbalances [11].

7. Conclusions

Unlike user-regulated trading mechanisms, Linyi’s IFEITP is a compliant PES mechanism implemented between governments. It has played a significant role in advancing environmental justice and promoting sustainable development.
This study constructs an ecological compensation technical framework based on ecosystem service spillover effects, providing a new methodology for optimizing the IFEITP. A case study reveals a gap between the current compensation level and the newly calculated (proposed) indicator trading price. By identifying areas of ecosystem service spillover and applying differentiated compensation standards, the framework ensures that regions providing more ecosystem services receive adequate compensation. This increases the fiscal revenue of supply zones without imposing a financial burden on payment zones, highlighting the need for policy adjustments to enhance fairness and more effectively motivate ecological conservation efforts across districts and counties.
The IFEITP mechanism in Linyi provides a practical approach to increasing forest coverage through fiscal incentives and interregional cooperation. It could be extended to other prefectural and provincial governments and applied to other resource types, such as wetlands, grasslands, farmlands, and natural coastlines. However, this requires certain preconditions; local ecological resources must exhibit significant spatial disparities in distribution, and natural resource property rights should be primarily public, allowing the government to exercise sovereignty on behalf of the public. In regions where ecological resources are privately owned, this policy may not be applicable, and its operational efficiency could be lower.

8. Limitations and Outlooks

This study develops an ecological compensation framework that improves how compensation payers and beneficiaries are identified, reflecting each district’s direct ecological contributions. It also effectively addresses the problem of excessive or insufficient compensation arising from the use of a single ecological compensation standard, enhancing the efficiency of the IFEITP. However, the research has several limitations:
1. Uncertainty in valuing ecosystem services [55,56,57]: Current methods lack precision and should be refined with localized models and parameters.
2. Simplified flow assumptions—uniform diffusion of services—are assumed, ignoring influences from land cover, topography, meteorology, and distance. Future work should adopt more advanced models (e.g., field-strength or distance-decay models [53,54,58]) to better map service flows and improve compensation accuracy.
3. Averaged optimal values—using average per capita and per-unit-area ecosystem service values—reduced precision. The application of carrying capacity models could help determine locally optimal values and refine compensation schemes.

Supplementary Materials

The following supporting information can be downloaded at https://www.mdpi.com/article/10.3390/su18020643/s1, Figure S1: Mechanism of Linyi’s IFEITP; Figure S2: The primary typologies of PES mechanism; Table S1: Carbon density parameters in carbon storage module in invest model; Table S2: Ecosystem service payments or receipt amounts for each county (district) of Linyi under the original policy (2019–2021). References [12,29] are cited in the Supplementary Materials.

Author Contributions

Conceptualization, H.W. and Y.R.; methodology, H.W., Y.R. and S.W.; software, H.W. and Y.R.; formal analysis, H.W.; data curation, H.W., Y.R., X.C., T.L. and D.S.; writing—original draft preparation, H.W.; writing—review and editing, L.Z. and S.W.; visualization, Y.R. and W.C.; supervision, L.Z.; funding acquisition, L.Z. All authors have read and agreed to the published version of the manuscript.

Funding

This research was funded by National Social Science Fund of China, grant number 23BTJ030.

Institutional Review Board Statement

Not applicable.

Informed Consent Statement

Not applicable.

Data Availability Statement

The data presented in this study are available on request from the corresponding author.

Acknowledgments

In addition, we would like to express their sincere gratitude to the editor and the anonymous reviewers for their invaluable time, insightful comments, and constructive suggestions.

Conflicts of Interest

Author Mr. Dongsheng Shi was employed by the company Shandong Academy of Environmental Sciences Co., Ltd. The remaining authors declare no other competing interests.

Abbreviations

The following abbreviations are used in this manuscript:
IFEITPThe Intergovernmental Forest Ecological Indicator Trading Policy
ESsEcosystem services
PESPayment for ecosystem services
ESVEcosystem service value
ESSVEcosystem service spillover value
GDPGross domestic product
CNYChinese yuan
WYWater Yield
CSCarbon Storage
SRSoil Retention
WSFWindbreak and sand fixation
AQRAir quality regulation
PPMPollutant purification model
kCNYOne thousand Chinese yuan
mCNYOne million Chinese yuan
ESPZEcosystem service payment zones
ESSZEcosystem service supply zones
HAMCThe county with high afforestation motivation
FEITMPForest Ecological Indicator Trading Management Platform

References

  1. Salzman, J.; Bennett, G.; Carroll, N.; Goldstein, A.; Jenkins, M. The global status and trends of Payments for Ecosystem Services. Nat. Sustain. 2018, 1, 136–144. [Google Scholar] [CrossRef]
  2. Kaiser, J.; Haase, D.; Krueger, T. Payments for ecosystem services: A review of definitions, the role of spatial scales, and critique. Ecol. Soc. 2021, 26, 12. [Google Scholar] [CrossRef]
  3. Li, F.F.; Liu, H.Y.; Wu, S.H.; Wang, Y.H.; Xu, Z.C.; Yu, P.T.; Yan, D.H. A PES framework coupling socioeconomic and ecosystem dynamics from a sustainable development perspective. J. Environ. Manag. 2023, 329, 117043. [Google Scholar] [CrossRef]
  4. Obeng, E.A.; Aguilar, F.X. Value orientation and payment for ecosystem services: Perceived detrimental consequences lead to willingness-to-pay for ecosystem services. J. Environ. Manag. 2018, 206, 458–471. [Google Scholar] [CrossRef]
  5. van der Gaast, W.; Sikkema, R.; Vohrer, M. The contribution of forest carbon credit projects to addressing the climate change challenge. Clim. Policy 2018, 18, 42–48. [Google Scholar] [CrossRef]
  6. Barton, D.N.; Faith, D.P.; Rusch, G.M.; Acevedo, H.; Paniagua, L.; Castro, M. Environmental service payments: Evaluating biodiversity conservation trade-offs and cost-efficiency in the Osa Conservation Area, Costa Rica. J. Environ. Manag. 2009, 90, 901–911. [Google Scholar] [CrossRef]
  7. Schomers, S.; Matzdorf, B. Payments for ecosystem services: A review and comparison of developing and industrialized countries. Ecosyst. Serv. 2013, 6, 16–30. [Google Scholar] [CrossRef]
  8. Maraseni, T.N.; Poudyal, B.H.; Rana, E.; Khanal, S.C.; Ghimire, P.L.; Subedi, B.P. Mapping national REDD plus initiatives in the Asia-Pacific region. J. Environ. Manag. 2020, 269, 110763. [Google Scholar] [CrossRef]
  9. Baskent, E.Z.; Balci, H. A priory allocation of ecosystem services to forest stands in a forest management context considering scientific suitability, stakeholder engagement and sustainability concept with multi-criteria decision analysis (MCDA) technique: A case study in Turkey. J. Environ. Manag. 2024, 369, 122230. [Google Scholar] [CrossRef]
  10. Nie, X.; Li, X.J.; Lyu, C.; Su, Y.L.; Wang, H. Can ecological compensation based on the transfer of development rights (TDR) improve ecosystem service value? A multi-scenario simulation. Land Use Policy 2024, 138, 107024. [Google Scholar] [CrossRef]
  11. Niu, L.; Wang, J.-Y.; Xi, F.-M.; Yin, Y.; Bing, L.-F.; Ma, M.-J.; Zhang, W.-F. Regional ecological compensation accounting in Fuzhou City based on a payment for ecosystem services (PES) model. Chin. J. Appl. Ecol. 2021, 32, 3805–3814. [Google Scholar] [CrossRef]
  12. Ren, Y.F.; Zhang, L.B.; Wei, X.X.; Song, Y.; Wu, S.Y.; Wang, H.; Chen, X.; Qiao, Y.B.; Liang, T. Evaluating and simulating the impact of afforestation policy on land use and ecosystem services trade-offs in Linyi, China. Ecol. Indic. 2024, 160, 111898. [Google Scholar] [CrossRef]
  13. Wei, X.X.; Zhang, L.B.; Chen, X.; Wang, H.; Liang, T.; Ren, Y.F.; Song, Z.X.; Li, Y. Does cap-and-trade policy promote Forest cover? Evidence from China. J. Clean. Prod. 2024, 484, 144344. [Google Scholar] [CrossRef]
  14. Liu, M.C.; Yang, L.; Min, Q.W.; Sang, W.G. Theoretical framework for eco-compensation to national parks in China. Glob. Ecol. Conserv. 2020, 24, e01296. [Google Scholar] [CrossRef]
  15. Chen, M.K.; Xu, X.B.; Tan, Y.; Lin, Y.Y. Integrating ecosystem service spillovers and environmental justice in ecological compensation: A pathway to effective ecological protection in China. Ecol. Indic. 2025, 174, 113455. [Google Scholar] [CrossRef]
  16. Yang, H.J.; Gou, X.H.; Li, Z.L.; Wei, Y.X.; Shi, W.W.; Xue, B.; Maraseni, T. Assessing ecosystem services and their spillover effects to inform cost-benefit sharing and horizontal eco-compensation mechanisms in the Qilian Mountains, China. Ecosyst. Serv. 2025, 75, 101764. [Google Scholar] [CrossRef]
  17. Yang, Y.; Zhang, Y.Y.; Yang, H.; Yang, F.Y. Horizontal ecological compensation as a tool for sustainable development of urban agglomerations: Exploration of the realization mechanism of Guanzhong Plain urban agglomeration in China. Environ. Sci. Policy 2022, 137, 301–313. [Google Scholar] [CrossRef]
  18. Dimal, M.O.R.; Jetten, V. An integrated spatial econometric approach in valuing soil conservation using contingent valuation. Soil. Use Manag. 2021, 37, 377–389. [Google Scholar] [CrossRef]
  19. Ren, Y.S.; Lu, L.; Zhang, H.M.; Chen, H.F.; Zhu, D.C. Residents’ willingness to pay for ecosystem services and its influencing factors: A study of the Xin’an River basin. J. Clean. Prod. 2020, 268, 122301. [Google Scholar] [CrossRef]
  20. Cao, Y.J.; Li, X.C.; Liu, T.M. Analysis of Problems and Causes in Grassland Eco-compensation—Taking Xilinguole as a Case. Chin. J. Grassl. 2010, 32, 10–16. [Google Scholar]
  21. Hu, M.M.; Li, Z.T.; Wang, Y.F.; Jiao, M.Y.; Li, M.; Xia, B.C. Spatio-temporal changes in ecosystem service value in response to land-use/cover changes in the Pearl River Delta. Resour. Conserv. Recycl. 2019, 149, 106–114. [Google Scholar] [CrossRef]
  22. Dai, J.H.; Wang, H.J.; Wang, H.l.; Chen, C.Y. An Introduction to Framework of Assessment of the Value of Ecosystem Services. Prog. Geogr. 2012, 31, 963–969. [Google Scholar]
  23. Sun, J.; Liu, Y.; Zhou, T.C.; Liu, G.H.; Wang, J.S. Soil conservation service on the Tibetan Plateau, 1984–2013. Earth Env. Sci. Trans. R. Soc. Edinb. 2019, 109, 445–451. [Google Scholar] [CrossRef]
  24. Zhai, T.L.; Zhang, D.; Zhao, C.C. How to optimize ecological compensation to alleviate environmental injustice in different cities in the Yellow River Basin? A case of integrating ecosystem service supply, demand and flow. Sustain. Cities Soc. 2021, 75, 103341. [Google Scholar] [CrossRef]
  25. Gómez-Baggethun, E.; Muradian, R. In markets we trust? Setting the boundaries of Market-Based Instruments in ecosystem services governance. Ecol. Econ. 2015, 117, 217–224. [Google Scholar] [CrossRef]
  26. Wang, G.C.; Tian, K.K.; Sun, F.S.; Wang, K.F.; Zhang, T.P.; Cao, S.K.; Wang, S.W.; Zhang, G.; Wang, Q.; Zhang, R.H. Exploring the Practice of Horizontal Compensation for Ecological Benefits of Forest Resources—The Case of Linyi City, Shandong Province. Nat. Resour. Econ. China 2023, 36, 17–25. [Google Scholar] [CrossRef]
  27. Yang, X.; Chen, R.S.; Meadows, M.E.; Ji, G.X.; Xu, J.H. Modelling water yield with the InVEST model in a data scarce region of northwest China. Water Supply 2020, 20, 1035–1045. [Google Scholar] [CrossRef]
  28. Li, M.Y.; Liang, D.; Xia, J.; Song, J.X.; Cheng, D.D.; Wu, J.T.; Cao, Y.L.; Sun, H.T.; Li, Q. Evaluation of water conservation function of Danjiang River Basin in Qinling Mountains, China based on InVEST model. J. Environ. Manag. 2021, 286, 112212. [Google Scholar] [CrossRef]
  29. Qin, H.Y. Land Use Scenario Simulation and Ecosystem Service Prediction in Shandong Province. Ph.D Dissertation, Shandong University, Jinan, China, 2022. [Google Scholar]
  30. Zhu, G.F.; Qiu, D.D.; Zhang, Z.A.X.; Sang, L.Y.; Liu, Y.W.; Wang, L.; Zhao, K.L.; Ma, H.Y.; Xu, Y.X.; Wan, Q.Z. Land-use changes lead to a decrease in carbon storage in arid region, China. Ecol. Indic. 2021, 127, 107770. [Google Scholar] [CrossRef]
  31. Jiang, Y.; Alifujiang, Y.; Feng, P.P.; Yang, P.; Feng, J.P. A Simulated Assessment of Land Use and Carbon Storage Changes in the Yanqi Basin under Different Development Scenarios. Land 2024, 13, 744. [Google Scholar] [CrossRef]
  32. DB37_T 398-2004; Technical Regulation for Monitoring Desertification Land in Shandong Province. Shandong Provincial Bureau of Quality and Technical Supervision: Jinan, China, 2004.
  33. Huang, J.J.; Li, L.L.; Xu, L.Y. Regional ecosystem compensation based on spilled ecosystem service value assessment. Acta Ecol. Sin. 2021, 41, 6994–7001. Available online: https://www.ecologica.cn/stxb/article/abstract/stxb201906031173?st=search (accessed on 3 June 2025). [CrossRef]
  34. Gao, X.; Shen, J.Q.; He, W.J.; Zhao, X.; Li, Z.C.; Hu, W.F.; Wang, J.Z.; Ren, Y.J.; Zhang, X. Spatial-temporal analysis of ecosystem services value and research on ecological compensation in Taihu Lake Basin of Jiangsu Province in China from 2005 to 2018. J. Clean. Prod. 2021, 317, 128241. [Google Scholar] [CrossRef]
  35. Jin, Y.; Huang, J.F.; Peng, D.L. A new quantitative model of ecological compensation based on ecosystem capital in Zhejiang Province, China. J. Zhejiang Univ. Sci. B 2009, 10, 301–305. [Google Scholar] [CrossRef] [PubMed][Green Version]
  36. Xing, L.; Xue, M.G.; Wang, X.Y. Spatial correction of ecosystem service value and the evaluation of eco-efficiency: A case for China’s provincial level. Ecol. Indic. 2018, 95, 841–850. [Google Scholar] [CrossRef]
  37. Yuan, K.Y.; Li, F.; Yang, H.J.; Wang, Y.M. The Influence of Land Use Change on Ecosystem Service Value in Shangzhou District. Int. J. Environ. Res. Public Health 2019, 16, 1321. [Google Scholar] [CrossRef]
  38. Wunder, S. Payments for Environmental Services: Some Nuts and Bolts; Center for International Forestry Research, 2005; p. 24. [Google Scholar]
  39. Farley, J.; Costanza, R. Payments for ecosystem services: From local to global. Ecol. Econ. 2010, 69, 2060–2068. [Google Scholar] [CrossRef]
  40. Bagstad, K.J.; Semmens, D.J.; Waage, S.; Winthrop, R. A comparative assessment of decision-support tools for ecosystem services quantification and valuation. Ecosyst. Serv. 2013, 5, E27–E39. [Google Scholar] [CrossRef]
  41. Bukvareva, E.; Zamolodchikov, D.; Kraev, G.; Grunewald, K.; Narykov, A. Supplied, demanded and consumed ecosystem services: Prospects for national assessment in Russia. Ecol. Indic. 2017, 78, 351–360. [Google Scholar] [CrossRef]
  42. Chan, K.M.A.; Shaw, M.R.; Cameron, D.R.; Underwood, E.C.; Daily, G.C. Conservation planning for ecosystem services. PLoS Biol. 2006, 4, 2138–2152. [Google Scholar] [CrossRef]
  43. Wünscher, T.; Engel, S.; Wunder, S. Spatial targeting of payments for environmental services: A tool for boosting conservation benefits. Ecol. Econ. 2008, 65, 822–833. [Google Scholar] [CrossRef]
  44. Sheng, W.P.; Zhen, L.; Xie, G.D.; Xiao, Y. Determining eco-compensation standards based on the ecosystem services value of the mountain ecological forests in Beijing, China. Ecosyst. Serv. 2017, 26, 422–430. [Google Scholar] [CrossRef]
  45. Jack, B.K.; Kousky, C.; Sims, K.R.E. Designing payments for ecosystem services: Lessons from previous experience with incentive-based mechanisms. Proc. Natl. Acad. Sci. USA 2008, 105, 9465–9470. [Google Scholar] [CrossRef] [PubMed]
  46. Engel, S.; Pagiola, S.; Wunder, S. Designing payments for environmental services in theory and practice: An overview of the issues. Ecol. Econ. 2008, 65, 663–674. [Google Scholar] [CrossRef]
  47. Porras, I.; Barton, D.N.; Miranda, M.; Chacón-Cascante, A. Learning from 20 Years of Payments for Ecosystem Services in Costa Rica; International Institute for Environment and Development: London, UK, 2013. [Google Scholar]
  48. Pan, Q.; Wen, Z.; Wu, T.; Zheng, T.C.; Yang, Y.Z.; Li, R.A.; Zheng, H. Trade-offs and synergies of forest ecosystem services from the perspective of plant functional traits: A systematic review. Ecosyst. Serv. 2022, 58, 101484. [Google Scholar] [CrossRef]
  49. Pei, S.; Zhang, C.X.; Liu, C.L.; Liu, X.N.; Xie, G.D. Forest ecological compensation standard based on spatial flowing of water services in the upper reaches of Miyun Reservoir, China. Ecosyst. Serv. 2019, 39, 100983. [Google Scholar] [CrossRef]
  50. Pagiola, S. Payments for environmental services in Costa Rica. Ecol. Econ. 2008, 65, 712–724. [Google Scholar] [CrossRef]
  51. Tillman, S.C.; Matthews, J.W. Compliance with Regulatory Performance Standards in Wetland Mitigation Banks. Wetlands 2024, 44, 80. [Google Scholar] [CrossRef]
  52. Yan, N.Y.; Liu, G.Y.; Xu, L.Y.; Deng, X.Y.; Casazza, M. Emergy-based eco-credit accounting method for wetland mitigation banking. Water Res. 2022, 210, 118028. [Google Scholar] [CrossRef]
  53. Zhang, X.L.; Niu, C.H.; Ma, S.; Wang, L.J.; Hu, H.B.; Jiang, J. Exploring ecological compensation standards in the urbanization process: An ecosystem service value-based perspective. Ecol. Indic. 2024, 166, 112510. [Google Scholar] [CrossRef]
  54. Chi, C.; Shen, J.Q.; Gao, X.; Hu, P.; Yi, P. Horizontal ecological compensation standards based on ecosystem services flow. Ecol. Indic. 2024, 163, 112081. [Google Scholar] [CrossRef]
  55. Hamel, P.; Bryant, B.P. Uncertainty assessment in ecosystem services analyses: Seven challenges and practical responses. Ecosyst. Serv. 2017, 24, 1–15. [Google Scholar] [CrossRef]
  56. Rounsevell, M.D.A.; Arneth, A.; Brown, C.; Cheung, W.W.L.; Gimenez, O.; Holman, I.; Leadley, P.; Lujan, C.; Mahevas, S.; Marechaux, I.; et al. Identifying uncertainties in scenarios and models of socio-ecological systems in support of decision-making. One Earth 2021, 4, 967–985. [Google Scholar] [CrossRef]
  57. Stritih, A.; Bebi, P.; Grêt-Regamey, A. Quantifying uncertainties in earth observation-based ecosystem service assessments. Environ. Modell. Softw. 2019, 111, 300–310. [Google Scholar] [CrossRef]
  58. An, Z.Y.; Sun, C.Z.; Hao, S. Exploration of ecological compensation standard: Based on ecosystem service flow path. Appl. Geogr. 2025, 178, 103588. [Google Scholar] [CrossRef]
Figure 1. Location of the study area.
Sustainability 18 00643 g001
Figure 2. Research framework for forest ecological indicator trading price standard evaluation on the basis of ecosystem service value (WY: water yield; CS: carbon storage; SR: soil retention; WSF: windbreak and sand fixation; AQR: air quality regulation; PPM: pollutant purification model; the meanings of the formulas in the figure are listed in Section 3.2).
Sustainability 18 00643 g002
Figure 3. Spatial distributions of single ESV and total ESV in Linyi in 2017 (a) and 2021 (b).
Sustainability 18 00643 g003
Figure 4. Changes in the total ESV and ESV of different ecosystems in Linyi from 2017–2021 (Rapid increase: change in total ESV∈(27.48, 54.17] million CNY; significant increase: change in total ESV∈(10, 27.48] million CNY; slight increase: change in total ESV∈(0, 10] million CNY; slight decrease: change in total ESV∈(−10, 0] million CNY; significant decrease: change in total ESV∈(−27.48, 10] million CNY)).
Sustainability 18 00643 g004
Figure 5. The spillover situations of ESV in each county (district) of Linyi in 2021: (a) calculation based on the resident population; (b) calculation based on land area; (c) comprehensive calculation.
Sustainability 18 00643 g005
Table 1. Methods for measuring ecosystem service values.
Ecosystem ServicesPhysical Quantity Accounting ModelsMonetary Value Accounting Methods
Water YieldThe InVEST water yield model
Y x = 1 A E T x / P x P ( x ) , where Y(x) is the annual water production of image x in the study area in mm, AET(x) is the annual actual evapotranspiration of image x in mm, P(x) is the annual precipitation of image x in mm [27,28].
The replacement cost method
V w y = Q w y × C w e + P w e × D r , where Vwy is the value of water yield, unit: CNY/a; Qwy is the water yield, unit: m3/a; Cwe is the annual operating cost per unit storage capacity of the reservoir, unit: CNY/(m3·a); Pwe is the construction cost per unit storage capacity of the reservoir, unit: CNY/m3; Dr is the annual depreciation rate of the reservoir, unit: %. According to the Technical Guide for the Gross Ecosystem Product Accounting in Shandong Province, the construction cost and the annual operating cost per unit storage capacity of the reservoir are 100 CNY/m3 and 0.6 CNY/(m3·a), respectively; the annual depreciation rate of the reservoir is 4%.
Carbon StorageThe carbon storage module in the InVEST model
C t o t a l = C a b o v e + C b e l o w + C s o i l + C d e a d , where Ctotal is total carbon storage; Cabove is aboveground biomass carbon pool; Cbelow is belowground biomass carbon pool; Csoil is soil carbon pool; and Cdead is dead organic matter carbon pool. The above parameter values are from Qin [29] and are shown in Table S1.
The afforestation cost method
V c s = Q t C O 2 × C C O 2 , where Vcs is the value of ecosystem carbon storage, unit: CNY/a; QtCO2 is the amount of carbon storage in the ecosystem, unit: t·CO2/a; CCO2 is the cost per unit of afforestation-based carbon sequestration, unit: CNY/t·CO2, which is 960 CNY/t·CO2 according to the Technical Guide for the Gross Ecosystem Product Accounting in Shandong Province.
Air Quality RegulationPollutant purification model
Q a q r = i = 1 n j = 1 m A j × Q i j , where Qaqr is the amount of air pollutant purification, unit: t/a; Qij is purification amount of the jth type of ecosystem per unit area for the ith air pollutant, unit: t/km2·a; i is air pollutant category, including sulfur dioxide, nitrogen oxides, and dust, i = 1, 2, …, n; n is the number of air pollutant categories; j is ecosystem type, j = 1, 2, …, m; m is the number of ecosystem types; Aj is the area of the jth type of ecosystem, unit: km2.
The replacement cost method
V a q r = i = 1 n Q i × c i , where Vaqr is the value of air quality regulation, unit: CNY/a; Qi is the purification amount of the ith type of air pollutant, unit: t/a; ci is the unit treatment cost of the ith type of air pollutant, unit: CNY/t; i is the category of air pollutants, i = 1, 2, …, n; n is the number of air pollutant categories. According to Environmental Protection Tax Law of the People’s Republic of China, the treatment costs of sulfur dioxide, nitrogen oxides and dust are 6315.79 CNY/t, 6315.79 CNY/t and 300 CNY/t, respectively.
Soil RetentionThe Sediment Delivery Ratio (SDR) module of the InVEST model
Q s r = R K L S U S L E ,   R K L S = R K L S ,   U S L E = R K L S C P , where Qsr is the physical quantity of soil retention; RKLS is the potential erosion of the soil; USLE is the actual erosion of the soil. R is the rainfall erosivity, K is the soil erodibility, LS is the slope length-gradient factor, C is the crop-management factor, and P is the support practice factor [30,31].
The replacement cost method
V s r = V s d + V d n ,   V s d = λ × Q s r / ρ × c ,   V d n = i = 1 n Q s r × c i × p i , where Vsr is the value of soil retention, unit: CNY/a; Vsd is the value of sediment reduction, unit: CNY/a; Vdn is the value of soil nutrient retention, unit: CNY/a; λ is the sediment accumulation coefficient (dimensionless), which is 24%; Qsr is the amount of soil retention, unit: t/a; ρ is the bulk density of soil, unit: t/m3; c is the cost per unit of dredging, unit: CNY/m3; ci is the pure content of the ith type of nutrient (e.g., nitrogen, phosphorus) in the soil, unit: %; pi is the market price of the ith type of fertilizer, unit: CNY/t; i is the category of soil nutrients, i = 1, 2, …, n; n is the number of soil nutrient categories.
Windbreak and Sand FixationRWEQ model
Q s f = i = 1 n [ 0.1699 × W F × E F × S C F × K 1.3711 × ( 1 C 1.3711 ) × A i ] , where Qsf is the amount of windbreak and sand fixation, unit: t/a; WF is the climatic erosion factor, which refers to the comprehensive impact of various meteorological factors such as wind speed, temperature and rainfall on wind erosion, unit: kg/m; SCF is the soil crust factor, which refers to the ability of soil crust to resist wind erosion under certain soil physical and chemical conditions; K′ is the surface roughness factor, which refers to the influence of surface roughness caused by topography on wind erosion; C is the vegetation coverage factor, dimensionless; Ai is the area of the ith type of ecosystem, unit: km2; n is the number of ecosystem types.
The recovery cost method
V s f = Q s f / ρ × h × c , Vsf is the value of windbreak and sand fixation, unit: CNY/a; ρ is the soil bulk density, which is 1.32 t/m3; h is the sand cover thickness of soil desertification, unit: m. According to the Technical Regulation for Monitoring Desertification Land in Shandong Province (DB37/T 398-2004) [32], h with vegetation coverage > 70% is defined as 1 m, 50–70% as 0.5 m, 30–50% as 0.2 m, 10–30% as 0.05 m, 0–10% as 0–0.05 m, unit: m; c is the unit desertification control cost from the national forestry department, which is 500 CNY/m3.
Table 2. Data and sources.
Data TypeData NameSourceResolution
Remote Sensing DataLand use/coverSupervisory classification using Google Earth Engine [12]30 m
DEMGoogle Earth Engine Data Catalog1 km
Soil propertiesHarmonized World Soil Database1 km
Meteorological and Hydrological DataPrecipitationNational Earth System Science Data Center (https://www.geodata.cn/ (accessed on 3 June 2025))-
Potential evapotranspiration-
Wind speed-
Socioeconomic dataResident PopulationLinyi Statistical Yearbook” (2018, 2022, 2024)-
GDP-
Fiscal Revenue-
Per Capita GDP-
Engel’s Coefficient-
Table 3. Ecosystem service payments or receipt amounts for each county (district) of Linyi in 2021.
County TypeCountyESSV (Million CNY)TNKC (104 CNY)
ESs supply zoneMengyin County1085.020.093.100.031102
Yishui County1033.010.051.270.09602
Junan County722.910.061.910.06484
Pingyi County432.410.071.400.05199
Fei County350.640.041.910.08197
Yinan County375.100.061.090.05124
Linshu County5.900.040.610.041
ESs payment zoneLanshan District−657.350.021.040.06858
Lanling County−657.420.012.000.10789
Hedong District−473.850.012.260.11423
Luozhuang District−717.990.041.810.06356
Tancheng County−1498.440.011.300.24284
Disclaimer/Publisher’s Note: The statements, opinions and data contained in all publications are solely those of the individual author(s) and contributor(s) and not of MDPI and/or the editor(s). MDPI and/or the editor(s) disclaim responsibility for any injury to people or property resulting from any ideas, methods, instructions or products referred to in the content.