Abstract
The Silicon Alley model is enhancing neighborhood competitiveness through cultural and technological innovation, while the living experience of its inhabitants serves as a critical foundation for sustainable development. This study investigates neighborhoods developed under the Silicon Alley framework. It explores theoretical models and practical pathways that use inclusive design to enhance public facilities and service strategies, ultimately aiming to build a sustainable living experience system. Utilizing a combined LDA-DEMATEL-ISM-MICMAC methodology, the research first identifies seven key factors influencing living experience from multi-source texts, spanning social, technological, emotional, and governance dimensions. It then reveals the cause-effect relationships, hierarchical structure, and driver-dependency mechanisms among these factors. The findings indicate that sustainable collaborative governance acts as a fundamental driver, diversified community experience and urban attractiveness serve as intermediate transmission factors, while Elderly-Friendly Livelihood Experience, Digital Block Experience, Artistic Life Scene Experience, and Local Cultural and Historical Experience function as surface-level outcome factors. The study proposes short-term priorities focusing on collaborative governance and social integration, and long-term strategies emphasizing livelihood services and cultural identity. These recommendations are intended to enhance neighborhood living experience, promote inclusive and sustainable urban renewal, and provide both theoretical insights and practical guidance for achieving sustainable neighborhood development.
1. Introduction
In the context of the global rise in urban regeneration concepts such as the Silicon Alley model, innovation and entrepreneurship have become a significant driving force for high-quality urban economic development. Particularly in the era of urban development dominated by stock revitalization, urban renewal models represented by the Silicon Alley approach have paved innovative and practical pathways for functional enhancement and structural transformation of urban blocks. Especially in the era of inventory development, they provide a new path for district upgrading and transformation. However, in this process, social welfare development has become a key criterion for measuring the success of new-type urban renewal [1]. Rapid urbanization has led to high population agglomeration and large-scale population mobility [2], which not only exerts severe pressure on urban resources, infrastructure, and quality of life, but also exacerbates differences in cultural backgrounds and cognitive styles among different social groups against the backdrop of the influx of industries and talents. While individual differences present a key challenge to urban inclusivity, fostering inclusivity itself has emerged as a primary means of resolving conflicts stemming from these differences. In this context, inclusive design emerges as an important approach to balancing individual differences and urban development. By identifying and responding to individual and group needs, it aims to eliminate barriers in spatial planning and service provision, thereby enhancing the quality of life experiences and fostering social integration. Achieving a balance between individual differences and urban inclusivity is an important factor in achieving the sustainable development of new-type urban renewal such as Silicon Alleys, continuously shaping human living experiences and improving overall well-being.
Therefore, how to grasp the specific dimensions of residents’ living experiences in cities, narrow individual differences, and safeguard the rights and well-being of individuals in Silicon Alley districts has become an important approach to promoting social integration and enhancing public well-being, as well as a key issue for Silicon Alley districts to achieve sustainable development. Adopting inclusive design as its core theoretical framework, this study focuses specifically on life experiences within Silicon Alley environments. It aims to systematically explore the intrinsic mechanisms through which inclusive design operates in these contexts, addressing a critical research gap regarding how tailored inclusive strategies can systematically enhance life experiences within innovative spatial configurations. Ultimately, this research provides new pathways for advancing urban renewal practices rooted in well-being.
Taking urban renewal as an opportunity, the Silicon Alley district model activates inventory space to attract the agglomeration of technology and creative enterprises, forming an embedded and high-density innovation and entrepreneurship district that realizes the symbiotic development of communities, campuses, and districts [3]. Currently, research and practice on Silicon Alley districts focus on dimensions such as entrepreneurship incentives [4], industrial revitalization [5], entrepreneurial passion [6], and investment management [7]. These efforts still center on district economic development, while generally neglecting the living experience and well-being development of residents. In particular, there remains a clear gap in the literature regarding how to improve quality of life through facility construction and service support. However, only by considering the living well-being of district residents can the sustainable development of the district be ensured. The rapid development of district economy and the rapid integration of talents have also triggered reflections on the living well-being of more groups. Social structure changes caused by urban transformation will lead to social exclusion and digital divide [8], making it an urgent core issue to balance economic vitality and social equity, and enhance residents’ sense of life happiness.
Against this background, inclusive design offers a crucial theoretical perspective and practical pathway to address the aforementioned challenges. It emphasizes balancing diverse needs in spatial planning and service provision [9,10] to shape inclusive urban spaces and services. However, although the concept of inclusivity has been widely applied in urban renewal, current research mostly focuses on theoretical construction or macro-level strategies [11,12], with limited translation of principles into practice. In the specific context of Silicon Alley districts, which represent an innovative spatial form, the mechanisms through which inclusive design can systematically enhance lived experiences remain underexplored. Understanding its key drivers and underlying processes continues to represent a significant research gap. Therefore, the main objectives of this study are as follows: (1) based on a comprehensive understanding of the Silicon Alley model and inclusive design methods, to identifying the key driving factors in the social system; (2) to establish causal relationships, hierarchical structures, and driving-dependence relationships; and (3) to propose specific measures and paths that help policymakers and relevant institutions develop targeted strategies to improve residents’ living experience.
Given the multidimensional and multi-level nature of the factors and relationships involved in this study, a single research method is insufficient. While traditional confirmatory methods such as Structural Equation Modeling (SEM) excel in testing predefined theoretical hypotheses, their reliance on strong prior assumptions and observed variables limits their flexibility in capturing potential nonlinear causal networks within emerging, loosely bounded systems like Silicon Alleys, where inter-factor relationships are not yet fully understood. To directly bridge this gap, the present study introduces an innovative integrated framework that synergizes LDA, DEMATEL, ISM, and MICMAC. This methodology is conceived not merely as a set of analytical tools, but as a systematic epistemology to dissect the complex, latent structure of living experience. It addresses the core limitation of prior research by progressing from a static identification of factors to a dynamic exposition of their causal interlinkages, hierarchical architecture, and strategic roles within the system. Consequently, this framework translates the abstract principles of inclusive design into a decipherable and actionable strategy map, offering a novel, evidence-based pathway for enhancing urban living experience. This research fills a void that has remained in the extant body of work on Silicon Alley and inclusive urban renewal.
2. Relevant Research and Theoretical Foundations
2.1. Concept of the Silicon Alley Model
The term “Silicon Alley” first emerged in the mid-1990s, initially referring to a cluster of new media technology startups located around Madison Square in Manhattan. This concept originated from the physical alleyways connecting Midtown and Lower Manhattan, and later expanded to other areas [13]. By comparing Silicon Alley with Silicon Valley and sorting out its development process, Jiang et al. pointed out that its core lies in the district structure facilitating the integration of cross-domain technical solutions. Silicon Alley is envisioned as a borderless technology entrepreneurial district, developing in accordance with a city-centered industrial transformation paradigm [14]. Silicon Alley districts, supported by a combination of economic drivers such as markets, talent, and local environment, have demonstrated strong economic resilience, enabling it to recover rapidly after the 2000 economic bubble [15,16]. It can be seen that the harmonious coexistence between people and the city is the key to the sustainable development of Silicon Alley districts. Moreover, an adaptive urban environment that promotes collective well-being has become an indispensable element in the process of transforming such districts into composite spaces influenced by livelihoods, culture, and the environment [17,18,19].
As an important carrier for bearing behavioral activities, the district environment in Silicon Alley has a close connection between its spatial composition, well-being, and economic development. The composite nature of spatial types in Silicon Alley has created mixed identities for different participants in the district, transcending traditional boundaries [20]. At the same time, district infrastructure also supports urban innovation; under the integration of multiple subjects within the district, participants in urban innovation have greater advantages in ideological innovation compared to those in traditional districts [21]. Benefiting from the dual empowerment of livelihoods and technological innovation, the district has also gained the value recognition of participants with mixed identities due to its internal culture and diversity [22], thereby enhancing urban attractiveness and promoting the sustainable development of the district. Existing research typically identifies economy, society, environment, and governance within the district are regarded as the four pillars of its development, These studies emphasize how connectivity between creative, administrative, commercial, natural, and built environments plays a crucial role in linking local and global networks [23]. Despite this foundational work, the inherent relationship between “individual diversity” and “urban attractiveness” emerging from the district’s composite nature remains understudied in the Silicon Alley context. More critically, within Silicon Alley’s highly integrated system where economic and living functions deeply intertwine [24], academic attention remains disproportionately focused on economic development. The multidimensional nature of residents’ lived experiences and their systemic composition continue to be largely overlooked.
In summary, existing literature predominantly focuses on the developmental model of Silicon Alley, yet fails to uncover the underlying mechanisms through which various dimensions of factors influence lived experiences within these districts. Specifically, the causal relationships and hierarchical structures among these factors remain unclear. This research bias may lead to practical missteps. Under rapid development, if the allocation of commercial activities and facilities becomes disconnected from residents’ actual needs and capabilities, it may not only fail to accurately enhance well-being but could also result in resource misallocation and social exclusion [25]. This necessitates that neighborhood design implement precise, acupuncture-like interventions based on the cognition and behavior of district participants to conduct acupuncture-like district design. Simultaneously, it is crucial to recognize that residents’ life satisfaction and neighborhood economic development are mutually reinforcing. Effective district governance drives both economic growth and quality of life systems [26,27]. Therefore, it is necessary to develop sustainable development governance strategies for district environment construction by integrating the functions and needs of multiple stakeholders [28]. However, even under sound macro-level governance, underlying issues such as group conflicts, individual needs, and cultural factors may still be overlooked, potentially negatively impacting the life satisfaction of grassroots participants [29].
Faced with these challenges, there is a pressing need for an integrated and targeted research approach to guide cities in enhancing the lived experiences of diverse groups through environmental and service improvements, thereby ensuring sustainable neighborhood development. However, the complexity and multi-layered nature of lived experience perceptions make it particularly difficult to systematically identify and leverage key enhancement factors. This constitutes the core problem addressed by our study: namely, to employ a systematic methodology that reveals the internal mechanisms through which various dimensions influence lived experience. By doing so, we aim to effectively promote the enhancement of lived experience across multiple life domains, ultimately advancing sustainable urban development in Silicon Alley districts.
2.2. Inclusive Design
Resolving conflicts among diverse groups is a key step in enhancing the living experience of district participants. Inclusive design has made significant contributions to promoting group capabilities and psychological inclusion [30], and can serve as an effective solution to this challenge. Coleman, R (1994) first proposed the concept of inclusive design, arguing that it emerged in response to the call for special groups such as the elderly and people with disabilities to integrate into mainstream society. Its aim is to meet the needs of diverse users through design and achieve design equality [31]. Based on the equality of behavioral capabilities, its connotation has been supplemented by Western philosophical thinking. Kant’s “universal law” emphasizes the universality and equality of behaviors, advocating respect for and inclusion of diverse individuals; Rousseau’s social contract theory emphasizes freedom and equality, focusing on the interests of all members of society; Locke’s natural rights theory highlights individual freedom and equal rights, laying the foundation for the concepts of democracy and human rights [32]. Building on this, Li et al. argue that user diversity is reflected not only in the distribution of individual differences but also in changes in needs and capabilities across different contexts under social backgrounds [33,34]. They further proposed the concept of “marginal equality”, which enables design objects to adapt to and meet diverse and differentiated needs through design means, thereby providing similar safeguards for individuals with similar needs [35]. Therefore, inclusive design methods can be extended horizontally in two dimensions: demand inclusivity and capability inclusivity [36]. Its core lies in the creative transformation from abstract ethical principles to concrete technical ethics, which makes inclusive design not only a means to address individual exclusion but also a pathway to achieve social justice and individual dignity.
Despite widespread recognition of inclusive design’s value, significant challenges remain in translating theoretical frameworks into actionable strategies. Current research has yet to effectively integrate equality of needs into practical governance mechanisms for neighborhood development, preventing the refined application of inclusive design in complex real-world contexts. However, it is still necessary to find practical approaches to materialize its requirements, particularly through sustainable urban renewal models that capture participants’ actual needs while providing applicable scenarios for inclusive design. Ultimately, this approach would enable neighborhood environments to offer inclusive support for both residents’ behavioral capabilities and psychological well-being from an urban environmental perspective.
Currently, international organizations have developed standardized definitions for inclusive design. For example, the UK’s Commission for Architecture and the Built Environment (CABE) published Inclusive Design Principles (2006), which aims to create places usable by everyone and eliminate barriers to use caused by inappropriate design in the environment [10]. Some scholars also argue that an inclusive city must be built on the premise of creating just spaces, well-being, and environmental responsibility [37]. From an international perspective, UN-Habitat has updated the content of the World Cities Report in 2000, 2016, and 2022, respectively, with a shift in focus from emphasizing spatial safety development to calling for strengthened organizational cooperation, green investment, inclusive planning, and technological innovation. It also focuses on the needs of vulnerable groups and constructs a multi-dimensional urban resilience framework involving multiple stakeholders [38]. It can be seen that an increasing number of subjects and needs are being incorporated into the dimensions of inclusive cities [39]. Although the dimensions of an inclusive city are clearly distinguished, they are intertwined and mutually reinforcing, thereby influencing the overall inclusivity of the city [40]. However, macro-level definitions risk disconnecting from neighborhood realities by systematically overlooking cultural, economic, and demographic variations [41]. Since lived experience represents a quintessential local expression, embedding authentic urban life experiences into the definition process of inclusive design dimensions becomes particularly crucial. Therefore, this study supplements the dimensions of inclusive design from the perspective of the living experience of urban participants, and its detailed research contributes to the complex and broad concepts of inclusive design and inclusive cities.
While significant progress has been made in research on inclusive cities and the Silicon Alley model, no study has yet systematically identified and categorized the dimensions of lived experience within the specific context of such innovation districts. This research positions the Silicon Alley model serves as a carrier for the living experience of district participants, leveraging its distinctive blend of cultural vitality and technological innovation. From the perspective of well-being enhancement, the study employs text mining and expert surveys to develop a hierarchical structure of lived experience that integrates both well-being and productive capacity. This approach offers a new perspective for discussing inclusive design under the new urban development model, and Silicon Alley districts have also become fertile ground for the development of the inclusive design concept in the context of urban renewal.
3. Research Process
3.1. Method
This study adopts the LDA-DEMATEL-ISM-MICMAC combined model approach to investigate the influencing factors of the dimensions of inclusive design for living experience in Silicon Alley model districts.
LDA serves as a foundational word clustering technique that identifies latent semantic structures by grouping vocabulary items [42]. Initially proposed by Blei et al. [43], it constructs a three-layer topic topological structure consisting of documents, topics, and feature words. Based on the Bayesian probability framework, this model addresses the uncertainty of topic distribution by introducing Dirichlet prior distribution and has extensive application value in fields such as text classification, information retrieval, and sentiment analysis. While LDA proves effective in identifying key contextual factors, it cannot adequately reveal the intricate relationships between them. Conversely, though traditional expert surveys can establish consensus, their factor selection often relies heavily on the researcher’s subjectivity, creating potential risks of omitting crucial variables.
To address this gap, the study integrates LDA with DEMATEL to uncover causal relationships among identified factors. DEMATEL, originally developed by Gabus and Fontela, is a factor analysis tool for complex system decision-making visualized through matrices or directed graphs. It is used to explore relationships between various factors in complex systems and clarify the importance of each factor within the system [44]. By combining LDA-identified key elements with systematic expert evaluation, this integrated approach enables in-depth analysis and quantification of causal relationships. The methodology effectively mitigates random errors and individual biases inherent in single-expert judgments. This dual approach ensures both comprehensiveness in factor identification and accuracy in causal determination, leveraging the complementary advantages of computational analysis and collective expert judgment.
However, the influence networks constructed by DEMATEL can become visually cluttered when handling numerous factors, making it difficult to discern the system’s core structure and influence pathways. To address this limitation, ISM is introduced to provide systematic structural decomposition of DEMATEL outputs. Proposed by Warfield, ISM transforms complex inter-element relationships into clear multi-level hierarchical models, revealing complete influence pathways from deep driving factors to surface-level manifestation factors [45]. While ISM effectively visualizes the complete transmission pathways from fundamental drivers to surface outcomes, the resulting management implications often remain somewhat abstract. The method lacks explicit classification of factors’ strategic attributes, making it challenging to identify precise intervention points for decision-makers. Consequently, this study further incorporates MICMAC analysis. Originally proposed by Michael Dodet [46], is a classification method based on cross-impact matrices from ISM. In this method, the importance of variables is evaluated by the quantity and intensity of their relationships, and it can be used to analyze relationships between dimensions of living experience [47]. This final step transforms the systematic analysis outcomes directly into actionable governance strategies with clear implementation priorities.
The integrated DEMATEL-ISM-MICMAC approach has been applied in research fields such as rural revitalization [48], risk assessment [49], and behavioral relationships [50]. In this study, based on the mining and identification results of the LDA topic model, the DEMATEL method is used to construct a network of factors influencing living experience in Silicon Alley model districts from an inclusive perspective, and to calculate the cause degree and centrality degree of each factor, thereby quantitatively analyzing the interactions and influence degrees between factors in the system. The ISM method is then adopted to establish a hierarchical model of these influencing factors, analyzing the roles of topics at different levels as well as the hierarchy and structure of the entire system. Subsequently, the MICMAC method is used to analyze the driving power and dependence of each factor. The specific research path is shown in Figure 1.
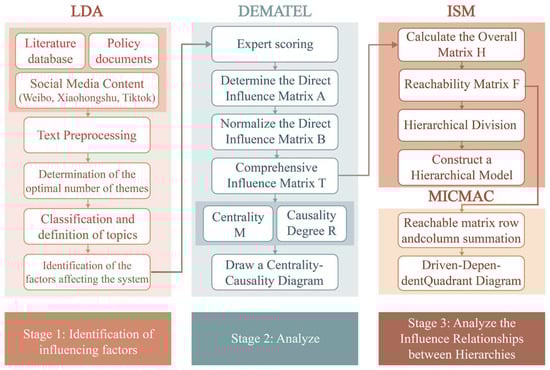
Figure 1.
Research Path Diagram.
3.2. Calculation Process of the LDA Analysis Method
During the LDA modeling process, this study determines the optimal number of topics based on multiple indicators such as perplexity and topic coherence. By setting different numbers of topics, the corresponding perplexity values are calculated, and a balance is struck between the minimum perplexity and peak coherence. Topic coherence is a key indicator for evaluating the topic interpretability of the LDA model. Its core function is to quantify the semantic relevance of words under the same topic, providing a semantic-level basis for the selection of the number of topics (K). Topic coherence often jointly influences the selection of the optimal number of topics together with perplexity, and the coherence calculation Formula (1) is as follows:
Among the variables, denotes the set of the top M high-frequency words for topic k, where . represents the occurrence frequency of word in the entire corpus, and denotes the co-occurrence probability of word and word in the same document. Meanwhile, as a recognized indicator, perplexity also affects the topic clustering performance of the LDA model and the number of topics K, playing a crucial role in determining the optimal number of topics. Perplexity is a deterministic indicator used by the model to distinguish between topics; it reflects whether the model is applicable to new samples and whether it can correctly distinguish topic classifications. A lower perplexity indicates better model training performance. Its calculation Formula (2) is as follows:
Among the variables, denotes the set of test set documents, represents the number of words in document d, denotes the posterior probability of document d under topic k, represents the posterior probability of word v generated by topic k, and denotes the observed value of the i-th word in document d. The perplexity value reflects the classification performance of the model on feature words in documents. A smaller perplexity value indicates stronger generalization ability of the model, while a larger perplexity value indicates poorer model training performance and weaker generalization ability.
3.3. Calculation Process of the DEMATEL Analysis Method
In this study, specific values (4, 3, 2, 1, 0) were employed to quantify the intensity of influence between dimensions. By inviting experts to assess the strength of inter-dimensional relationships and averaging their evaluations, the direct influence matrix A was determined, as shown in Equation (3):
Based on the direct influence matrix A, the matrix is first normalized to obtain the normalized influence matrix B, as shown in Equation (4). Subsequently, the total influence matrix T is constructed to quantify the comprehensive interactions among the systemic factors (where I denotes the identity matrix), as formulated in Equation (5):
3.4. Calculation Method of the ISM Model
Based on the results of the DEMATEL method, a hierarchical model for the inclusive dimensions of living experience in Silicon Alley districts is established. This model analyzes the roles and dependence of each dimension at different levels, as well as the hierarchical structure of the entire system. First, the Total Influence Matrix H is constructed. This matrix is composed of the Comprehensive Influence Matrix T and the Identity Matrix I, as shown in Formula (10):
To filter out weak influence relationships and simplify the system structure, a threshold value λ is determined by calculating the “mean + standard deviation” (μ + σ) of the total influence matrix T. The method widely used in relevant research [51]. It can retain major influence relationships while effectively reducing interference from minor relationships, making the generated hierarchical structure clearer and more reasonable. The calculated mean and standard deviation are 1.9618 and 0.1897, respectively, yielding a λ value of 2.15151 for this study (see Appendix A for detailed calculations).
Based on the obtained threshold, the total influence matrix H can be converted into the reachability matrix F, as shown in Equation (7):
Based on the Reachability Matrix F, the Reachability Set R(Si), Antecedent Set A(Sj), and Common Set C(Si) are determined. Specifically, the Reachability Set R(Si) includes all elements equal to 1 in each row of the Reachability Matrix F while the Antecedent Set A(Sj) includes all elements equal to 1 in each column of F. The Common Set C(Si) is defined as the intersection of R(Si) and A(Sj), expressed as C(Si) = R(Si)∩A(Si), as shown in Formulas (8)–(10). This process ultimately helps construct the ISM structural model, which is used to analyze the relationships among factors influencing the living experience in Silicon Alley districts:
3.5. Calculation Process of the MICMAC Analysis Method
MICMAC analysis aims to identify the characteristics of various factors within a system through a driving power-dependence power matrix [52]. This analysis is performed based on the reachability matrix F obtained from the ISM analysis. The driving power of a factor refers to the extent to which it influences other factors in the system, calculated as the row sum of the corresponding factor in the reachability matrix, as shown in Equation (11), where Di represents the driving power of factor i, n denotes the total number of factors, and fij is the value of element (i,j) in the reachability matrix. The dependence power indicates the degree to which a factor is influenced by other factors, calculated as the column sum of the corresponding factor in the reachability matrix, as shown in Equation (12), where Ci represents the dependence power of factor i:
The MICMAC analysis method visualizes interdependencies among factors through a coordinate system, where the x-axis represents dependence power and the y-axis represents driving power. This approach categorizes factors into four distinct quadrants: the linkage dimension (I), containing elements with both high driving power and high dependence power, serving as both drivers and dependents; the dependent dimension (II), comprising elements with low driving power but high dependence power, indicating strong reliance on other factors; the autonomous dimension (III), consisting of elements with both low driving power and low dependence power, maintaining relative independence within the system; and the independent dimension (IV), featuring elements with high driving power but low dependence power, acting as primary drivers of the system [53]. Based on this classification framework, the subsequent analysis will elucidate the specific role each factor plays within the system.
Furthermore, this study calculates the influence degree () and being-influenced degree () of each factor based on the total influence matrix T, as shown in Equations (13) and (14). The centrality () and cause degree () are subsequently determined. Centrality, representing a factor’s overall significance within the system, is calculated as the sum of its influence degree and being-influenced degree, which is . The cause degree, indicating the extent to which a factor serves as a driver rather than a dependent element, is derived as the difference between its influence degree and being-influenced degree, which is .
Based on these calculations, this study presents a centrality-cause degree distribution plot (see Appendix B for complete computational details). This two-dimensional visualization uses coordinates (Mi, Ri), with centrality (Mi) on the horizontal axis and cause degree (Ri) on the vertical axis. Such visual representation simplifies complex causal structures into an intelligible format, facilitating the identification of key drivers and outcomes within the system. The plot thereby provides clear directions for in-depth problem understanding and supports informed decision-making.
4. Data Analysis Results
4.1. Identification of Influencing Factors Based on the LDA Topic Model
4.1.1. Data Crawling and Preprocessing
To capture the living experience of Silicon Alley model districts from academic and daily life perspectives, the study’s corpus includes two parts: (1) Academic texts: Sourced from CNKI, Web of Science and other databases, retrieved via keywords, including “Silicon Alley model”, “quality of life”, “inclusive design”, with 125 relevant papers finally selected. (2) Public comment texts: Posts and comments on “Silicon Alley”, “living districts”, “urban walking” and other topics were crawled from Xiaohongshu, Weibo and Douyin. After deduplication and cleaning, 2800 valid texts, totaling 155,118 characters were obtained. Preprocessing was conducted to filter out non-thematic content like numbers, English and special characters.
All information was organized and saved as CSV files. The acquired data, after preprocessing, was imported into Anaconda Navigator. Python’s Jieba library was used for word segmentation to split the original corpus; a stop-word list was set to remove irrelevant Chinese words, and a keyword list was established to retain topic-related proper nouns. Subsequently, based on Python’s Gensim library, the LDA model was applied for keyword analysis on the living experience of Silicon Alley model districts.
4.1.2. Determination of the Optimal Number of Topics
Prior to conducting LDA-based hot topic analysis, determining the optimal number of topics requires a comprehensive approach. This study adopted an integrated strategy that combines multiple metrics with critical evaluation of topic semantic interpretability, rather than relying on any single indicator. The topic number parameter space was explored within the range of 0–12, with both coherence and perplexity scores calculated for each candidate topic number. The results revealed two distinct local minima in the perplexity curve at K = 3 and K = 7 (Figure 2), indicating relatively good model fit at these topic numbers. However, lower perplexity alone does not necessarily guarantee superior model performance in LDA applications, as it may coincide with overfitting risks. These local minima therefore served merely as statistically informed candidate points for preliminary screening. The final determination required integrated judgment incorporating both topic coherence metrics and semantic interpretability assessment.
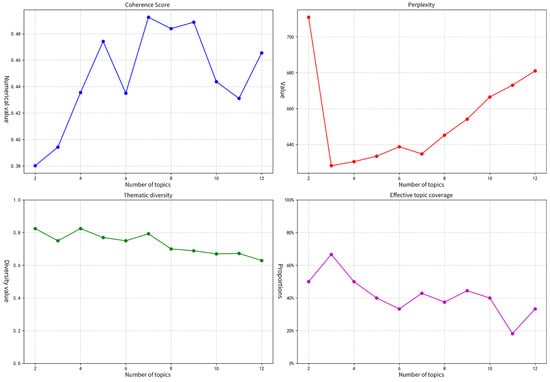
Figure 2.
Perplexity, Coherence, Diversity, and Coverage of the Topic Model.
Regarding coherence metrics, the score at K = 3 remained in an ascending phase, while K = 7 achieved the global peak, indicating strongest semantic cohesion within topics at this configuration. Furthermore, this study introduced topic diversity and effective topic coverage as supplementary evaluation dimensions. Topic diversity, reflecting the distinctiveness of core vocabulary across different topics, demonstrated a plateau beyond K = 7, suggesting that additional topics would introduce redundancy and increase semantic overlap. Effective topic coverage, measuring how comprehensively the topic set represents the corpus content, showed that K = 7 already captured the core semantic domains effectively. Further increasing K provided diminishing returns in coverage while compromising model parsimony and interpretive efficiency.
Beyond statistical metrics, qualitative assessment of semantic validity and research applicability remains essential for evaluating topic interpretability. At K = 3, each topic exhibited excessive breadth, simultaneously containing high-frequency terms spanning economic, governance, cultural, welfare, technological, and esthetic domains—including “industry”, “policy”, “culture”, “age-friendly design”, “smart technology”, and “art”. This conceptual overlap created definitional ambiguity that prevented clear thematic identification and labeling. Such broad categorization would compromise practical guidance for specific issues and lead to loss of critical semantic information. In contrast, at K = 7 the vocabulary sets demonstrated distinct focus areas with clear semantic boundaries. The seven emerging themes displayed stable differentiation, each corresponding to a relatively independent yet significant dimension of lived experience in Silicon Alley districts. This well-structured thematic configuration establishes a reliable foundation for extracting operational research variables in subsequent analysis.
Integrating quantitative analysis of statistical indicators with qualitative verification at the semantic level, the optimal number of topics was ultimately determined to be seven. This selection achieves an optimal balance between model fitting performance and semantic interpretability while satisfying the constraints of topic diversity and coverage. It ensures the constructed topic system exhibits sufficient internal distinctiveness while comprehensively and effectively reflecting the structural characteristics of the textual content.
4.1.3. LDA Model Training
In this study, LDA was trained on the preprocessed text corpus using Python’s Gensim library, with visualization implemented via the pyLDAvis package as illustrated in Figure 3. This tool integrates significance calculation from the Termite method [54] and correlation measurement from LDAvis [55]. It evaluates and presents keyword importance through two dimensions namely global discriminability that reflects distinctiveness across all topics and intra-topic specificity that denotes relevance within a specific topic. Such an approach enables interactive interpretation of thematic semantics. In the visualization interface, left-side bubbles represent different topics and their size reflects the relative prevalence of corresponding topics in the corpus. The right panel displays the most relevant terms for the selected topic. Blue bars indicate each term’s global occurrence frequency across the entire corpus while red bars represent the term’s salience within the specific topic.
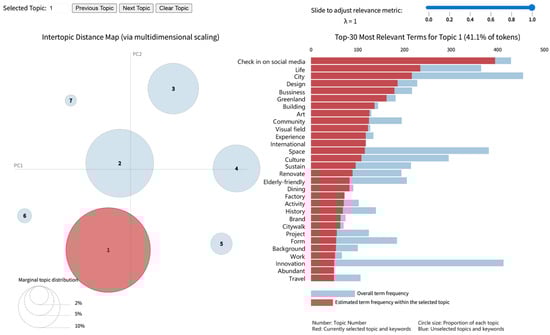
Figure 3.
pyLDAvis Visualization.
In the textual analysis focusing on the Silicon Alley model and lived experience, the optimal number of topics was determined as seven through the comprehensive evaluation described previously. The visualization results indicate that among these seven topics, Topic 1 demonstrates the greatest prevalence, suggesting its broad representation in the corpus, while Topic 7 shows the smallest proportion, reflecting its more specialized or peripheral nature.
After classifying and summarizing relevant literature using LDA analysis results, the study analyzed the feature word topics. For each topic, the top 10 words with the highest probability were extracted, sorted in descending order of weight, and used to describe the topic. A comprehensive analysis of each topic was then conducted, integrating literature insights and the connotations of the selected words. Partial LDA training results are presented in Table 1.

Table 1.
Extracted Results of Key Thematic Concepts for Living Experience in the Silicon Alley Model.
By comprehensively analyzing topic words such as “check-in”, “life”, “city”, and “design”, and drawing on Sun’s [56] research on urban living spaces, Topic 1: “Artistic Life Scene Experience” was summarized. This topic emphasizes the importance of building living scenes rooted in visual art, underscoring how urban visuals drive urban vitality. Integrating words like “culture”, “elderly-friendly”, “intelligence”, and “development” with the findings of An et al. [57], Topic 2: “Elderly-Friendly Livelihood Experience” was identified. It highlights the core of innovation in Silicon Alley model districts, which entails not only modernizing local culture but also providing inclusive intelligent services for residents in old urban areas, while emphasizing the mutually reinforcing relationship between “city-oriented” and “people-oriented” principles in district development. By combining words such as “industry”, “economy”, “talent”, and “education” with Ramlee et al.’s [58] research, Topic 3: “Urban Attraction Experience” was summarized. This topic reflects how a district’s living experience helps attract and retain talent, and stresses the critical role of the social environment in reintegrating the tech industry into urban areas under the Silicon Alley model, which lays the groundwork for the sustainable development of Silicon Alley districts. Drawing on words like “industry”, “phoenix tree”, “warmth”, and “support”, and Kuo and Wu’s [59] research on urban characteristic industries, Topic 4: “Local Cultural and Historical Experience” was identified. It emphasizes the role of urban characteristic elements in advancing the industrial development of Silicon Alley districts: local elements foster a sense of urban belonging for the district’s characteristic industries, provide local resources for the regional cultural tourism industry, and enhance urban functions and innovative vitality through humanistic warmth. By integrating words such as “check-in”, “life”, and “digital” with Lane’s [60] research, Topic 5: “Digital Block Experience” was summarized. This topic reveals the shift in social patterns among residents and tourists, the social value of urban environments beyond their functional use, and notes that digitalization has become a defining feature of living experiences under the Silicon Alley model. Combining words like “university”, “citywalk”, and “diversity” with Chen et al.’s [61] research, Topic 6: “Diverse Community Experience” was identified. It emphasizes the importance of creating opportunities for emotional interaction in living districts and argues that Silicon Alley districts should prioritize humanistic care and diverse social activities to increase residents’ social engagement. By integrating words such as “enterprise”, “team”, and “collaboration” with Peng et al.’s [62] research, Topic 7: “Sustainable Collaborative Governance” was summarized. This topic points out that collaborative governance among organizations from all sectors of society jointly drives the sustainable development of Silicon Alley districts.
Second, according to the bubble chart (Figure 3), Topics 5, 6, and 7 account for a relatively small proportion and appear as secondary themes. This indicates that existing studies have conducted preliminary discussions on relevant issues, but their depth and breadth still need to be enhanced. Topics 1, 2, 3, and 4 have a high topic coverage rate and occupy a significant proportion in the document data, which confirms their research popularity and significance in studies related to the living experience of the Silicon Alley model.
To ensure the accuracy of influencing factors, this study invited experts from the government, academia, and enterprises to conduct online discussions. These experts put forward suggestions on merging, revising, or deleting the identified driving factors, and the 7 thematic elements were integrated. For example, Elderly-Friendly Livelihood Experience and Diverse Community Experience were classified into the social relationship dimension; Digital Block Experience was defined as the technical carrier dimension; Artistic Life Scene Experience, Urban Attraction Experience, and Local Cultural and Historical Experience were categorized into the urban emotional cultivation dimension; Sustainable Collaborative Governance was defined as the governance model dimension. Finally, based on the research of relevant scholars [63], seven factors influencing the living experience in Silicon Alley districts were summarized from the four dimensions, including social, technical, emotional, and governance. Each factor was coded, and the results are presented in Table 2.
Table 2.
Influencing Factors of Living Experience in Silicon Alley Districts.
4.2. Calculation of Centrality and Cause Degree of Influencing Factors Based on the DEMATEL Model
4.2.1. Expert Questionnaire Design and Reliability and Validity Assessment
This study invited 15 experts with an average of more than 15 years of experience in this field to participate in scoring, to ensure the authority of the results. The expert panel included 9 professors from universities in the field of urban renewal; 3 government staff members responsible for the governance of Silicon Alley areas; and 3 practitioners with years of experience in the urban renewal field (Table 3). This composition aimed to ensure diverse perspectives from experts, obtain comprehensive insights into the influencing factors of living experience in Silicon Alley model districts, and guarantee the validity and reliability of the questionnaire results.
Table 3.
Respondents’ demographics.
The scoring process adopted the Delphi method [64] and was conducted in two rounds: In the first round, experts filled out the questionnaire independently; In the second round, the preliminary results of the first round were summarized and fed back to the experts, who were invited to make minor adjustments based on this information. A high level of consensus was finally reached. This process effectively converged differences in expert opinions and ensured data reliability. A 0–4 scoring scale was used [65], where 0 = No impact, 1 = Low impact, 2 = Moderate impact, 3 = High impact, 4 = Extremely high impact. The direct impact matrix was obtained, as shown in Formula 3. To ensure the reliability of the expert scoring results, IBM SPSS Statistics 27 was used for reliability and validity testing. The Cronbach’s α value was 0.953, which is greater than 0.9, indicating extremely high reliability and validity.
4.2.2. Calculation of Centrality and Cause Degree of Influencing Factors
After expert scoring, the Comprehensive Impact Matrix T (Table 4) was calculated using Formulas (4) and (5). By quantifying the mutual influences among various factors and applying the comprehensive impact matrix, the key dimensions of living experience in Silicon Alley model districts from the perspective of inclusive design, as well as their internal causal relationships, were identified.
Table 4.
Comprehensive Impact Matrix.
Subsequently, based on the calculation results of Formulas (6)–(9), the Influence Degree, Affected Degree, Cause Degree, Centrality, and Weight of each factor were obtained (Table 5). Among these, Influence Degree usually represents the influence relationship between one dimension and others: a larger value of Influence Degree indicates a greater influence of the dimension on others, while a larger value of Affected Degree means the dimension is more likely to be influenced by others [66]. As shown in Table 4, there are differences in the Influence Degree and Affected Degree among different dimensions. First, the most influential and most affected dimension is Urban Attraction Experience (S5), with values of 14.618 and 15.013, respectively. This indicates that Urban Attraction Experience (S5) has the greatest impact on the living experience of participants in the district; meanwhile, it is more likely to be influenced by other dimensions, so it is defined as a “result dimension”. However, based on the values of Influence Degree and Affected Degree, Urban Attraction Experience may have a circular relationship with other dimensions. Additionally, Sustainable Collaborative Governance (S7) and Diverse Community Experience (S2) also have a relatively large impact on other dimensions. In contrast, the degree to which Diverse Community Experience (S2) and Artistic Life Scene Experience (S4) are influenced by other dimensions gradually decreases.
Table 5.
Degree Results for Each Dimension.
In this study, a “Centrality–Cause Degree” scatter plot for each influencing factor was constructed, with Centrality as the x-axis and Cause Degree as the y-axis (Figure 4). A higher Centrality value indicates a greater impact of the factor on living experience within Silicon Alley districts. Factors with a Cause Degree greater than 0 are causal factors, which are prone to influencing other factors; factors with a Cause Degree less than 0 are result factors, which are susceptible to influences from other factors. As shown in Table 5 and Figure 4, the Centrality ranking of the factors is as follows: Urban Attraction Experience (S5), Diverse Community Experience (S2), Artistic Life Scene Experience (S4), Sustainable Collaborative Governance (S7), Local Cultural and Historical Experience (S6), Digital Block Experience (S3), Elderly-Friendly Livelihood Experience (S1). Specifically, in the social dimension: Diverse Community Experience (S2) has a relatively high Centrality of 28.809, while other factors in this dimension have lower Centrality. This indicates that inclusive community relationships are important internal driving factors for enhancing living experience in the area. In the technical dimension, Digital Block Experience (S3) has a Centrality of 25.635, meaning digitalization of the district provides strong driving force for improving local living experience. In the emotional dimension, Urban Attraction Experience (S5) has the highest Centrality in the system, at 29.631. This confirms that urban attraction is the most critical emotional driving factor for regional living experience. In the governance dimension, Sustainable Collaborative Governance (S7) has the highest Centrality, indicating that collaborative governance among organizations across all regional dimensions is an important supporting factor for enhancing participants’ living experience.
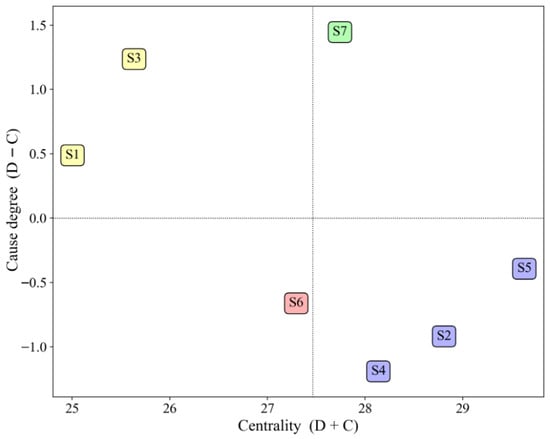
Figure 4.
Causal Diagram.
As seen in Figure 4, there are 3 factors with a Cause Degree greater than 0, ranked as follows: Sustainable Collaborative Governance (S7), Digital Block Experience (S3), and Elderly-Friendly Livelihood Experience (S1). These three factors exhibit strong initiative and are causal dimensions that exert significant influence on other dimensions of regional living experience. They primarily act as causes to affect other dimensions and require sustained focus in the future. There are 4 factors with a Cause Degree less than 0: Diverse Community Experience (S2), Artistic Life Scene Experience (S4), Urban Attraction Experience (S5), and Local Cultural and Historical Experience (S6). Among them, Artistic Life Scene Experience (S4) has the smallest Cause Degree and is highly susceptible to influences from other factors in the system. Therefore, it is essential to emphasize the impact of visual and esthetic factors in the district on living experience, actively explore the internal logic between urban visual design and participants’ perceptions/behaviors, and take measures to enhance this aspect.
4.3. Division of Hierarchical Relationships of Influencing Factors Based on the ISM Model
In the ISM model, the reachability Matrix F (Table 6) was derived using the total influence matrix (Table 4) and the threshold λ through Equation (7). Furthermore, the reachability set, antecedent set, and intersection set (Table 7) were obtained by applying Equations (8)–(10).
Table 6.
Reachability Matrix F.
Table 7.
Sets of Influencing Factors for the Reachability Matrix.
As shown in Table 7, the hierarchies of influencing factors for living experience in the Silicon Alley model from the inclusive perspective can be divided into 3 causal hierarchies, namely bottom-level factors, middle-level factors, and top-level factors (Figure 5).
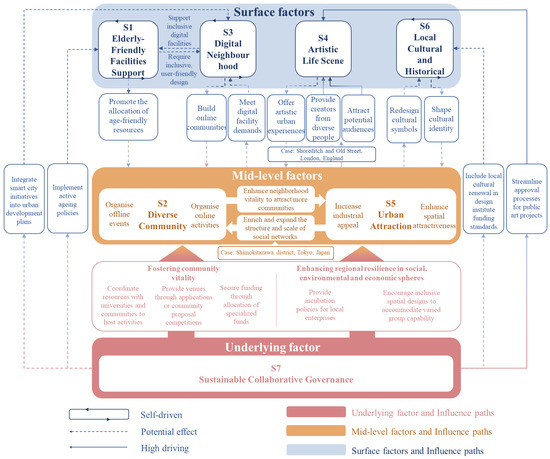
Figure 5.
Hierarchical Structure and Pathway Model of Influencing Factors for Lived Experience in Silicon Alley from an Inclusive Perspective.
To begin with, the bottom-level factor is Sustainable Collaborative Governance (S7). As a fundamental and guiding factor for living experience in Silicon Alley districts from the inclusive perspective, it is not directly influenced by other factors but exerts indirect influence on factors at all other levels. This finding aligns with core principles of polycentric governance theory. Sustainable Collaborative Governance refers to multi-stakeholder involvement that includes governments and civil organizations and which provides support through both soft resources such as policy formulation, financial support and activity organization and hard facilities such as barrier-free facilities, digital interfaces and open spaces to ensure the safety and inclusivity of diverse participants in the district. The pattern demonstrates a distinctive government-guided polycentric governance model within the Chinese context of Silicon Alley development, thereby enriching the theoretical understanding of polycentric governance applications in urban settings.
Next, the middle-level factors are Diverse Community Experience (S2) and Urban Attraction Experience (S5). As transmissive and connecting factors for living experience in Silicon Alley districts from the inclusive perspective, they play a bridging role in the entire influence system. Social identity theory suggests individuals establish identity through social categorization and group comparison. Diverse community relationships are reconstructing traditional categorical boundaries through shared neighborhood activities and spatial experiences, forming new social identities based on innovative culture rather than kinship or geographical ties. This fosters harmonious relationships among various social roles. Urban Attraction Experience relates to how regional industries and quality of life attract talent thereby driving local economic development and social vitality. These two factors serve as key conditions and means to promote the in-depth integration and reconstruction of new and existing social relationships, connecting bottom-level and top-level factors. While innovation districts like Cortex often struggle to sustain long-term coexistence of living, working, and recreational functions [67], these two mediating factors form a reciprocal relationship within the inclusive living experience framework. This bidirectional circuit becomes the core stabilizing mechanism within the system and represents crucial elements for neighborhood sustainability. Thus, they should be treated as an integrated unit with optimization measures implemented to coordinate internal system relationships.
Finally, the top-level factors include Elderly-Friendly Livelihood Services (S1), Digital Block Facilities (S3), Artistic Life Scenes (S4) and Local Cultural and Historical Experience (S6). As resultant factors for living experience in Silicon Alley districts from the inclusive perspective, they represent the ultimate goals and outcomes of the system. These elements reflect profound insights from urban morphology, representing the spatial embodiment of social processes as ultimate sedimentations. Elderly-Friendly Livelihood Services cover barrier-free facilities and local elderly care provisions, influencing residents’ confidence in long-term residence and the well-being of elderly residents; Digital Block Facilities involve intelligent functional services and interactive interfaces of digital facilities in the district, shaping the local tech atmosphere and life convenience; Artistic Life Scenes relate to visual perception and business format configuration in the district, affecting its esthetic value and economic vitality; Local Cultural and Historical Experience pertains to the district’s spatial texture and social relationships, enhancing its cultural uniqueness and social cohesion. According to hierarchy of needs theory, these surface-level factors represent the fulfillment of higher-order needs. These factors address the participants’ enthusiasm for life and social interaction patterns, reflecting their attitudes toward life and emotional tendencies that make them the most direct drivers of improved living experience. Their stability entirely depends on the solidity of foundational and mediating factors. Should urban regeneration projects lack substantial development in these underlying and mediating elements, rapid deterioration becomes inevitable. Among these factors, S1, S3 and S6 exhibit “reflexive relationships” with self-reinforcement capabilities. They need to identify connection points with middle-level and bottom-level factors to foster better development of these resultant factors. From a complex systems perspective, this self-reinforcing nature of surface-level factors demonstrates system sophistication, challenging traditional linear causality models. It reveals that outcome factors are not terminal points but crucial nodes capable of reshaping the system itself through feedback loops.
4.4. Results of Driver-Dependence Relationships of Influencing Factors Based on the MICMAC Model
In MICMAC analysis, driving power and dependence explain the roles and interrelationships of various dimensions in the living experience influence system [53]. Factors with strong driving power serve as the core drivers of the entire system and can exert significant influence on other dimensions [52]. Dependence refers to the extent to which a factor is influenced by others and dimensions with high dependence are more susceptible to impacts from other dimensions [68]. As shown in Table 8, Sustainable Collaborative Governance (S7) demonstrates high driving power with low dependence, confirming its role as an autonomous driver with minimal external influence. Diverse Community Experience (S2) and Urban Attraction Experience (S5) exhibit both strong driving power and high dependence, positioning them as linkage factors that both influence and are influenced by other dimensions. Conversely, Elderly-Friendly Livelihood Experience (S1), Digital Block Experience (S3), and Local Cultural and Historical Experience (S6) display low values in both driving and dependence power, indicating their relative independence within the system.
Table 8.
Driving Power and Dependence Values.
Based on the values in Table 7, a Driving Power-Dependence Diagram was plotted as shown in Figure 6. Group I contains two elements: Diverse Community Experience (S2) and Urban Attraction Experience (S5). These exhibit both high driving power and strong dependence, making them susceptible to influence from other dimensions. However, under such high dependence, fluctuations in any factor could be amplified through linkage effects, necessitating corresponding risk buffering mechanisms. Group II comprises Sustainable Collaborative Governance (S7), which demonstrates strong driving power with weak dependence. As a key dimension affecting internal collaboration across the system, it aligns with resource-based view theory, revealing how governance capability functions as intangible capital that determines competitiveness in modern urban contexts. Effective management of this dimension can positively influence lived experiences among diverse groups within the district. Group III includes three dimensions namely Elderly-Friendly Livelihood Experience (S1), Digital Block Experience (S3), and Local Cultural and Historical Experience (S6). These dimensions exert little influence on other living experience dimensions and are also less affected by other dimensions. Under the modularity theory, these three dimensions operate independently yet require exploration of their integration relationships with the broader system. Dependent Dimension Group IV contains one dimension namely Artistic Life Scene Experience (S4). It indicates that this dimension is more dependent on other living experience dimensions and is susceptible to their influences. Meanwhile, it has low driving power on other dimensions therefore dimensions in Dependent Dimension Group IV require greater attention. Integrating DEMATEL and ISM results reveals that S4 possesses the lowest cause degree (−1.192) and is directly driven by both mediating and fundamental factors. This demonstrates that enhancing art-integrated life scenarios depends on community activities, urban attractiveness, and governance mechanisms rather than directly driving systemic change. These findings challenge the “culture-led urban regeneration paradigm”, revealing a unique developmental path where artistic advancement in local contexts relies more heavily on institutional empowerment and social nurturing.
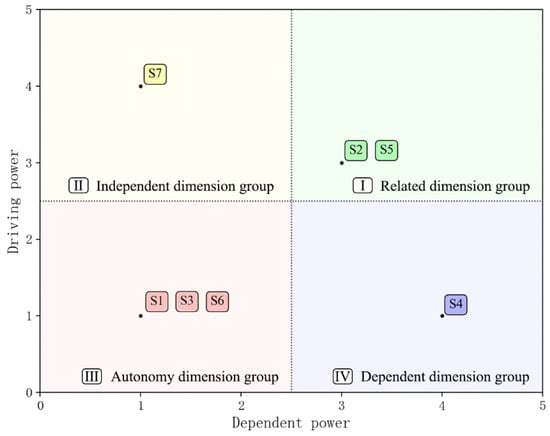
Figure 6.
Analysis Results of MICMAC Influencing Factors.
5. Discussion
5.1. Short-Term and Long-Term Factors for Enhancing Living Experience in Silicon Alley Districts
5.1.1. Short-Term Influencing Factors
Based on the results of LDA-DEMATEL-ISM-MICMAC analysis, Sustainable Collaborative Governance (S7) is identified as a causal driver, which aligns with the polycentric governance theory [69] which emphasizes participatory engagement among multiple stakeholders. S7 is positioned at the bottom of the hierarchical structure that enables the development of other elements. Its government guided characteristic demonstrates how polycentric governance adapts across different institutional contexts. Within this governance network, government entities collaborate with enterprises, communities, and residents to allocate funding, policy support, and spatial resources according to prioritized needs. These resources are strategically directed toward elderly-friendly renovations (S1), digital development (S3), and cultural activities (S4 and S6) and ultimately enhancing living experience. Thus, S7’s core function lies in creating an enabling environment that addresses fundamental issues related to actors and implementation approaches. Factors driven by S7, namely Diverse Community Experience (S2) and Urban Attraction Experience (S5), are also identified as causal drivers. Given that bottom-level and middle-level factors exert driving force on top-level factors, measures should be taken from the perspectives of policy formulation and industrial upgrading to advance living experience in Silicon Alley districts.
Collaborative governance by local institutions is a bottom-level causal factor, encompassing the strategic synergy between grassroots governments and regulations [70]. Additionally, community organizations’ participation in governance plays an irreplaceable role in enhancing community cohesion [71]. Meanwhile, sound financial support drives regional social harmony, technological innovation, and emotional value enhancement [72]. This study emphasizes the distinct roles of multi-level organizations within the district for diverse regional participants. A collaborative network involving multiple entities [73,74] delivers high-quality spatial environments and living services that elevate district living experience.
Next, consideration should be given to the middle-level factors, namely Diverse Community Experience (S2) and Urban Attraction Experience (S5). The case of Tokyo’s Shimokitazawa district illustrates this dynamic effectively. The area initially developed a distinctive subcultural community network through its small theater clusters, thereby strengthening S2. This culturally rich environment subsequently became a primary factor attracting young creators and visitors, thus enhancing S5. Concurrently, the growing urban attractiveness further enriched local community diversity and vitality by introducing new creative talent and business models. This created a virtuous cycle where community development fosters distinctive characteristics, these characteristics attract talent, and talent reciprocally enriches the community. Communities act as a bond co-created by individuals with diverse identities and serve as a key element in enhancing regional cohesion and attractiveness [75]. In Shimokitazawa, community-organized events such as music festivals and theatrical performances not only strengthened internal community identity but also shaped the neighborhood’s unique cultural brand, thereby continuously boosting regional attractiveness. Similarly, attractive public spaces foster community formation by generating behavioral motivations and social interactions [58]. Furthermore, Li [76] and Zhou [28] explain from different perspectives that attracting talent subtly influences the creativity and learning capabilities of urban residents, while the aggregation of high-quality talent shapes a city’s innovative atmosphere. Social networks and economic development dynamics exhibit deep integration and mutual reinforcement, where social networks transform into productive resources in innovation activities, while economic development enriches social network structures through attracting diverse talent. Thus, S2 and S5, through their mutually reinforcing relationship, become critical to stabilizing internal system dynamics. The Shimokitazawa area developed numerous high-tech-integrated circular commercial complexes. The district’s business formats are built by communities with shared goals, attracting more communities to participate in district revitalization. In this case, S2 and S5 also contribute to district development through a tight circular relationship [77]. This demonstrates how innovation districts serve as implementation vehicles for foundational governance factors while simultaneously driving surface-level factors, ultimately shaping neighborhood lived experience through continuous innovation practices. Essentially, both factors aim to encourage diverse groups to integrate into the district [78]. Neighborhoods need to establish mechanisms that promote positive cycles among intermediate factors, enabling them to serve as bridges connecting foundational and surface-level elements. Therefore, policymakers should encourage organizations to launch short-term community activities focused on living experience. They should also provide open spaces and supportive policies for diverse communities.
Thus, it is evident that social integration plays a prominent role in influencing district living experience, emphasizing the promotion of social identity through open environments and activities. Social Identity Theory was originally an academic concept in sociology and psychology [79]. Due to its focus on group differences and behavioral commonalities [80], it is now recognized as an effective means to resolve social relationship conflicts. This can be achieved through simplifying administrative procedures for public activities to encourage resident organized community initiatives, implementing incubation policies to attract diverse industries, and incorporating social participation metrics into evaluation criteria for enterprises and academic institutions. By collaboratively developing service pathways and public spaces that respond to varied needs, these measures address urban sustainability challenges across economic, environmental and governance domains from an inclusive perspective, thereby effectively advancing social integration.
Based on systematic analysis of influencing factors in Silicon Alley districts, the following governance strategies closely integrated with local innovation ecosystems are proposed. These strategies aim to initiate positive feedback loops in the short term by activating the synergistic effects of S7, S2 and S5. Regarding governance mechanisms, we recommend establishing an innovation-oriented co-governance platform that strategically integrates university technology transfer centers and corporate R&D departments within the district. Following the model of Cambridge’s Kendall Square, a governance committee comprising multiple stakeholders could be formed with representative proportions of 3:3:2:2 for government, enterprises, universities, and community residents, respectively. The platform should implement blockchain-based transparent decision-making mechanisms to ensure balanced protection of all parties’ rights and interests. Additionally, the committee should establish a Silicon Alley Community Innovation Fund, supported by district-level fiscal allocations, corporate social responsibility investments, and community micro-funds, which would directly strengthen the foundational role of Sustainable Collaborative Governance (S7). For community cultivation, a technology-community symbiosis program could be launched to develop distinctive community networks leveraging Silicon Alley’s innovation resources. Drawing inspiration from MIT Media Lab’s community engagement model, tech company employees and university students could lead regular community integration workshops, demonstrating cutting-edge technologies like artificial intelligence and IoT through experiential, interactive approaches. An annual Silicon Alley Innovation Proposal Competition could be initiated in the second quarter with final demonstrations and awards in the fourth quarter. The competition should establish tiered incentives: winning proposals receive dedicated implementation funding, socially impactful proposals gain media exposure, and highly innovative proposals obtain space usage rights and incubation services. All selected proposals should benefit from streamlined approval processes ensuring concept-to-implementation within six to nine months. To ensure sustainable competition development, proposal implementation outcomes could be incorporated into university social practice evaluation systems and linked to corporate social responsibility assessments. This mechanism design maintains appropriate abstraction for academic research while providing clear operational guidance through explicit timelines and support systems. Such technology and solution sharing interactions effectively activate Diverse Community Experiences (S2) while enhancing Urban Attraction Experiences (S5). Building on Silicon Alley’s distinctive characteristics, we suggest that governments collaborate with social organizations to transform underutilized spaces into innovation living labs. Following Boston’s Seaport District practice, these could create multifunctional spaces combining office, exhibition, and community functions. Providing low-cost office spaces for startups while regularly hosting public open days and innovation exhibitions would facilitate integration between tech talent and local residents, thereby quickly enhancing the district’s innovation atmosphere and living appeal.
5.1.2. Long-Term Influencing Factors
Long-term strategies build on short-term actions to deliver sustained impacts on the livelihood system of Silicon Alley districts. Thus, top-level factors, which directly contribute to living experience, are prioritized in long-term planning. These include Elderly-Friendly Livelihood Experience (S1), Digital Block Experience (S3), Artistic Life Scene Experience (S4), and Local Cultural and Historical Experience (S6). Except for Artistic Life Scene Experience (S4), which is influenced by middle-level and bottom-level factors, the causal relationship intensity of other top-level factors is close to zero. However, they still exhibit weak dependence on other factors (Table 7). Top-level factors represent the cumulative outcome of multiple short-term actions and manifest under long-term influences.
Among these, Elderly-Friendly Livelihood Experience (S1) and Digital Block Experience (S3) exhibit high Cause Degree and low Centrality (Figure 4), along with low driving power and dependence (Figure 6). This indicates they are independent drivers, where direct improvements can be achieved through their own optimization. Elderly-friendliness has long been a core component of urban inclusivity, as it contributes to community well-being, confidence in aging, and urban safety [81]. In this study, S1 appears self-driven, and this is a finding that differs from Greenfield et al. [82]. Their work proposed the community collaboration theory and argued that grassroots participation and social networks as core mechanisms for age-friendly community transformation. This discrepancy may stem from the indirect driving mechanism identified in this study. Sustainable Collaborative Governance (S7, the bottom-level driver) subtly raises societal awareness to aging issues through proactive policy guidance and inclusive resource allocation. Meanwhile, Digital Block Experience (S3) provides technological implementation pathways. Additionally, social integration (facilitated by S2 and S5) is critical to S1’s optimization. Beyond meeting elderly-friendly needs through hardware, it connects elderly groups with other populations through “soft” measures, addressing social isolation [83]. This indicates that in high-density innovation districts such as Silicon Alley, well-established public service systems and digital infrastructure create distinct implementation conditions for aging-friendly services compared to traditional communities, thereby enabling modular implementation without complete reliance on grassroots social collaboration. Digital Block Experience (S3) is also an independent driver. As part of smart city strategies [84], it exhibits high Cause Degree in this study and is less affected by other factors. Its modular characteristics enrich the technology acceptance model [85] by demonstrating how digital facilities evolve through continuous interaction between technological ecosystems and user environments within innovation districts. While some scholars argue that digitalization may negatively impact urban resilience [86], this study, combined with its analysis results, contends that the perspective of community integration is critical for the application of digital facilities in districts. They help individuals overcome behavioral limitations and create online communities for vulnerable groups [87]. Concurrently, social integration drives digital facility evolution through diverse application scenarios, while the capacity ranges of vulnerable groups raise requirements for digital inclusivity. This insight advances beyond conventional technological determinism and social constructivism. Within innovation districts, technology neither unilaterally shapes social relations nor passively responds to social needs but rather engages in mutually constitutive co-evolution with social dimensions. It offers an inclusive solution to resolve conflicts between digital functions and residents’ capabilities. Thus, digital facilities should be designed inclusively based on participants’ capability levels. Leveraging their strengths, such as enhancing life convenience, sustaining district attractiveness, and promoting the participation of diverse groups [88], and this will enable the district to achieve long-term sustainable development in the smart era.
Artistic Life Scene Experience (S4) and Local Cultural and Historical Experience (S6) exhibit high Centrality and low Cause Degree. This indicates that they are core outcome factors and key targets for improvement. Specifically, Artistic Life Scene Experience (S4), situated at the surface level of the hierarchical structure, primarily reflects neighborhood esthetic value and visual perception. They are strongly influenced by hard factors such as social integration (S2, S5) and governance (S7). Diverse communities and urban attractiveness stimulate artistic activities, while collaborative governance provides resources and policy support. In contrast, S4 exerts limited feedback effects on livelihood, technology, or governance, resulting in low driving power. It should thus be treated as a key enabling element in long-term strategy. Today, the pursuit of quality of life is a key demand for residents. Creating artistic living scenarios allows cities to gain resources like online exposure and consumer revenue. These resources, in turn, enable emerging district industries to address diverse population needs. A case in point is Shoreditch and Old Street in London, UK [89]: it serves as the core area of Europe’s renowned tech hub, the “Silicon Roundabout” and also acts as a carrier for cutting-edge art and diverse businesses. Driven by social integration, it attracts artists, young people, and entrepreneurs, shaping a more distinctive district character. While artistic and cultural elements are often regarded as primary drivers of regional revitalization in Western contexts, this study reveals their high dependence in the local context, differing from the classic “culture-led urban renewal” model. In the local context, art-integrated life scenarios function more as derivatives of governance mechanisms, community vitality, and urban attractiveness rather than initial drivers of systemic change. This divergence may stem from unique institutional environments and social foundations in local urban development. Unlike the market-driven clustering effect often observed in Western contexts, artistic development in Eastern societies relies more on policy support and resource allocation from institutional systems, participation networks constructed by diverse communities, and creative classes attracted by urban charm. This finding not only questions the direct transplantation of “culture-led” renewal paradigms but also reveals differentiated pathways for art’s participation in urban development across socio-institutional contexts. Therefore, these results should not be interpreted as a negation of existing culture-driven models but as a path divergence under different developmental stages and institutional conditions. In promoting neighborhood renewal, it is essential to ground strategies in local realities, situating art within broader governance and social integration frameworks. Strengthening institutional foundations and activating social capital can create a suitable ecosystem for the organic growth of artistic scenarios. From the perspective of art sociology, Bourdieu [90] supports the role of social integration in fostering artistic life experiences. He argues that the art world and artistic objects are shaped, defined, and sustained by multiple forces and actors, thereby providing S4 with a broader potential enthusiast base. Meanwhile, governments and other stakeholders should leverage collaborative governance to turn artistic districts into cultural destinations which are integral to a district’s appeal, thus forging a unique lifestyle under the Silicon Alley model. Under relatively mature conditions of collaborative governance and social integration, artistic development may manifest as an outcome of system optimization rather than an initial driver. Nevertheless, S4 remains essential for enhancing neighborhood quality of life, attracting diverse communities, and driving social integration to foster systemic development.
In contrast, Local Cultural and Historical Experience (S6) is less affected by other factors and functions as a self-optimizing element. Unlike the cultural uniqueness of Artistic Life Scene Experience, this factor emphasizes the historical commonality of regional culture. The Theory of Place Spirit complements this study by emphasizing the close interaction between the cultural environment and humans, signifying that the purpose of space has long transcended the definitions assigned by early functionalism [91]. Under innovation-driven development models, traditional culture undergoes creative transformation and innovative development, becoming a key resource for shaping new urban identities. Accordingly, local culture shares subtle connections with other factors in terms of spiritual identity. Scholars such as Zhao [92] further note that cultural identity and diversity emerging from community integration are crucial for culturally diverse regions, providing preference samples for neighborhood cultural research. Thus, policymakers and practitioners should incorporate local cultural history as a key driver of the district’s future development, transcending the simplistic opposition between preservation and innovation. This approach promotes the positive impact of cultural identity on social integration and neighborhood sustainability, ultimately enhancing neighborhood lived experience. During this process, governance systems provide institutional guarantees for cultural development through resource allocation and policy guidance, while vibrant cultural scenes enhance the legitimacy and effectiveness of governance by strengthening neighborhood uniqueness and identity.
This study classifies factors into hierarchies to guide policymakers in rational resource allocation and achieve district sustainability. For long-term influencing factors in particular, it emphasizes hierarchical relationships and driving mechanisms within the system. Specific strategies are proposed as follows: Improving the regional elderly care system, prioritize the construction of public spaces that connect elderly groups with diverse populations. Enrich livelihood services in community elderly care to boost residents’ confidence in long-term elderly care. Governments and community organizations should coordinate overall resource allocation to ensure the operation of the livelihood system. Using integrated community elderly service centers and neighborhood hubs as physical carriers, each Silicon Alley neighborhood should establish at least two fixed service points. Services should cover all subordinate residential committees, with reserved door-to-door assistance for advanced-age and solitary elderly residents. To develop digital block facilities, a tripartite collaboration mechanism of “government leadership, university coordination, and community implementation” is recommended. Building on this, a “Digital Partner” program framework supported by Silicon Alley’s innovation resources should be established. This framework clarifies the government’s leading role in coordination while fully leveraging universities’ research capabilities and tech enterprises’ technical expertise, forming a multi-stakeholder cooperation mechanism with clear responsibilities. District civil affairs bureaus should lead the “Digital Partner” program, collaborating with computer science departments for technical support and design schools with smart device companies to develop aging-friendly interfaces. Implementation should follow a phased strategy, first establishing demonstration sites in elderly-concentrated areas before expanding to full coverage. Community organizations and youth volunteer groups from local universities should jointly serve as responsible entities, developing members for digital literacy training and establishing comprehensive evaluation systems covering volunteer service assessment and corporate social responsibility evaluation. This implementation pathway fully considers Silicon Alley’s unique innovation ecosystem, ensuring professionalism and sustainability while maintaining flexibility through government-industry-academia-research collaboration. To build artistic life scenarios, governments and other entities should recognize the role of district visuals in fostering community integration and highlight the long-term driving role of the art industry in innovation and technology. Drawing from London’s Shoreditch “Arts Council” model [89], the co-governance committee could establish a “Culture and Arts Subcommittee” responsible for reviewing artistic projects and managing public space usage. Utilizing artistic resources from local universities such as drama, music, design, and fine arts academies, an “Artist-in-Residence” program should be established to convert underutilized spaces into creative workshops and exhibition venues. To promote local cultural and historical communication, local design institutes and urban renewal organizations should translate the district’s implicit cultural genes into explicit cultural elements. Then, they should set up promotional slogans to inspire a sense of identity among diverse groups in the district. This process is essential for achieving spiritual stability in the district.
After clarifying short-term strategies and long-term goals, this study argues that the hierarchical relationship between the two must be emphasized to ensure consistency and progression when addressing potential challenges in district development. Governments should accurately distinguish between short-term strategies and long-term goals, rationally allocate district resources, and focus on district sustainability to achieve long-term improvement in living experience under the Silicon Alley model.
5.2. Limitations
This study has certain conceptual and analytical limitations. The social media data used in this research predominantly captures consumption-oriented, visual, and check-in style short-term experiences. Consequently, the daily functional needs and deeper living demands of long-term residents may be systematically underrepresented. This potential bias could lead to overemphasis on surface-level factors like art-integrated life scenarios (S4), while underestimating the driving power and centrality of fundamental elements such as Elderly-Friendly Livelihood Experience (S1). Second, the study sample primarily focuses on residents and tourists, with insufficient coverage of the living experiences of tech workers within the district. This sampling approach may have resulted in an incomplete interpretation of the Digital Block Experience (S3) dimension, particularly weakening the analysis of work–life integration dynamics. Consequently, the policy recommendations presented may have limited effectiveness in promoting industrial development and talent retention.
Future research should incorporate in-depth interviews, household surveys, and structured questionnaires specifically targeting long-term residents and technology workers to enhance data accuracy and practical applicability. Additionally, dedicated studies should examine specific demographic segments. These include technology professionals, entrepreneurial teams, older adults, and young families. Such focused research would generate valuable insights into their distinctive needs and behavioral patterns. This targeted approach enables the development of more precise facility allocation and service strategies. Ultimately, these strategies will support more inclusive and sustainable development in Silicon Alley districts.
6. Conclusions
Urban experience is crucial for regional revitalization and the sustainable development of districts. However, abstract living experiences cannot be tangibly captured, making it challenging to enhance them through urban development measures. Therefore, this study has systematically integrated and applied the LDA-DEMATEL-ISM-MICMAC method to identify seven key driving factors across social, technological, emotional, and governance dimensions. It has also comprehensively clarified the influence relationships and hierarchical structures among these factors, while putting forward governance-related recommendations.
Key conclusions of this study are as follows. First, Sustainable Collaborative Governance (S7) is a key foundational driver that exerts a sustained influence on top-level and middle-level factors within the system. As a priority area for short-term actions, it requires clarifying the authority, responsibility, and benefit relationships among governments, communities, and civil organizations within the livelihood system. It also involves allocating functional facilities in the district, defining the district’s cultural genes, and organizing district integration activities, as well as using both tangible and intangible means to enhance residents’ life satisfaction, sense of district identity, and the district’s ability to attract talent. Additionally, Diverse Community Experience (S2) and Urban Attraction Experience (S5) are key transmission factors that bridge short-term measures to long-term goals. They are influenced by bottom-level factors and in turn impact long-term goals, while sharing a mutually influential relationship. Acting as a link to strengthen the influence between top-level and bottom-level factors, social integration serves as a shared goal for both and constitutes a core element of district living experience from an inclusive perspective; stable social integration provides the relational foundation for achieving long-term goals. Furthermore, Elderly-Friendly Livelihood Experience (S1), Digital Block Experience (S3), Artistic Life Scene Experience (S4), and Local Cultural and Historical Experience (S6) are direct factors influencing living experience. These driving factors largely rely on influences from bottom-up and transmission-based drivers, enhancing district living experience from the dimensions of livelihood, technology, spirituality, and culture, respectively, and aligning with the strategies of short-term actions.
By applying the integrated LDA-DEMATEL-ISM-MICMAC approach, this study has identified the key drivers for enhancing living experience, along with their causal relationships and influence pathways. It has also provided theoretical insights into the causal relationships, influence pathways, and priorities among these multiple driving factors. Furthermore, it proposes priority pathways for enhancing living experience in Silicon Alley districts from multiple dimensions, contributing to the sustainable development of districts adopting the Silicon Alley model.
Author Contributions
Conceptualization, J.Z. and C.L.; methodology, J.Z.; software, J.Z.; validation, J.Z.; formal analysis, J.Z.; investigation, J.Z.; resources, C.L.; data curation, J.Z.; writing—original draft preparation, J.Z.; writing—review and editing, C.L.; visualization, J.Z.; supervision, C.L.; project administration, C.L.; funding acquisition, C.L. All authors have read and agreed to the published version of the manuscript.
Funding
This work was supported by the Fundamental Research Funds for the Central Universities (Grant No. CUSF-DH-T-2024050).
Institutional Review Board Statement
The study was conducted according to the guidelines of the Declaration of Helsinki and approved by the Institutional Review Board of Donghua University (protocol code: RLSSZYJ202508260042; date of approval: 26 August 2025).
Informed Consent Statement
Informed consent was obtained from all subjects involved in the study.
Data Availability Statement
This study has no additional data available.
Acknowledgments
During the preparation of this study, the authors used Anaconda 3 for the purposes of data analysis. The authors have reviewed and edited the output and take full responsibility for the content of this publication.
Conflicts of Interest
The authors declare no conflicts of interest. The funders had no role in the design of the study; in the collection, analyses, or interpretation of the data; in the writing of the manuscript; or in the decision to publish the results.
Abbreviations
The following abbreviations are used in this manuscript:
| LDA | Latent Dirichlet Allocation |
| DEMATEL | Decision-Making Trial and Evaluation Laboratory |
| ISM | Interpretive Structural Modeling |
| MICMAC | Cross-Impact Matrix Multiplication Applied to Classification |
Appendix A
Based on expert assessments of inter-dimensional influence intensity and subsequent weighted averaging, the direct influence matrix A was obtained as follows:
Based on the direct influence matrix A, it is first normalized to obtain the typical influence matrix B. The normalization calculation uses the maximum value of the sum of elements in each row of the matrix as the benchmark. The formula is as follows:
Among these, represents the element in the i-th row and j-th column of the direct influence matrix A, and n denotes the total number of dimensions (in this study, n = 7).
By computing the product of matrix B and the inverse of matrix I–B, the total influence matrix T is established to quantify the comprehensive influence relationships among the various influencing factors within the system. The formula is given as follows:
The total influence matrix H is constructed by combining the total influence matrix T with the identity matrix I and is used for subsequent conversion to the reachability matrix. The formula is expressed as
The mean and standard deviation of all off-diagonal elements in the total influence matrix T are calculated as follows:
This study employed the “mean plus standard deviation” (μ + σ) method to determine the threshold value λ. Consequently, the threshold λ for this study was subsequently determined as 2.15151.
Appendix B
Based on threshold λ, the total influence matrix H was converted into a binary reachability matrix F through a binarization process. Specifically, when an element in the matrix , it is recorded as 1; when , it is recorded as 0. This transformation yields the reachability matrix F.
Based on the reachability matrix F, the reachability set R(Si), antecedent set A(Sj), and intersection set C(Si) are determined. By definition, the reachability set R(Si) contains all elements with a value of 1 in row i of matrix F, whereas the antecedent set A(Sj) includes all elements with a value of 1 in column j. The intersection set C(Si) is defined as the overlap between R(Si) and A(Sj), expressed as C(Si) = R(Si) ∩ A(Sj). Thus,
Based on the reachability matrix F obtained from the ISM analysis, the driving power and dependence power are calculated as follows:
Based on the total influence matrix T, the influence degree and affected degree are calculated, respectively, as follows:
Based on the calculated influence degree and affected degree, the centrality and cause degree are further derived as follows:
References
- Manfreda, A.; Mijač, T. Highlighting gaps in technology acceptance research: A call for integrating happiness and well-being into smart city development. J. Innov. Knowl. 2024, 9, 100585. [Google Scholar] [CrossRef]
- Ghaffari, A.; Pirttikangas, S.; Gilman, E. Understanding Well-Being in Urban Context: A Survey. IEEE Access 2025, 13, 11136–11158. [Google Scholar] [CrossRef]
- Garud, R.; Lant, T.K.; Schildt, H.A. Generative imitation, strategic distancing and optimal distinctiveness during the growth, decline and stabilization of Silicon Alley. Innovation 2019, 21, 187–213. [Google Scholar] [CrossRef]
- Li, M.Y.; Luo, L.; Makino, S. Events and entrepreneurial passion: The moderating role of event coping competence. Eur. Manag. Rev. 2025, 22, 759–775. [Google Scholar] [CrossRef]
- Jakob, D. Book Review: Silicon Alley: The Rise and Fall of a New Media District. Urban Aff. Rev. 2006, 41, 723–724. [Google Scholar] [CrossRef]
- Bierly, P.E., III; Kessler, E.H.; Christensen, E.W. Organizational learning, knowledge and wisdom. J. Organ. Change Manag. 2000, 13, 595–618. [Google Scholar] [CrossRef]
- Indergaard, M. The Webs They Weave: Malaysia’s Multimedia Super-Corridor and New York City’s Silicon Alley. Urban Stud. 2003, 40, 379–401. [Google Scholar] [CrossRef]
- Colding, J.; Nilsson, C.; Sjöberg, S. Smart Cities for All? Bridging Digital Divides for Socially Sustainable and Inclusive Cities. Smart Cities 2024, 7, 1044–1059. [Google Scholar] [CrossRef]
- Keates, S.; Clarkson, J. Countering Design Exclusion; Springer: London, UK, 2004. [Google Scholar]
- Fletcher, H. The Principles of Inclusive Design (They Include You); CABE: London, UK, 2006. [Google Scholar]
- Clarkson, P.J.; Coleman, R. History of Inclusive Design in the UK. Appl. Ergon. 2015, 46, 235–247. [Google Scholar] [CrossRef]
- Fisk, R.P.; Dean, A.M.; Alkire, L.; Joubert, A.; Previte, J.; Robertson, N.; Rosenbaum, M.S. Design for service inclusion: Creating inclusive service systems by 2050. J. Serv. Manag. 2018, 29, 834–858. [Google Scholar] [CrossRef]
- Zukin, S. Loft Living; Rutgers University Press: New Brunswick, NJ, USA, 1989. [Google Scholar]
- Jiang, L.; Li, X.; Wang, W.; Tang, X.; Guo, R. From Silicon Valley to Silicon Alley: Investigating the Dynamic Development of Urban Technological Industries. In Proceedings of the International Conference on Construction and Real Estate Management 2024, Guangzhou, China, 23–24 November 2024; pp. 1181–1190. [Google Scholar]
- Hull, L. Star Ledger; University of Iowa Press: Iowa City, IA, USA, 2010. [Google Scholar]
- Lounsbury, M.; Glynn, M. Cultural Entrepreneurship: A New Agenda for the Study of Entrepreneurial Processes and Possibilities; Cambridge University Press: Cambridge, UK, 2019. [Google Scholar]
- Yun, J.J.; Zhao, X.; Yigitcanlar, T.; Lee, D.; Ahn, H. Architectural Design and Open Innovation Symbiosis: Insights from Research Campuses, Manufacturing Systems, and Innovation Districts. Sustainability 2018, 10, 4495. [Google Scholar] [CrossRef]
- Lin, C.; Zhao, G.; Yu, C.; Wu, Y.J. Smart City Development and Residents’ Well-Being. Sustainability 2019, 11, 676. [Google Scholar] [CrossRef]
- Penco, L.; Ivaldi, E.; Ciacci, A. Entrepreneurial ecosystem and well-being in European smart cities: A comparative perspective. TQM J. 2021, 33, 318–350. [Google Scholar] [CrossRef]
- Krätke, S. City of talents? Berlin’s regional economy, socio-spatial fabric and ‘worst practice’ urban governance. Int. J. Urban Reg. Res. 2004, 28, 511–529. [Google Scholar] [CrossRef]
- Florida, R.; Mellander, C. Rise of the startup city: The changing geography of the venture capital financed innovation. Calif. Manag. Rev. 2016, 59, 14–38. [Google Scholar] [CrossRef]
- Mulas, V.; Gastelu-Iturri, M. New York City: Transforming a City into a Tech Innovation Leader; The World Bank: Washington, DC, USA, 2016. [Google Scholar]
- Pancholi, S.; Yigitcanlar, T.; Guaralda, M. Public space design of knowledge and innovation spaces: Learnings from Kelvin Grove Urban Village, Brisbane. J. Open Innov. Technol. Mark. Complex. 2015, 1, 1–17. [Google Scholar] [CrossRef]
- Heydebrand, W. Multimedia Networks, Globalization and Strategies of Innovation: The Case of the Silicon Alley; Akademie für Technikfolgenabschätzung in Baden-Württemberg: Stuttgart, Germany, 1999. [Google Scholar]
- Lara, A.P.; Da Costa, E.M.; Furlani, T.Z.; Yigitcanlar, T. Smartness that matters: Towards a comprehensive and human-centred characterisation of smart cities. J. Open Innov. Technol. Mark. Complex. 2016, 2, 1–13. [Google Scholar] [CrossRef]
- Samarakkody, A.; Amaratunga, D.; Haigh, R. Characterising Smartness to Make Smart Cities Resilient. Sustainability 2022, 14, 12716. [Google Scholar] [CrossRef]
- Nielsen, I.B.; Hakala, H. Circular Business Strategies and Quality of Life. Sustainability 2022, 14, 1782. [Google Scholar] [CrossRef]
- Zhou, Q.; Zhu, M.; Qiao, Y.; Zhang, X.; Chen, J. Achieving resilience through smart cities? Evidence from China. Habitat Int. 2021, 111, 102348. [Google Scholar] [CrossRef]
- Malvaso, A.; Kang, W. The relationship between areas of life satisfaction, personality, and overall life satisfaction: An integrated account. Front. Psychol. 2022, 13, 894610. [Google Scholar] [CrossRef] [PubMed]
- Zallio, M.; Clarkson, P.J. Inclusion, diversity, equity and accessibility in the built environment: A study of architectural design practice. Build. Environ. 2021, 206, 108352. [Google Scholar] [CrossRef]
- Coleman, R. The Case for Inclusive Design: An Overview. In Proceedings of the 12th Triennial Congress, International Ergonomics Association and the Human Factors Association, Toronto, ON, Canada, 15–19 August 1994; pp. 250–252. [Google Scholar]
- Chen, H. On the Limits of Community Inclusion of Individual Freedom—Taking Hegel’s Concept of “Subjective Freedom” as an Example. J. Tsinghua Univ. Philos. Soc. Sci. Ed. 2015, 30, 108–118. [Google Scholar] [CrossRef]
- Li, F.; Dong, H. Design “Inclusion” and “Exclusion” in a competitive context. Design 2020, 33, 59–61. [Google Scholar] [CrossRef]
- Bailey, K.A.; Griffin, M.; Habib, S.; Fayyaz, N.; Lopez, K.J.; Schormans, A.F. Building community or perpetuating inclusionism? The representation of “inclusion” on fitness facility websites. Leisure 2023, 47, 659–680. [Google Scholar] [CrossRef]
- Li, F.; Zhao, Y.; Liu, L. From Universal Equality to Marginal Equality: Diversity-Oriented Design Values. Zhuangshi 2020, 40–44. [Google Scholar] [CrossRef]
- Persad, U.; Langdon, P.; Clarkson, P.J. A Framework for Analytical Inclusive Design Evaluation. In Guidelines for a Decision Support Method Adapted to NPD Processes; The Design Society: Glasgow, UK, 2007. [Google Scholar]
- Liang, D.; De Jong, M.; Schraven, D.; Wang, L. Mapping key features and dimensions of the inclusive city: A systematic bibliometric analysis and literature study. Int. J. Sustain. Dev. World Ecol. 2022, 29, 60–79. [Google Scholar] [CrossRef]
- Li, X.; Hui, E.C.M.; Chen, T.; Lang, W.; Guo, Y. From Habitat III to the new urbanization agenda in China: Seeing through the practices of the “three old renewals” in Guangzhou. Land Use Policy 2019, 81, 513–522. [Google Scholar] [CrossRef]
- Sha, K.; Taeihagh, A.; De Jong, M. Governing disruptive technologies for inclusive development in cities: A systematic literature review. Technol. Forecast. Soc. Change 2024, 203, 123382. [Google Scholar] [CrossRef]
- Zhao, R.; de Jong, M.; Edelenbos, J. Will the true inclusive city rise? Mapping the strengths and weaknesses of the city ranking systems. Cities 2023, 143, 104617. [Google Scholar] [CrossRef]
- Mouratidis, K. Time to challenge the 15-minute city: Seven pitfalls for sustainability, equity, livability, and spatial analysis. Cities 2024, 153, 105274. [Google Scholar] [CrossRef]
- Castellanos, A.; Jiang, H.; Gomes, P.; Meer, D.V.; Castillo, A. Large Language Models for Thematic Summarization in Qualitative Health Care Research: Comparative Analysis of Model and Human Performance. JMIR AI 2025, 4, e64447. [Google Scholar] [CrossRef] [PubMed]
- Blei, D.M.; Ng, A.Y.; Jordan, M.I. Latent dirichlet allocation. J. Mach. Learn. Res. 2003, 3, 993–1022. [Google Scholar]
- Gabus, A.; Fontela, E. World Problems, An Invitation to Further Thought Within the Framework of DEMATEL; Battelle Geneva Research Centre: Geneva, Switzerland, 1972. [Google Scholar]
- Warfield, J.N. Toward Interpretation of Complex Structural Models. IEEE Trans. Syst. Man Cybern. 1974, SMC-4, 405–417. [Google Scholar] [CrossRef]
- Duperrin, J.-C.; Godet, M. Hierarchization Method for the Elements of a System. An Attempt to Forecast a Nuclear Energy System in Its Societal Context; Technical Report CEA-R-4541; Deptartement des Programmes, CEA: Paris, France, 1973. [Google Scholar]
- Nazlabadi, E.; Maknoon, R.; Moghaddam, M.R.A.; Daigger, G.T. A novel MICMAC approach for cross impact analysis with application to urban water/wastewater management. Expert Syst. Appl. 2023, 230, 120667. [Google Scholar] [CrossRef]
- Xie, J.H.; Tian, F.J.; Li, X.Y.; Chen, Y.Q.; Li, S.Y. A study on the influencing factors and related paths of farmer’s participation in food safety governance-based on DEMATEL-ISM-MICMAC model. Sci. Rep. 2023, 13, 11372. [Google Scholar] [CrossRef]
- Shi, F.; Wu, Z. Construction of Knowledge Graph of the Elevator Safety Accidents and Analysis of Key Risk Factors Based on KG-DEMATEL-ISM-MICMAC Method. IEEE Access 2024, 12, 43615–43631. [Google Scholar] [CrossRef]
- Feng, X.; Li, E.; Li, J.; Wei, C. Critical influencing factors of employees’ green behavior: Three-stage hybrid fuzzy DEMATEL–ISM–MICMAC approach. Environ. Dev. Sustain. 2024, 26, 17783–17811. [Google Scholar] [CrossRef]
- Zhang, S.; Liu, J.; Li, Z.; Xiahou, X.; Li, Q. Analyzing Critical Factors Influencing the Quality Management in Smart Construction Site: A DEMATEL-ISM-MICMAC Based Approach. Buildings 2024, 14, 2400. [Google Scholar] [CrossRef]
- Bhosale, V.A.; Kant, R. An integrated ISM fuzzy MICMAC approach for modelling the supply chain knowledge flow enablers. Int. J. Prod. Res. 2016, 54, 7374–7399. [Google Scholar] [CrossRef]
- Hu, Y.; Zhou, L.; Huang, P.; Liu, Q.; Liu, H. Dimensions of Job Demands Among New-Generation Employees Based on Online Reviews by Employees. Behav. Sci. 2024, 14, 990. [Google Scholar] [CrossRef] [PubMed]
- Chuang, J.; Manning, C.D.; Heer, J. Termite: Visualization techniques for assessing textual topic models. In Proceedings of the International Working Conference on Advanced Visual Interfaces, Capri Island, Italy, 21–25 May 2012. [Google Scholar] [CrossRef]
- Sievert, C.; Shirley, K. LDAvis: A method for visualizing and interpreting topics. In Proceedings of the Workshop on Interactive Language Learning, Visualization, and Interfaces, Baltimore, MA, USA, 27 June 2014; pp. 63–70. [Google Scholar] [CrossRef]
- Sun, F.; Wang, X. The Status Quo and Trends of the Study on City Life-space and Community Sustainable Development in China. Prog. Geogr. 2002, 12, 491–499. [Google Scholar] [CrossRef]
- An, D.; Lu, X.; Song, G.; Wang, Y.; Pu, Y.; Chen, Y. Inclusive Design in the Context of Smart Community; Springer International Publishing: Cham, Switzerland, 2021; pp. 473–479. [Google Scholar]
- Ramlee, M.; Omar, D.; Yunus, R.M.; Samadi, Z. Successful Attractions of Public Space through Users Perception. Environ. Behav. Proc. J. 2016, 1, 188–196. [Google Scholar] [CrossRef]
- Kuo, H.P.; Wu, K.L. The Potential of Cultural Heritage Tourism to Promote Sustainable Urban Development: The Case of Tainan City. Appl. Mech. Mater. 2013, 316–317, 446–450. [Google Scholar] [CrossRef]
- Lane, J. The Digital Street. Am. Behav. Sci. 2016, 60, 43–58. [Google Scholar] [CrossRef]
- Chen, X.; Sun, Y.; Ibrahim, F.I.B.; Kamarazaly, M.A.B.; Abidin, S.N.B.Z.; Tang, S. Social media interaction and built environment effects on urban walking experience: A machine learning analysis of Shanghai Citywalk. PLoS ONE 2025, 20, e0320951. [Google Scholar] [CrossRef]
- Peng, F.; Altieri, B.; Hutchinson, T.; Harris, A.J.; McLean, D. Design for Social Innovation: A Systemic Design Approach in Creative Higher Education toward Sustainability. Sustainability 2022, 14, 8075. [Google Scholar] [CrossRef]
- Liu, L.L.C. Theoretical Logic and Implementation Path of Inclusive Design in Older Communities. Beijing Soc. Sci. 2024, 72–85. [Google Scholar] [CrossRef]
- Brady, S.R. Utilizing and Adapting the Delphi Method for Use in Qualitative Research. Int. J. Qual. Methods 2015, 14, 1609406915621381. [Google Scholar] [CrossRef]
- Büyüközkan, G.; Öztürkcan, D. An integrated analytic approach for Six Sigma project selection. Expert Syst. Appl. 2010, 37, 5835–5847. [Google Scholar] [CrossRef]
- Du, Y.-W.; Li, X.-X. Hierarchical DEMATEL method for complex systems. Expert Syst. Appl. 2021, 167, 113871. [Google Scholar] [CrossRef]
- Kayanan, C.M. A critique of innovation districts: Entrepreneurial living and the burden of shouldering urban development. Environ. Plan. A Econ. Space 2022, 54, 50–66. [Google Scholar] [CrossRef]
- Kumar, S.; Gorane, S.; Kant, R. Modelling the supplier selection process enablers using ISM and fuzzy MICMAC approach. J. Bus. Ind. Mark. 2015, 30, 536–551. [Google Scholar] [CrossRef]
- Mathias, J.-D.; Lade, S.J.; Galaz, V. Multi-level policies and adaptive social networks. A conceptual modeling study for maintaining a polycentric governance system. Int. J. Commons 2017, 11, 220–247. [Google Scholar] [CrossRef]
- Ouyang, Y.; Ye, F.; Tan, K. The effect of strategic synergy between local and neighborhood environmental regulations on green innovation efficiency: The perspective of industrial transfer. J. Clean. Prod. 2022, 380, 134933. [Google Scholar] [CrossRef]
- Hughey, J.; Speer, P.W.; Peterson, N.A. Sense of community in community organizations: Structure and evidence of validity. J. Community Psychol. 1999, 27, 97–113. [Google Scholar] [CrossRef]
- Fromhold-Eisebith, M.; Eisebith, G. What can Smart City policies in emerging economies actually achieve? Conceptual considerations and empirical insights from India. World Dev. 2019, 123, 104614. [Google Scholar] [CrossRef]
- Gustafsson, R.; Jarvenpaa, S. Extending community management to industry-university-government organizations. R&D Manag. 2018, 48, 121–135. [Google Scholar] [CrossRef]
- Liu, C.; Lyu, L.; Wu, Y.; Zhang, Y. Integration of Culture, Education, Industry, City and Business: A New Engine for the Development of Cultural and Creative Industries. Chenkan 2023, 5, 57–59. [Google Scholar] [CrossRef]
- Slessarev-Jamir, H. Exploring the Attraction of Local Congregations to Community Organizing. Nonprofit Volunt. Sect. Q. 2004, 33, 585–605. [Google Scholar] [CrossRef]
- Li, R.; Lu, Y. Toward a resilient and smart city: Analysis on enablers for smart city resilience using an integrated DEMATEL–ISM–ANP method. Technol. Forecast. Soc. Change 2025, 215, 124081. [Google Scholar] [CrossRef]
- Nakajima, H.; Murayama, A. Inclusive urban regeneration approaches through small projects: A comparative study of three Japanese machizukuri cases. Cities 2024, 152, 105241. [Google Scholar] [CrossRef]
- Hwang, J. The Social Construction of a Gentrifying Neighborhood: Reifying and Redefining Identity and Boundaries in Inequality. Urban Aff. Rev. 2016, 52, 98–128. [Google Scholar] [CrossRef]
- Tajfel, H.; Turner, J.C. An Integrative Theory of Intergroup Conflict; Brooks/Cole: Monterey, CA, USA, 1979. [Google Scholar]
- Hu, J.; Cheung, C.K.J. Social identity and social integration: A meta-analysis exploring the relationship between social identity and social integration. Front. Psychol. 2024, 15, 1361163. [Google Scholar] [CrossRef]
- Zhou, S.; Xie, M.; Kwan, M.-P. Ageing in place and ageing with migration in the transitional context of urban China: A case study of ageing communities in Guangzhou. Habitat Int. 2015, 49, 177–186. [Google Scholar] [CrossRef]
- Greenfield, E.A.; Black, K.; Oh, P.; Pestine-Stevens, A. Theories of Community Collaboration to Advance Age-Friendly Community Change. Gerontologist 2021, 62, 36–45. [Google Scholar] [CrossRef] [PubMed]
- Lu, J.; Zhang, N.; Wang, Y. Quality of life among different types of Chinese lonely elderly: A social isolation based analysis. Psychol. Health Med. 2022, 27, 1357–1365. [Google Scholar] [CrossRef]
- Zhu, S.; Li, D.; Feng, H.; Gu, T.; Hewage, K.; Sadiq, R. Smart city and resilient city: Differences and connections. WIREs Data Min. Knowl. Discov. 2020, 10, e1388. [Google Scholar] [CrossRef]
- Davis, F.D. Perceived Usefulness, Perceived Ease of Use, and User Acceptance of Information Technology. MIS Q. 1989, 13, 319–340. [Google Scholar] [CrossRef]
- Khatibi, H.; Wilkinson, S.; Eriwata, G.; Sweya, L.; Baghersad, M.; Dianat, H.; Ghaedi, K.; Javanmardi, A. An integrated framework for assessment of smart city resilience. Environ. Plan. B Urban Anal. City Sci. 2022, 49, 239980832210924. [Google Scholar] [CrossRef]
- Sin, J.; Franz, R.L.; Munteanu, C.; Neves, B.B. Digital Design Marginalization: New Perspectives on Designing Inclusive Interfaces. In Proceedings of the 2021 CHI Conference on Human Factors in Computing Systems, Yokohama, Japan, 8–13 May 2021; p. 380. [Google Scholar] [CrossRef]
- Ji, Y.; Schieck, A.F.G. Exploring the role of data-supported social interaction manifested through public displays. In Proceedings of the 4th Media Architecture Biennale Conference, Beijing, China, 13–16 November 2018; pp. 144–151. [Google Scholar] [CrossRef]
- Andron, S. Selling streetness as experience: The role of street art tours in branding the creative city. Sociol. Rev. 2018, 66, 1036–1057. [Google Scholar] [CrossRef]
- Bourdieu, P. The field of cultural production: Essays on art and literature. J. Aesthet. Art Crit. 1993, 54, 88. [Google Scholar]
- Norberg-Schulz, C. Genius Loci; Rizzoli: New York, NY, USA, 1979. [Google Scholar]
- Zhao, F.; Fashola, O.I.; Olarewaju, T.I.; Onwumere, I. Smart city research: A holistic and state-of-the-art literature review. Cities 2021, 119, 103406. [Google Scholar] [CrossRef]
Disclaimer/Publisher’s Note: The statements, opinions and data contained in all publications are solely those of the individual author(s) and contributor(s) and not of MDPI and/or the editor(s). MDPI and/or the editor(s) disclaim responsibility for any injury to people or property resulting from any ideas, methods, instructions or products referred to in the content. |
© 2026 by the authors. Licensee MDPI, Basel, Switzerland. This article is an open access article distributed under the terms and conditions of the Creative Commons Attribution (CC BY) license.