Abstract
This study investigates the influence of roadway geometry and environmental conditions on traffic crash frequency along a 57 km mountainous segment of the BR-116/SP (Régis Bittencourt Highway), one of Brazil’s most critical freight and passenger corridors. A Generalized Linear Mixed Model (GLMM) with a Negative Binomial distribution was developed using monthly data aggregated by highway segment. Explanatory variables included traffic exposure, geometric design characteristics, and meteorological factors. The results revealed that horizontal curvature and longitudinal grade are key determinants of crash occurrence and that the interaction between these factors substantially amplifies crash risk. Specifically, segments with combined tight curvature (radius < 500 m) and moderate-to-steep grades showed up to a 4.3-fold increase in expected crash frequency compared with straight or flat sections. The model achieved satisfactory fit (RMSE = 1.273) and provided a robust framework for identifying high-risk locations. The findings highlight the importance of geometric consistency and integrated safety management strategies, contributing to sustainable transport management and offering methodological and practical contributions to data-driven road safety policies in Brazil.
1. Introduction
Traffic accidents remain a major global concern due to their substantial impact on mortality and morbidity rates, particularly in emerging countries. Consequently, multiple sectors of society, such as public safety, healthcare systems, and individuals’ quality of life, are affected by the consequences of roadway incidents. In addition to the direct harm to victims, traffic crashes also generate significant social and economic costs that burden both governments and communities [1].
In Brazil, the scale of traffic fatalities underscores the persistence of a critical public safety challenge. In 2023, the country recorded 34,881 traffic deaths, representing an increase of 2.9% compared to 2022 (33,894 deaths) and 6.8% relative to 2018, when 32,655 fatalities were registered. The national traffic mortality rate reached 16.2 deaths per 100,000 inhabitants, maintaining Brazil among the countries with the highest rates worldwide [2]. These figures highlight an alarming scenario of traffic violence that, in addition to its human toll, imposes considerable economic and social costs, reinforcing the urgent need for research-based interventions and effective public policies aimed at reducing roadway fatalities.
Beyond their immediate human and economic impacts, traffic crashes threaten the sustainability of transport systems across multiple dimensions: the social cost of lives lost and injuries, the environmental impact of congestion-related emissions and resource use in emergency response and reconstruction, and the economic burden on healthcare systems and productivity [3,4]. Welle et al. (2018) emphasize that the systematic reduction in fatalities and injuries must be viewed not only as a technical or behavioral challenge but also as a pillar of sustainable development, where the prevention of accidents directly contributes to social well-being, economic stability, and environmental performance [5].
Various factors contribute to the occurrence of traffic crashes, including roadway infrastructure conditions, driver behavior, and vehicle characteristics. Understanding the complex interactions among these elements is essential for developing effective prevention and mitigation strategies [6]. To explore these relationships, crash prediction models play a crucial role in road safety by anticipating accident occurrences and thereby mitigating transportation risks on both urban and rural highways. These models apply statistical methods and historical crash data to identify patterns and link accident frequency to contributing factors under analysis [7]. Developing statistically sound prediction models becomes a key instrument for sustainable risk management, enabling data-driven identification of critical locations and proactive allocation of resources to prevent accidents before they occur. By integrating safety modeling into transport planning, it is possible to promote infrastructure that supports both operational efficiency and long-term sustainability.
Over recent decades, substantial progress has been achieved in crash frequency modeling worldwide. Research efforts have focused on developing models with improved statistical fit and predictive performance, evolving from basic Poisson models to more sophisticated frameworks that account for unobserved heterogeneity and complex data structures [8,9].
Globally, the interaction between roadway infrastructure and safety remains a primary research focus. Recent studies have emphasized the critical role of geometric design consistency and the need for context-sensitive safety analyses, especially in challenging terrains [10,11]. To address persistent analytical challenges, scholars have advanced alternative frameworks, such as random parameters [12,13,14] and finite mixture models, which enhance flexibility in accounting for unobserved heterogeneity.
Despite these methodological advancements, integrating detailed crash-level data with evolving statistical techniques remains one of the most promising frontiers in traffic safety research. Persistent issues, such as overdispersion and limited data granularity, highlight the ongoing need for studies that combine advanced modeling approaches with richer, more comprehensive datasets [8,14].
Despite global advancements, crash prediction models remain highly sensitive to regional roadway characteristics, as accident patterns are influenced by local driving behavior, climatic conditions, and geometric design standards that differ from country to country [15]. Therefore, it is essential to conduct context-specific studies that reflect Brazil’s unique road environment, particularly in highway settings where infrastructure conditions and traffic exposure pose distinct challenges [16,17].
Recent research in Brazil demonstrates growing sophistication in crash prediction modeling and data integration. For instance, Macedo et al. (2022) applied advanced statistical techniques to evaluate the effects of roadway geometry and traffic exposure on crash occurrence, highlighting the importance of regionally calibrated models for rural highways in Pernambuco [18]. Similarly, Isler et al. (2024) examined how urban traffic dynamics and infrastructure characteristics influence accident frequency in São Paulo, reinforcing the relevance of context-sensitive approaches [19]. Moreover, Gomes et al. (2019) showed that incorporating additional variables, such as weather conditions, road surface status, and visibility, significantly improves model accuracy and interpretability. Collectively, these studies reflect a methodological evolution in Brazil toward data-driven, context-aware, and performance-oriented crash prediction frameworks, aligning national research with global advances in road safety analytics [20].
Building on this literature, the present study aims to contribute to the advancement of crash prediction modeling within the Brazilian context. Focusing on the BR-116 highway, specifically a mountainous segment marked by geometric inconsistencies, this research aims to develop a methodological framework capable of enhancing road safety assessment and supporting strategies to reduce traffic fatalities. By integrating statistical modeling with contextual analysis, this study aims to develop a predictive crash frequency model by addressing the following research questions:
- To what extent do horizontal curvature, longitudinal grade, and their interaction influence crash frequency on a mountainous highway?
- How do other infrastructure characteristics (e.g., lane count, shoulder presence, access points) contribute to crash risk in this complex environment?
- Can a Generalized Linear Mixed Model framework with random effects effectively capture the unobserved heterogeneity in crash data from this corridor to provide a robust tool for safety management?
By answering these questions, this research aspires to provide a robust tool for evaluating and improving sustainable safety management in this critical corridor.
2. Materials and Methods
2.1. Study Area
The study was conducted on a segment of the BR-116 highway, one of the most extensive and strategically significant road corridors in Brazil. Extending over 4300 km, BR-116 connects the northern and southern regions of the country, crossing major economic and demographic centers. Due to its heavy traffic volume and importance for freight transport, the highway plays a central role in Brazil’s logistical infrastructure. However, its diverse geometric designs and varying topographical conditions contribute to a persistent record of crash occurrences, particularly along mountainous stretches.
The segment mentioned is located on a mountainous section of the BR-116 in the state of São Paulo (Régis Bittencourt Highway), between km 485 and km 542. This segment corresponds approximately to the stretch between the municipalities of Cajati, SP, and Barra do Turvo, SP, and is part of the federal highway corridor that connects the metropolitan region of São Paulo to the southern states. On this particular stretch, BR-116 traverses complex topography characterized by steep grades, abrupt horizontal curvature, and limited sight distance in several locations. These conditions substantially influence driver behavior and vehicle performance, often leading to higher accident risks. The region also experiences variable climatic patterns, with periods of intense rainfall and fog that directly affect visibility and pavement friction, further exacerbating safety concerns.
This segment of the BR-116 carries a mix of traffic comprising heavy-duty freight vehicles, passenger buses, and private automobiles, reflecting its dual function as both a regional connector and a long-distance transportation route. The combination of heterogeneous traffic, high exposure levels, and challenging geometric conditions has made this corridor one of the most critical segments in terms of traffic safety performance. Historical data indicate a recurrent concentration of crashes, particularly during adverse weather conditions, underscoring the need for detailed analysis of contributing factors and predictive modeling of accident frequency.
Data for this study were aggregated by road segment and monthly period, encompassing variables related to traffic volume, roadway geometric characteristics and infrastructure. The choice of this area was guided by the observed crash concentration and by its representativeness of the challenges faced by similar mountain highways across the national network. The site’s characteristics, combining high traffic exposure, complex geometry, and climatic variability, make it a relevant case study for developing and testing statistical models aimed at improving the understanding and prediction of crash frequency on Brazilian highways.
2.2. Data Sources
The dataset used in this study integrates several sources of information provided mainly by the highway concession company responsible for the analyzed segment of the BR-116 (Régis Bittencourt Highway). The combined datasets encompass traffic crash records, traffic volume measurements, roadway geometry characteristics, and climatic variables, covering the period between 2010 and 2019. To ensure methodological consistency with crash and traffic databases, the study period excluded 2020 due to the atypical traffic patterns caused by COVID-19 restrictions. All information was aggregated by roadway segment and monthly periods to support the statistical modeling of crash frequency.
2.2.1. Crash Data
Crash data were provided by the highway concession company, comprising detailed records of all traffic crashes occurring along the analyzed segment of BR-116/SP between January 2009 and December 2020, totaling 69,140 individual observations. Each record contains variables describing the temporal, spatial, and circumstantial characteristics of the event, such as date, time, location (km marker, direction, latitude, and longitude), crash type, probable cause, road conditions, visibility, number of vehicles involved, and injury severity (fatal, serious, moderate, minor, and non-injury).
2.2.2. Traffic Volume Data
Traffic exposure was represented by Average Daily Traffic (ADT) data obtained from the toll plazas managed by the highway concession company within the study area, specifically between Plaza “P4” (km 485) and Plaza “P5” (km 542). Hourly counts are recorded automatically and disaggregated by vehicle class and travel direction. The data were aggregated monthly to calculate the Monthly Average Daily Traffic (MADT). Between 2010 and 2019, the annual average daily traffic varied between 10,028 and 11,895 vehicles/day, indicating moderate fluctuations influenced by regional economic conditions and seasonal demand.
2.2.3. Roadway Geometry and Infrastructure Data
Because the original highway design drawings were not publicly available, the geometric characteristics of the studied segment were reconstructed using AutoCAD® (version 2025) and georeferenced mapping techniques. The horizontal alignment was determined from high-resolution satellite imagery, allowing the estimation of deflection angles (Δ), curve radius (r), curve length (D), and tangent length (T) following the geometric relationships described by Pimenta & Oliveira (2004) [21].
The longitudinal profile was extracted using elevation data from Google Earth®, and complementary visual inspection through Google Street View® was conducted to identify lane configuration, shoulder presence, and access points. In total, 76 horizontal curves were identified along the 57 km corridor, confirming the high curvature density of this mountainous section.
The derived geometric variables incorporated into the modeling database include curve radius (m), curve development (m), segment length (m), percentage of curved alignment (%), regulatory speed (km/h), number of lanes, number of access points, land-use type (0 = rural, 1 = urban), shoulder presence (0 = No, 1 = Yes), and mean longitudinal grade (%).
2.2.4. Meteorological Data
Climatic information was obtained from the Brazilian National Institute of Meteorology (INMET), using data from the automatic weather station of Barra do Turvo (São Paulo), the closest active station to the study area. The dataset includes monthly accumulated precipitation (mm) and temperature records from December 2009 to December 2019. Annual accumulated precipitation ranged from 372 mm (2012) to 2020 mm (2017), reflecting significant interannual climatic variability in the region [22].
Table 1 summarizes the main variables and data sources used in this study, including information on crash occurrences, traffic exposure, roadway geometry, and climatic conditions. All variables were aggregated by segment and month to ensure consistency across datasets and support the modeling of crash frequency.

Table 1.
Summary of data sources and variables.
The descriptive statistics of the main continuous variables used in the modeling are presented in Table 2. The dataset, aggregated by segment and month, comprised 26,400 observations. The average crash frequency was 0.43 per segment-month, indicating the typical rarity of such events. The geometric variables show significant variation, with curve radii ranging from straight segments (0 m) to large radii (1430 m) and grades reaching up to 11.2%, confirming the challenging topography of the study corridor.
Table 2.
Descriptive statistics of continuous variables used in the crash frequency model.
2.3. Methodology
The methodological framework adopted in this study aims to model the relationship between crash frequency and explanatory variables associated with traffic exposure, roadway geometry, and weather conditions along the BR-116/SP highway segment between km 485 and km 542. The analysis was conducted using a Generalized Linear Mixed Modeling (GLMM) approach, which allows the incorporation of both fixed and random effects to account for unobserved heterogeneity across road segments and time periods. The overall methodological framework is summarized in Figure 1.
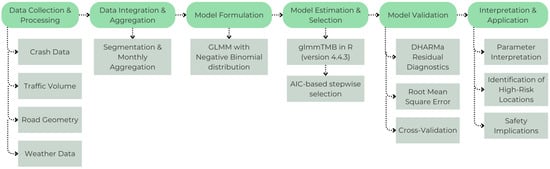
Figure 1.
Methodological Workflow.
2.3.1. Statistical Modeling
To ensure analytical consistency, all variables were aggregated by road segment and monthly period, resulting in a panel dataset where each observation represents a combination of segment i and month t. The dependent variable corresponds to the total number of crashes registered within each segment-month combination. Explanatory variables include traffic volume (ADT), roadway geometry indicators (e.g., curve radius, longitudinal grade, lane configuration, and land use), and meteorological variables (monthly rainfall and temperature). Categorical variables were transformed into binary or dummy variables, while continuous predictors were standardized to improve model convergence and interpretability.
Crash frequency data typically exhibit non-negative integer values and overdispersion, violating the equidispersion assumption of the Poisson distribution. To address this, the model was estimated under a Negative Binomial (NB) distribution, which introduces an additional dispersion parameter to accommodate extra-Poisson variation. The general form of the model can be expressed as:
where
- represents the number of crashes observed on segment i during month t;
- is the expected crash frequency;
- denotes the set of explanatory variables;
- are fixed-effect coefficients;
- and represent random intercepts accounting for unobserved effects specific to road segments and time periods, respectively;
- is the dispersion parameter of the negative binomial distribution.
This mixed-effects specification captures both the spatial correlation among segments and temporal dependence across months, providing a more robust framework than conventional count models [23].
It should be noted that while the random effect captures unobserved heterogeneity specific to segment i, the model specification does not include an explicit spatial structure (e.g., a conditional autoregressive term) to account for spatial autocorrelation between neighboring segments.
All analyses were performed using the R statistical environment within RStudio version 4.4.3, employing the glmmTMB package [24] for model estimation. This package supports flexible parameterizations of GLMMs with different distributions, including Poisson, Negative Binomial, and Zero-Inflated variants, enabling comparative model assessment.
Initially, multiple candidate models were estimated to identify the distribution that best fit the data (Poisson, Negative Binomial, and Zero-Inflated Negative Binomial). The stepwise selection procedure was then applied to identify significant predictors, using both forward and backward approaches based on the Akaike Information Criterion (AIC).
Interaction terms between climatic and geometric variables were tested to evaluate whether the effect of rainfall or visibility conditions varied across roadway configurations, such as steep grades or sharp curves. Variables with p-values greater than 0.05 were iteratively removed to achieve a parsimonious and well-fitted model.
After selecting the final specification, parameter estimates were interpreted in terms of expected percentage change in crash frequency associated with a one-unit change in each predictor, holding other factors constant. Random-effect variances were analyzed to assess the contribution of segment-specific and temporal variability to overall crash occurrence.
2.3.2. Model Evaluation
To evaluate model performance, both predictive accuracy and goodness of fit were assessed through complementary statistical indicators. The Root Mean Square Error (RMSE) was calculated to quantify the average deviation between observed and predicted crash frequencies. Lower RMSE values indicate higher predictive precision of the fitted model.
The Akaike Information Criterion (AIC) was used for comparative assessment of alternative model specifications. The AIC is defined by the equation:
where represents the log-likelihood value of the fitted model, and k is the number of estimated parameters. This criterion penalizes more complex models, preventing overfitting and favoring those that achieve a good fit with a smaller number of parameters. The AIC does not provide an absolute measure of model quality but rather a relative one, allowing the comparison of multiple models fitted to the same dataset. Thus, among two or more candidate models, the one with the lowest AIC value is preferred, as it presents a better balance between goodness of fit and parsimony [23].
Furthermore, DHARMa residual diagnostics [25] confirmed the adequacy of the negative binomial assumption, revealing no significant overdispersion or zero-inflation issues. The DHARMa plots displayed residuals distributed closely around the reference line, suggesting the absence of systematic bias in model predictions. Overall, the model exhibited satisfactory fit and predictive reliability, supporting its application as a methodological tool for understanding the combined effects of roadway geometry, traffic exposure, and climatic conditions on crash frequency along the BR-116/SP corridor.
3. Results
The Generalized Linear Mixed Model (GLMM) with a Negative Binomial distribution was identified as the most suitable specification for modeling crash frequency along the BR-116/SP mountainous corridor. Comparative tests with Poisson and Zero-Inflated variants confirmed that the Negative Binomial model provided the best balance between fit and parsimony, presenting the lowest Akaike Information Criterion (AIC) value and no evidence of residual overdispersion. As shown in Table 3, the Negative Binomial model presented the lowest Akaike Information Criterion (AIC = 13,397.6), indicating superior balance between fit and parsimony. The zero-inflation component was not statistically significant, confirming that the NB structure adequately captured the data’s dispersion.
Table 3.
Comparison of model fit with different distributions.
Traffic volume (Quarterly Average Daily Traffic, VDMT) was incorporated as an offset term to account for exposure levels. Random effects were introduced for time (quarterly period), capturing unobserved temporal variability across the study horizon.
The final model included the following explanatory variables, all statistically significant at the 5% level (p < 0.05): Mean longitudinal grade (three categories); Curve radius (three categories); Interaction between grade and curve radius; Presence of shoulder (binary); Number of accesses per segment; Number of traffic lanes. This specification enabled an integrated assessment of how geometric and infrastructural characteristics jointly influence crash frequency along the BR-116/SP corridor. The estimated coefficients and associated statistics are summarized in Table 4.
Table 4.
Estimates of the final GLMM.
Results show that road geometry exerts a strong influence on crash frequency. Longitudinal grade exhibited a negative relationship with crash counts: segments with moderate slopes (0–5%) showed a 68% reduction in crash frequency, while steeper slopes (>5%) showed a 47% reduction, relative to flat segments. Horizontal curvature also significantly affected crash frequency. Tight curves (radius < 500 m) increased the expected crash count by approximately 49%, while large-radius curves (>1000 m) reduced it by about 84% compared to straight segments.
The interaction between grade and curvature was critical. Segments combining moderate slopes (category 2) and sharp curves (category 1) presented a 428% increase in expected crashes, while steeper grades (category 3) combined with sharp curves showed a 330% increase. These findings confirm that the coexistence of vertical and horizontal geometric challenges substantially amplifies crash risk on mountainous highways.
Infrastructure variables showed contrasting impacts. The presence of a shoulder was positively associated with crash frequency, increasing expected crashes by around 150%. Although counterintuitive, this effect likely reflects the correlation between shoulders and higher traffic, more complex segments rather than a direct causal risk. In contrast, the number of accesses exhibited a protective effect, with each additional access reducing crash frequency by approximately 27%, possibly due to lower average speeds and more cautious driver behavior in areas with increased entry–exit density. The number of lanes had a strong positive coefficient: each additional lane was associated with a 200% increase in crash frequency, indicating that wider cross-sections, while enhancing capacity, may encourage higher speeds and more complex vehicle interactions.
Model Validation and Performance
Residual diagnostics using the DHARMa package [25] indicated an overall satisfactory model fit, as shown in Figure 2. The quantile–quantile (QQ) plot showed well-distributed residuals along the reference line (Kolmogorov–Smirnov test, p = 0.94), with no outliers detected (p = 1). Only slight overdispersion was observed (p = 0.022), suggesting minimal unexplained variance. The residual vs. fitted plot exhibited a nearly uniform pattern around the zero line, with minor deviations at the upper tail corresponding to a few segments with higher crash counts.
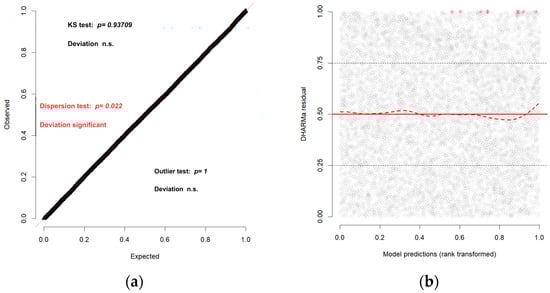
Figure 2.
Model diagnostic plots: (a) QQ plot of residuals; (b) Residuals versus predicted values.
Performance metrics further validated the model’s adequacy. RMSE was equal to 1.273, indicating a small mean deviation (≈1.3 crashes per segment-period), reasonable for rare-event data. This value should be analyzed considering the scale of the dependent variable, as the number of accidents tends to be low in most road segments and time intervals considered. Thus, although the RMSE reveals the presence of discrepancies between predictions and actual observations, it can still be considered acceptable in the context of modeling rare and highly variable phenomena, such as traffic accidents on highways.
Random-effect analysis (Figure 3) revealed modest temporal variability, with most quarterly periods clustering near the reference value. This confirms that the random effect for time effectively captured minor unobserved fluctuations without compromising fixed-effect stability.
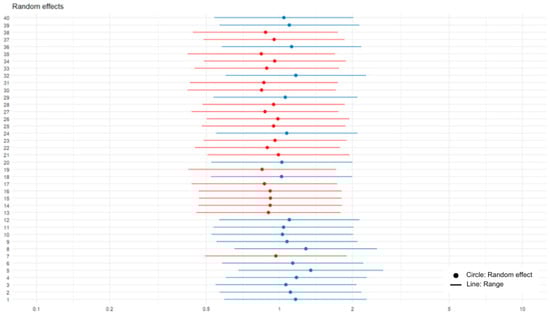
Figure 3.
Random effects by time period.
4. Discussion
The results emphasize that the combined geometric design of roadway segments is a dominant factor in crash occurrence, especially when curvature and grade interact. The magnified risk observed in steep, curved segments highlights the need for integrated geometric consistency assessments, rather than evaluating alignment elements in isolation. Infrastructure elements also play a key role. While shoulders and additional lanes are typically designed to improve capacity and safety, their association with higher crash frequencies in this study underscores the importance of contextual interpretation, as such features often coincide with higher exposure and operational complexity.
While the model successfully identified key geometric risk factors, some results regarding infrastructure variables warrant careful interpretation. The strong positive association between shoulder presence and crash frequency, for instance, is counter to conventional safety wisdom. Rather than indicating a causal risk effect, this likely reflects a spurious correlation where paved shoulders are systematically present on segments with higher traffic volumes, greater geometric complexity, and historically identified high crash rates, precisely the locations where such safety features are often prioritized for installation. Future research should employ techniques to better disentangle this correlation, such as network-scale analysis or before-and-after studies of shoulder implementation.
Similarly, the protective effect of an increased number of access points, while potentially explained by reduced speeds and heightened driver caution, contrasts with the conventional understanding that access points increase conflict points. This finding may be specific to the traffic composition and operational context of this mountainous rural corridor and should not be generalized without further investigation.
Furthermore, the absence of climatic variables like precipitation and temperature from the final model, despite their collection, represents a limitation in capturing the full spectrum of risk. These variables were not retained during the stepwise selection process, potentially due to the monthly aggregation of data obscuring the immediate, transient impact of weather events on crash occurrence. The model’s predictive power could likely be enhanced in future work by incorporating higher-resolution, real-time weather data and visibility indices. Furthermore, a triple interaction between curvature, grade, and rainfall was tested but was not significant, a finding we also attribute to the data aggregation level, which masks short-term risk dynamics.
Nevertheless, the findings align with previous studies, such as Ng & Sayed (2004) and Islam et al. (2019), who reported that discontinuities in geometric alignment substantially elevate crash risk [26,27]. Our results corroborate the work of Qi et al. (2024), who also found strong interaction effects between horizontal and vertical alignment on safety performance [10]. Furthermore, they support the conclusions of Macedo et al. (2022) and Isler et al. (2024), who found that incorporating geometric parameters into crash frequency models enhances their predictive accuracy on Brazilian highways [18,19]. The significant role of geometric design highlighted in our study is consistent with a global consensus on its importance for road safety on mountain roads.
Overall, the selected model’s main strength lies in its ability to handle the nature of count data through the Negative Binomial distribution, which adequately accommodates the excess variability relative to the Poisson distribution. In addition, the inclusion of random effects allowed for the capture of part of the temporal heterogeneity associated with the observation period, reducing biases in the fixed estimates and improving the robustness of the fit. Another positive aspect is the identification of significant explanatory variables, such as geometric road characteristics and infrastructure factors, which reinforce the theoretical plausibility of the model.
Our findings on the significance of geometric design also have important implications for climate change adaptation and extreme weather resilience. As noted by Yang et al. (2025), changing climate patterns are expected to increase the frequency and intensity of extreme weather events, such as heavy rainfall and landslides, particularly in mountainous regions [28]. The identified high-risk segments (those with combined tight curves and steep grades) are likely to be disproportionately vulnerable to these changes. For instance, heavy rainfall can drastically reduce pavement friction and visibility, exacerbating the already elevated risk on these geometric complexes. Therefore, safety interventions in these locations should not only address the inherent geometric deficiencies but also incorporate climate-resilient features such as enhanced drainage systems, slope stabilization, and weather-responsive traffic management strategies to build a more resilient highway system for the future.
However, some other limitations should be noted: despite the improvement over other fits, the model still showed signs of residual overdispersion, suggesting the presence of unexplained variability. Furthermore, the absence of external variables, such as weather and operational conditions, may have limited its predictive power. Therefore, although the model is suitable and consistent for exploratory analysis and understanding of the factors associated with accidents, its predictive performance should be interpreted with caution and can be improved by including additional covariates and more complex structures.
In addition, a limitation of the current modeling approach is that it does not explicitly account for spatial autocorrelation. The residuals from our model were tested for spatial dependence using Moran’s I, and a slight positive spatial autocorrelation was detected. This suggests that crash risk in one segment may be influenced by the risk in adjacent segments, potentially due to unobserved factors like consistent driver behavior over a stretch of road or regional weather patterns. Future research could significantly enhance the model’s robustness by integrating spatial econometric techniques, such as incorporating a spatial lag or error structure into the GLMM framework, to formally account for these network effects.
The results provide a solid empirical foundation for data-driven road safety management, supporting targeted interventions such as geometric realignment, improved signage and drainage, and stricter control of speeds on high-risk segments.
5. Conclusions and Future Research
This study developed and applied a Generalized Linear Mixed Model (GLMM) with a Negative Binomial distribution to analyze the relationship between crash frequency and explanatory factors related to roadway geometry, infrastructure characteristics, and traffic exposure along a 57 km mountainous segment of the BR-116/SP (Régis Bittencourt Highway) in Brazil. The model incorporated random effects for time and revealed statistically significant relationships between crash frequency and several geometric and operational attributes.
The results demonstrated that horizontal curvature and longitudinal grade are key determinants of crash occurrence. Segments with tighter curves and steeper slopes exhibited substantially higher crash frequencies, and the interaction between these two factors amplified crash risk by more than fourfold. This finding confirms that road geometry should not be assessed in isolation, but instead, combined geometric designs should have synergistic effects that substantially influence driver behavior and vehicle stability.
Furthermore, the presence of shoulders and a higher number of lanes were positively associated with crash counts. Although these features are generally designed to enhance operational safety, their positive coefficients are likely to reflect higher traffic exposure and complexity in those areas. Conversely, segments with more access points exhibited reduced crash frequencies, possibly due to lower operating speeds and increased driver caution in those environments.
Model performance indicators, such as RMSE = 1.273, confirmed an acceptable level of predictive accuracy and explanatory power for aggregate crash data, which typically display high stochastic variability. Diagnostic tests indicated no major violations of model assumptions, validating the robustness of the proposed specification.
The findings have important implications for road safety policy and infrastructure management in Brazil and similar contexts, such as:
- Integrated geometric design: The strong interaction effects between slope and curvature highlight the need for geometric consistency assessments during both design and maintenance stages. Corrective measures include integrated geometric consistency reviews during the design and audit phases for mountainous highways, while for existing roads, the need to prioritize corrective treatments on segments with a curve radius < 500 m and a grade > 3% is highlighted. Treatments should be tiered:
- Low-Cost: Implement advanced warning signs with curve advisory speeds and “Slippery When Wet” plaques, combined with high-friction surface treatments on the approach and within the curve.
- Medium-Cost: Install automated weather-activated warning systems that trigger variable message signs when rainfall is detected.
- High-Cost (Long-term): Plan for geometric realignment or the construction of emergency escape ramps for runaway trucks on the steepest grades.
- Targeted safety interventions: Identifying high-risk combinations of alignment features provides empirical support for prioritizing investments in specific segments of BR-116/SP, focusing on low-radius curves with steep grades. Road managers can use the model’s predictions to create a risk-based prioritization map. Segments with a predicted crash frequency in the top 10% should be scheduled for immediate low-cost interventions (e.g., improved signage, pavement markings, speed cameras) while planning for long-term, high-cost improvements (e.g., geometric redesign).
- Speed management strategies: Given the positive relationship between lane width and crash frequency, context-sensitive speed regulation and improved signage or road markings should be considered to reduce excessive speeds in wide-lane or multilane sections.
- Weather-responsive safety programs: As the study area is exposed to high rainfall variability, integrating real-time weather and visibility monitoring systems into operational management could enhance driver awareness and adaptive behavior during adverse conditions.
- Data-driven planning: Highway concessionaires should integrate models like the one developed here into their asset management systems. This tool would automatically flag high-risk segments, allowing for the proactive allocation of maintenance and safety budgets and scheduling targeted patrols or speed enforcement during high-risk periods (e.g., holiday weekends, rainy seasons).
- Proactive Maintenance: Integrate safety predictions into maintenance schedules. For example, ensure that drainage systems are fully functional on high-risk segments to prevent water accumulation during heavy rain, and prioritize winter maintenance (e.g., anti-icing) on these same segments.
From a broader perspective, this research contributes directly to the goals of sustainable transportation. By preventing crashes, the model supports social sustainability through the preservation of human life and well-being, aligning with UN SDGs 3.6 and 11.2. Environmentally, crash reduction minimizes congestion-induced idling, leading to lower vehicle emissions, and reduces the environmental footprint of emergency responses and road repairs. Economically, the proactive, data-driven approach advocated here enables more efficient allocation of public and private resources for safety investments, preventing the substantial economic costs associated with crashes, including medical expenses, property damage, and lost productivity, thereby fostering a more resilient and cost-effective transport system [1].
Directions for Future Research
While the results provide meaningful insights, certain limitations should be acknowledged. The study relied on aggregated monthly data, which, despite capturing temporal trends, may obscure event-level variability such as time-of-day or vehicle-type effects. Additionally, climatic variables were limited to rainfall and temperature due to data availability; therefore, future studies should incorporate visibility indices, pavement friction, and real-time weather indicators to refine model sensitivity. Expanding the temporal coverage and integrating crash severity models (e.g., multinomial logit frameworks) would also enhance the understanding of how geometric and environmental factors influence not only frequency but also crash outcomes.
A key data limitation was the monthly level of aggregation, which was dictated by data availability. While it captures broad trends, it obscures the short-term, dynamic interactions between traffic, weather, and crashes. Future research should prioritize the collection and use of daily or even hourly data to model these immediate effects, particularly the impact of transient adverse weather conditions like heavy rainfall or fog on high-risk geometric segments.
Likewise, the future of crash prediction lies in harnessing high-resolution, real-time data from emerging technologies. Connected Vehicle (CV) data can provide insights into microscopic driving behaviors (e.g., hard braking, rapid acceleration) that are precursors to crashes. IoT sensor networks embedded in infrastructure can offer real-time measurements of pavement condition, friction, and water film depth. Moreover, smartphone probe data can generate rich datasets on travel patterns, average speeds, and congestion at a fraction of the cost of traditional sensors. Integrating these novel data streams into predictive models will enable a shift from reactive to truly proactive and real-time safety management.
Furthermore, future models should employ spatial regression techniques (e.g., Conditional Autoregressive—CAR models) or Bayesian Spatial models to directly account for spatial autocorrelation and provide more accurate estimates of the influence of geometric variables.
A critical next step is to conduct a detailed cost–benefit analysis (CBA) of the safety interventions proposed for the high-risk segments identified by the model. Such a study would require collecting precise cost data for countermeasures and valuing the safety benefits, thereby providing road authorities with a clear economic justification for investing in data-driven safety improvements.
The results underscore the value of mixed-effects statistical modeling in identifying the structural and operational determinants of crash occurrence in complex roadway environments. By quantifying the combined influence of geometry, traffic, and environmental conditions, this study contributes to the empirical foundation needed to support evidence-based policymaking in Brazil’s highway safety management. Ultimately, the methodological approach and empirical findings provide a replicable basis for advancing data-informed, context-sensitive interventions that promote safer and more sustainable highway systems.
Author Contributions
Conceptualization, A.P.C.L. and F.L.d.C.; methodology, F.L.d.C. and O.Y.E.A.; software, F.L.d.C.; validation, F.L.d.C.; formal analysis, F.L.d.C. and O.Y.E.A.; investigation, F.L.d.C. and A.P.C.L.; resources, A.P.C.L.; data curation, F.L.d.C.; writing—original draft preparation, F.L.d.C.; writing—review and editing, F.L.d.C., A.P.C.L. and O.Y.E.A.; visualization, F.L.d.C.; supervision, A.P.C.L. and O.Y.E.A.; project administration, A.P.C.L.; funding acquisition, A.P.C.L. All authors have read and agreed to the published version of the manuscript.
Funding
This research was supported by the Coordinate Improvement of University Personnel (CAPES)—88887.957699/2024; and Conselho Nacional de Pesquisa e Desenvolvimento (CPNq)—407056/2022.
Institutional Review Board Statement
Not applicable.
Informed Consent Statement
Not applicable.
Data Availability Statement
No new data were created in this study. Data sharing obtained during the project does not apply to this article due to legal and privacy issues.
Conflicts of Interest
The authors declare no conflicts of interest.
References
- BRASIL. Ministry of Health. Health Surveillance Secretariat. Department of Noncommunicable Diseases and Health Promotion. In Health Brazil 2014: An Analysis of the Health Situation and External Causes; Ministry of Health: Brasília, Brazil, 2015; 462p. [Google Scholar]
- Institute for Applied Economic Research [IPEA]; Brazilian Forum on Public Safety [FBSP]. Atlas of Violence 2025; IPEA: Brasília, Brazil; FBSP: São Paulo, Brazil, 2025. Available online: https://www.ipea.gov.br/atlasviolencia (accessed on 14 September 2025).
- United Nations (UN). Transforming Our World: The 2030 Agenda for Sustainable Development; Resolution adopted by the General Assembly on 25 September 2015 (A/RES/70/1); United Nations: New York, NY, USA, 2015; Available online: https://sdgs.un.org/2030agenda (accessed on 14 September 2025).
- Koundouri, P.; Anquetil-Deck, C.; Becchetti, L.; Berthet, E.; Borghesi, S.; Cavalli, L.; Chioatto, E.; Cruickshank, E.; Devves, S.; Dibattista, I.; et al. Transforming Our World: Interdisciplinary Insights on the Sustainable Development Goals; Sustainable Development Solutions Network (SDSN) European Green Deal Senior Working Group: Paris, France, 2023; Available online: https://www.unsdsn.org/resources/transforming-our-world-interdisciplinary-insights-on-the-sustainable-development-goals/ (accessed on 14 September 2025).
- Welle, B.; Bray Sharpin, A.; Adriazola-Steil, C.; Job, S.; Shotten, M.; Bose, D.; Bhatt, A.; Alveano, S.; Obelheiro, M.; Imamoglu, T. Sustainable & Safe: A Vision and Guidance for Zero Road Deaths; World Resources Institute (WRI) and Global Road Safety Facility (World Bank): Washington, DC, USA, 2018; Available online: https://www.wri.org/research/sustainable-and-safe-vision-and-guidance-zero-road-deaths (accessed on 14 September 2025).
- Elvik, R.; Høye, A.; Vaa, T.; Sørensen, M. (Eds.) The Handbook of Road Safety Measures, 2nd ed.; Emerald Group Publishing Limited: Bradford, UK, 2009; pp. 1–140. ISBN 978-1-84855-250-0. [Google Scholar]
- AASHTO. Highway Safety Manual; American Association of State Highway and Transportation Officials: Washington, DC, USA, 2010. [Google Scholar]
- Lord, D.; Mannering, F. The statistical analysis of crash-frequency data: A review and assessment of methodological alternatives. Transp. Res. Part A 2021, 44, 291–305. [Google Scholar] [CrossRef]
- Chen, F.; Chen, S.; Ma, X. Analysis of hourly crash likelihood using unbalanced panel data mixed logit model and real-time driving environmental big data. J. Saf. Res. 2018, 65, 153–159. [Google Scholar] [CrossRef] [PubMed]
- Qi, Z.; Yao, J.; Zou, X.; Pu, K.; Qin, W.; Li, W. Investigating Factors Influencing Crash Severity on Mountainous Two-Lane Roads: Machine Learning Versus Statistical Models. Sustainability 2024, 16, 7903. [Google Scholar] [CrossRef]
- Pervaz, S.; Bhowmik, T.; Eluru, N. Integrating macro and micro level crash frequency models considering spatial heterogeneity and random effects. Anal. Methods Accid. Res. 2022, 36, 100238. [Google Scholar] [CrossRef]
- Theofilatos, A. Incorporating real-time traffic and weather data to explore road accident likelihood and severity in urban arterials. J. Saf. Res. 2017, 61, 9–21. [Google Scholar] [CrossRef] [PubMed]
- Champahom, T.; Se, C.; Watcharamaisakul, F.; Jomnonkwao, S.; Karoonsoontawong, A.; Ratanavaraha, V. Tree-based approaches to understanding factors influencing crash severity across roadway classes: A Thailand case study. IATSS Res. 2024, 48, 464–476. [Google Scholar] [CrossRef]
- Khan, S.A.; Afghari, A.P.; Yasmin, S.; Haque, M. Effects of design consistency on run-off-road crashes: An application of a Random Parameters Negative Binomial Lindley model. Accid. Anal. Prev. 2023, 186, 107042. [Google Scholar] [CrossRef] [PubMed]
- Chen, S.; Saeed, T.U.; Alinizzi, M.; Lavrenz, S.; Labi, S. Safety sensitivity to roadway characteristics: A comparison across highway classes. Accid. Anal. Prev. 2019, 123, 39–50. [Google Scholar] [CrossRef] [PubMed]
- Wanke, P.; Gil-Alana, L.A.; Tan, Y. Trends in road accidents on Brazil’s highways: Evidence of persistence using fractional integration. PLoS ONE 2023, 18, e0287302. [Google Scholar] [CrossRef] [PubMed]
- Franceschi, L.; Kaesemodel, L.; de Vargas, V.D.C.C.; Konrath, A.C.; Nakamura, L.R.; Ramires, T.G.; Barreto, C.B.M.; Valente, A.M. Fatores relacionados à severidade de acidentes em rodovias no Brasil através de um modelo de regressão logística multinomial. Transportes 2022, 30, 2566. [Google Scholar] [CrossRef]
- Macedo, M.R.; Maia, M.L.; Rabbani, E.R.K.; Neto, O.C.L.; Andrade, M. Traffic Accident Prediction Model for Rural Highways in Pernambuco. Case Stud. Transp. Policy 2022, 10, 278–286. [Google Scholar] [CrossRef]
- Isler, C.A.; Huang, Y.; de Melo, L.E.A. Developing Accident Frequency Prediction Models for Urban Roads: A Case Study in São Paulo, Brazil. IATSS Res. 2024, 48, 378–392. [Google Scholar] [CrossRef]
- Gomes, M.M.; Pirdavani, A.; Brijs, T.; Pitombo, C.S. Assessing the Impacts of Enriched Information on Crash Prediction Performance. Accid. Anal. Prev. 2019, 122, 162–171. [Google Scholar] [CrossRef] [PubMed]
- Pimenta, C.R.T.; Oliveira, M.P. Projeto Geométrico de Rodovias [Highway Geometric Design], 2nd ed.; RiMa Publisher: São Carlos, Brazil, 2004; 198p. [Google Scholar]
- INMET—National Institute of Meteorology. INMET Portal. 2025. Available online: https://portal.inmet.gov.br/ (accessed on 3 August 2025).
- Hardin, J.W.; Hilbe, J.M. Generalized Linear Models and Extensions, 2nd ed.; Stata Press: College Station, TX, USA, 2007. [Google Scholar]
- Brooks, M.; Bolker, B.; Kristensen, K.; Maechler, M.; Magnusson, A.; Skaug, H.; Nielsen, A.; Berg, C.; Van Bentham, K. glmmTMB: Generalized Linear Mixed Models Using Template Model Builder. Package Manual, Version 1.1.12. 2025. Available online: https://github.com/glmmTMB/glmmTMB (accessed on 28 September 2025).
- Hartig, F. DHARMa: Residual Diagnostics for Hierarchical (Multi-Level/Mixed) Models. Version 0.4.7, 2024. Available online: https://cran.r-project.org/package=DHARMa (accessed on 28 September 2025).
- Ng, J.C.; Sayed, T. Effect of geometric design consistency on road safety. Can. J. Civ. Eng. 2004, 31, 218–227. [Google Scholar] [CrossRef]
- Islam, H.; Hua, L.T.; Hamid, H.; Azarkerdar, A. Relationship of accident rates and road geometric design. IOP Conf. Ser. Earth Environ. Sci. 2019, 357, 012040. [Google Scholar] [CrossRef]
- Yang, Y.; Huang, H.; Li, G.; Han, B.; Yuan, Z.; Ma, H. A systematic review of resilience assessment and enhancement of urban integrated transportation networks. J. Transp. Geogr. 2025, 129, 104420. [Google Scholar] [CrossRef]
Disclaimer/Publisher’s Note: The statements, opinions and data contained in all publications are solely those of the individual author(s) and contributor(s) and not of MDPI and/or the editor(s). MDPI and/or the editor(s) disclaim responsibility for any injury to people or property resulting from any ideas, methods, instructions or products referred to in the content. |
© 2025 by the authors. Licensee MDPI, Basel, Switzerland. This article is an open access article distributed under the terms and conditions of the Creative Commons Attribution (CC BY) license.