Abstract
Understanding the driving forces of land use and land cover change (LUCC) is crucial for revealing the coupled dynamics of human–land systems and supporting optimized spatial planning and resource allocation. To overcome the limitations of conventional Geodetector applications in mountainous regions with complex terrain, this study proposes a terrain–population dual-factor adaptive grid designed for use with the Geodetector model. This adaptive grid refines cells in steep and densely populated areas while merging cells in flatter and sparsely populated regions, thus capturing both natural and socioeconomic heterogeneity. Coupled with the Geodetector model, this framework improves the accuracy and computational efficiency of identifying LUCC drivers. Using the Chongqing Metropolitan Area (CMA) as a case study, LUCC dynamics and their driving mechanisms were systematically examined based on five annual land cover datasets (from 2000 to 2020 at five-year intervals.). The results show the following: (1) From 2000 to 2020, cropland, forest land, and built-up land were the dominant land use types. During this period, cropland and forest land declined, whereas built-up land expanded continuously, with the most pronounced changes occurring between 2000 and 2010. (2) The dominant drivers of LUCC shifted over time: socioeconomic factors such as population density and GDP were primary drivers from 2000 to 2010, while both natural and socioeconomic factors exerted strong influence between 2010 and 2020. (3) The proposed terrain–population dual-factor irregular grid performed better than traditional regular grids in detecting socioeconomic drivers while retaining comparable explanatory power for natural factors. Compared with traditional regular grids, with an average q-value improvement of 18.7% and a 55.52% reduction in sampling points, resulting in substantially improved computational efficiency. Overall, the proposed method enhances the applicability of Geodetector in complex mountainous cities and provides practical implications for urban land use regulation and refined spatial management.
1. Introduction
Land use and land cover change (LUCC) directly affects regional ecosystem services [1,2,3], resource security and environmental stability, and the capacity for sustainable development [4,5]. Understanding the driving forces of LUCC is essential for revealing the human–environment systems and for informing more effective land management strategies. Previous research has revealed consistent LUCC dynamics. These include cropland loss due to urban expansion, forest recovery following ecological restoration initiatives, and terrain-driven fragmentation in mountainous regions. These patterns are largely attributed to the combined influence of natural constraints, socioeconomic gradients, and major policy interventions. Integrating such findings provides a broader conceptual foundation for understanding LUCC processes in the Chongqing Metropolitan Area. With the rapid development of remote sensing and geographic information system (GIS) technologies, quantitative assessments of LUCC have increasingly been conducted across multiple spatial scales. Widely applied analytical frameworks include binary logistic regression [6,7,8], principal component analysis [9,10,11], geographically weighted regression [12,13], and the Geodetector model [14].
Among these, the Geodetector model is widely applied in LUCC driver analysis due to its robustness to multicollinearity, ability to reveal spatial heterogeneity, and capacity to identify underlying driving mechanisms [15]. Representative applications include analyses of the determinants of traditional village spatial distribution in the Yangtze River Basin, LUCC drivers in the Wei River Basin, and rural built-up land expansion across China [16,17,18]. At present, most Geodetector applications concentrate on differentiation and factor detection (q-value estimation), as well as on interaction detection. Recent studies have additionally aimed to optimize the discretization process of the Geodetector to improve model performance. For example, Song [19] proposed an optimal-parameter Geodetector framework, which automatically selects the most suitable discretization strategy across multiple classification schemes to maximize the explanatory power (q-value) of driving factors.
For irregular spatial units, such as administrative boundaries, most conventional approaches rasterize the study area into regular grid cells and extract covariates and response variables either by extracting values at grid-cell centers or by using areal statistics as inputs. However, in topographically complex regions, regular grids structures often fail to capture fine-scale spatial heterogeneity, limiting the model’s adaptability and reducing detection efficiency in mountainous cities. Although adaptive grid techniques have rarely been applied within the Geodetector framework, their effectiveness has been demonstrated in several related fields. In point cloud processing, for instance, Zheng et al. [20] proposed a two-stage adaptive grid progressive TIN densification (AGPTD) based on point cloud density and terrain slope to better retain topographic features and enhance LiDAR data accuracy. In navigation and positioning, Zou et al. [21] developed a spatial-domain adaptive grid partitioning method to optimize multipath error modeling and improve parameter representation capacity. Moreover, in mining areas characterized by complex terrain and dense vegetation, adaptive grids have been utilized for ground point extraction from laser point clouds. Through iterative refinement of grid size and threshold parameters, these studies achieved a closer approximation to the actual terrain surface [22]. Collectively, these findings highlight that adaptive grid approaches can substantially enhance information capture and computational efficiency in complex topographic environments. However, existing Geodetector-based LUCC studies still rely predominantly on fixed regular grid units, with limited exploration of adaptive discretization methods. Moreover, adaptive grid designs specifically tailored to mountainous urban environments are largely absent. These gaps underscore the necessity of integrating adaptive grid concepts into Geodetector analyses to better capture spatial heterogeneity in regions with complex terrain. Therefore, adopting adaptive grid approaches offers an effective way to enhance spatial discretization quality and improve the interpretability of driving-force analyses in complex terrain.
Existing LUCC research has focused primarily on flat basins [23,24] or agro-pastoral ecotones [25,26], whereas mountainous cities—characterized by fragmented terrain, ecological sensitivity, and intense land-use conflicts—have received comparatively limited scholarly attention [27,28]. As a representative mountainous metropolis, the Chongqing Metropolitan Area (CMA) features sharp elevational gradients and pronounced disparities in population distribution. These geographic characteristics coincide with rapid built-up land expansion and substantial shifts in LUCC patterns. Despite these characteristics, few studies have systematically examined LUCC driving mechanisms in mountainous megacities, such as Chongqing, where both natural and socioeconomic gradients are highly pronounced. Under these conditions, traditional grid-based driver analyses often fail to adequately reflect spatial heterogeneity and are susceptible to the modifiable areal unit problem (MAUP), leading to biased or unreliable statistical inference.
To address these limitations and improve the spatial sensitivity and adaptability of LUCC driver detection, this study develops a terrain–population-based adaptive grid partitioning framework for the Chongqing Metropolitan Area. In this framework, grid cells become finer in steep and densely populated areas and coarser in flat and sparsely populated regions, enabling spatial units to better reflect natural and socioeconomic heterogeneity. The framework generates spatially sensitive analysis units that are subsequently integrated with the Geodetector model to examine the dominant drivers of LUCC from 2000 to 2020. This integrated approach enhances both the adaptability and explanatory power of the Geodetector model in complex terrain settings, deepens the understanding of LUCC spatial response mechanisms in mountainous cities, and provides methodological support and theoretical support for refined territorial spatial planning and ecological management.
To clearly highlight the novelty of this work, the main contributions of this study are summarized as follows:
- (1)
- A comprehensive LUCC analysis for the Chongqing Metropolitan Area from 2000 to 2020, identifying long-term land-use transitions and the spatiotemporal characteristics of dominant land-use types in a mountainous megacity.
- (2)
- A terrain–population dual-factor adaptive grid framework is developed and integrated with the Geodetector model, refining grids in steep and densely populated areas while merging grids in flat regions, thereby providing a more spatially sensitive discretization approach for complex mountainous environments.
- (3)
- The temporal evolution of LUCC driving mechanisms is systematically assessed, demonstrating shifts in the relative importance of natural and socioeconomic factors and highlighting the advantages of adaptive grids in improving detection accuracy and computational efficiency.
2. Materials and Methods
2.1. Study Area
Chongqing Municipality, located in southwestern China along the upper reaches of the Yangtze River, is a representative mountainous megacity. The Chongqing Metropolitan Area, situated in the western part of the municipality, encompasses 22 districts and counties with a total land area of 30,200 km2, accounting for about 36% of Chongqing’s total area. The region spans the mountainous and hilly zones of central Sichuan as well as the parallel ridge–valley terrain of eastern Sichuan, characterized by a highly fragmented landscape and pronounced spatial heterogeneity (Figure 1). During the LUCC analysis period, the permanent resident population of the study area was approximately 28.49 million in 2000, 28.85 million in 2010, and 32.09 million in 2020, indicating sustained urban expansion and demographic growth.
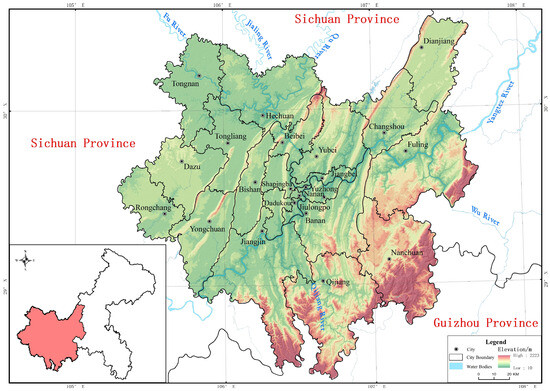
Figure 1.
Topography and administrative division map of the study area.
As the traditional industrial and economic core of Chongqing, the CMA hosts major pillar industries—including automobile manufacturing, electronics, and equipment production—which together contribute nearly two-thirds of the municipality’s gross regional product (GRP). Driven by rapid urbanization, industrial agglomeration, and population growth, land use in the region has undergone significant transformations. These include a continuous decline in cropland and the “mountain-climbing” expansion of built-up land, referring to the upslope expansion of urban development along hilly and mountainous slopes. The evolution of land-use spatial patterns is strongly constrained by topography, reflecting the distinctive LUCC dynamics characteristic of mountainous cities.
2.2. Data Sources and Preprocessing
The land use and land cover (LULC) data employed in this study were obtained from the China Land Cover Dataset [29] (CLCD), which spans the period from 1985 to 2023 and has been released annually since 1990. The dataset has an overall classification accuracy of approximately 79%. The CLCD classifies the Earth’s surface into nine categories: cropland, forest, shrub, grassland, water, snow/ice, barren, impervious, and wetland.
For the driving factor selection, this study follows the general analytical framework for LUCC drivers, integrating both natural geographic and socioeconomic dimensions [30,31]. The socioeconomic factors include population density, gross domestic product (GDP), nighttime lights, and accessibility indicators such as the distance to main roads, secondary roads, and highways. For the LUCC analysis years (2000, 2005, 2010, 2015, and 2020), population, GDP, and nighttime lights datasets were aligned to each corresponding year using official statistics to ensure temporal consistency with the land-cover datasets. The natural factors consist of irrigation conditions (represented by distance to water bodies), climatic variables (mean annual precipitation and temperature), soil type, and topographic attributes (including digital elevation model (DEM), slope, and topographic relief). These variables have been widely recognized in previous studies as key determinants of LUCC, collectively capturing the complex interactions between human activities and the natural environment (Table 1).

Table 1.
Driving factors used in the LUCC analysis.
To ensure the spatial and temporal consistency of multi-source datasets, standardized preprocessing was conducted on all original data.
- (1)
- Projection and spatial alignment: All spatial datasets were first unified to the WGS 1984 coordinate system and then reprojected to the WGS 1984/UTM Zone 48N projected system for accurate area and distance measurements. Resampling and spatial clipping were performed to align datasets with the spatial extent of the CMA.
- (2)
- Land-use classification simplification and adjustment: The forest and shrub categories in the CLCD dataset were merged into “forest land”, while bare land was reclassified as “built-up land”. The “snow/ice” and “wetland” categories—absent within the study area—were excluded. Consequently, five land-use categories were retained: cropland, forest land, grassland, water body, and built-up land.
- (3)
- Derivation of driving factors: Based on DEM data, slope and terrain relief were calculated using ArcGIS Pro 3.0.2. Additionally, Euclidean distance analysis was performed on road and river datasets to derive distance-to-road (for all road levels) and distance-to-river variables.
2.3. Methods
2.3.1. Land Use Transition Matrix
The Land Use Transition Matrix [32] is used to detect changes in land use, measuring land inflows and outflows over a period of time.
In Equation (1): represents the area (km2) converted from land use type i to land use type j, where i and j (i, j = 1, 2, …, n) denote different land use categories, and n is the total number of land use types.
2.3.2. Geodetector Coupled with an Adaptive Grid
The Geodetector, proposed by Wang et al. [14], is a statistical tool designed to analyze and utilize spatial heterogeneity. It consists of four detectors: (1) factor detector, (2) interaction detector, (3) risk detector, and (4) ecological detector. In this study, the factor detector was employed to investigate potential driving factors. The factor detector module evaluates whether the dependent variable Y exhibits spatial stratified heterogeneity and quantifies the explanatory power of an independent variable X through the q-statistic. The q-value ranges from 0 to 1, with larger values indicating stronger explanatory power of X for the spatial distribution of Y. The formula is as follows:
In the formula: h = 1, …, L represents the strata of variable Y or factor X, i.e., the classification or partitioning; and N are the number of units in stratum h and the entire population, respectively; and are the variances of the Y values in stratum h and the entire population, respectively.
Geodetector commonly adopts a grid-based approach when handling irregularly shaped spatial units, such as administrative regions. This approach divides the study area into regular grids of fixed size, with sampling points generated at each grid center to extract attribute information of the dependent variable and associated driving factors, which are subsequently used for statistical analysis. The core rationale is to standardize spatial units, thereby ensuring comparability across space and improving the reliability of statistical inference. However, previous studies have demonstrated that the delineation of spatial units—including grid scale, shape, and aggregation strategy—exerts a significant influence on the resulting q-values of Geodetector, consequently affecting the ranking of explanatory factors and the robustness of research conclusions. Assessment studies conducted in mountainous regions have shown that conventional land-use products exhibit significantly reduced classification accuracy and spatial consistency in areas with complex terrain, with increasing grid resolution leading to greater loss of spatial detail [33]. Meanwhile, the Geodetector model is highly sensitive to the delineation of spatial units, as variations in scale or discretization parameters can lead to significant differences in q-values and the ranking of driving factors. Therefore, when conducting driving factor analyses using grid-based samples, it is essential to perform scale sensitivity analysis and parameter optimization simultaneously to ensure the robustness and reliability of the results. Despite their widespread application for reasons of simplicity and operational feasibility, regular grids are less effective in regions characterized by steep terrain or pronounced spatial heterogeneity. In such contexts, they may distort spatial patterns, weaken internal consistency of variables, and even introduce statistical bias.
Given the substantial limitations of regular grids in capturing spatial heterogeneity within mountainous urban areas, this study develops an adaptive irregular grid partitioning method that integrates natural and socioeconomic factors to enhance the applicability and interpretability of Geodetector in complex terrain regions. First, the slope raster was smoothed and missing values were filled. The study area was divided into initial regular vector grids (e.g., 1 km, 2 km, and 4 km) aligned with the slope raster. Mean slope for each grid was computed, and cells were classified using interquartile thresholds (Q1–Q4) to assign merge or split factors: high-slope cells were subdivided, low-slope cells merged, and moderate-slope cells retained unchanged. Spatial contiguity was maintained by merging only unvisited neighboring cells. The resulting adaptive grid preserves local topographic heterogeneity while generating centroids as Geodetector sampling points. Invalid cells (e.g., NaN slope) were filtered to ensure data quality.
Building on this, the method further incorporates socioeconomic attributes—most notably population density—to account for the critical role of human activities in shaping land use patterns. Among the topographic factors, slope directly reflects the degree of surface undulation and has the strongest influence on landform differentiation and the spatial distribution of land use. Therefore, slope was selected as the representative variable for the topographic dimension. Regarding population-related factors, population density comprehensively reflects the intensity and spatial distribution of human activities, serving as a direct driving force of urban expansion and land use change. Accordingly, population density was identified as the core indicator of the socioeconomic dimension. The resulting terrain–population dual-factor subdivision method improves sensitivity to anthropogenic processes such as urban expansion while preserving consistency with underlying terrain structures. By jointly embedding natural and social dimensions, the proposed framework achieves more adaptive spatial unit construction, thereby offering a robust pathway to improve the detection accuracy and explanatory power of Geodetector in complex, multi-scale landscapes.
2.3.3. Construction of Single-Factor Classifiers Based on Terrain
- Quantile Analysis and Outlier Detection
Previous studies have shown that terrain classification methods based on quantiles and natural breaks can effectively preserve regional heterogeneity while avoiding excessive averaging [34]. To construct spatial units that better capture terrain-induced heterogeneity, this study adopted slope quantiles derived from standard statistical quartiles (0.25, 0.50, and 0.75) as initial reference thresholds [35]. However, the slope distribution of the study area is highly skewed, with a large proportion concentrated in the moderate -high slope range (approximately 10–25°). Directly applying the initial quartiles will weaken the ability to distinguish slope gradients. To address this issue, an automated iterative search was performed by expanding each initial threshold at 0.05 intervals, generating 27 candidate quantile combinations that satisfied the condition Q1 < Q2 < Q3.
Among these candidates, combinations resulting in an irregular grid with fewer than half the number of units of the regular grid were first retained to ensure spatial compactness. The Geodetector q-values of the remaining combinations were then calculated, and the optimal combination was selected by jointly considering explanatory power and stability. The final selected quantiles—0.35, 0.60, and 0.95—achieved a balance between explanatory power and spatial simplicity. Specifically, the 0.35 and 0.60 quantiles enhanced the differentiation between gentle and moderately undulating terrain, whereas the 0.95 quantile captured the steepest marginal areas, enabling targeted refinement of extreme topography. This configuration provided an effective trade-off between interpretability and spatial compactness, ensuring that slope heterogeneity was adequately represented without introducing unnecessary model complexity due to excessive grid subdivision.
In addition, to detect abnormally steep slope units, the interquartile range (IQR = Q3 − Q1) was calculated using the boxplot statistical method. A supplementary threshold, referred to as the abnormally high threshold (Q4), was then defined based on the IQR to enhance the model’s sensitivity to localized complex topographic features.
- Gradient Classification Rules
Based on the derived quantile thresholds and outlier criteria, slope values were grouped into five hierarchical levels, each assigned an operational factor. Negative factors (e.g., –4, –2) indicate merging operations, whereas positive factors (1, 2, 3) indicate subdivision intensity. These operations were executed iteratively in a single refinement loop: merging steps were applied first, followed by subdivision.
Merging was constrained to spatially contiguous units—each cell marked for merging could only be combined with unmerged neighboring cells (queen-contiguity), ensuring topological consistency. Subdivision factors were then applied to the resulting cells, where higher positive values corresponded to deeper refinement within the same iteration. All operations were executed programmatically to maintain reproducibility. The classification criteria and operational rules are summarized in Table 2.
Table 2.
Slope grading table.
2.3.4. Construction of a Dual-Factor Classifier Based on Terrain and Population
To comprehensively capture the joint influence of topography and population on adaptive grid refinement and merging, this study constructs a dual-factor decision matrix (4 × 4) based on slope and population density to guide the grid adjustment operations. The decision framework draws upon existing adaptive grid and raster refinement studies that incorporate both physical and socio-economic indicators for spatial classification—for example, integrating population and urban density to determine grid granularity in urban grid delineation [36], or applying slope and density thresholds for adaptive filtering and grid refinement in point cloud and terrain processing [20].
The implementation process is as follows. First, slope and population density were discretized by quartiles according to their global distribution characteristics, consistent with the single-factor slope classification described earlier. A 4 × 4 decision matrix was then constructed, where each value denotes the operational intensity applied to a grid cell: negative values (e.g., −4, −2) represent merging (with larger absolute values indicating stronger merging), positive values (e.g., 1, 2) denote subdivision (with higher values implying finer subdivision), and zero indicates no change (Table 3).
Table 3.
Classification decision matrix.
To reduce parameter subjectivity, we constructed a candidate parameter set consisting of 12 combinations of merging and subdivision factors. These combinations were derived from a predefined range of operational values, including merging factors (–2, –3, –4), subdivision factors (1, 2), and a retention option (0). Each combination formed a complete decision matrix and was evaluated through a systematic grid search. For each candidate matrix, we assessed (1) whether the resulting number of irregular grid cells was less than half that of the regular grid, (2) the magnitude and stability of the Geodetector q-value, and (3) the computational time. To assess the robustness and statistical significance of the q-values, bootstrap resampling with 1000 samples and permutation tests with 999 permutations were performed at a significance level of p < 0.05. This numerical framework references the merge/subdivide intensity quantification method commonly used in point cloud filtering and error modeling [20], which was optimized in this study through systematic sensitivity testing. In addition, to prevent over-fragmentation, the maximum subdivision depth was constrained to two levels, ensuring grid stability and computational efficiency. This limit was chosen because deeper subdivisions produced only marginal improvements in q-values while significantly increasing computational costs.
3. Results
3.1. Grid Partitioning and Detection Efficiency
The grid partitions across different resolutions and grid types are illustrated in Figure 2. To evaluate differences in data processing efficiency among various grid types, this study quantified the distribution of sampling points for regular and irregular grids at spatial resolutions of 1 km, 2 km, and 4 km (Table 4). The results indicate that, compared with regular grids, the single-factor irregular grid and dual-factor irregular grid reduced the average number of sampling points by approximately 54.13% and 55.53%, respectively. Specifically, at the 1 km scale, the regular grid contained 30,190 sampling points, whereas the dual-factor irregular grid contained only 13,427 points, representing a 55.52% reduction. At the 2 km and 4 km scales, the reductions were 55.96% and 53.66%, respectively.
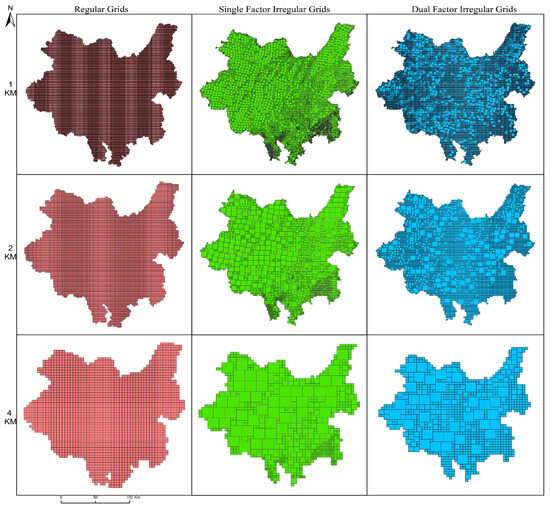
Figure 2.
Grid division diagram. Red indicates regular grids, green indicates terrain single-factor irregular grids, and blue indicates terrain–population dual-factor irregular grids.
Table 4.
Number of sampling points.
Although the Geodetector algorithm is computationally efficient, the reduction in sampling points still leads to a meaningful improvement. At the 1 km resolution, the regular grid configuration required approximately “3 min and 10 s”, whereas the irregular grid required about “1 min and 40 s” under the same computing environment. This corresponds to an improvement of roughly 47–50% in computation time. Although the absolute runtime of both schemes remains relatively short, the reduction becomes increasingly valuable when performing multi-year comparisons, scenario analyses, or repeated significance tests.
3.2. Analysis of Land Use Change and Transfer
During the study period, cropland, forest land, and built-up land were the dominant land use types in the CMA, together accounting for over 90% of the total area (Table 5). Cropland, although exhibiting a long-term declining trend from 69.01% to 66.05%, consistently occupied the largest share. Its fluctuations were concentrated between 2000 and 2010, with a brief increase followed by a sustained decrease. Forest land maintained a generally stable proportion across the study period (26.10–28.13%), with only modest fluctuations. A slight decline occurred between 2000 and 2005, followed by a recovery by 2010 and minor adjustments thereafter. In contrast, built-up land displayed a continuous expansion, rising from 1.14% to 4.22%, underscoring the substantial influence of urbanization on the regional land use structure.
Table 5.
Proportion of different land use types in the CMA from 2000 to 2020 (%).
Table 6 presents the characteristics of land use conversion during the 2000–2020 period. Cropland accounted for the largest proportion of land converted out, totaling 2358.64 km2, mainly transformed into forest land (56%) and construction land (40%). Forest land ranked second in terms of outflow, with 1441.73 km2 converted, predominantly to cropland, indicating a long-term reciprocal conversion mechanism between these two categories. In terms of inflows, cropland and forest land also showed the highest levels, reaching 1465.66 km2 and 1356.07 km2, respectively, reflecting their mutual transformation processes. The total inflow of built-up land was relatively small and primarily derived from cropland, while its outflow was minimal, exhibiting a persistent expansion pattern. Overall, cropland experienced continuous decline during the study period; forest land showed partial recovery, largely influenced by ecological restoration policies; and built-up land expanded steadily, driven by rapid urbanization.
Table 6.
CMA Land Use Conversion Matrix, 2000–2020 (km2).
Overall, land use change in the region was characterized by gradual cropland loss, relative stability of forest land, and steady growth of built-up land—reflecting a typical urban expansion-driven transformation pattern. The comprehensive land use dynamics index (Table 7) exceeded 40% during 2000–2010 and declined to approximately 20% during 2010–2020, indicating that land use changes slowed markedly in the later decade. A more detailed interpretation of these is provided in the Section 4 Discussion.
Table 7.
Dynamic degree of comprehensive land use in CMA, 2000–2020 (% a−1).
3.3. Comparative Analysis of Different Types of Grid Results
At spatial scales of 1 km, 2 km, and 4 km, we compared the average q-values from factor detection for each driver during 2000–2020. This analysis compared the performance of adaptive grids and regular grids in Geodetector-based LUCC detection in mountainous cities.
3.3.1. Single-Factor Adaptive Grid vs. Regular Grid Comparison
From the perspective of factor types, in the detection of socioeconomic factors, the q-values of regular grids at 1 km and 2 km resolutions were generally higher than those of terrain single-factor adaptive grids. Conversely, in the detection of natural factors, the q-values of adaptive grids were generally higher than those of regular grids. At the 4 km resolution, adaptive grids demonstrated significantly higher q-values than regular grids for 10 out of 13 factors, indicating a marked improvement in their effectiveness for natural factor detection. The overall pattern is as follows: for natural factors, the adaptive irregular grid yields superior detection results; for socioeconomic factors, the regular grid continues to perform better. Among natural factors, the q-value for “Annual Mean Temperature (x8)” is relatively low, hence it is not prominently displayed in the charts. Overall, the terrain single-factor adaptive grid demonstrates superior performance in detecting natural factors and fully leverages its advantages at the 4 km resolution (Figure 3).

Figure 3.
Comparison chart of single-factor irregular grid and regular grid results (population density (x1), nighttime lights (x2), GDP (x3), distance to main road (x4), distance to highway (x5), distance to secondary road (x6), distance to river (x7), average annual temperature (x8), average annual precipitation (x9), soil type (x10), elevation (x11), slope (x12), terrain relief (x13)). Subfigures show results at different spatial resolutions: (a) 1 km, (b) 2 km, and (c) 4 km.
3.3.2. Comparison of Dual-Factor Adaptive Grids and Regular Grids
In the comparison between dual-factor adaptive grids and regular grids, the observed characteristics contrast with those of single-factor grids: for detecting socioeconomic factors, the q-values of dual-factor irregular grids are significantly higher than those of regular grids, with this advantage being particularly pronounced at the 4 km resolution. In contrast, the improvement in detecting natural factors using the dual-factor irregular grid is less pronounced than for socioeconomic factors. However, it still demonstrates certain advantages in factors such as “Distance from Rivers (x7)”, “Annual Precipitation (x9)”, and “DEM (x11)”. Furthermore, the overall gap in q-values between the dual-factor irregular grid and the regular grid for natural factors is smaller than for socioeconomic factors. Overall, the dual-factor adaptive grid achieves a certain degree of improvement in detecting both socioeconomic and natural factors, but significant differences in detection effectiveness persist across different types of factors (Figure 4).
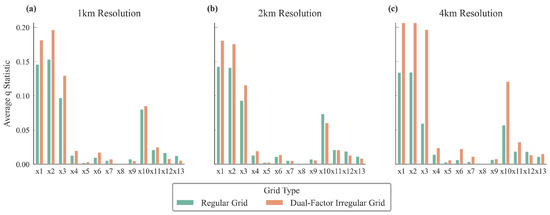
Figure 4.
Comparison chart of dual-factor irregular grid and regular grid results. Subfigures show results at different spatial resolutions: (a) 1 km, (b) 2 km, and (c) 4 km.
3.3.3. Analysis of Q-Value Improvement Across Different Grid Types
This study demonstrates the significant impact of spatial heterogeneity modeling approaches on the explanatory power of driving factors by comparing changes in the q-values of Geodetector between single-factor and dual-factor adaptive grids. Overall, the dual-factor approach demonstrated stronger explanatory power enhancement, with an average absolute change in q-value of +0.0132 (a relative increase of +18.7%), significantly outperforming the single-factor approach’s −0.0046 (a relative decrease of −6.5%). This disparity exhibits clear differentiation across factor types. For socioeconomic factors, the dual-factor adaptive grid achieved the most pronounced explanatory power enhancement, with an average q-value increase of +42.3% (absolute change: +0.0382) across all socioeconomic variables (population density, nighttime lights, GDP), demonstrating significant improvement in 100% of factors. This indicates the dual-factor grid more effectively captures the spatial differentiation patterns of socioeconomic factors. The single-factor adaptive grid showed an average decrease of 29.4% in the q-values for socioeconomic factors (absolute change −0.0265), with 86.7% of factors exhibiting weakened explanatory power. For natural factors, the single-factor grid performed better in detecting natural variables (climate, soil, topography), achieving an average q-value increase of +13.1% (absolute change +0.0087), with 73.3% of factors showing significant improvement. The dual-factor grid showed limited improvement for natural factors (−3.2%), yet 66.7% of factors still gained positive gains. This divergence validates the selective enhancement effect of grid design on factor sensitivity (Table 8).
Table 8.
Improvement in q-values across different mesh types.
These findings offer insights for LUCC driver studies: When focusing on socioeconomic drivers, the dual-factor irregular grid scheme is recommended, as its average 42.3% increase in explanatory power significantly improves model accuracy. Conversely, in ecological process research, the single-factor scheme’s 13.1% gain for natural factors has greater practical relevance. This divergence in scheme selection fundamentally reflects the inherent differences in spatial scale responses between human activities and natural elements.
3.4. Determination of the Optimal Grid Solution
To determine the most suitable adaptive grid scheme for the Chongqing Metropolitan Area, this section presents a comprehensive comparison of Geographical Detector results across different spatial resolutions (1 km and 2 km) and grid types (regular, single-factor irregular, and dual-factor irregular grids), building upon the analyses presented in Section 3.3.1 and Section 3.3.2. Although the 4 km adaptive grid exhibited a noticeable improvement in q-values, several factors did not pass the significance test and were therefore excluded from further consideration.
At finer resolutions, the 2 km regular grid performed best among the regular grid types, showing stronger explanatory power for socioeconomic drivers than the 1 km single-factor irregular grid, but remaining inferior to the 1 km dual-factor irregular grid. Regarding natural factors, its q-values were intermediate between those of the single- and dual-factor irregular grids. The 1 km single-factor irregular grid achieved the highest q-values for natural factors; however, its explanatory capacity for socioeconomic drivers was considerably lower than that of the other two grids, revealing a predominantly “nature-dominated” driving pattern.
In contrast, the 1 km dual-factor irregular grid demonstrated the strongest ability to capture socioeconomic drivers, with q-values significantly higher than those of other grid types. Although its q-values for natural factors were slightly lower than those of the single-factor slope-based grid, the difference was minimal. The overall detection pattern thus exhibited a “socioeconomic driver-dominated” structure, consistent with the general trend observed in regular grids. Considering both the overall magnitude and stability of q-values, the 1 km dual-factor irregular grid was ultimately identified as the optimal spatial partitioning scheme for the analysis of LUCC driving mechanisms in the mountainous metropolitan area of Chongqing (Figure 5).
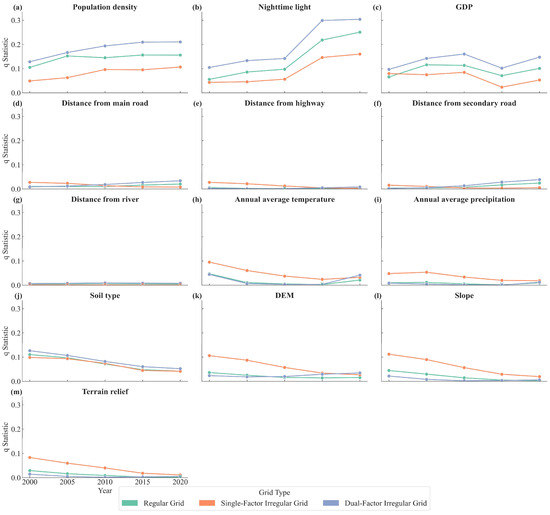
Figure 5.
Comparison of the q-values obtained by different grids schemes for major driving factors from 2000 to 2020. Subfigures (a–m) correspond to population density, nighttime lights, GDP, distance to main roads, distance to highways, distance to secondary roads, distance to rivers, annual average temperature, annual average precipitation, soil type, DEM, slope, and terrain relief, respectively.
3.5. Optimal Grid Coupled with Geodetector Results
3.5.1. Factor Detection Results and Analysis
Geodetector results reveal that the explanatory power of various driving factors for land use change varies temporally (Figure 6). The q-value quantifies a factor’s contribution to spatial land use patterns, with p-values below 0.05 indicating statistical significance at the 95% confidence level.
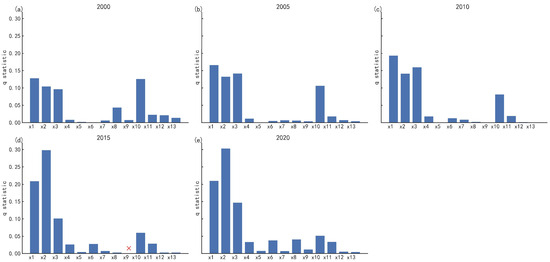
Figure 6.
Changes in the q-values in the CMA from 2000 to 2020. Subfigures (a–e) correspond to the years 2000, 2005, 2010, 2015, and 2020, respectively. The red cross (×) indicates that the corresponding factor failed to pass the significance test (p ≥ 0.05).
In 2000, all factors passed the confidence test, demonstrating statistically significant explanatory capability. Based on q-value results, socioeconomic factors exhibited markedly higher explanatory power than natural factors. The q-values, ranked from highest to lowest, were population density > soil type > nighttime lights > GDP > annual average temperature > DEM > slope > terrain relief > distance to main roads > annual average precipitation > distance to water bodies > distance to highways > distance to secondary roads. Population density (q = 0.129) emerged as the dominant factor, indicating higher land development intensity in densely populated areas, followed closely by soil type (q = 0.127), reflecting the persistent constraints of natural conditions on land use patterns. Overall, transportation variables exerted only a minor influence, suggesting that land use patterns in the CMA in 2000 were primarily shaped by socioeconomic activities.
In 2005 and 2010, the q-value distribution patterns remained broadly consistent with those in 2000. The influence of socioeconomic factors continued to strengthen, while the explanatory power of natural factors declined, highlighting that urbanization increasingly drove land use change. During the expansion of built-up land, the impact of population distribution and economic activity became particularly pronounced.
By 2015, the q-value ranking shifted to nighttime lights > population density > GDP > soil type > DEM > distance to main roads > distance to secondary roads > distance to water bodies > distance to highways > slope > annual average temperature > terrain relief > annual average precipitation. Annual average precipitation failed the confidence test. Notably, the q-value for nighttime lights exceeded that of population density for the first time (q = 0.299), indicating its strong correlation with spatial land use changes. However, nighttime lights serves primarily as a composite proxy for urbanization and human activity intensity, capturing existing urban spatial patterns rather than directly driving land use changes. Its high explanatory power reflects enhanced alignment with land use distribution rather than causality. Additionally, the explanatory power of transportation variables increased compared to earlier years, while slope remained a relatively weak constraint, suggesting limited influence of topography on land use change in recent years.
By 2020, the factor ranking was nighttime lights > population density > GDP > soil type > annual average temperature > distance to main roads > DEM > distance to secondary roads > annual average precipitation > distance to highways > distance to water bodies > slope > terrain relief. The q-value of nighttime lights further increased to 0.304, highlighting enhanced spatial concentration of human activities, including urban expansion, development density, and industrial agglomeration. Population density retained a significant influence (q = 0.210), reflecting its persistent role in shaping urban land use patterns.
Overall, the explanatory power of socioeconomic factors for land use change shows a trend shifting from “population–economy” to “intensity of human activity”. Topographic constraints remain stable, while terrain relief exerts a negligible influence. The explanatory power of other natural factors in 2020 was weaker than in 2000, indicating that as a region develops, its higher economic level and population concentration lead to reduced constraints from natural factors and greater influence from socioeconomic factors.
3.5.2. Interaction Detection Results and Analysis
To further explore the interactions among different drivers of LUCC, this study employs the interaction detector of the Geodetector to analyze whether “nonlinear enhancement”, “dual-factor independence”, or “mutual attenuation” effects exist between factors. The q-values derived from interaction detection indicate the combined explanatory power of factor pairs on the spatial distribution of land use. When these q-values exceed those of individual factors, it reflects a synergistic effect between the factors.
In this study, most factor pairs exhibited bi-factor (nonlinear) enhancement, indicating that natural and socioeconomic variables jointly amplify their explanatory power when considered together. This suggests that LUCC in mountainous cities is shaped by coupled natural–human interactions rather than by single independent factors (Figure 7).
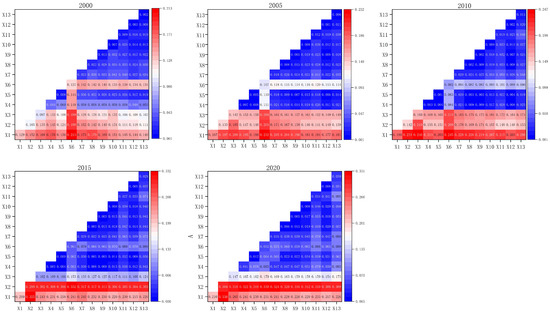
Figure 7.
Interaction heat map of factors in the CMA, 2000–2020.
In 2000, 2005, and 2010, the strongest interaction occurred between soil type and social factors, with q-values consistently around 0.21—significantly higher than either factor alone. This reveals a pronounced coupling between human activities and the natural land base. Additionally, population density exhibited relatively strong interactions with other factors, indicating that population concentration and early economic development synergistically promoted land use change during the initial stages of urbanization. Among natural factors, slope, DEM, and terrain relief exhibited moderate interactive enhancement, though overall q-values remained low, suggesting that natural factors primarily act as foundational constraints and regulatory mechanisms rather than dominant drivers of land use change.
By 2015 and 2020, interactions involving nighttime lights and other factors strengthened significantly, with q-values generally exceeding 0.3. This indicates that during accelerated urbanization, urban lighting intensity—as a spatial proxy for human activity—exhibits a high degree of spatial synergy with population distribution and economic activity density, substantially enhancing the explanatory power of spatial heterogeneity in land use. Interaction effects among other factor types were weaker. Notably, interactions between population density and other factors exceeded 0.2, while interactions involving regional GDP and other factors exceeded 0.1, illustrating that socioeconomic factors increasingly interacted with multiple drivers to jointly influence land use change.
Overall, the explanatory power of factor interactions for land use change exhibited temporal variation, yet the combined effects of population density, GDP, and soil type consistently drove dynamic transformations in land use types. Around 2000, the combined influence of population density and natural factors remained prominent. By 2020, the nonlinear enhancement between nighttime lights, GDP, and population density emerged as the dominant mechanism, highlighting the central role of urban expansion and spatial development intensity in shaping land use patterns. In contrast, natural factors increasingly functioned as foundational regulators and spatial constraints within these interactions, with their relative dominance gradually decreasing. Future land use simulations and management strategies should explicitly consider these multifactorial interactions to improve the explanatory power and predictive accuracy of spatial dynamics.
4. Discussion
4.1. Land Use Dynamic Degree and Driving Mechanisms
The comprehensive land use dynamic degree from 2000 to 2010 was significantly higher than that in 2010–2020, mainly due to the interaction between urban construction demand and ecological restoration policies [37]. Before 2010, rapid urbanization drove large-scale expansion of built-up land, and major ecological restoration programs—such as the Grain-to-Green Program initiated in 2003—further accelerated land conversions among cropland, forest land, and built-up land. These factors collectively amplified LUCC intensity during this period. In contrast, after 2010, the regional urban system gradually stabilized, and ecological programs entered a consolidation stage, resulting in a notable decline in overall LUCC intensity. This shift from a “rapid adjustment period” to a “stable evolution period” reflects the combined impacts of land scarcity, ecological policy implementation, and adjustments to urban development boundaries in the long-term urbanization process in mountainous cities.
Regarding driving factors, population density and nighttime lights maintained consistently high explanatory power, indicating that human activity intensity remains the dominant force shaping regional land transformations. However, the relatively high explanatory power of soil type in this study suggests that natural constraints continue to exert substantial influence in mountainous cities with pronounced topographic gradients. This pattern differs from findings in many plain regions, where the role of natural factors often weakens as human activities intensify [38]. The persistence of natural constraints in Chongqing highlights the unique geomorphological sensitivity of mountainous cities, where slope stability, soil suitability, and terrain accessibility fundamentally shape land development trajectories. These results also demonstrate that LUCC driver analysis in mountainous regions must account for stronger natural–social coupling, and they further illustrate why adaptive grid approaches—which preserve terrain heterogeneity—are particularly necessary for accurately detecting driving mechanisms in such environments.
4.2. Methodological Innovation and Comparison with Existing Studies
Compared with previous studies, the methodology adopted in this research demonstrates clear advantages in spatial unit construction. Existing LUCC driving-force analyses in the Yangtze River Basin and the Weihe River Basin [16,17,18] mostly rely on administrative units, regular grids, or ecological functional zones, which may underrepresent the internal heterogeneity of population distribution and terrain in complex geomorphic areas such as mountainous and hilly regions. The adaptive grid developed in this study—constructed using slope and population density as dual controlling factors—maintains overall unit scale while significantly enhancing the representation of spatial heterogeneity and improving model efficiency. The dual-factor irregular grid outperforms traditional single-scale regular grids and provides a more suitable spatial framework for LUCC driving-force analysis in mountainous urban regions. Therefore, this method offers a more adaptive and sensitive spatial unit design for capturing LUCC mechanisms in areas characterized by strong topographic fragmentation.
4.3. Heterogeneous Performance of Single-Factor and Dual-Factor Adaptive Grids
The adaptive grid system developed in this study exhibits distinct performance differences across various types of driving factors. The terrain single-factor grid achieved higher q-values for natural variables such as soil type and topographic gradients, indicating its stronger capability to capture spatial heterogeneity arising from environmental conditions. In contrast, the dual-factor irregular grid showed superior explanatory power for socioeconomic indicators such as nighttime lights and population density, suggesting that it is more suitable for representing urbanization gradients and the spatial distribution of human activity intensity. These differences reveal a theoretical relationship between “grid characteristics and factor type compatibility” and further demonstrate the inherent natural–social coupling structure of LUCC driving mechanisms.
4.4. Research Limitations and Future Directions
- Data Quality Constraints
Although the CLCD dataset provides a long-term, consistent time series, its overall accuracy (79%) imposes limitations. Misclassification—particularly the extremely small patches labeled as bare land (<1 km2)—may introduce uncertainty when these pixels are reclassified into the construction land category. Higher-resolution or multi-source remote-sensing products could improve the reliability of future LUCC analyses.
- Non-causal nature of Geodetector
Geodetector quantifies the spatial colocation between factors and LUCC patterns but does not establish causal relationships. Future studies could integrate causal inference frameworks or combine Geodetector with machine learning interpretation tools to strengthen causal understanding.
- Subjectivity in threshold and parameter selection
Despite the use of a candidate parameter set and systematic search, some thresholds and grid parameters still rely partly on experience-based or heuristic choices. The development of automated parameter-optimization frameworks—such as Bayesian optimization or evolutionary algorithms—may further reduce subjectivity.
- Lack of policy variables
Policy interventions play an important role in shaping LUCC in mountainous cities, yet quantifying policy intensity or timing remains challenging. Future research may incorporate policy timelines—such as pre- and post-2010 transitions or the implementation of the Chengdu—Chongqing Twin-City Economic Circle Plan—to more rigorously assess the influence of planning and regulatory policies on LUCC trajectories [39].
- Planning and Policy Implications
Beyond methodological contributions, the adaptive grid provides practical value for spatial planning in mountainous cities. By refining cells in steep and densely populated areas, the grid enables more precise identification of slope-sensitive zones, which can support construction land zoning and slope control policies. Meanwhile, the spatial delineation of high-human-activity areas can aid in optimizing urban growth boundaries, and the improved representation of terrain and soil heterogeneity helps identify priority areas for ecological restoration or farmland protection. These capabilities highlight the method’s potential to inform evidence-based spatial governance in complex topographic environments.
5. Conclusions
This study reveals the significant evolutionary characteristics of land use patterns in the Chongqing Metropolitan Area from 2000 to 2020. Against the backdrop of rapid urbanization, cropland initially increased and subsequently declined, with 40% of the cropland converted during this period being transformed into built-up land. This underscores the ongoing displacement of agricultural land by urban expansion, a trend particularly pronounced in mountainous cities with complex topography [40,41]. Although forest land exhibited small fluctuations—characterized by an early decrease and a subsequent recovery—the overall net change remained minimal, indicating a largely stable trajectory over the past two decades. The dual-factor adaptive grid proposed in this study significantly enhances the applicability of the Geodetector model, improving both computational efficiency and interpretability. This aligns with recent research emphasizing the scale sensitivity of heterogeneous spatial modeling [42]. Factor detection results indicate that land use changes in the CMA are primarily correlated with factors such as population density, nighttime lights [43], and natural soil types. The main conclusions are summarized as follows:
- Land Use Dynamics
From 2000 to 2020, cropland, forest land, and built-up land were the dominant land use types in the CMA. Cropland and forest land experienced overall declines, while built-up land expanded steadily. The most pronounced changes occurred in the first decade, followed by a slower rate of change in the second decade, reflecting an early phase of rapid urbanization followed by system stabilization.
- Adaptive Grid Methodology
Coupling adaptive irregular grids with the Geodetector model enhances both its applicability and stability. Compared to regular grids, the dual-factor irregular grid at 1 km resolution reduces the number of sampling units by approximately 55.52% while ensuring spatial heterogeneity representation. The average relative improvement in q-values is +18.7%, indicating that this method is more suitable for mountainous urban areas with complex topography.
- Driving Forces Analysis
Analysis of driving forces indicates that land use change is primarily influenced by population density, nighttime lights, and soil type. Population density remains an important and persistent driver throughout the study period, whereas nighttime lights intensity becomes the dominant factor in 2015 and 2020, reflecting intensified urban development and human activity in recent years.
Overall, this study provides both empirical insights and methodological advances. Empirically, it clarifies the long-term evolution of land use trajectories. Empirically, it clarifies the long-term land use trajectories and their dominant driving forces in a mountainous megacity, revealing how human activity intensity and natural constraints jointly shape spatial patterns. Methodologically, the dual-factor adaptive grid offers the practical enhancement of Geodetector-based analysis by reducing scale-induced biases and improving q-value stability, particularly in complex topographic regions. Beyond academic implications, the results provide valuable support for territorial spatial planning in the Chongqing Metropolitan Area, including optimizing urban–rural zoning, guiding slope-adaptive urban development, and identifying priority areas for ecological restoration. These contributions highlight the broader applicability of the adaptive grid framework to LUCC research and provide a foundation for future multi-scale, policy-oriented land use simulations.
Author Contributions
All authors contributed significantly to this manuscript. Y.H. and Y.T. was responsible for the original idea and the theoretical aspects of the paper. C.Y., W.W. were responsible for the data collection and preprocessing, and L.Z. drafted the manuscript; all authors read and revised the final manuscript. All authors have read and agreed to the published version of the manuscript.
Funding
This research was funded by The National Social Science Fund of China, grant number 25BJY200.
Institutional Review Board Statement
Not applicable.
Informed Consent Statement
Not applicable.
Data Availability Statement
All data used in this study are publicly available from the Resource and Environment Science and Data Center (https://www.resdc.cn/), the National Earth System Science Data Center (https://www.geodata.cn/), the Geospatial Data Cloud Platform (http://www.gscloud.cn/), and OpenStreetMap (https://www.openstreetmap.org/).
Acknowledgments
The authors would like to thank the Resource and Environment Science and Data Center, the National Earth System Science Data Center, and the Geospatial Data Cloud Platform for providing open-access datasets used in this study. The authors also express their sincere gratitude to the anonymous reviewers and editors for their valuable comments and suggestions that greatly improved the quality of this manuscript.
Conflicts of Interest
The authors declare no conflicts of interest.
References
- Li, Y.; Liu, W.; Feng, Q.; Zhu, M.; Yang, L.; Zhang, J.; Yin, X. The Role of Land Use Change in Affecting Ecosystem Services and the Ecological Security Pattern of the Hexi Regions, Northwest China. Sci. Total Environ. 2023, 855, 158940. [Google Scholar] [CrossRef]
- Fu, B.J.; Zhang, L.W. Land use change and ecosystem services: Concepts, methods, and progress. Prog. Geogr. 2014, 33, 441–446. [Google Scholar]
- Xu, W.B.; Xu, H.Z.; Li, X.Y.; Qiu, H.; Wang, Z.Y. Ecosystem Services Response to Future Land Use/Cover Change (LUCC) under Multiple Scenarios: A Case Study of the Beijing-Tianjin-Hebei (BTH) Region, China. Technol. Forecast. Soc. Change 2024, 205, 123525. [Google Scholar] [CrossRef]
- Thekkeyil, A.; George, A.; Abdurazak, F.; Kuriakose, G.; Nameer, P.O.; Abhilash, P.C.; Joseph, S. Land Use Change in Rapidly Developing Economies-a Case Study on Land Use Intensification and Land Fallowing in Kochi, Kerala, India. Environ. Monit. Assess. 2023, 195, 1089. [Google Scholar] [CrossRef] [PubMed]
- Doelman, J.C.; Stehfest, E.; Tabeau, A.; van Meijl, H.; Lassaletta, L.; Gernaat, D.E.H.J.; Hermans, K.; Harmsen, M.; Daioglou, V.; Biemans, H.; et al. Exploring SSP Land-Use Dynamics Using the IMAGE Model: Regional and Gridded Scenarios of Land-Use Change and Land-Based Climate Change Mitigation. Glob. Environ. Change 2018, 48, 119–135. [Google Scholar] [CrossRef]
- Ahmad, H.; Abdallah, M.; Jose, F.; Elzain, H.E.; Bhuyan, M.S.; Shoemaker, D.J.; Selvam, S. Evaluation and Mapping of Predicted Future Land Use Changes Using Hybrid Models in a Coastal Area. Ecol. Inform. 2023, 78, 102324. [Google Scholar] [CrossRef]
- Li, J.S.; Wang, X.R.; Li, X.J. Spatial distribution characteristics and influencing factors of traditional villages in China. Econ. Geogr. 2020, 40, 143–153. [Google Scholar] [CrossRef]
- Getu, K.; Gangadhara Bhat, H. Application of Geospatial Techniques and Binary Logistic Regression Model for Analyzing Driving Factors of Urban Growth in Bahir Dar City, Ethiopia. Heliyon 2024, 10, e25137. [Google Scholar] [CrossRef]
- Fu, J.Y.; Zang, C.F.; Wu, M.W. Spatiotemporal characteristics and driving mechanisms of land use in the Haihe River Basin, 1990–2015. China Agric. Resour. Reg. Plan. 2020, 41, 131–139. [Google Scholar]
- Ning, C.; Subedi, R.; Hao, L. Land Use/Cover Change, Fragmentation, and Driving Factors in Nepal in the Last 25 Years. Sustainability 2023, 15, 6957. [Google Scholar] [CrossRef]
- Gao, C.; Dang, Q.; Li, C.; Fan, Y. Analysis of Landscape Fragmentation Evolution Characteristics and Driving Factors in the Wei River Basin, China. Land 2025, 14, 538. [Google Scholar] [CrossRef]
- Gao, C.; Feng, Y.; Tong, X.; Lei, Z.; Chen, S.; Zhai, S. Modeling Urban Growth Using Spatially Heterogeneous Cellular Automata Models: Comparison of Spatial Lag, Spatial Error and GWR. Comput. Environ. Urban Syst. 2020, 81, 101459. [Google Scholar] [CrossRef]
- Wang, H.J.; Zhang, B.; Liu, Y.L.; Liu, Y.F.; Xu, S.; Deng, Y.; Zhao, Y.T.; Chen, Y.C.; Hong, S. Multidimensional analysis of urban expansion patterns and driving forces in the Beijing-Tianjin-Hebei urban agglomeration based on gravity center-GTWR model. Acta Geogr. Sin. 2018, 73, 1076–1092. [Google Scholar]
- Wang, J.F.; Xu, C.D. Geodetector: Principles and prospects. Acta Geogr. Sin. 2017, 72, 116–134. [Google Scholar]
- Guo, B.; Wei, C.; Yu, Y.; Liu, Y.; Li, J.; Meng, C.; Cai, Y. The Dominant Influencing Factors of Desertification Changes in the Source Region of Yellow River: Climate Change or Human Activity? Sci. Total Environ. 2022, 813, 152512. [Google Scholar] [CrossRef] [PubMed]
- Chen, W.X.; Yang, L.Y.; Wu, J.H.; Wu, J.H.; Wang, G.Z.; Bian, J.J.; Zeng, J.; Liu, Z.L. Spatio-Temporal Characteristics and Influencing Factors of Traditional Villages in the Yangtze River Basin: A Geodetector Model. Herit. Sci. 2023, 11, 111. [Google Scholar] [CrossRef]
- Wu, J.; Luo, J.; Zhang, H.; Yu, M. Driving Forces behind the Spatiotemporal Heterogeneity of Land-Use and Land-Cover Change: A Case Study of the Weihe River Basin, China. J. Arid Land 2023, 15, 253–273. [Google Scholar] [CrossRef]
- Zhou, Y.; Li, X.; Liu, Y. Land Use Change and Driving Factors in Rural China during the Period 1995–2015. Land Use Policy 2020, 99, 105048. [Google Scholar] [CrossRef]
- Song, Y.; Wang, J.; Ge, Y.; Xu, C. An Optimal Parameters-Based Geographical Detector Model Enhances Geographic Characteristics of Explanatory Variables for Spatial Heterogeneity Analysis: Cases with Different Types of Spatial Data. GISci. Remote Sens. 2020, 57, 593–610. [Google Scholar] [CrossRef]
- Zheng, J.; Xiang, M.; Zhang, T.; Zhou, J. An Improved Adaptive Grid-Based Progressive Triangulated Irregular Network Densification Algorithm for Filtering Airborne LiDAR Data. Remote Sens. 2024, 16, 3846. [Google Scholar] [CrossRef]
- Zou, X.; Wang, Y.; Wu, Z.; Tang, W.; Zhou, C.; Li, Z.; Deng, C.; Li, Y.; Zhang, Y. Optimized Multi-Point Hemispherical Grid Model with Adaptive Grid Division Based on the Prior Information of Multipath Error. Adv. Space Res. 2024, 74, 5591–5603. [Google Scholar] [CrossRef]
- Gu, Y.; Zhou, D.; An, Y.; Wang, R.; Wu, K.; Diao, X. Ground Point Extraction Using Self-Adaptive-Grid and Point to Surface Comparison. Measurement 2022, 204, 112057. [Google Scholar] [CrossRef]
- Wu, L.N.; Yang, S.T.; Liu, X.Y.; Luo, Y.; Zhou, X.; Zhao, H.G. Response of land use changes to human activity intensity in the Beiluo River Basin since 1976. Acta Geogr. Sin. 2014, 69, 54–63. [Google Scholar]
- Fan, W.; Yang, X.; Cai, S.; Ou, H.; Zhou, T.; Wang, D. Land-Use/Cover Change and Driving Forces in the Pan-Pearl River Basin during the Period 1985–2020. Land 2024, 13, 822. [Google Scholar] [CrossRef]
- Geng, X.; Hu, S.; Wang, X.; Cai, D.; Gong, Y. Adaptive Change of Land Use to Nature and Society in China? Agro-Pastoral Ecotone. Land Use Policy 2023, 126, 106554. [Google Scholar] [CrossRef]
- Li, W.X.; Yan, Z.G. Spatiotemporal evolution and driving mechanisms of land use in the Gansu agro-pastoral ecotone based on the Geodetector method. Arid Zone Res. 2024, 41, 590–602. [Google Scholar] [CrossRef]
- Liu, J.L.; Zhu, X.G.; Wu, Y. Evolution and early warning study of spatial conflicts of land use in urban agglomerations under regional development: A case study of the Chengdu-Chongqing urban agglomeration. Res. Soil Water Conserv. 2025, 32, 353–364. [Google Scholar] [CrossRef]
- Wang, C.Y.; Zhang, J.Y.; Li, H.Y.; Su, W.C. Multi-scale spatiotemporal evolution and multi-scenario simulation of land use conflicts in Chongqing. Acta Ecol. Sin. 2024, 44, 1024–1039. [Google Scholar] [CrossRef]
- Yang, J.; Huang, X. The 30 m Annual Land Cover Dataset and Its Dynamics in China from 1990 to 2019. Earth Syst. Sci. Data 2021, 13, 3907–3925. [Google Scholar] [CrossRef]
- Liu, J.; Kuang, W.; Zhang, Z.; Xu, X.; Qin, Y.; Ning, J.; Zhou, W.; Zhang, S.; Li, R.; Yan, C.; et al. Spatiotemporal Characteristics, Patterns, and Causes of Land-Use Changes in China since the Late 1980s. J. Geogr. Sci. 2014, 24, 195–210. [Google Scholar] [CrossRef]
- Li, X.B. Core areas of global environmental change research—International trends in land use/cover change. Acta Geogr. Sin. 1996, 51, 553–558. [Google Scholar]
- Zhu, H.Y.; Li, X.B. Discussion on the index method of regional land use change. Acta Geogr. Sin. 2003, 58, 643–650. [Google Scholar]
- Xu, H.; Song, Y.; Tian, Y. Simulation of Land-Use Pattern Evolution in Hilly Mountainous Areas of North China: A Case Study in Jincheng. Land Use Policy 2022, 112, 105826. [Google Scholar] [CrossRef]
- Zhang, D.H.; Wang, X.K.; Zhang, L.; Huang, B.B. Research on the classification methods of ecosystem service of soil retention for large-scale choropleth mapping. Acta Ecol. Sin. 2021, 41, 1391–1401. [Google Scholar] [CrossRef]
- Zhang, Y.H. Calculation of Quartiles in Statistics. China High-Tech Enterp. 2009, 20, 173–174. [Google Scholar] [CrossRef]
- Wang, X.; Chen, B.; Li, X.; Zhang, Y.; Ling, X.; Wang, J.; Li, W.; Wen, W.; Gong, P. Grid-Based Essential Urban Land Use Classification: A Data and Model Driven Mapping Framework in Xiamen City. Remote Sens. 2022, 14, 6143. [Google Scholar] [CrossRef]
- Tong, X.R.; Yang, Q.Y.; Bi, G.H. Spatio—Temporal Characteristics of Land Use Changes in Chongqing during 2000–2015. Resour. Environ. Yangtze Basin 2018, 27, 2481–2495. [Google Scholar]
- Kang, P.S.; Wu, B.; Gao, F.; Du, M.L.; Wang, C.; Cao, W. Analysis of spatial temporal changes and driving factors of land use in Changji Prefecture Plain. Yangtze River 2024, 55, 59–68. [Google Scholar] [CrossRef]
- Wei, Y.; Li, Y.; Wang, S.; Wang, J.; Zhu, Y. Research on the Spatial Expansion Characteristics and Industrial and Policy Driving Forces of Chengdu-Chongqing Urban Agglomeration Based on NPP-VIIRS Night Light Remote Sensing Data. Sustainability 2023, 15, 2188. [Google Scholar] [CrossRef]
- Che, L.; Guo, S.; Li, Y. Discerning Changes and Drivers of Water Yield Ecosystem Service: A Case Study of Chongqing-Chengdu District, Southwest China. Ecol. Indic. 2024, 160, 111767. [Google Scholar] [CrossRef]
- Ding, Z.; Zheng, H.; Li, H.; Yu, P.; Man, W.; Liu, M.; Tang, X.; Liu, Y. Afforestation-Driven Increases in Terrestrial Gross Primary Productivity Are Partly Offset by Urban Expansion in Southwest China. Ecol. Indic. 2021, 127, 107641. [Google Scholar] [CrossRef]
- Hu, Y.; Xu, E.; Dong, N.; Tian, G.; Kim, G.; Song, P.; Ge, S.; Liu, S. Driving Mechanism of Habitat Quality at Different Grid-Scales in a Metropolitan City. Forests 2022, 13, 248. [Google Scholar] [CrossRef]
- Tong, S.; Bao, G.; Rong, A.; Huang, X.; Bao, Y.; Bao, Y. Comparison of the Spatiotemporal Dynamics of Land Use Changes in Four Municipalities of China Based on Intensity Analysis. Sustainability 2020, 12, 3687. [Google Scholar] [CrossRef]
Disclaimer/Publisher’s Note: The statements, opinions and data contained in all publications are solely those of the individual author(s) and contributor(s) and not of MDPI and/or the editor(s). MDPI and/or the editor(s) disclaim responsibility for any injury to people or property resulting from any ideas, methods, instructions or products referred to in the content. |
© 2025 by the authors. Licensee MDPI, Basel, Switzerland. This article is an open access article distributed under the terms and conditions of the Creative Commons Attribution (CC BY) license.