Article

Deformation of the Taleqan Dam, Iran, from InSAR and Ground Observation

1
Department of Physical Geography, Faculty of Geography, University of Tehran, Tehran P.O. Box 6619-14155, Iran
2
Department of Geosciences and Geography, Institute of Seismology, University of Helsinki, P.O. Box 68, FI-00014 Helsinki, Finland
3
COMET, School of Earth and Environment, University of Leeds, Leeds LS2 9JT, UK
*
Authors to whom correspondence should be addressed.
Sustainability 2026, 18(1), 173; https://doi.org/10.3390/su18010173
Submission received: 12 November 2025 / Revised: 26 November 2025 / Accepted: 28 November 2025 / Published: 23 December 2025
(This article belongs to the Section Hazards and Sustainability)

Abstract

Reliable assessments of dam stability require the continuous acquisition and interpretation of deformation data, as monitoring technologies provide essential information for evaluating structural behavior. Surface displacement measurements are particularly valuable for identifying instability within the dam embankment and adjacent slopes. While terrestrial surveying networks can provide accurate point-based observations, they are often time-consuming and costly to maintain. Satellite radar interferometry (InSAR) offers a complementary, cost-effective means of monitoring surface displacement with wide spatial coverage; however, careful analysis is required to avoid misinterpreting superficial motions of riprap and cover materials as true dam settlement. In this study, we use multi-platform SAR datasets, including Sentinel-1A (2014–2019) and high-resolution TerraSAR-X (2018), to investigate the deformation behavior of the Taleqan Dam. We compare LOS displacement derived from InSAR with independent measurements from a terrestrial surveying network spanning the same period. TerraSAR-X data indicate up to ~20 mm of LOS displacement over three months (May–August 2018), and the displacement pattern is consistent with the Sentinel-1 time series. Despite lower spatial resolutions, Sentinel-1 provided dense, temporally continuous coverage, with LOS velocities reaching ~4 mm/yr on the downstream slope. The combined datasets demonstrate that the observed deformation predominantly reflects the ongoing lateral movement of downstream riprap materials rather than the vertical settlement of the dam’s core. These results highlight both the utility of InSAR for long-term dam monitoring and the importance of integrating multi-sensor observations to ensure accurate interpretations of dam deformation signals.

1. Introduction

Embankment dams are known as one of the most crucial engineering structures constructed in river basins for the purposes of water control and management for potable water supply and agriculture, as well as for reducing the adverse consequences of flooding [1,2]. The deterioration of dams can result in failure, posing great risks for downriver areas [3,4].The assessment of the deformation of large dams is thus important to prevent destructive loss of life and infrastructure. Although measuring and monitoring the deformation of such man-made structures are necessary tasks, typically obliged by law owing to the hazard that a dam failure represents, they are usually time-consuming and very expensive [5,6,7,8]. In spite of monitoring efforts, various studies imply that, every decade, around 10 major dam failures happen worldwide [9]. Therefore, even if dam displacements are below the allowed criteria, they must be continually monitored to ensure their long-term stability [10,11].
The stability of dam structures is typically analyzed through periodic surveys using ground- and satellite-based geodetic techniques [1,10,12]. Typical surveying methods employ a geodetic deformation network comprising a few external reference locations relative to the dam body and a number of object deformation points on the dam body [4]. Since the beginning of the 1990s, the interferometric synthetic aperture radar (InSAR) technique has been utilized to support the analysis of several natural phenomena that displace Earth’s surface, such as earthquakes, volcanic activity, and landslides [5,13,14,15]. InSAR has various advantages, including the ability to carry out measurements across large areas in any weather condition with high precision and spatial resolution [16].
The increasing number of space missions, together with the rapid development of SAR sensors and algorithms for data processing, such as persistent scatterers [17,18], small baseline subsets (SBASs) [19], and algorithms exploiting persistent and distributed scatterers [17,20], have led to improvements in measurement accuracy and spatial resolution. Modern InSAR products can provide relative displacement measurements with millimeter accuracy [21]. InSAR has proved to be a reliable method for the purpose of monitoring displacement episodes and characterizing the behavior of large artificial structures, including buildings, dams, and transport infrastructure [22]. Currently, InSAR is often applied in the analysis of deformation in dams [23,24,25,26,27]. The performance of dams over a long period is evaluated using numerical and mechanical models, wherein the results at the surveying points are interpolated to characterize nodal values for a specific element [3]. Honda et al. [28] used DInSAR to monitor the stability and external deformation of an earth-fill dam in Okinawa Prefecture, Japan (ALOS PALSAR, Japan Aerospace Exploration Agency, Tokyo, Japan), which revealed 80% accuracy when the DInSAR results were compared to GPS measurements. Also, Marchamalo et al. [5] used InSAR and GPS techniques for risk assessment in Sanalona Dam, and their results showed that the InSAR technique can be precise for monitoring dam movement. In another study, Di Martire et al. [25] utilized 51 Envisat-ASAR images of the Conza Dam in the southern Apennines, Italy, to perform a comparison analysis between DInSAR and ground data, and their findings showed that the technique is trustworthy for the precise monitoring of civil infrastructure, particularly dams with a high exposure factor and related risk. Moreover, Ruiz et al. [11] used the MTInSAR approach (ERS-1/2, ENVISAT, and Sentinel-1A/B, European Space Agency, Paris, France) to monitor the La Viñuela Dam (Malaga, Spain), and the maximum deformation rates were observed to be about −7 mm/y (LOS direction) on the dam’s crest. The findings showed that the La Viñuela Dam has deformed since its construction as an earth-fill dam, and Sentinel-1A/B monitoring revealed that the deformation is still active in the central upper portion of the dam in 2014–2018, with a maximum velocity of −6 mm/y. Therefore, MT-InSAR approaches might support new and more effective methods of monitoring and analyzing dam safety alongside existing dam surveillance systems.
According to field observations in 2017, we discovered that the downstream part of the Taleqan Dam had deformed, despite terrestrial surveying network results showing the relative stability of the embankment mass during March 2012 and December 2013 [29]. Considering the importance of the stability of the dam’s body, it is crucial to monitor this in the long term. Based on the gaps between measurement dates, we used Sentinel-1 and TerraSAR-X images and terrestrial surveying networks. TerraSAR-X images, which provide high-accuracy results, were utilized to validate Sentinel-1. This study addresses this gap by combining multi-sensor SAR datasets with terrestrial survey results to detect the subtle, spatially variable deformation of the Taleqan Dam, evaluate the consistency and accuracy of different SAR products, and demonstrate how an integrated monitoring strategy can provide earlier and more reliable detection of dam body movements compared to conventional approaches used in previous studies.
Our study starts with a description of the geological setting of the dam in Section 2. In Section 3, we describe InSAR time-series processing and the InSAR results and compare them with each other. In Section 4, we present the results obtained from the geodetic and InSAR techniques. Section 5 addresses the discussion. Our conclusions are presented in Section 6.

2. Study Area

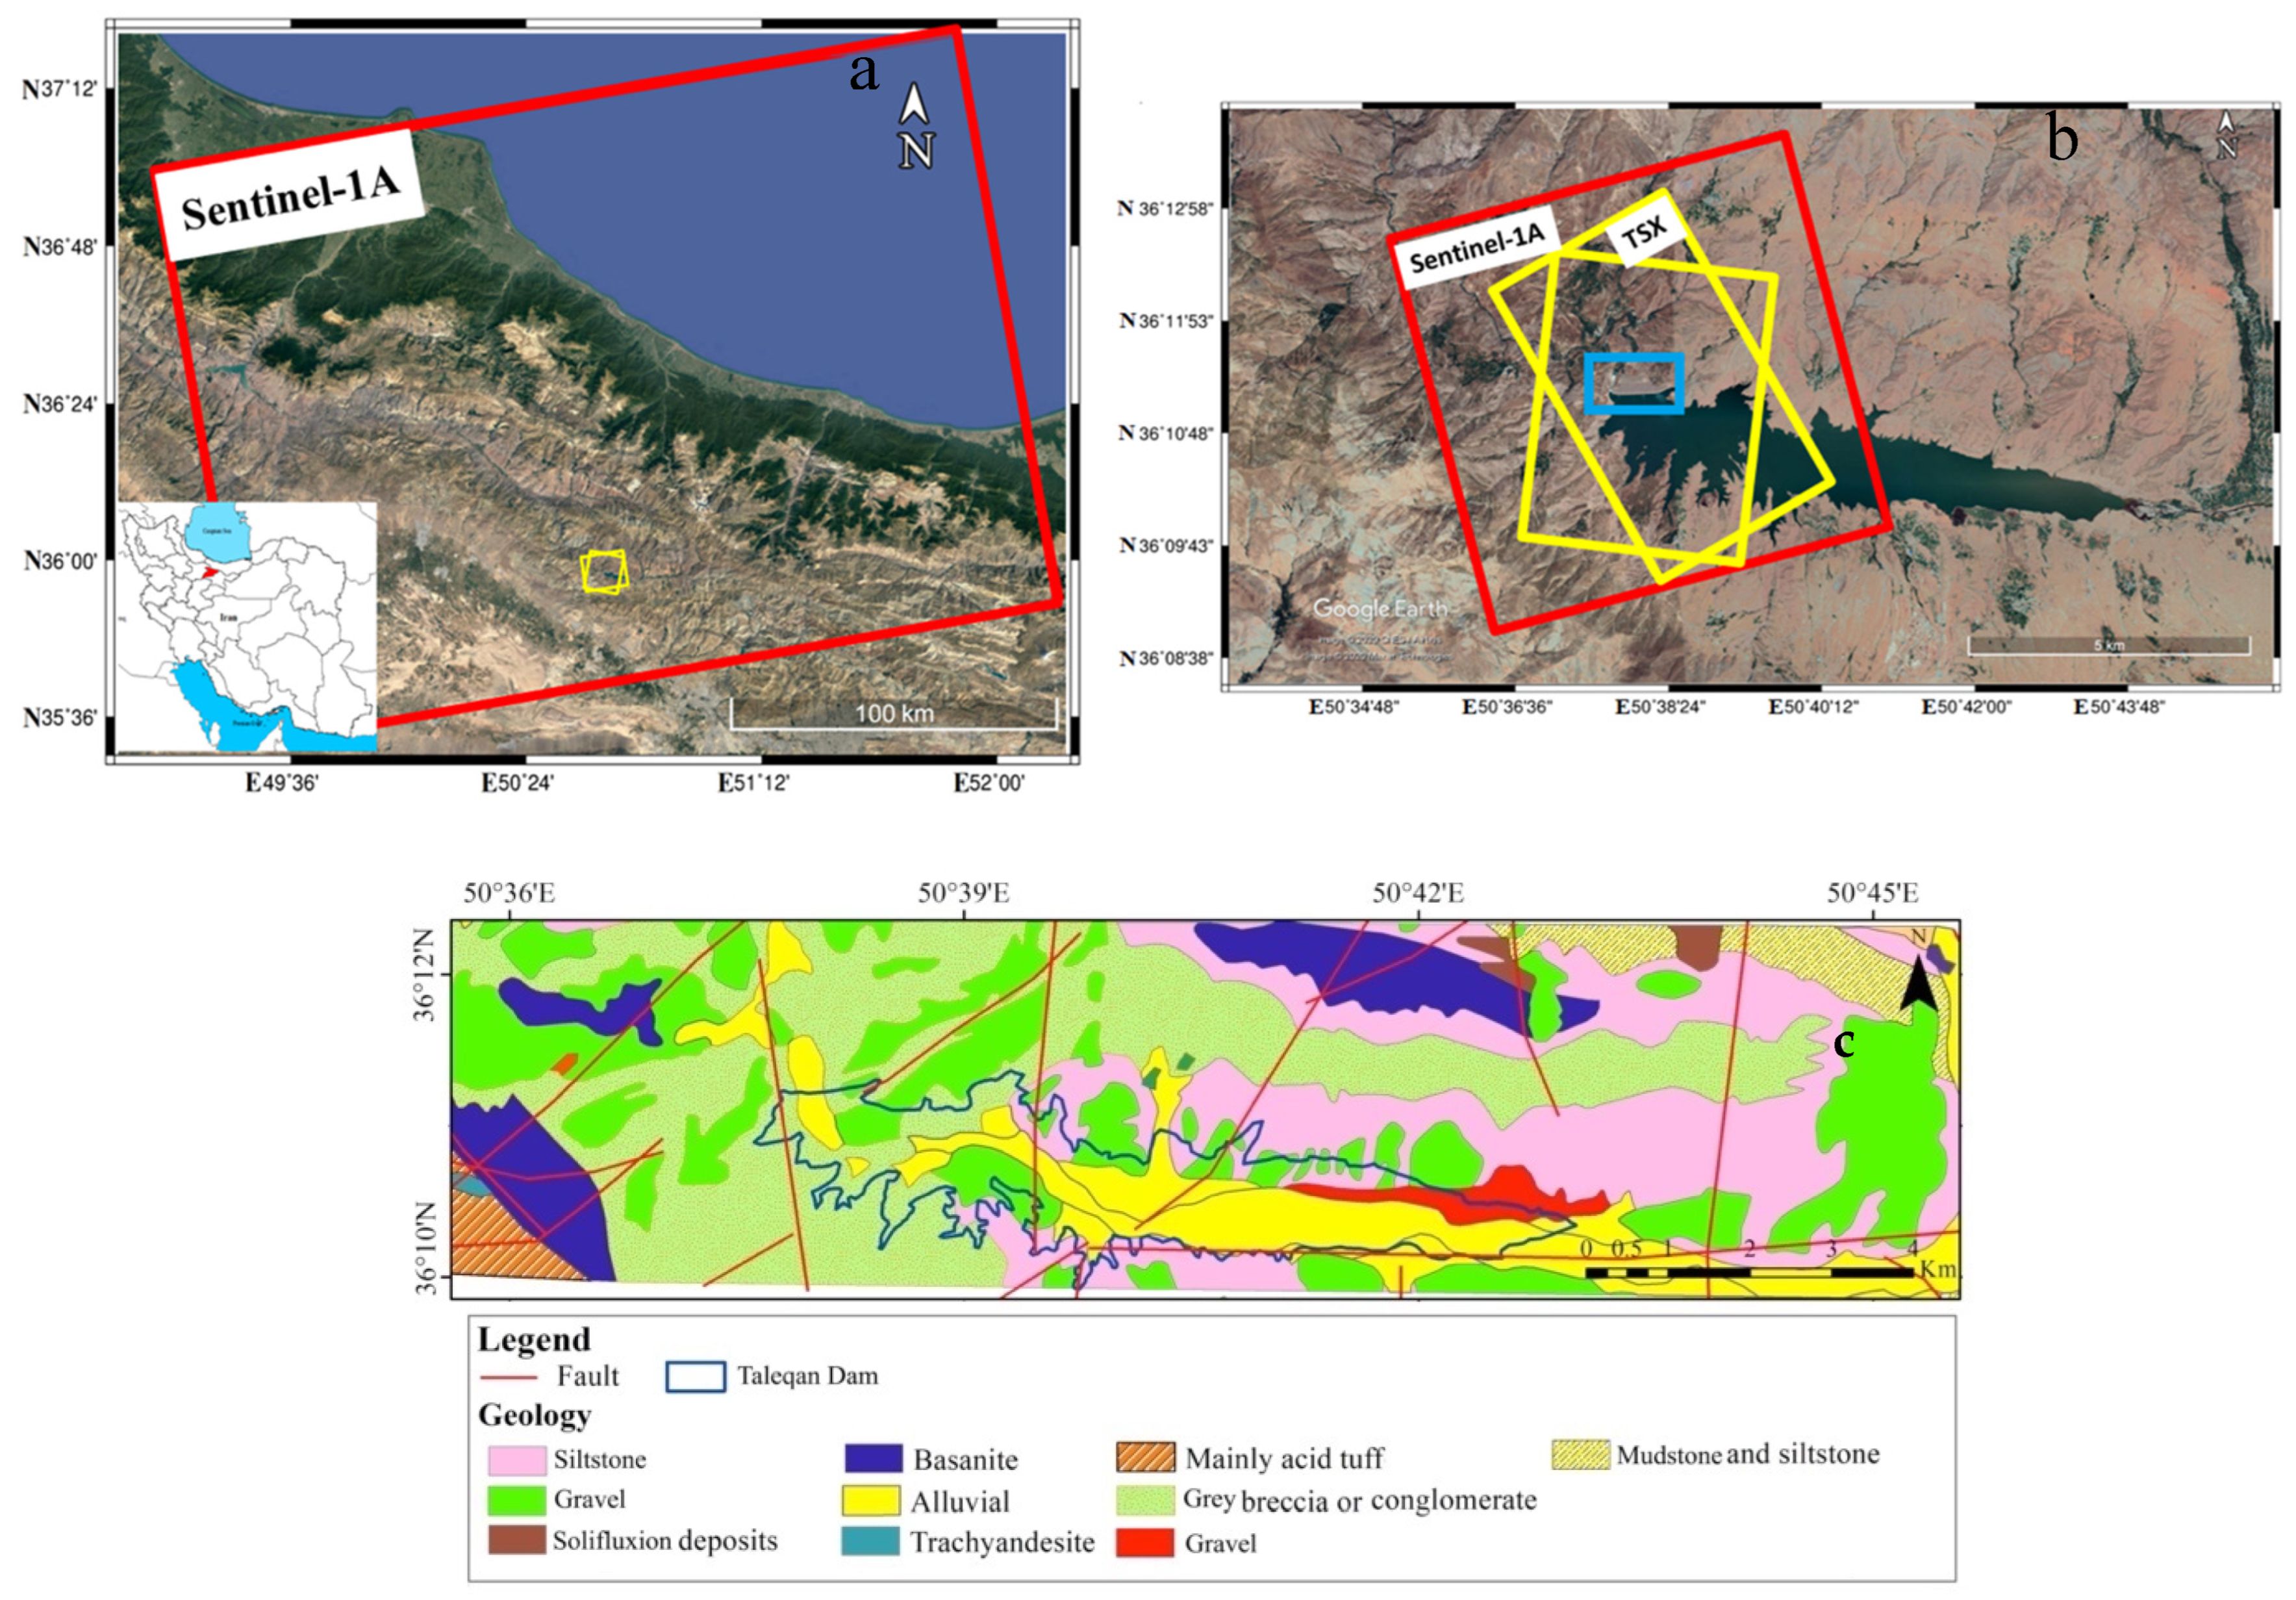
The Taleqan Dam was built on the Taleqan River, 135 km northwest of Tehran (Iran’s capital), between 2002 and 2006. The crest length of the dam is 1111 m, with a width of 12 m. Its height is 109 m from the bottom of the river and 149 m from the foundation, as shown in Figure 1 [29]. The main purposes of its construction are to control the pressure of water flow, supply potable water, and provide underground artificial recharge.

2.1. Geology of Taleqan Dam Region

The major historical deformation of the Taleqan Dam region over geological time is related to the Alpine orogeny. The area also consists of both thrust and reverse faults positioned in the neighborhood of the Taleqan Dam. The Taleqan catchment basin extends as far as the Taleqan fault from the south and the Kandovan fault from the north. The areas selected for dam construction are primarily exposed to risks of overthrust, landslide, and induced seismicity from reservoir waters [29]. In addition to tectonic factors, erosional (chemical and mechanical) processes have played a significant role in the local rocks’ and riprap layer’s deformation [30].
The Taleqan Fault, with a low slope towards the north, drives the folded Tertiary deposits on the Paleozoic–Mesozoic formations in the south. This fault was recently active. In addition, it contains a significant area of Miocene marl, where there were severe landslides due to high humidity and rainfall [29].

2.2. Field Survey

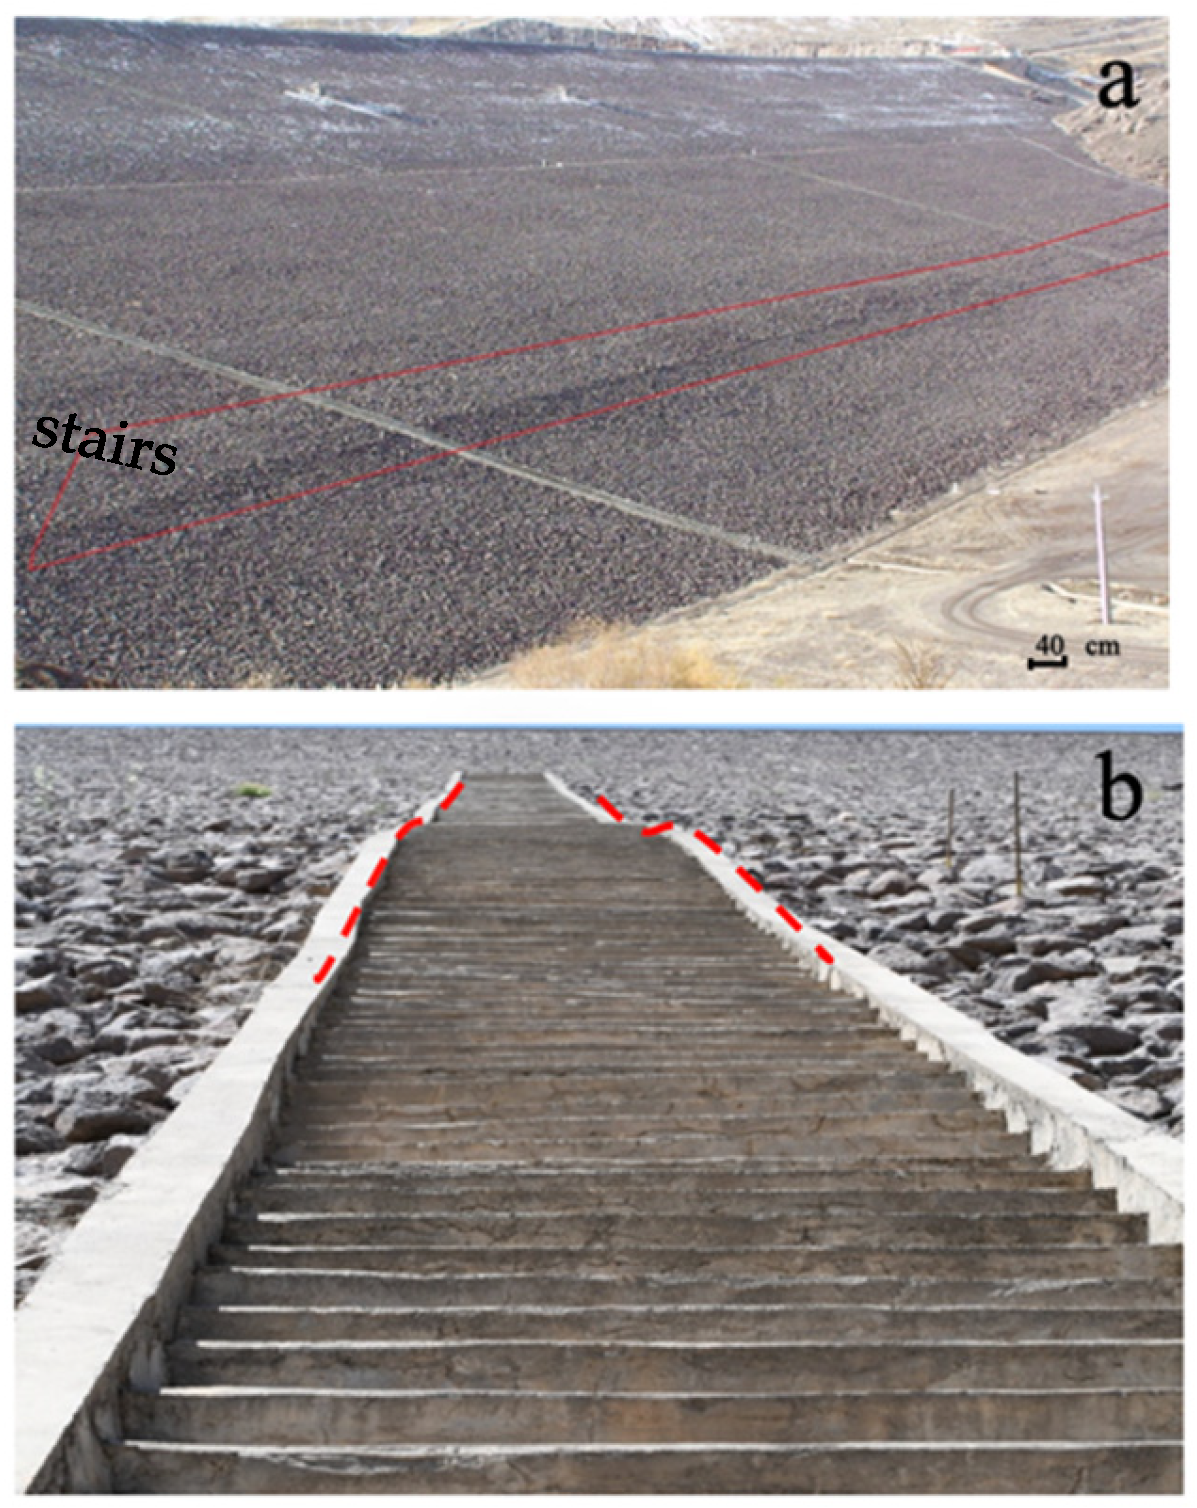
The dam was visited in March 2017 to search for evidence of the dam’s deformation. We found that the stairs, crest, and downstream area of the dam exhibited visible damage and settling. Figure 2 shows evidence of the erosion of the riprap material and the deformation of the stairs along the downstream slope of the dam.

3. Materials and Methods

3.1. InSAR Analysis

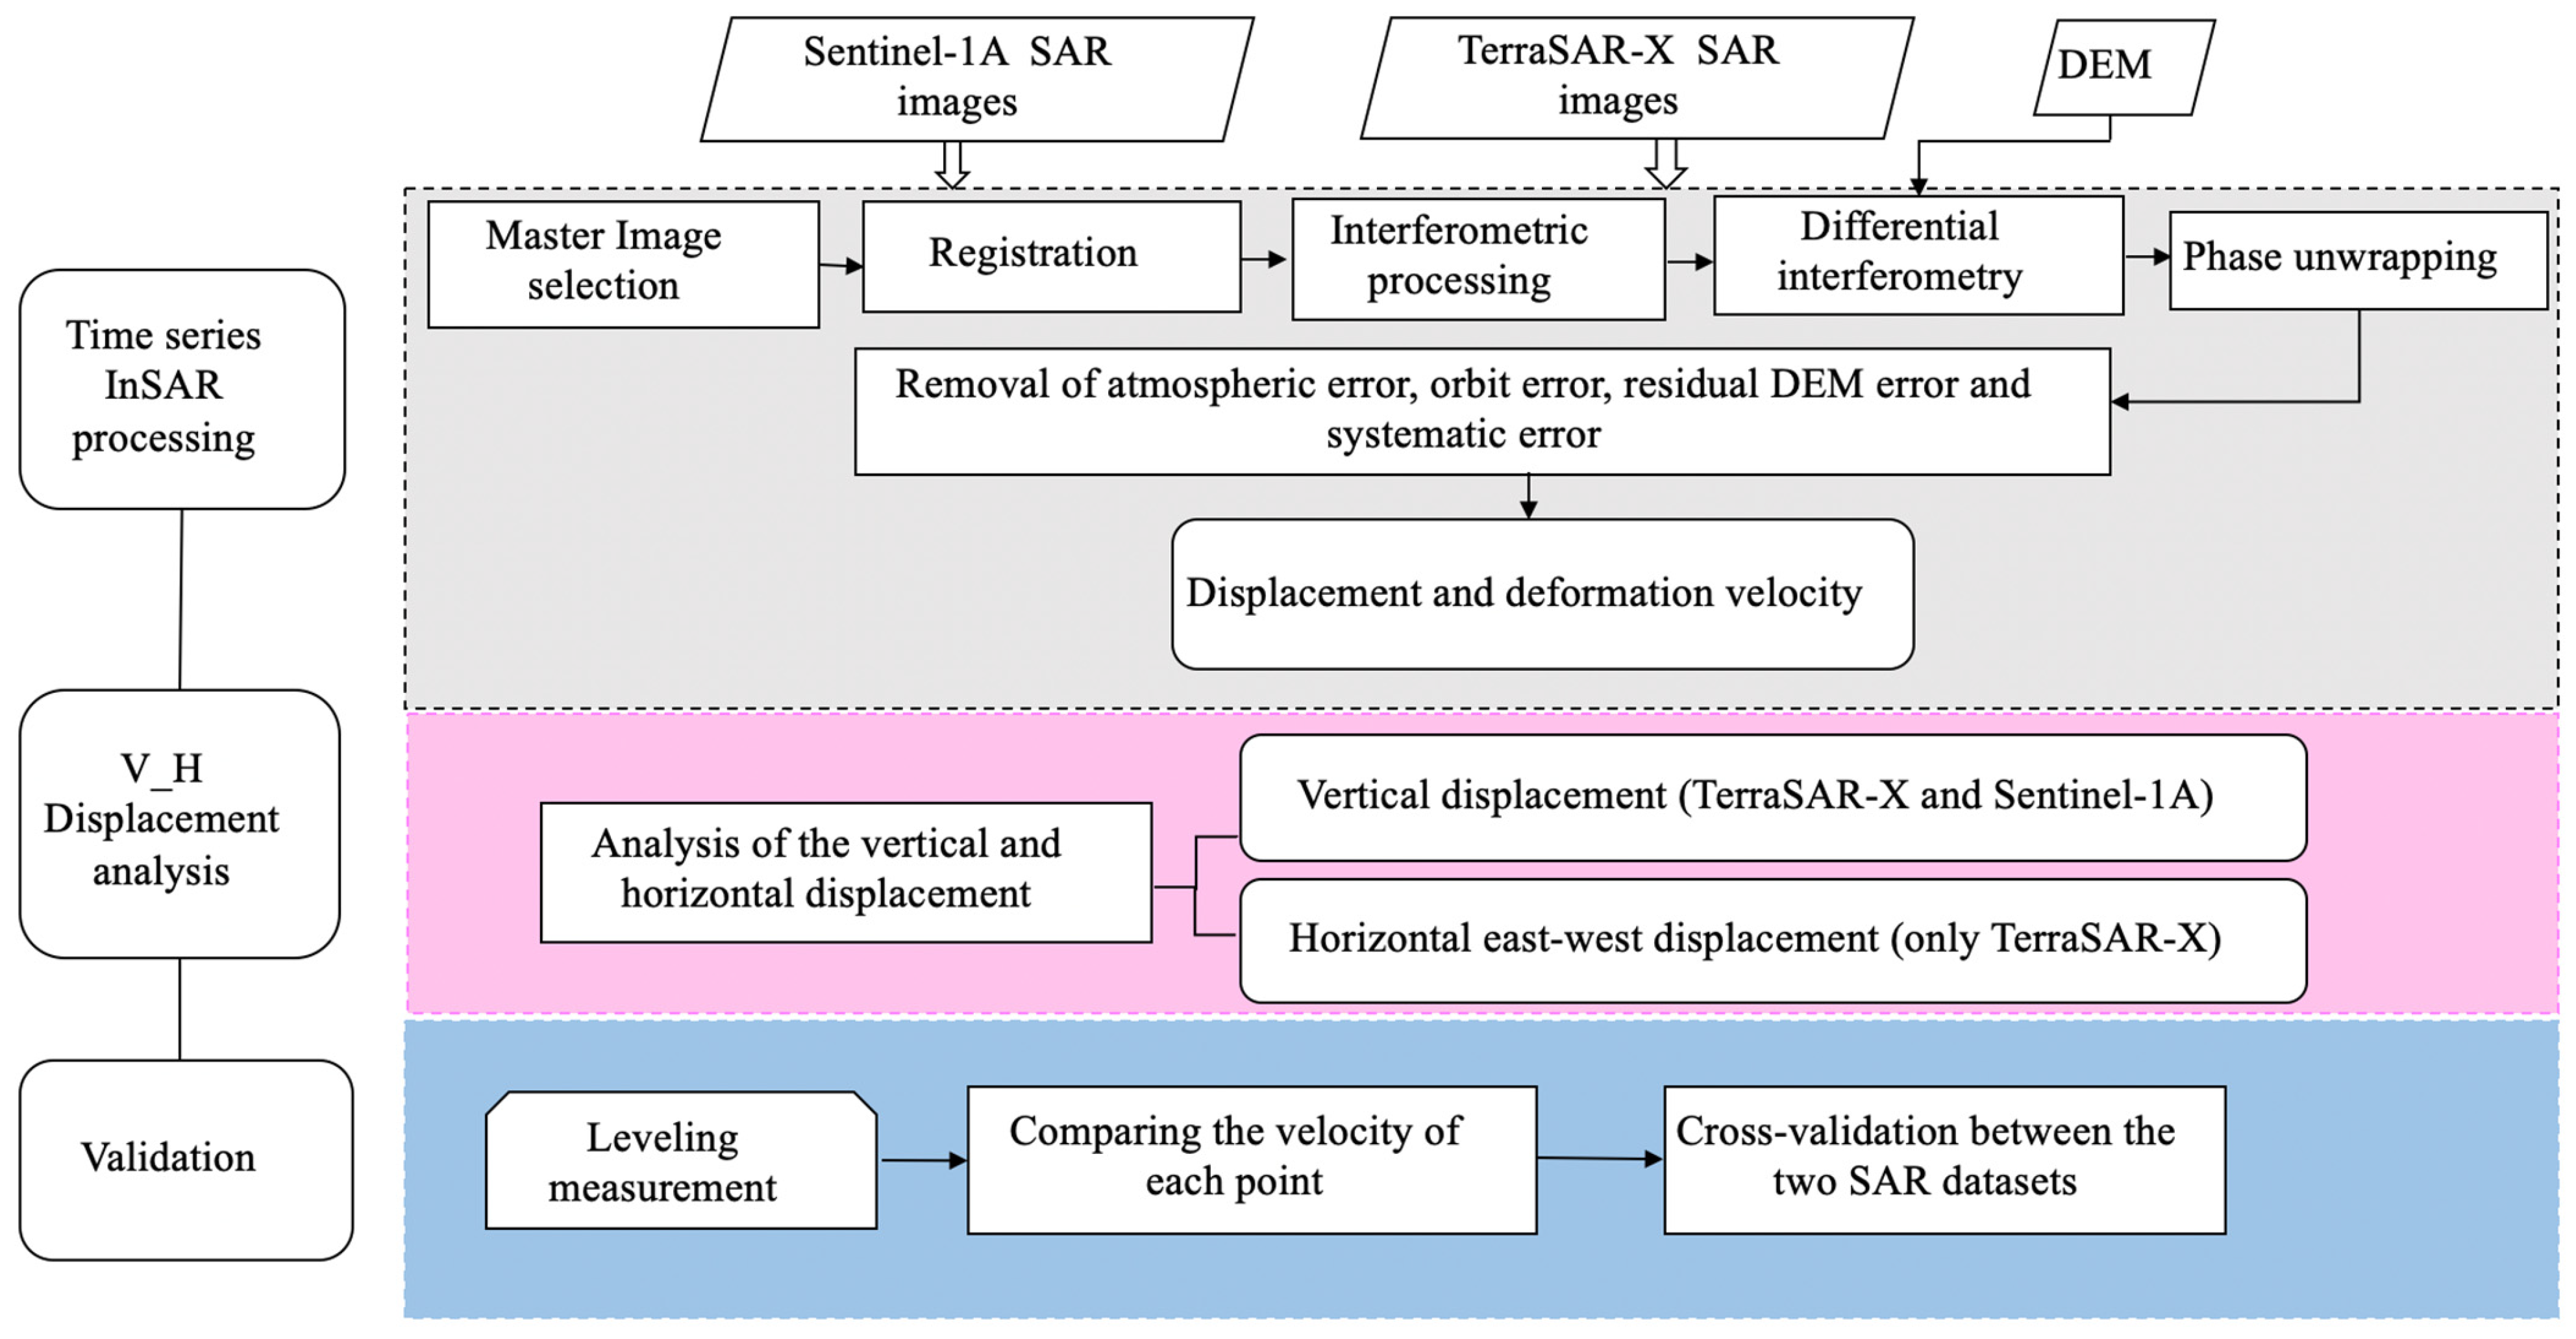
We analyzed two stacks of TerraSAR-X (10 ascending with an incidence angle of 34.3° and 8 descending with an incidence angle of 32.8°) Spotlight data in the X-band spectrum (Table 1) from May to August in 2018 and Sentinel-1 SAR images from 8 October 2014 to 10 July 2019 (102 images) in the C-band, with an incidence angel of 32.3° (Table 2), to assess the current state of the dam’s displacement. The InSAR analysis was carried out using the SBAS technique [19]. We used two different approaches to process TerraSAR-X (StaMPS) and Sentinel-1 data (GMTSAR). The differential interferometric phase is the consequence of the contribution of five phase components: topography, displacement, atmosphere, orbital error, and noise [31]. The topographic phase can be partially removed using a known digital elevation model (DEM), and the other phase component (orbit error, noise, and atmosphere) can be approximated and removed by suitable image stack processing, leaving the phase component to correspond to the displacement (Figure 3). The differential phase components can be represented using Equation (1) [32]:
t ( x , r ) = d i s p ( x , r ) + t o p ( x , r ) + a t m ( x , r ) + o r b ( x , r ) + n ( x , r )

3.1.1. TerraSAR-X Processing

We ordered the TerraSAR-X images during the summer months due to the presence of noise in the images obtained during winter. The TerraSAR-X data employed in this study are 18 X-band images obtained by the German TerraSAR-X mission in Spotlight (SL) mode: 10 images in ascending mode, spanning from 10 May 2018 to 17 August 2018, and 8 images in descending mode, spanning from 14 May 2018 to 17 August 2018.
The standard SBAS approach proposed in [33] employs multi-looked interferograms for time-series analysis. Despite the promising noise reduction feature of these multi-looking (factors of 5, giving 8 × 17 m rectangular pixels) in differential interferograms and the enhancement of phase unwrapping efficiency, the reduced resolution is not ideal for dam crest monitoring. For monitoring the small and local deformation signals of engineering structures, pointwise InSAR techniques [17] are widely used. It is worth noting that the small baseline analysis method employed in StaMPS characterizes single-look coherent pixels based on single-look images [18]. In order to study the local and minor deformation signals in engineering structures, processing interferograms with the highest possible resolution is an effective approach, allowing for the determination of isolated coherent pixels on the dam body [34]. We performed data analysis of the TerraSAR-X spotlight data through the small baseline approach implemented in the StaMPS (version 4.1b) time-series software [19], extended for spotlight data by [20,35]. The main concept of this technique relates to the processing of a series of SAR images obtained over the same area but on different days, resulting in temporal baselines, and derived from minorly different orbital positions, resulting in small perpendicular baselines.
For small baseline processing, based on the cropped SAR data, 45 ascending and 28 descending interferograms were created with a threshold-snaphu of 0.3 and a threshold-geo-code of 0.1. The interferograms were unwrapped by a 3D phase unwrapping method [18], and a least-squares inversion was employed to retrieve the displacement time series. We removed the atmospheric component of the phase using linear correlation between the topography and interferogram phases.
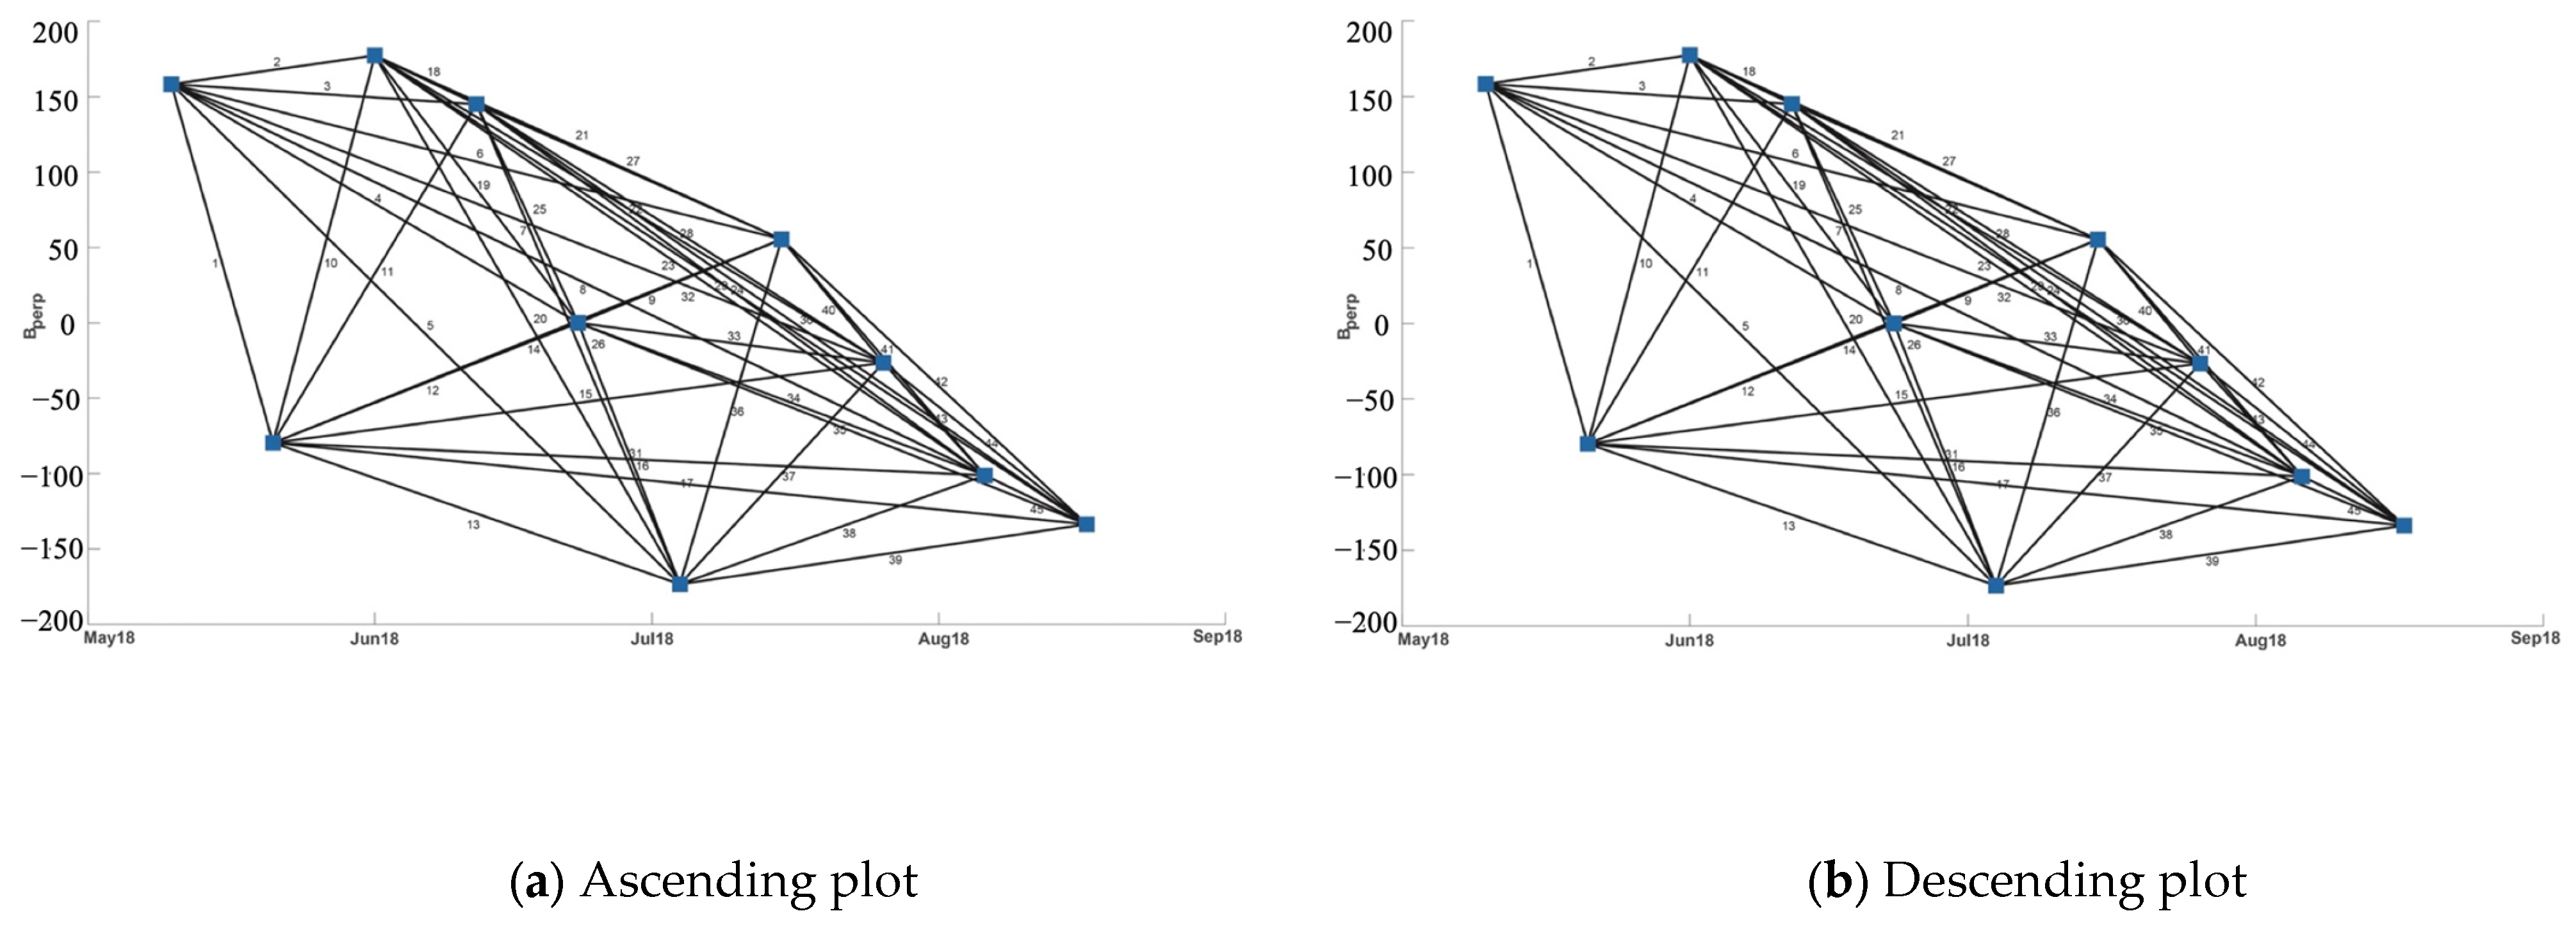
The final baseline network for the small baseline time-series analysis is shown in Figure 4a for ascending orbits and Figure 4b for descending orbits. LOS velocities are estimated by inverting the network to obtain a single-primary time series, and then least-squares inversion is applied.
To assess the quality of the InSAR results, we compared them to the ground-based data obtained at the surveying points for the pre-defined period. Given that the surveying data give insight into both horizontal and vertical displacements, they were initially projected on the LOS direction by Equation (2); then, velocity was measured by scaling the computed LOS motion, dclos, according to the time interval of the last time period [32]:
V l o s = V V cos θ ± V E cos V N sin sin θ
where is the azimuth of the satellite’s track; θ is the radar wave’s incidence angle; and VE, VN, and VV are displacement components in the east–west, north–south, and vertical directions, respectively. Therefore, merely one single component of the 3D deformation vector can be found in the interferogram. However, by combining ascending and descending orbit interferograms, a second component of the deformation vector can also be determined [32]. For reproducibility, the key InSAR processing parameters are summarized as follows. For TerraSAR-X (StaMPS) processing, 18 Spotlight X-band images were used (10 ascending and 8 descending), spanning May–August 2018. A total of 45 ascending and 28 descending interferograms were generated, with coherence thresholds set as threshold-snaphu = 0.3 and threshold-geocode = 0.1. Small temporal and perpendicular baselines were selected to maximize coherence, and a 3D phase unwrapping method was applied. Displacement time series were obtained via least-squares inversion, and the atmospheric component was corrected using linear correlation with topography in SBAS to retrieve LOS displacement rates and examine the cumulative deformation.

3.1.2. Sentinel-1 Processing

We carried out a wide area analysis over the Taleqan Dam using 102 ascending Sentinel-1, C-band (5.6 cm wavelength) images. Single-look complex (SLC) images were obtained from the interferometric wide (IW) swath mode with vertical polarization (VV) (frame extent shown in Figure 1). The spatial resolution (pixel size) is approximately 5 m × 20 m along the range and azimuth directions (track 123).
The data were processed with version 5.8 of the “Generic Mapping Tools Synthetic Aperture Radar” GMTSAR software version 6.2 [36], with additional post-processing carried out using GMT [37].
We subtracted the topographic phase using the (∼90 m) Shuttle Radar Topography Model (SRTM) and digital elevation model [37]. GMTSAR first extracts orbital information in the pre-processing step of raw data and then estimates the Doppler centroid. After image focusing, all images are aligned to a chosen primary image. As a co-registration accuracy better than 0.01 pixels is required in the along-track direction, GMTSAR uses precise orbits (aux_porb) for initial co-registration and the enhanced spectral diversity (ESD) method for removing the co-registration error at bursts, achieving the desired precision [38].
Following this step, the 550 interferograms are generated in GMTSAR and corrected for topography and orbital artifacts to derive flattened interferograms. Then, a low-pass filter is applied to the flattened interferogram before applying SNAPHU to unwrap the phase. Finally, the unwrapped interferograms are geocoded. We also estimate and remove a phase ramp from all images, which could be present due to residual orbital errors and long-wavelength atmospheric signals, and further reduce the atmospheric signal, assuming a linear relationship with topography. We determined the LOS displacement rates and cumulative displacement by the SBAS method in StaMPS. SBAS uses differential interferograms acquired at satellite positions with a small distance and a short time interval.
For Sentinel-1 (GMTSAR) processing, 102 ascending IW-mode SLC images (C-band, VV polarization) from October 2014 to July 2019 were used. Co-registration was performed using precise orbits and the enhanced spectral diversity (ESD) method to achieve <0.01 pixel accuracy in the along-track direction. A total of 550 interferograms were generated, corrected for topography (SRTM DEM) and orbital errors, low-pass-filtered, and unwrapped using SNAPHU. Residual phase ramps and atmospheric effects were further corrected assuming a linear relationship with topography. Small baseline subsets were used.

3.2. Geodetic Data

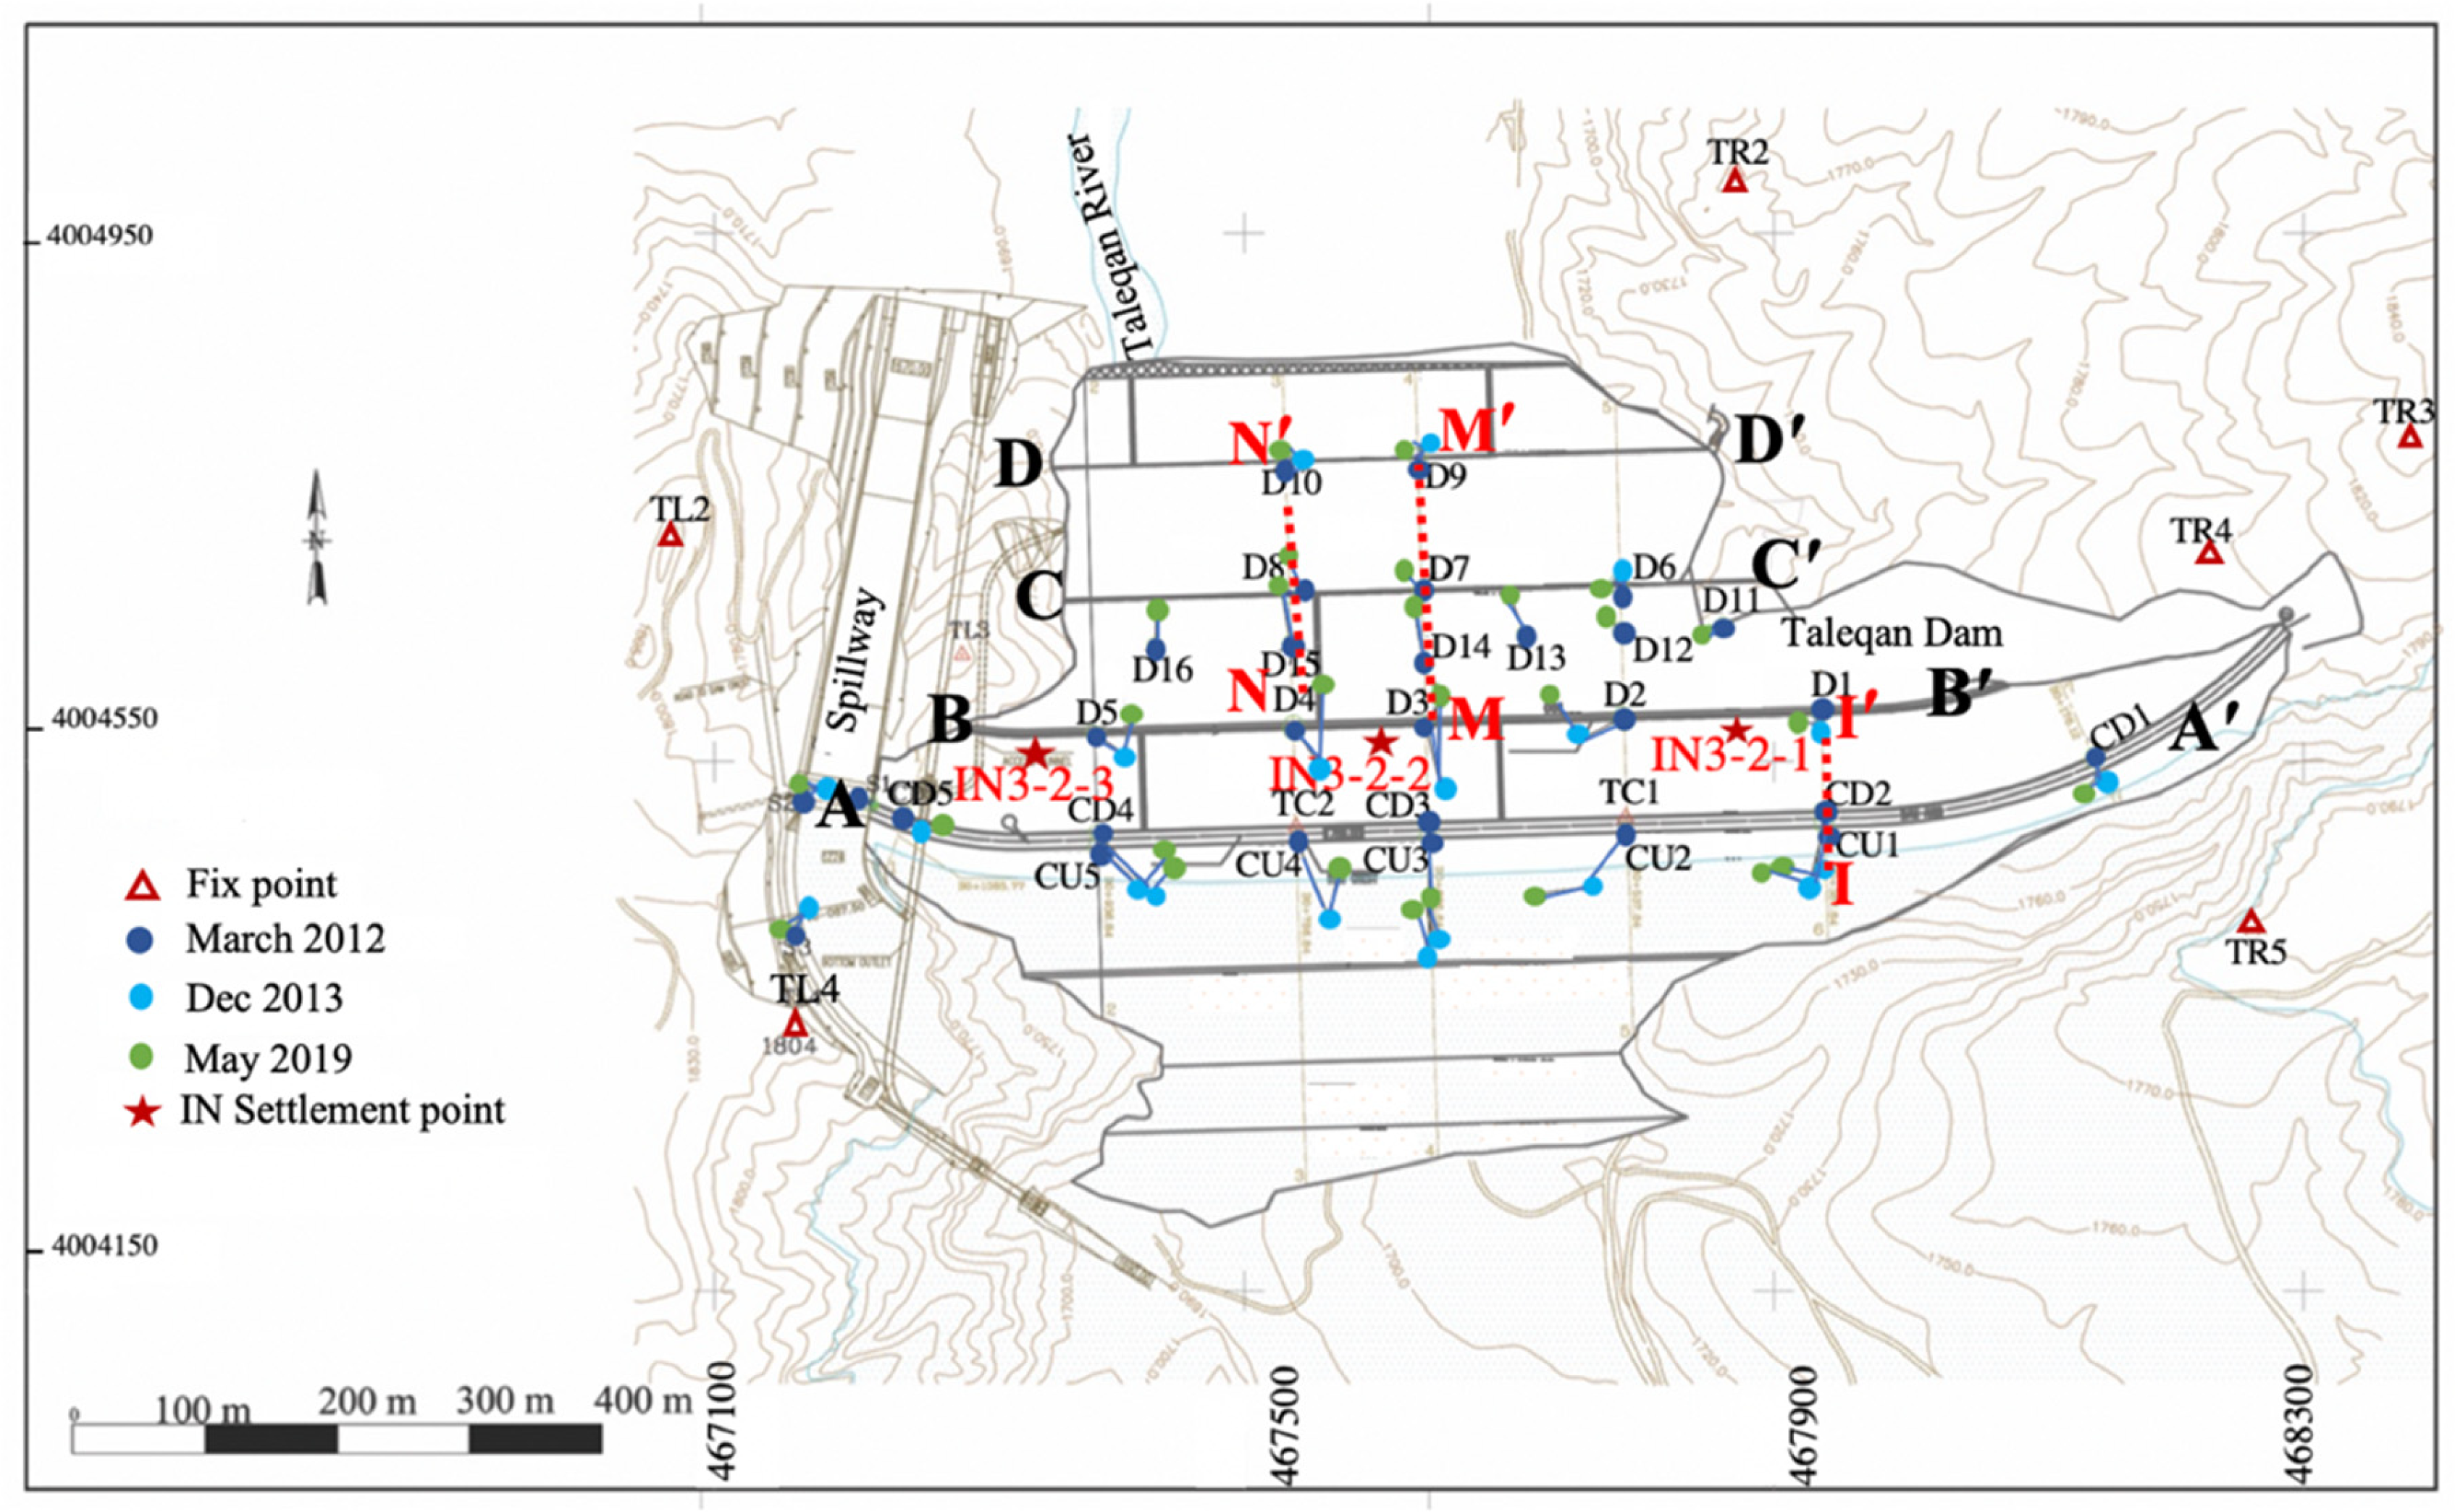
The topographic network over the dam was set up on and in proximity of the dam and three successive measurements were carried out in March 2012, December 2013, and May 2019 [29]. It should be noted that using a more terrestrial surveying network improves measurement accuracy. However, because of the high cost, the dam’s executive decided to only complete three steps. The principal network located on the crest and downstream slope comprised target points on the dam body. Instead of GNSS, the micro-geodesy network is based on radiation from a single point, whereby the angle and distance to other points on the dam are measured by trigonometric leveling, and a relevant local coordinate is defined. At intervals, ref. [29] remeasures the distance and angles and monitors the x, y, and z changes at the points. The geodetic points’ locations (on the dam network) are shown in Figure 5. The figure shows the horizontal displacement estimated in March 2012, December 2013, and May 2019. The estimates were obtained through over-constrained least-squares adjustment to extract the horizontal coordinates of the surveying points specific to each time period. The first measurements were made in 2012 [29]. To compare with InSAR data, we employed the micro-geodesy from the 2012–2013 and 2019 time periods.

4. Results

4.1. TerraSAR-X Results

The SAR measurements should be analyzed together with ancillary data to allow for the interpretation of the observed seasonal displacement. High-resolution TerraSAR-X images with Sentinel-1 enabled us to obtain better and more reliable results and cross-validate the results.
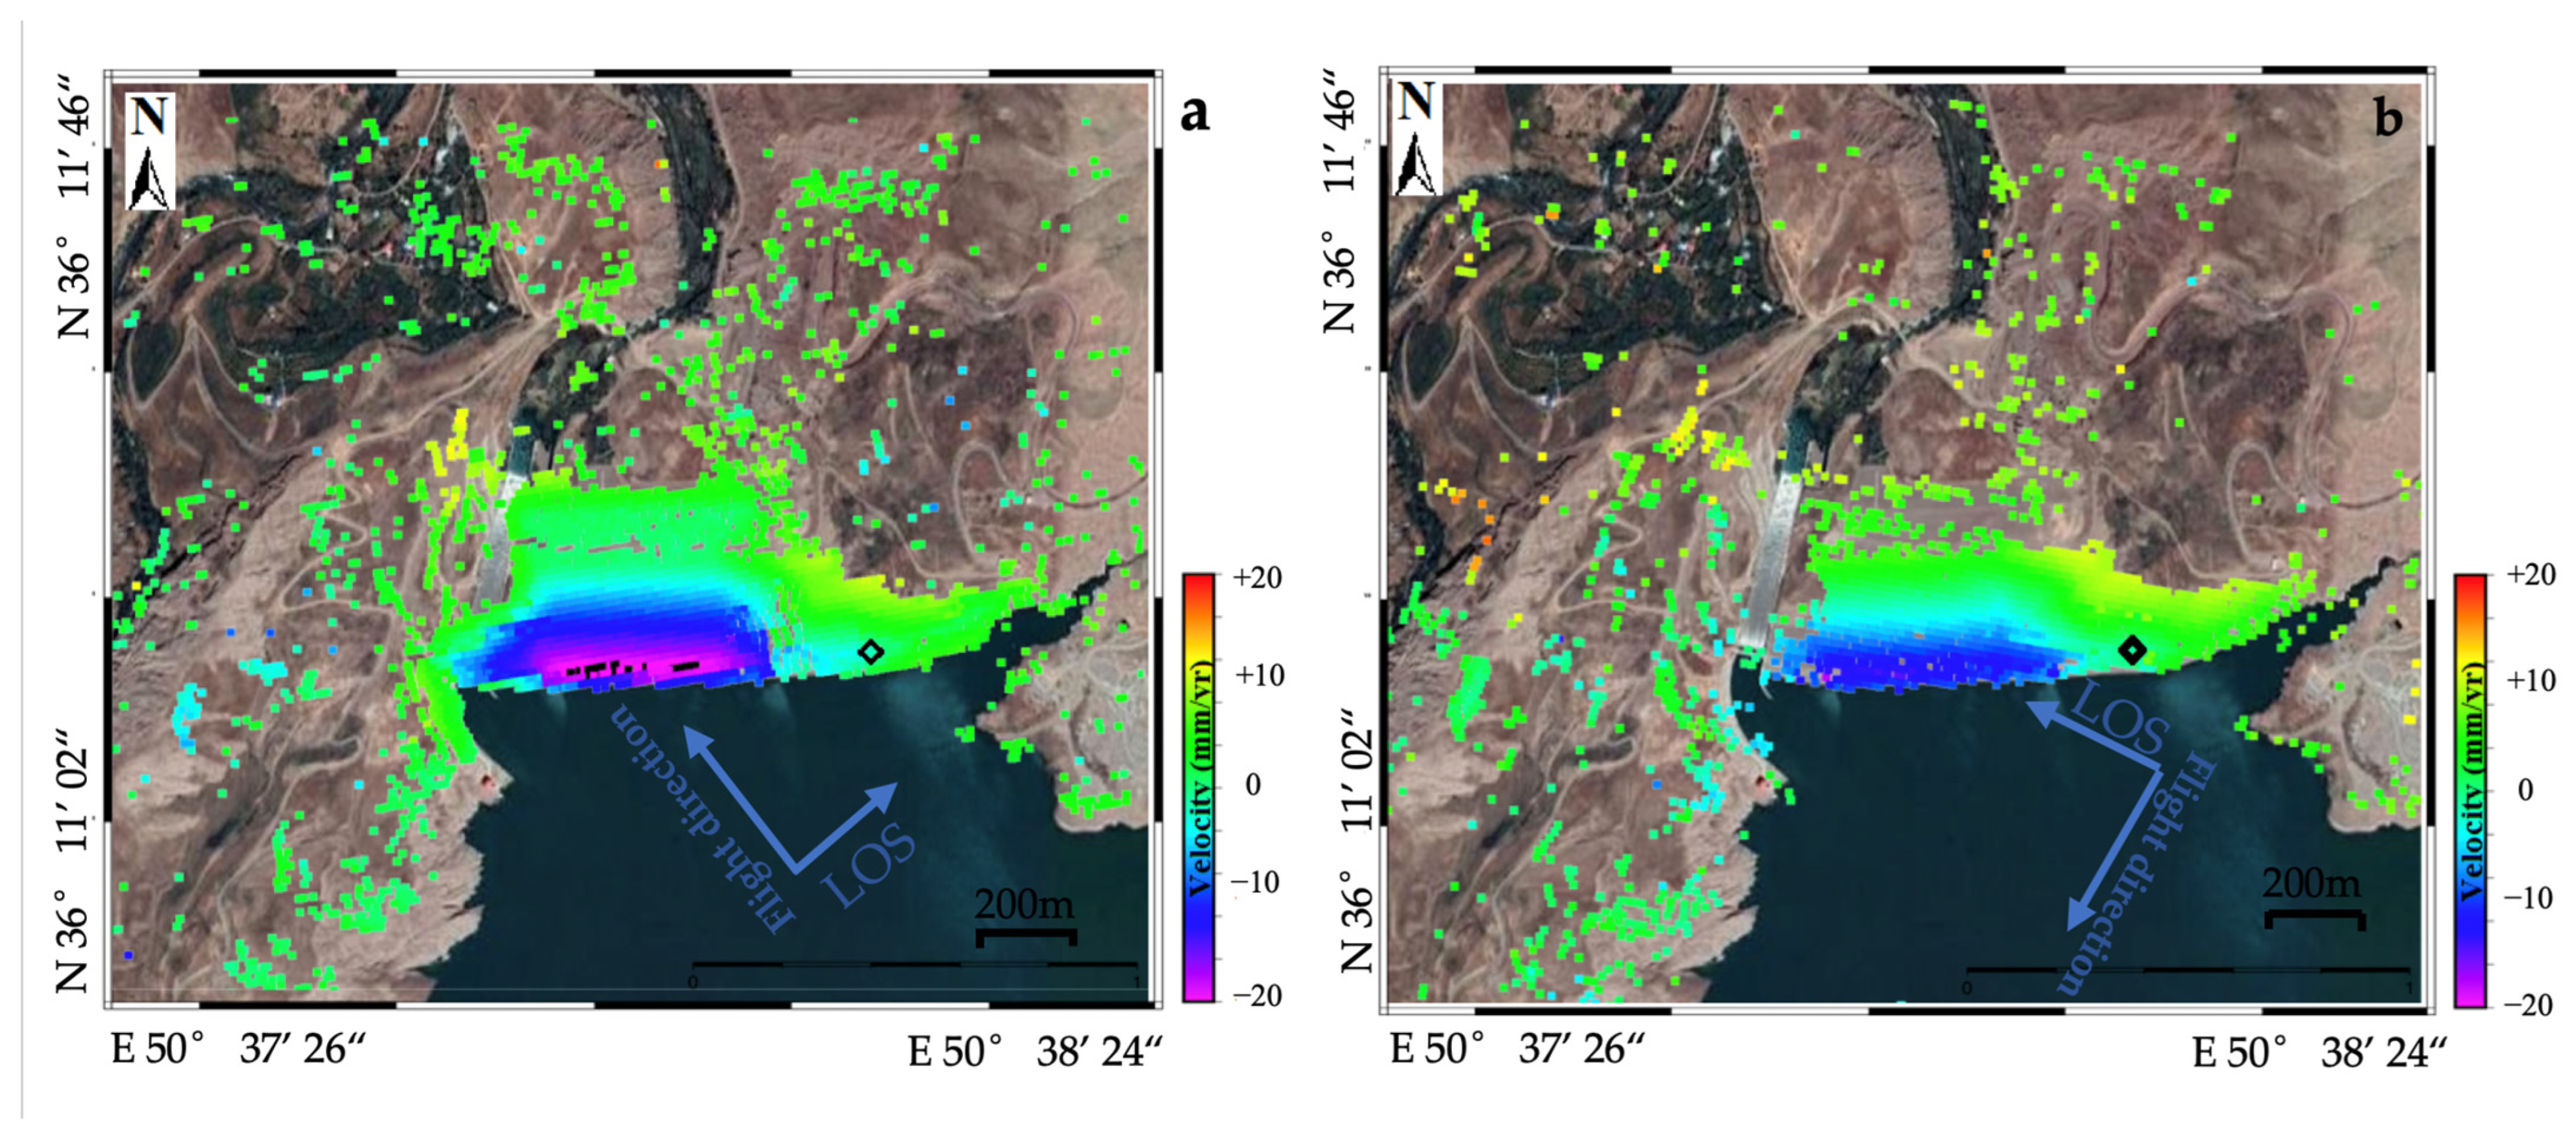
Figure 6a,b show the mean velocity in the LOS direction derived from the TerraSAR-X spotlight data in ascending and descending orbits, respectively. In the ascending orbit, we observed more coherence and pixels.
Despite the short time period of observation (0.25 yr), the deformation rate maps showed comparable results.
The maximum rate of displacement of more than 8 mm (Figure 7) is related to the downstream slope of the dam. The apparent uplift (obtained via field observation by [29]. throughout the areas of higher topography (topographic map) close to the downstream part of the dam matches field observations [29].

4.2. Sentinel-1 Results

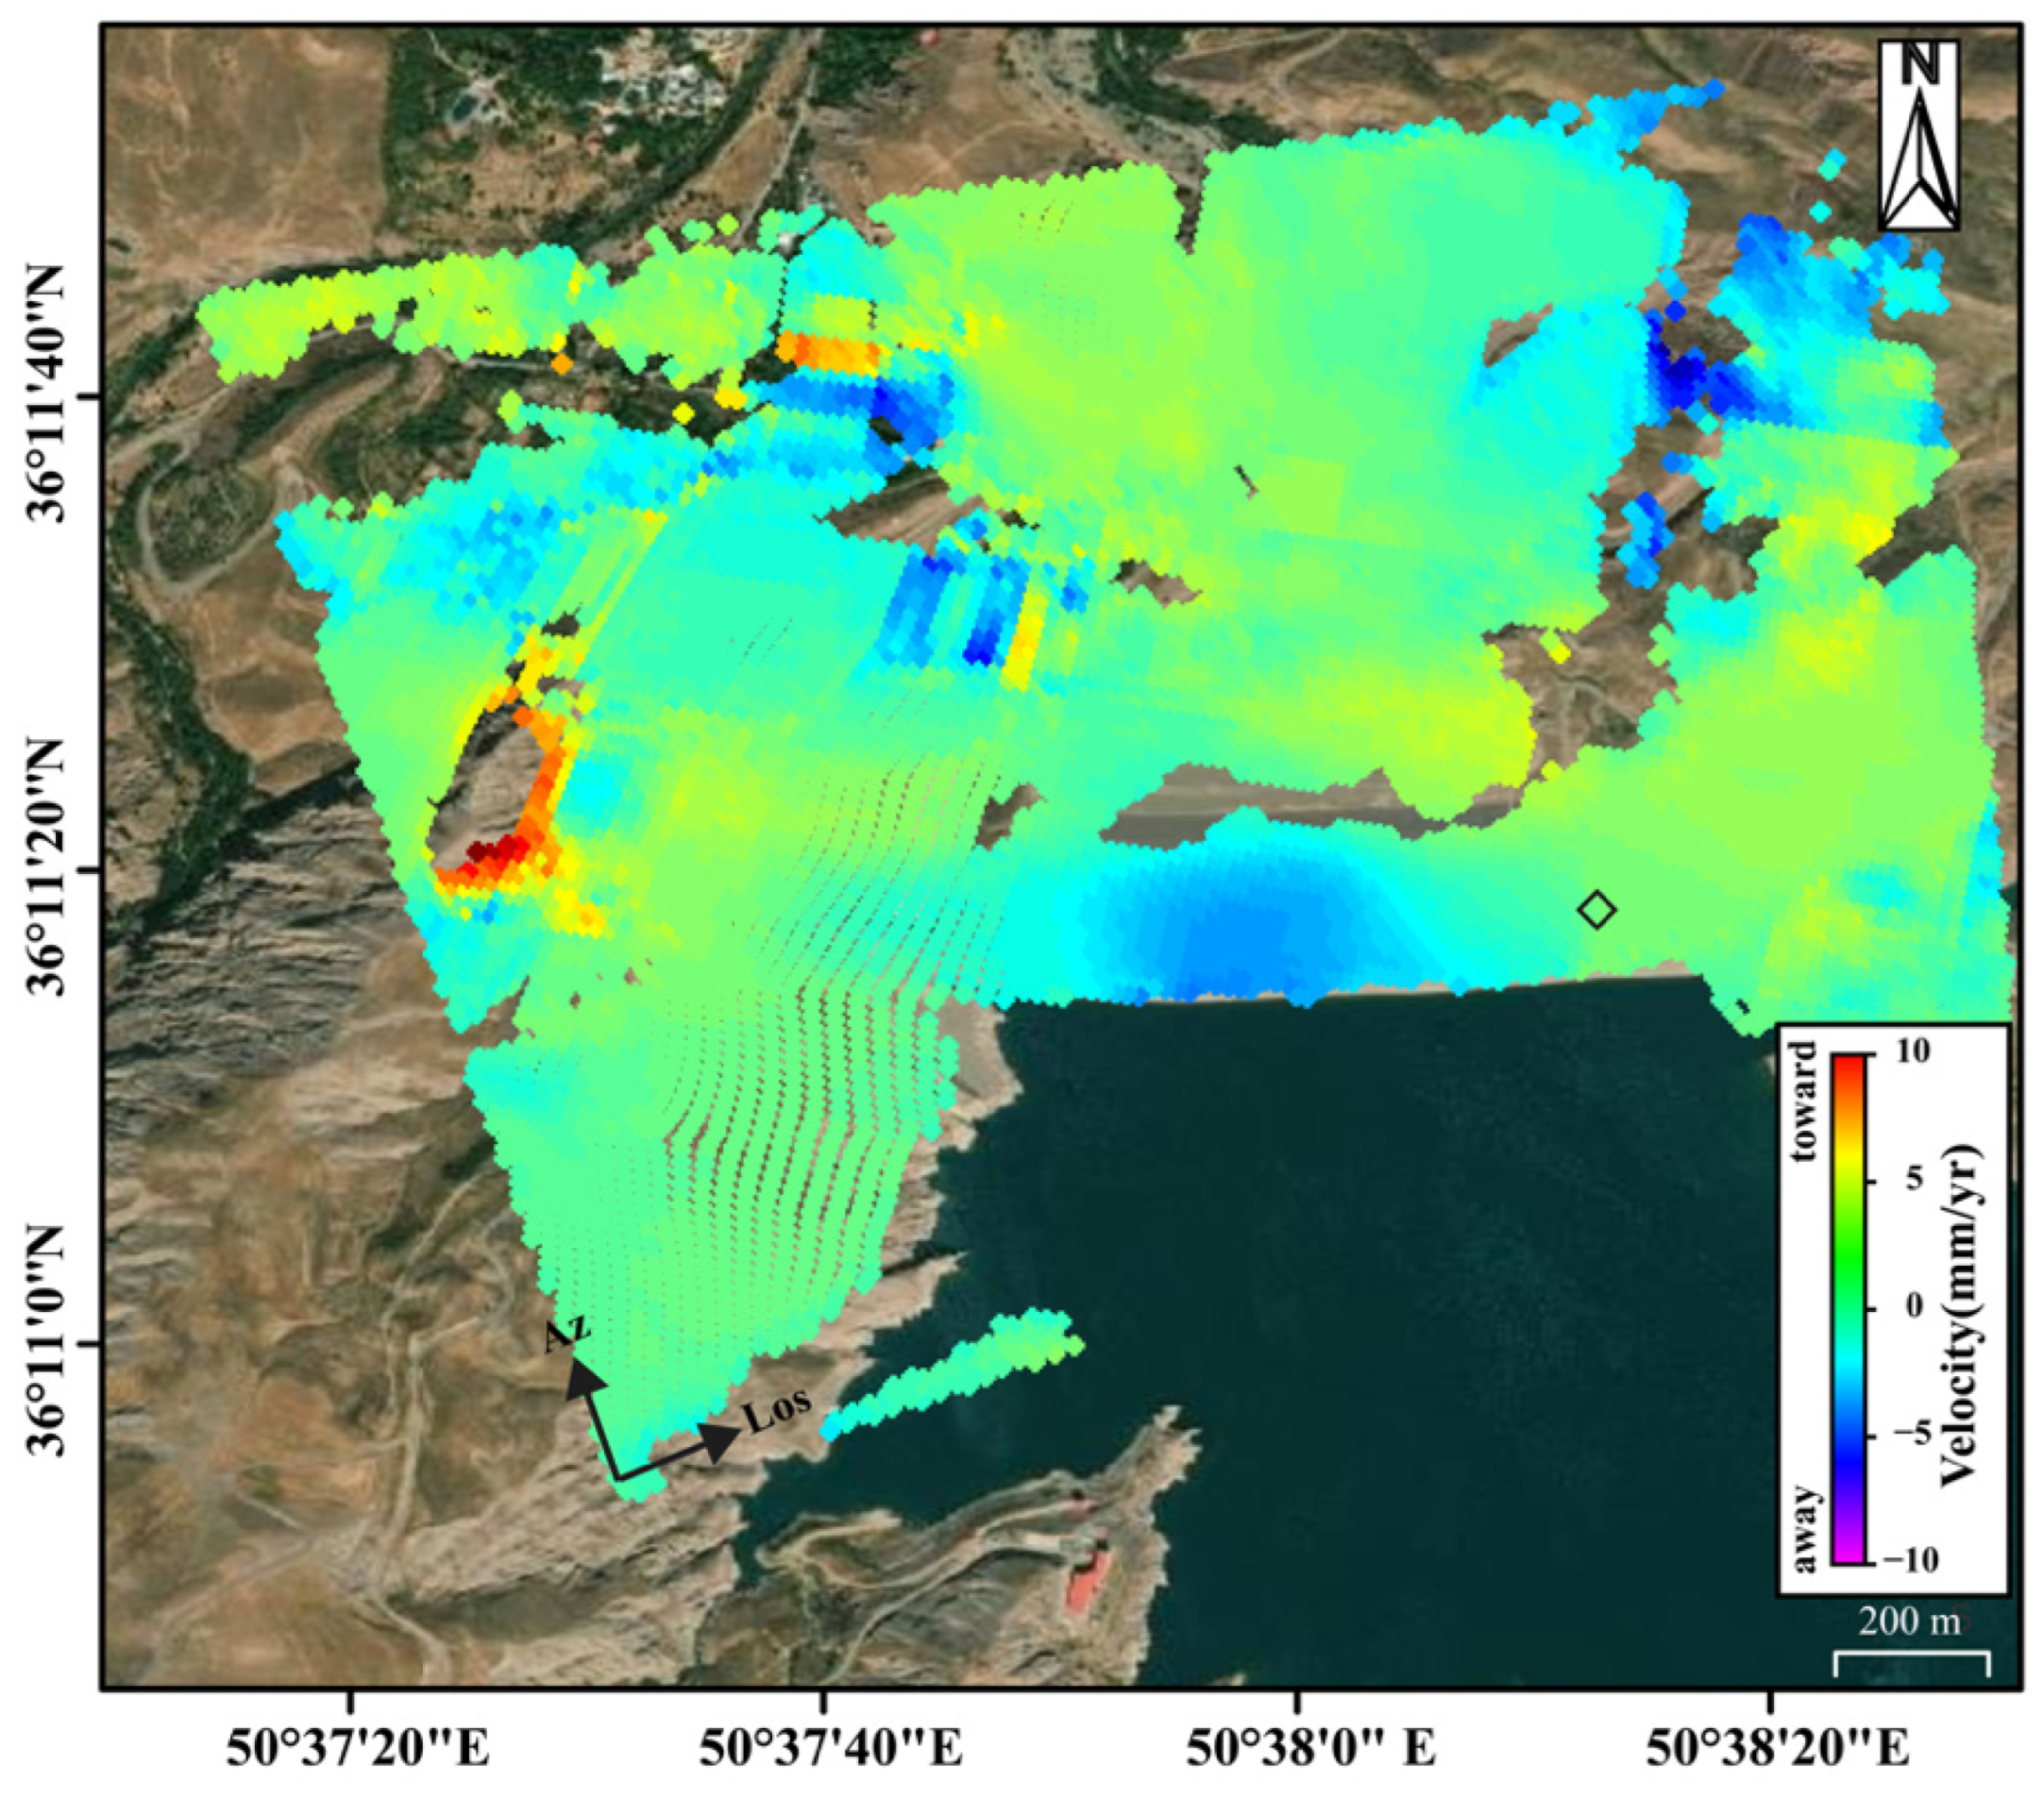
To investigate the behaviour of the Taleqan Dam, we generated the SBAS time series. The displacements in the LOS direction were determined based on the ascending orbits of Sentinel-1 data. The result of the Sentinel-1 analysis from 2014 to 2019 shows a maximum mean LOS velocity of around 4 mm/yr away from the satellite in the LOS direction on the downstream slope of the dam (Figure 8). The negative or positive sign represents movement away from or towards the satellite, respectively. It can be seen that a larger displacement is distributed in the downstream part of the dam’s body, with velocities ranging from −6 mm/yr to −2 mm/yr.

4.3. Surveying Measurements

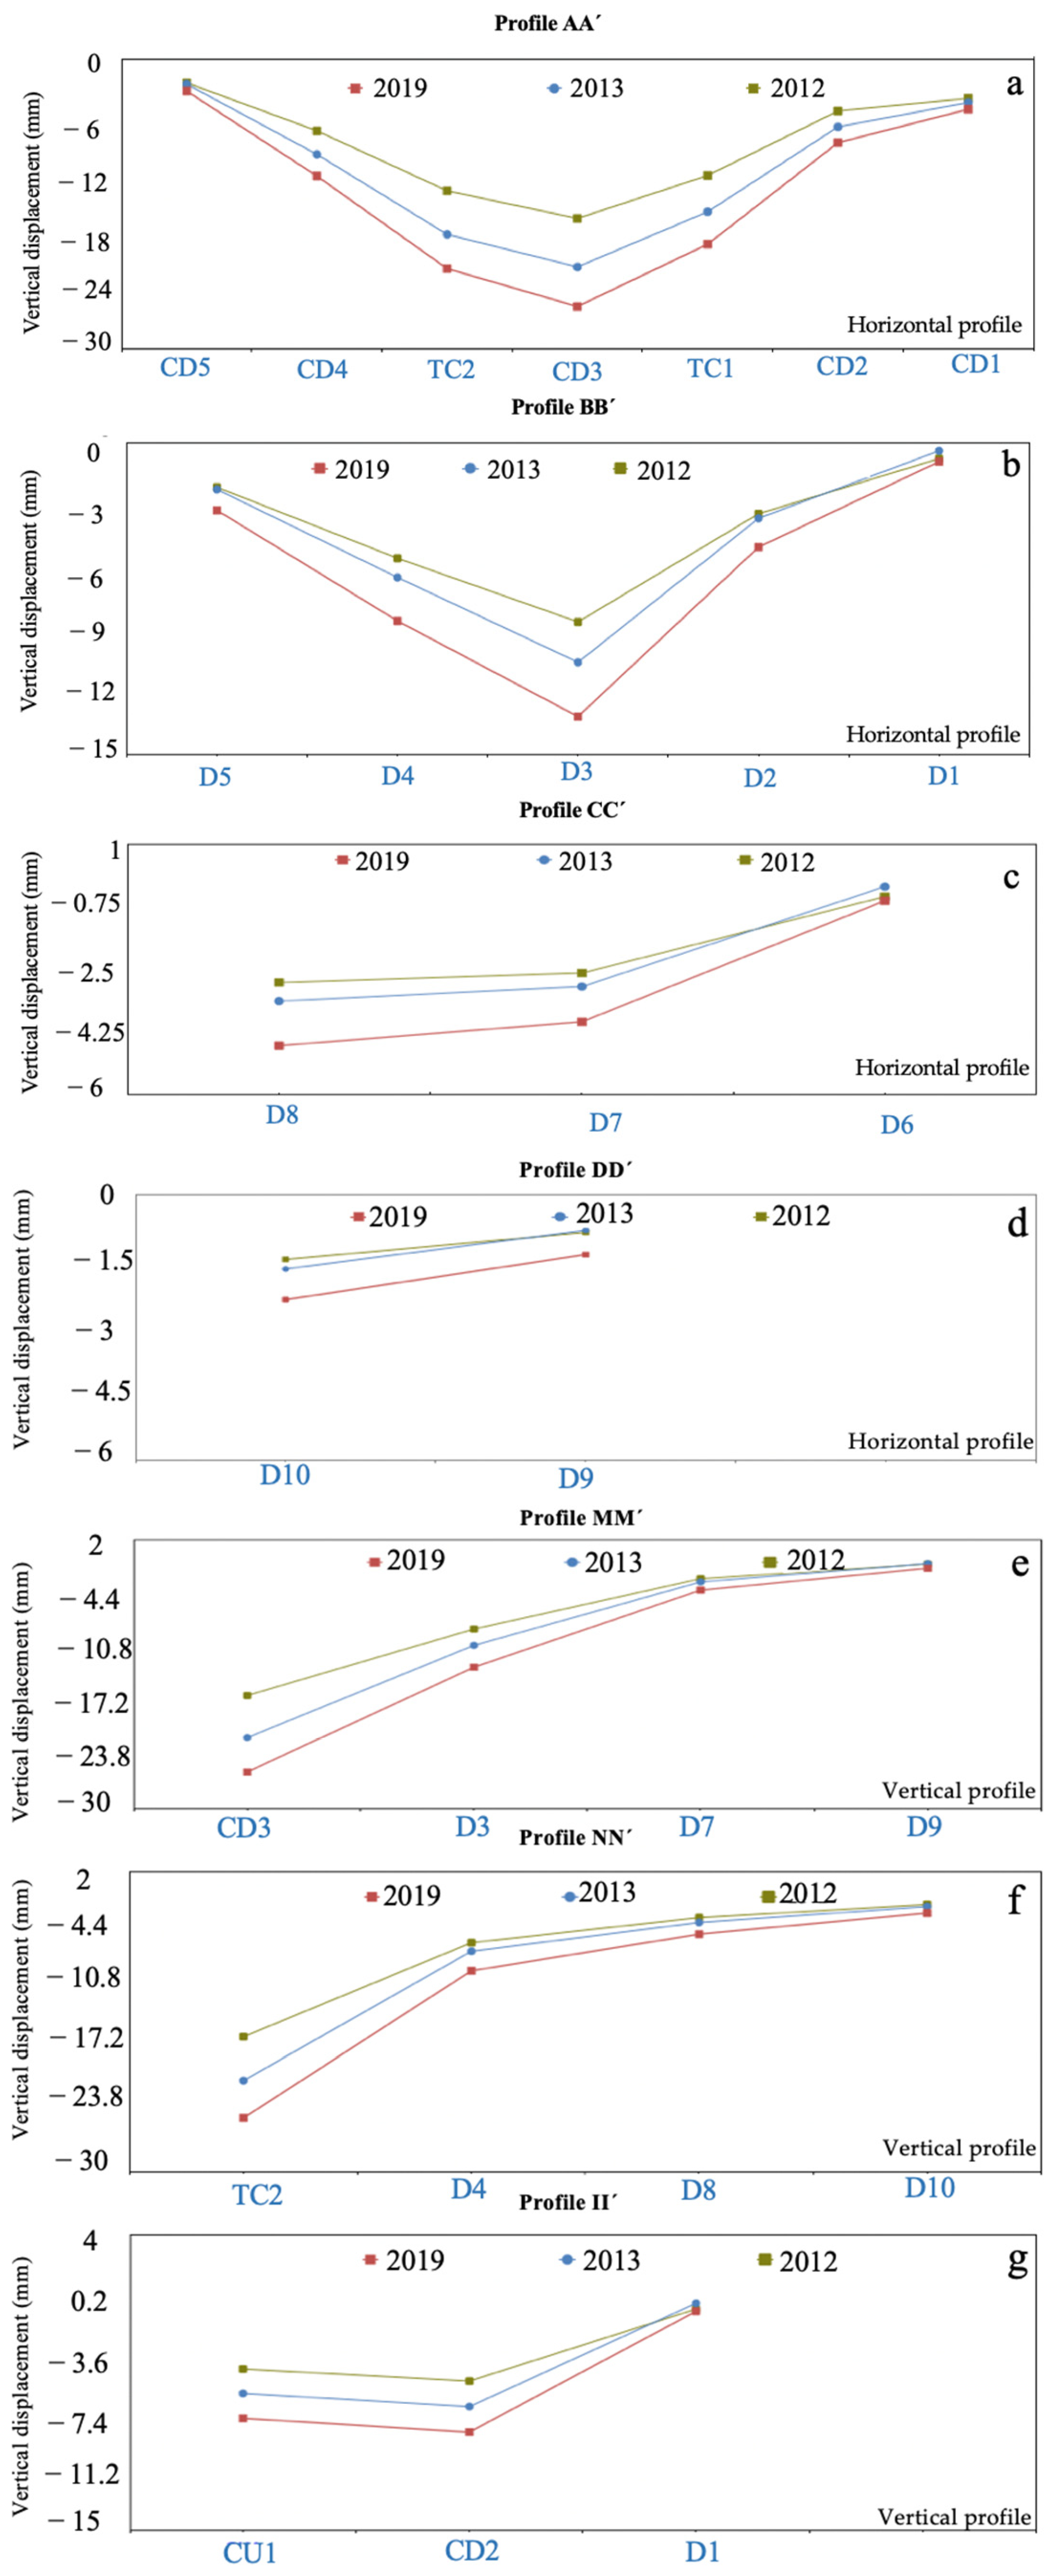
Some pillar points in the terrestrial surveying network [29] experienced vertical displacement during the time period of 2012–2019 (Figure 9a). The maximum vertical displacement is related to the CD3 pillar, with as much as −24 mm on the dam crest (Figure 9a). The vertical displacements of the points on the dam’s body from D1 to D10 are shown in Figure 9b,d. The vertical profile of the points on the dam’s body is shown in Figure 9e–g.
The vertical profile shows that maximum deformation takes place in the downstream part of the dam Figure 9c–e, while the horizontal profile indicates that the maximum deformation occurs in the central part of the dam.
Due to the consolidation of clay [29] in the downstream part of the dam, the highest vertical deformation occurred there.
Due to the projection of the three-dimensional vector to the radar’s line of sight, it was not possible to retrieve the full displacement vector, as mentioned in the 3D sketch including the projection of the up component on the line of sight via the incidence angle ( θ i n c ) [32].
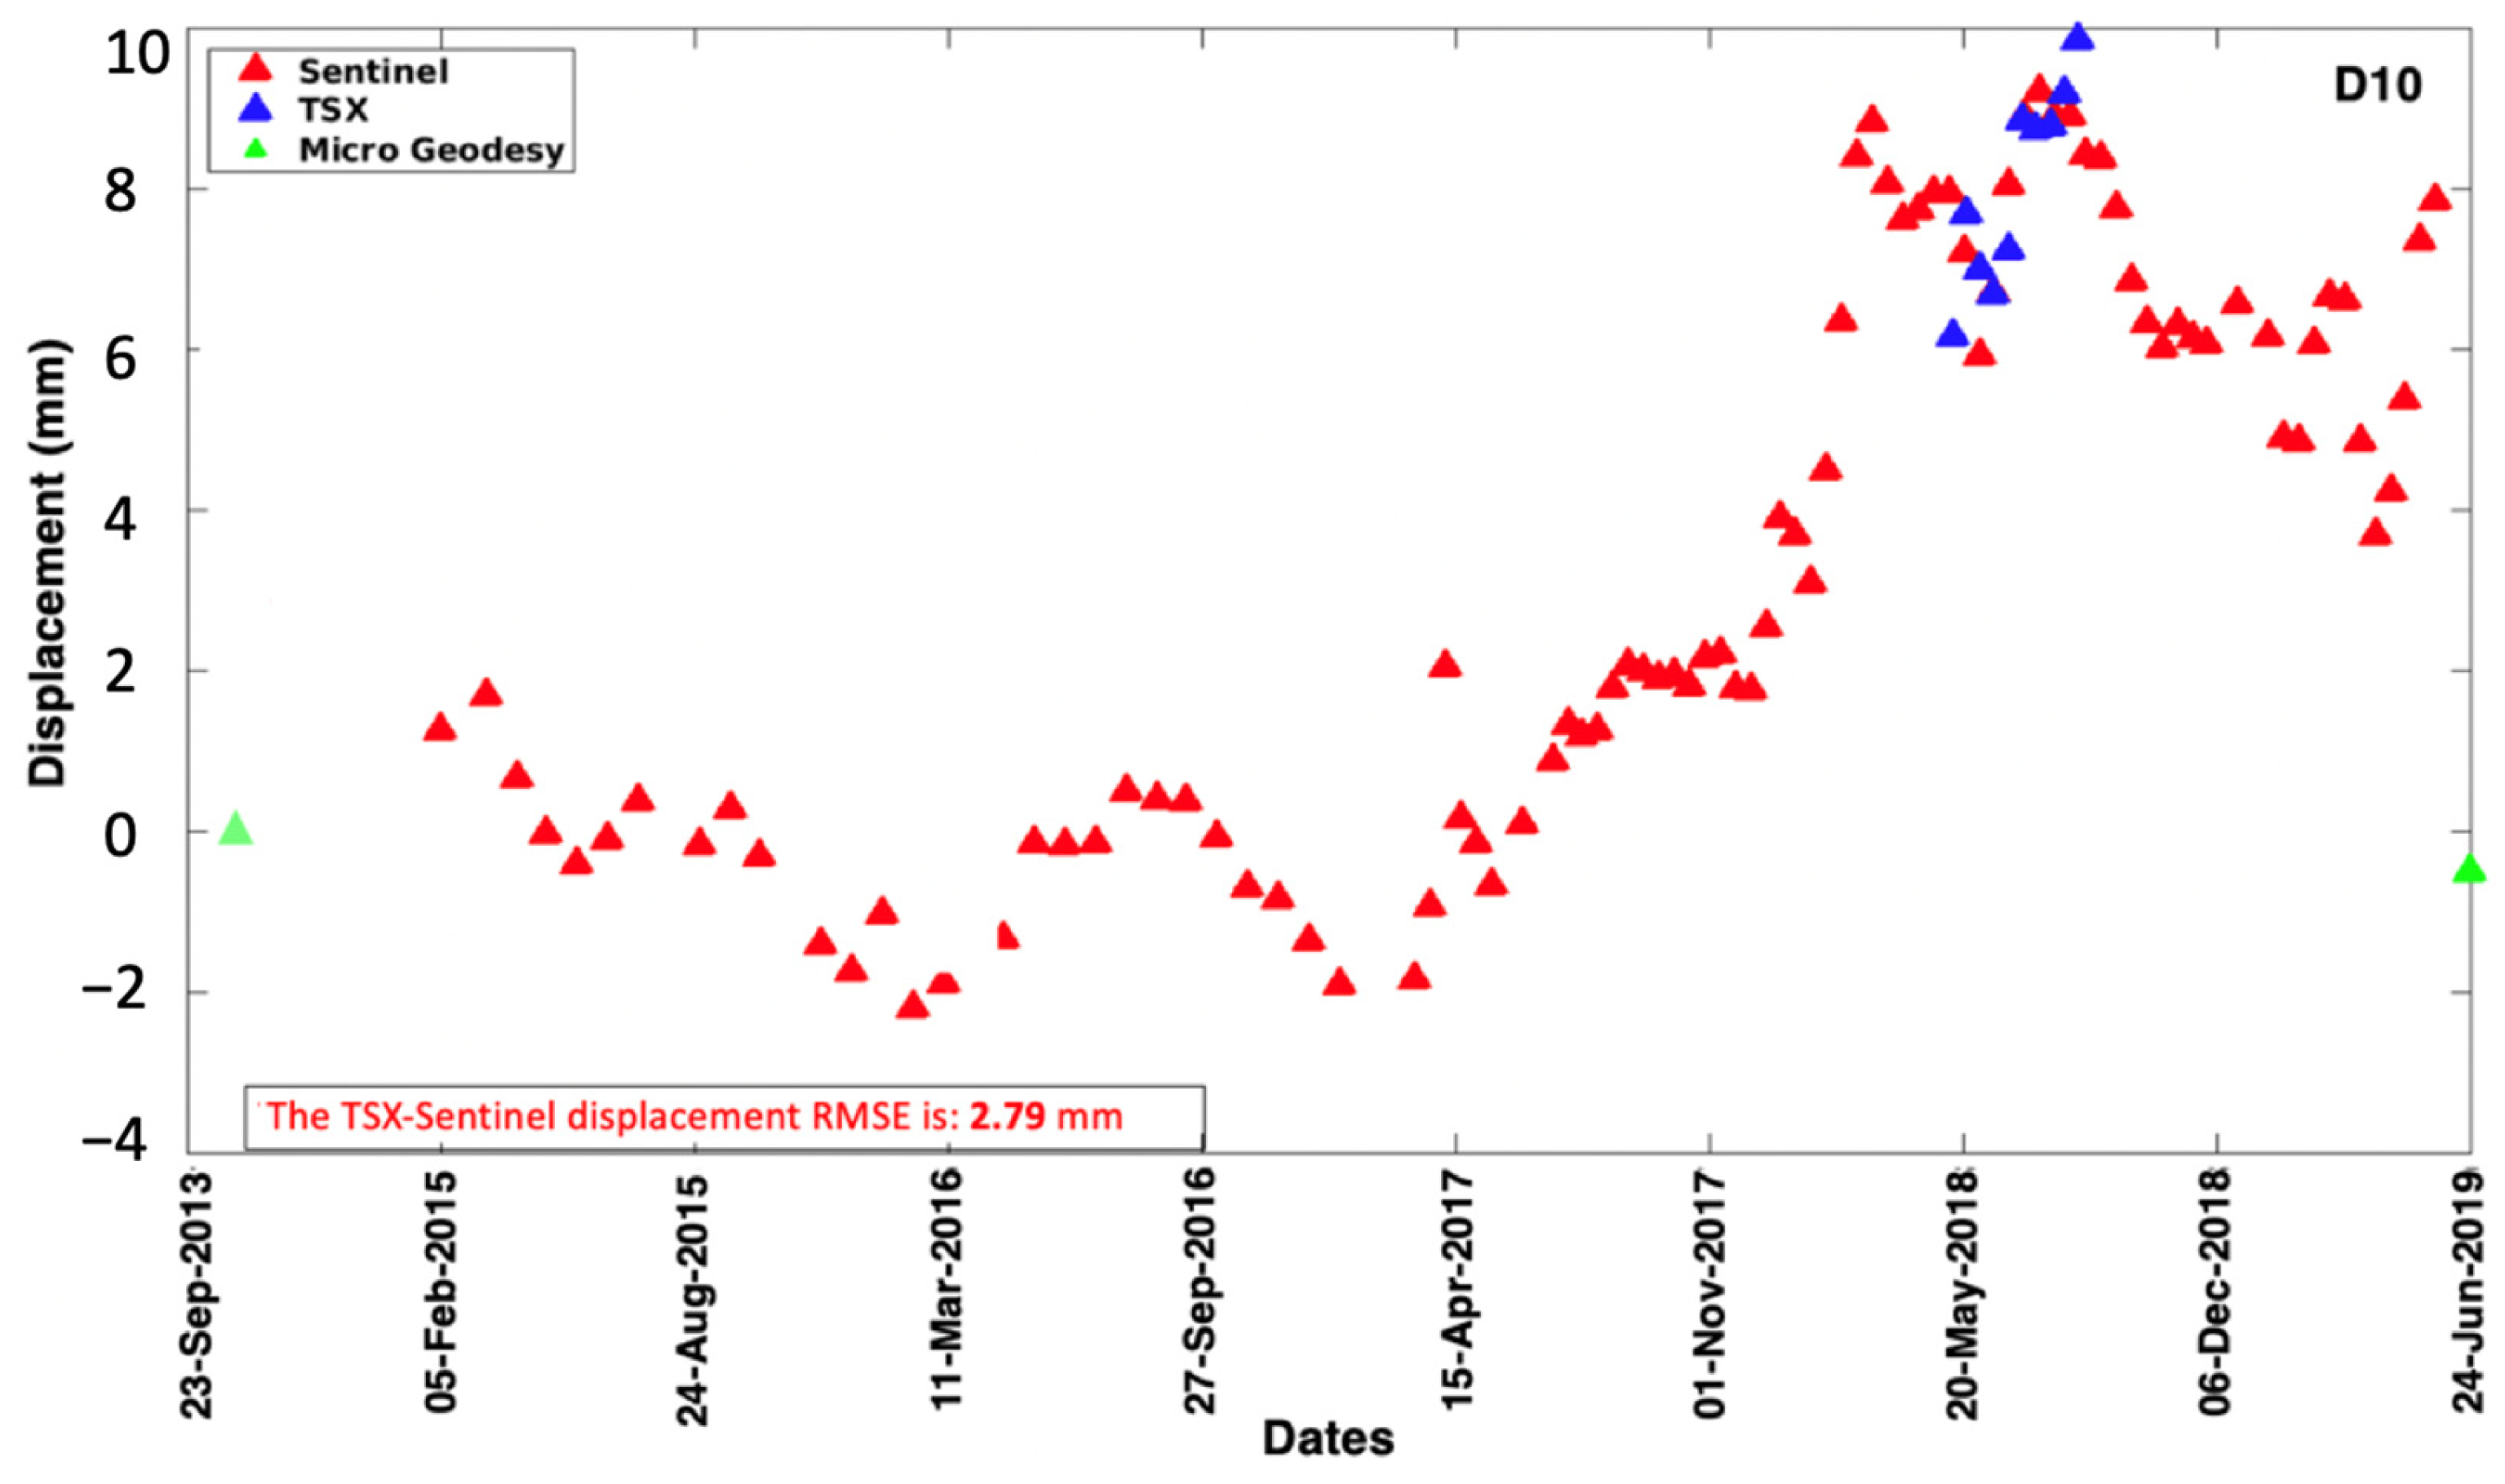
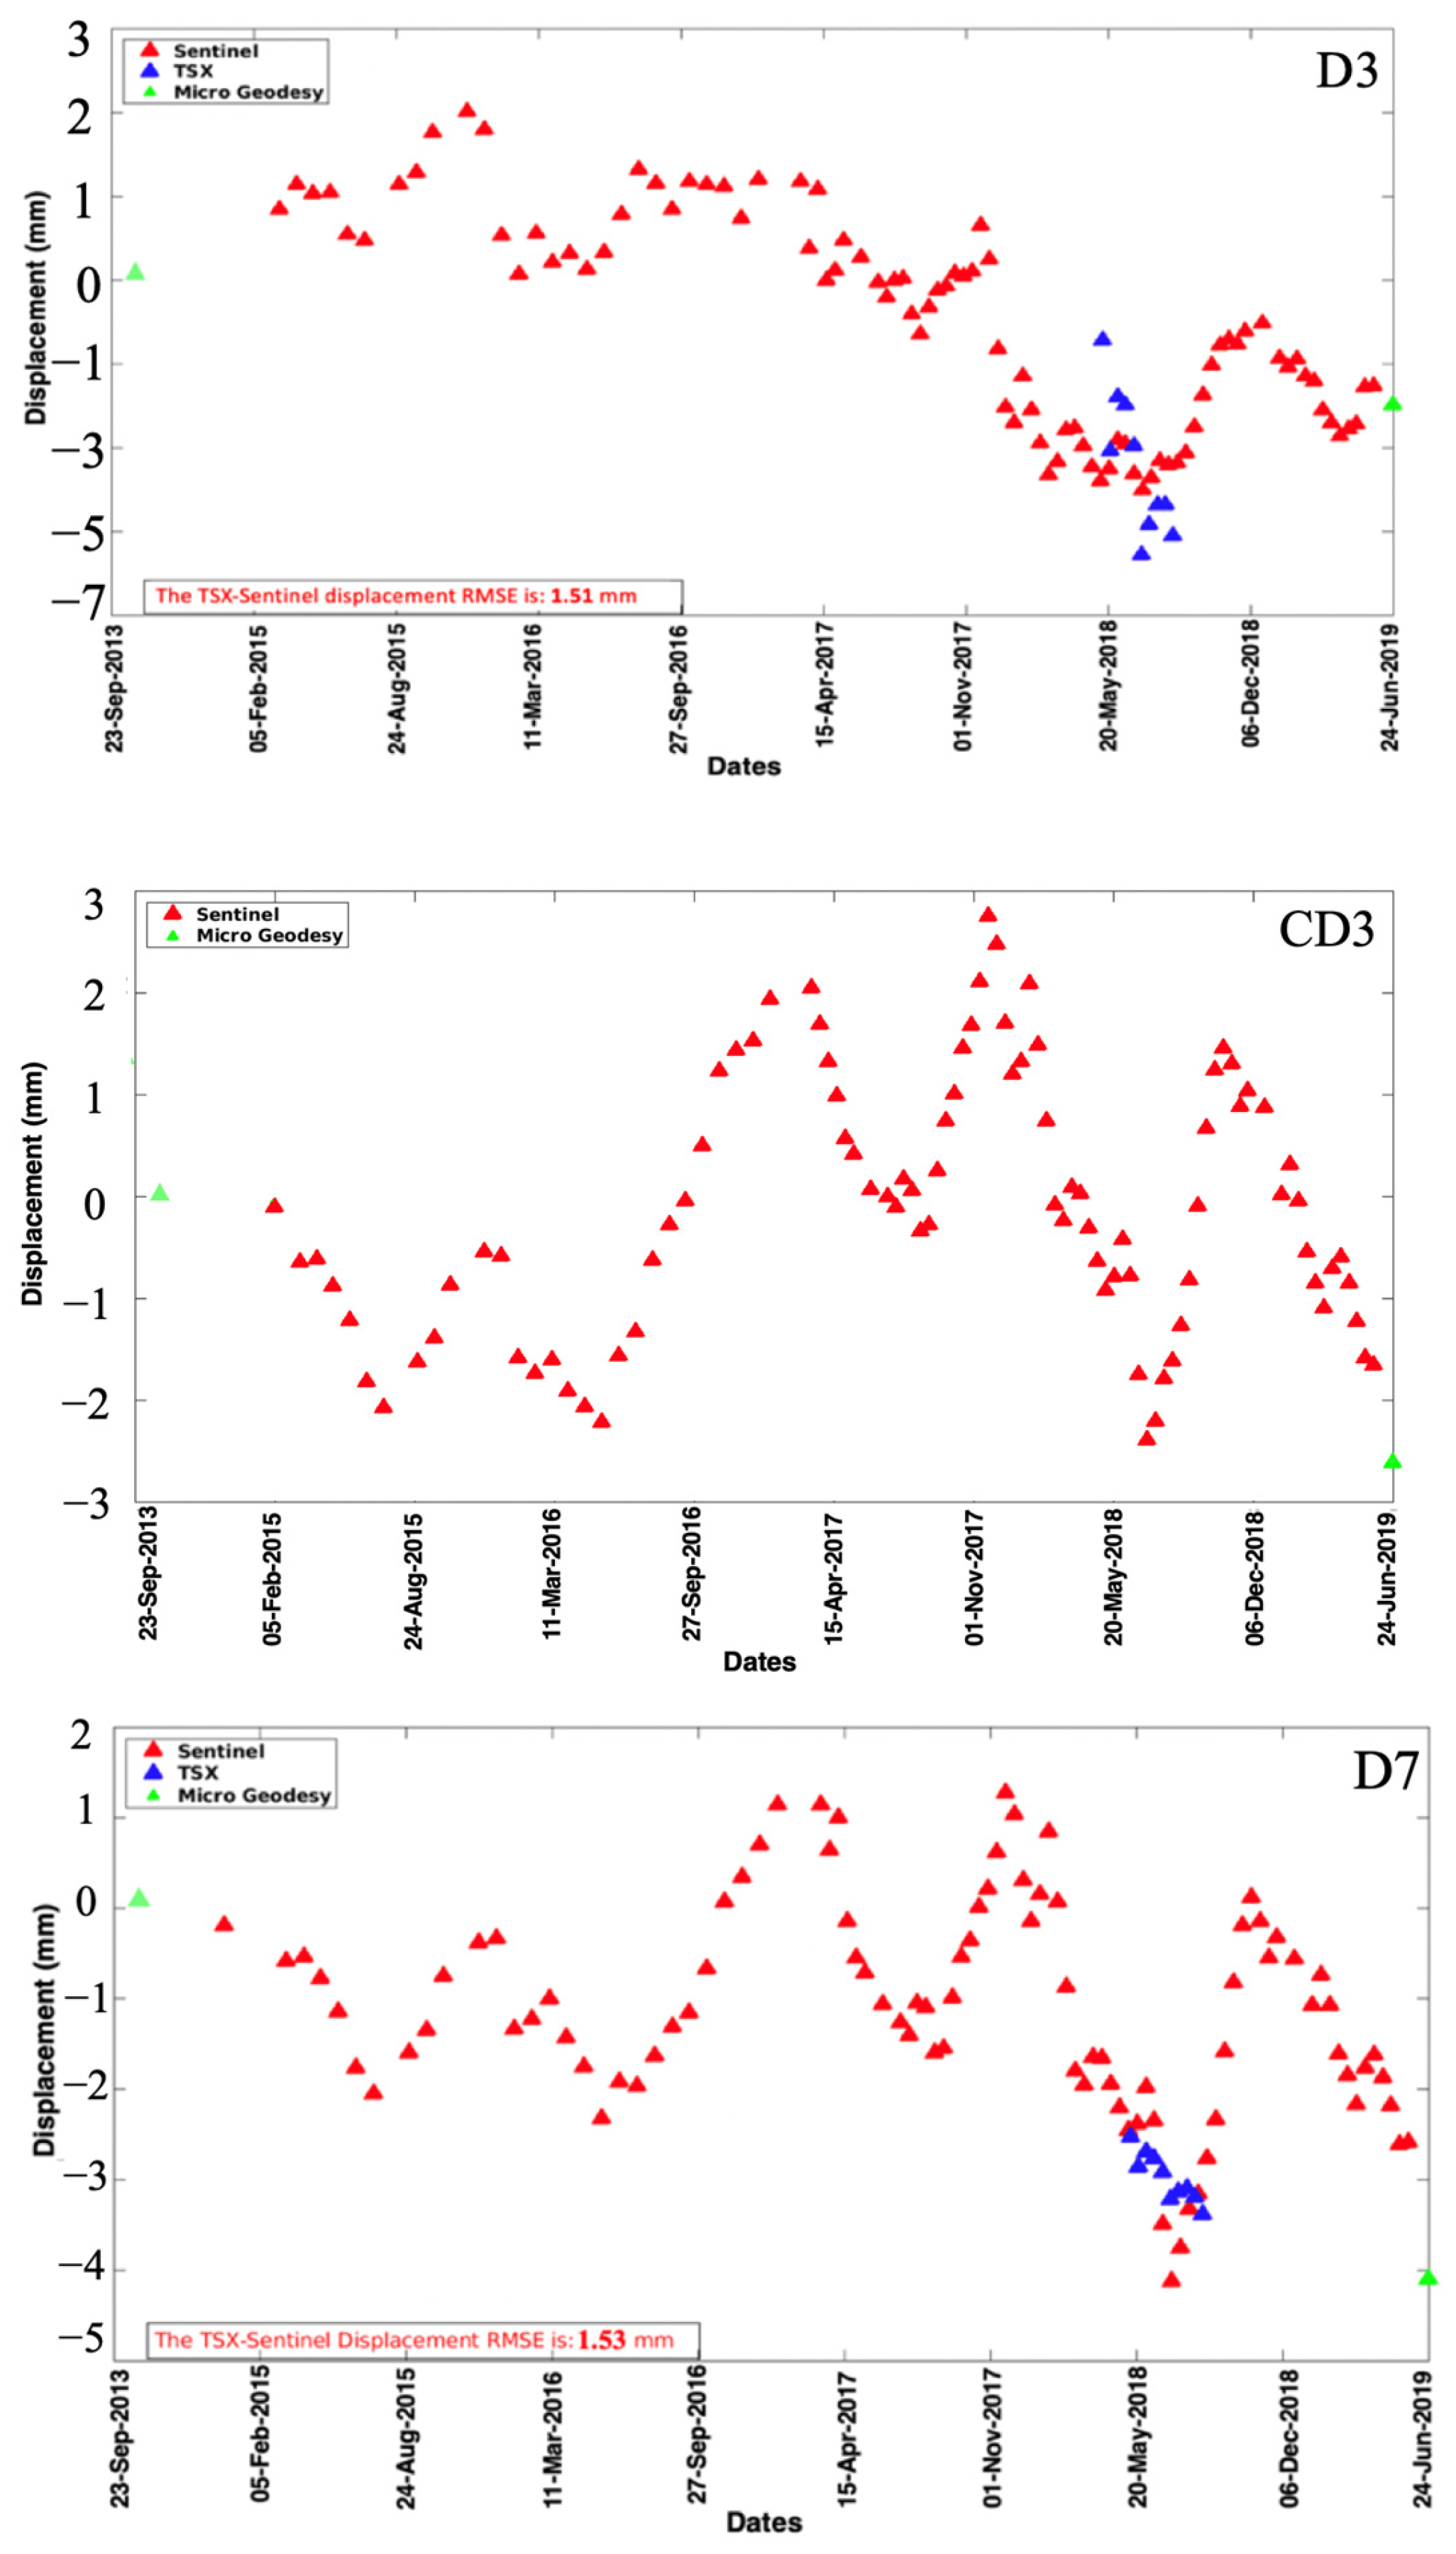
Figure 10 compares the vertical displacement (by dividing LOS displacement by cos ( θ ), where ( θ ) is the incidence angle) determined by terrestrial surveying and the TerraSAR-X and Sentinel-1 images for the three pillars on the crest. At D3, the TSX-Sentinel-1 displacement’s RMSE is 1.51, and at D7, the TSX-Sentinel-1A RMSE is 1.53 mm. It should be noted that, in the case of pillar CD3, only terrestrial surveying was compared to Sentinel-1 due to the absence of coherent TerraSAR-X pixels.
We did not attempt to reduce the seasonal effect for two reasons: Firstly, we wanted to compare the results to water-level seasonality, and secondly, as the TSX data coverage did not span a whole year, we could not reliably estimate a seasonal signal. Although the velocity is nonlinear for Sentinel-1, we used the mean velocity for simplicity of interpretation.
Investigation 2 was carried out at the downstream slope of the dam body. As much as ~ 15 mm in displacement was observed, and at CD4, on the upstream crest, ~ 15 mm was also observed, though in the opposite direction, between 2012 and 2019 (Table 3).
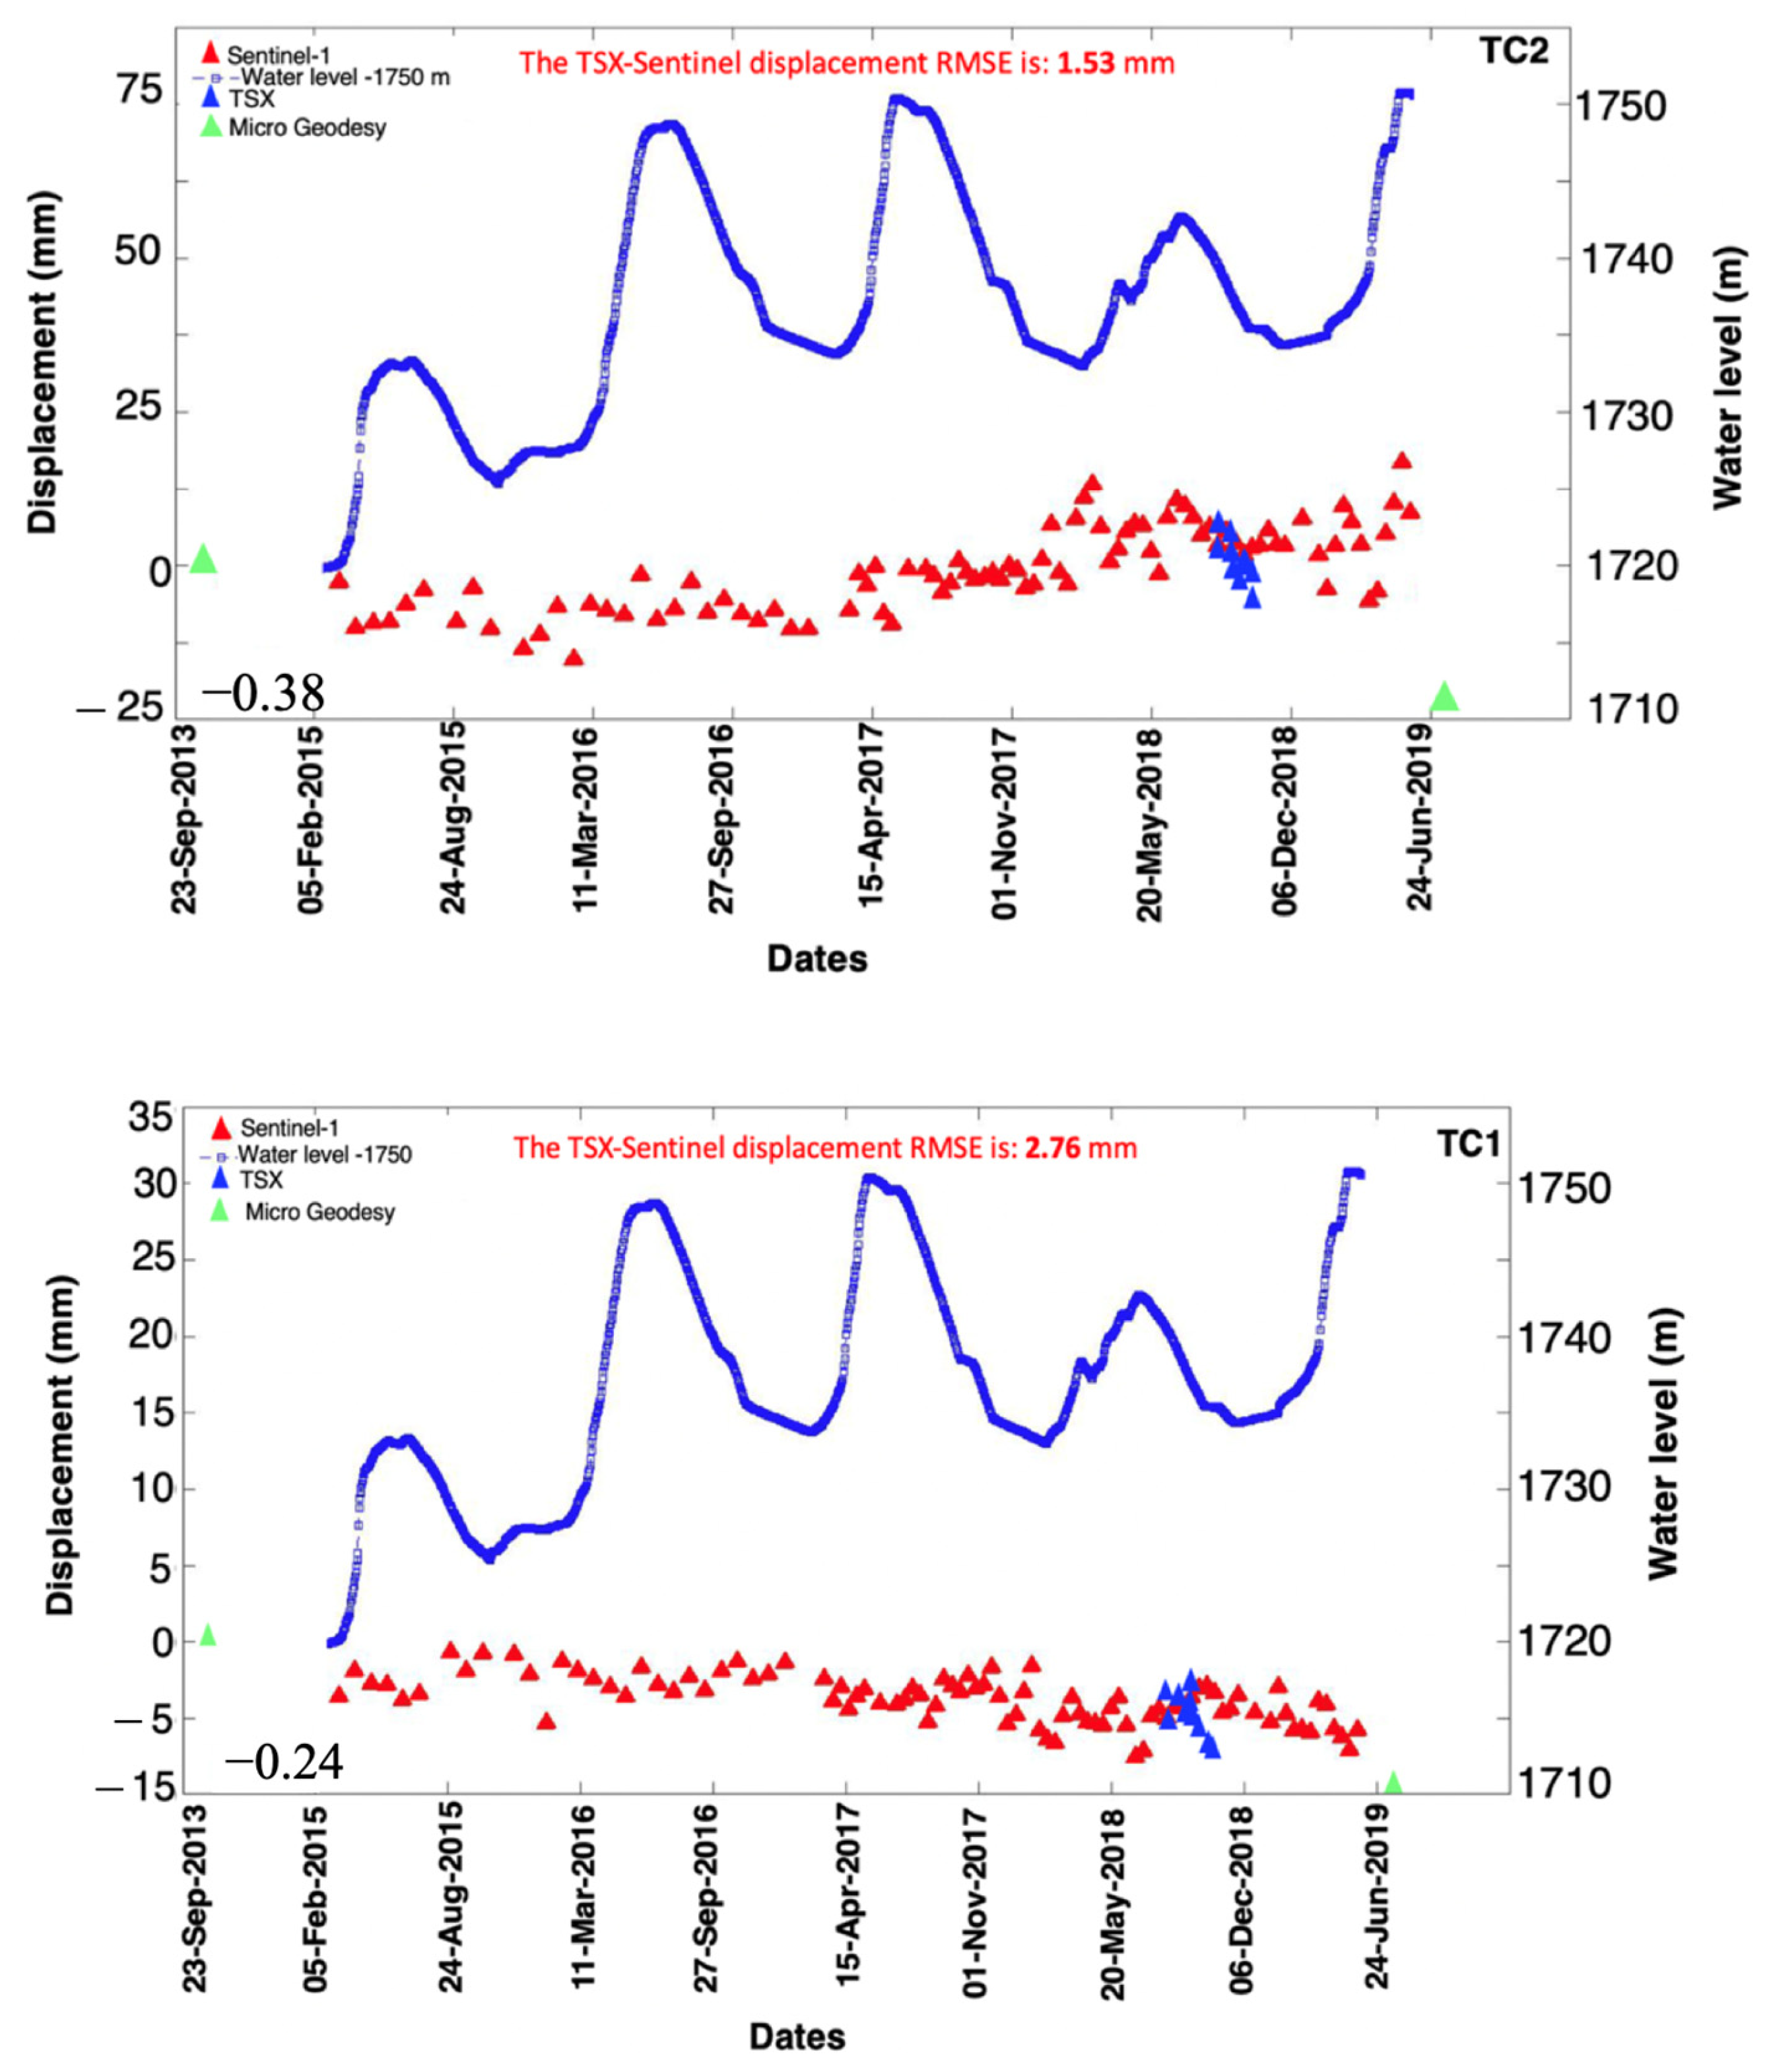
To assess the quality of InSAR data, we compared them to measurements from a geodetic network. We chose pillars TC1 and TC2 due to their high displacement values. Figure 11 illustrates the displacement derived from Sentinel-1 and TerraSAR-X in the vertical direction (red and blue triangles, respectively). The green triangles show the vertical displacement of the pillars measured between 2014 and 2019. The RMSE of the displacement between Sentinel-1 and TerraSAR-X (mean RMSE between TC1 and TC2) is less than 1.5 mm. There are a few millimeters of offset between the vertical field measurements and Sentinel-1A at sites TC1 and TC2. This indicates that the predominant deformation at these sites is horizontal, and indeed, x and y are large for these points (Table 3). To compare the InSAR deformation outputs with the survey measurements, we referenced the InSAR displacements to the first date of survey data.
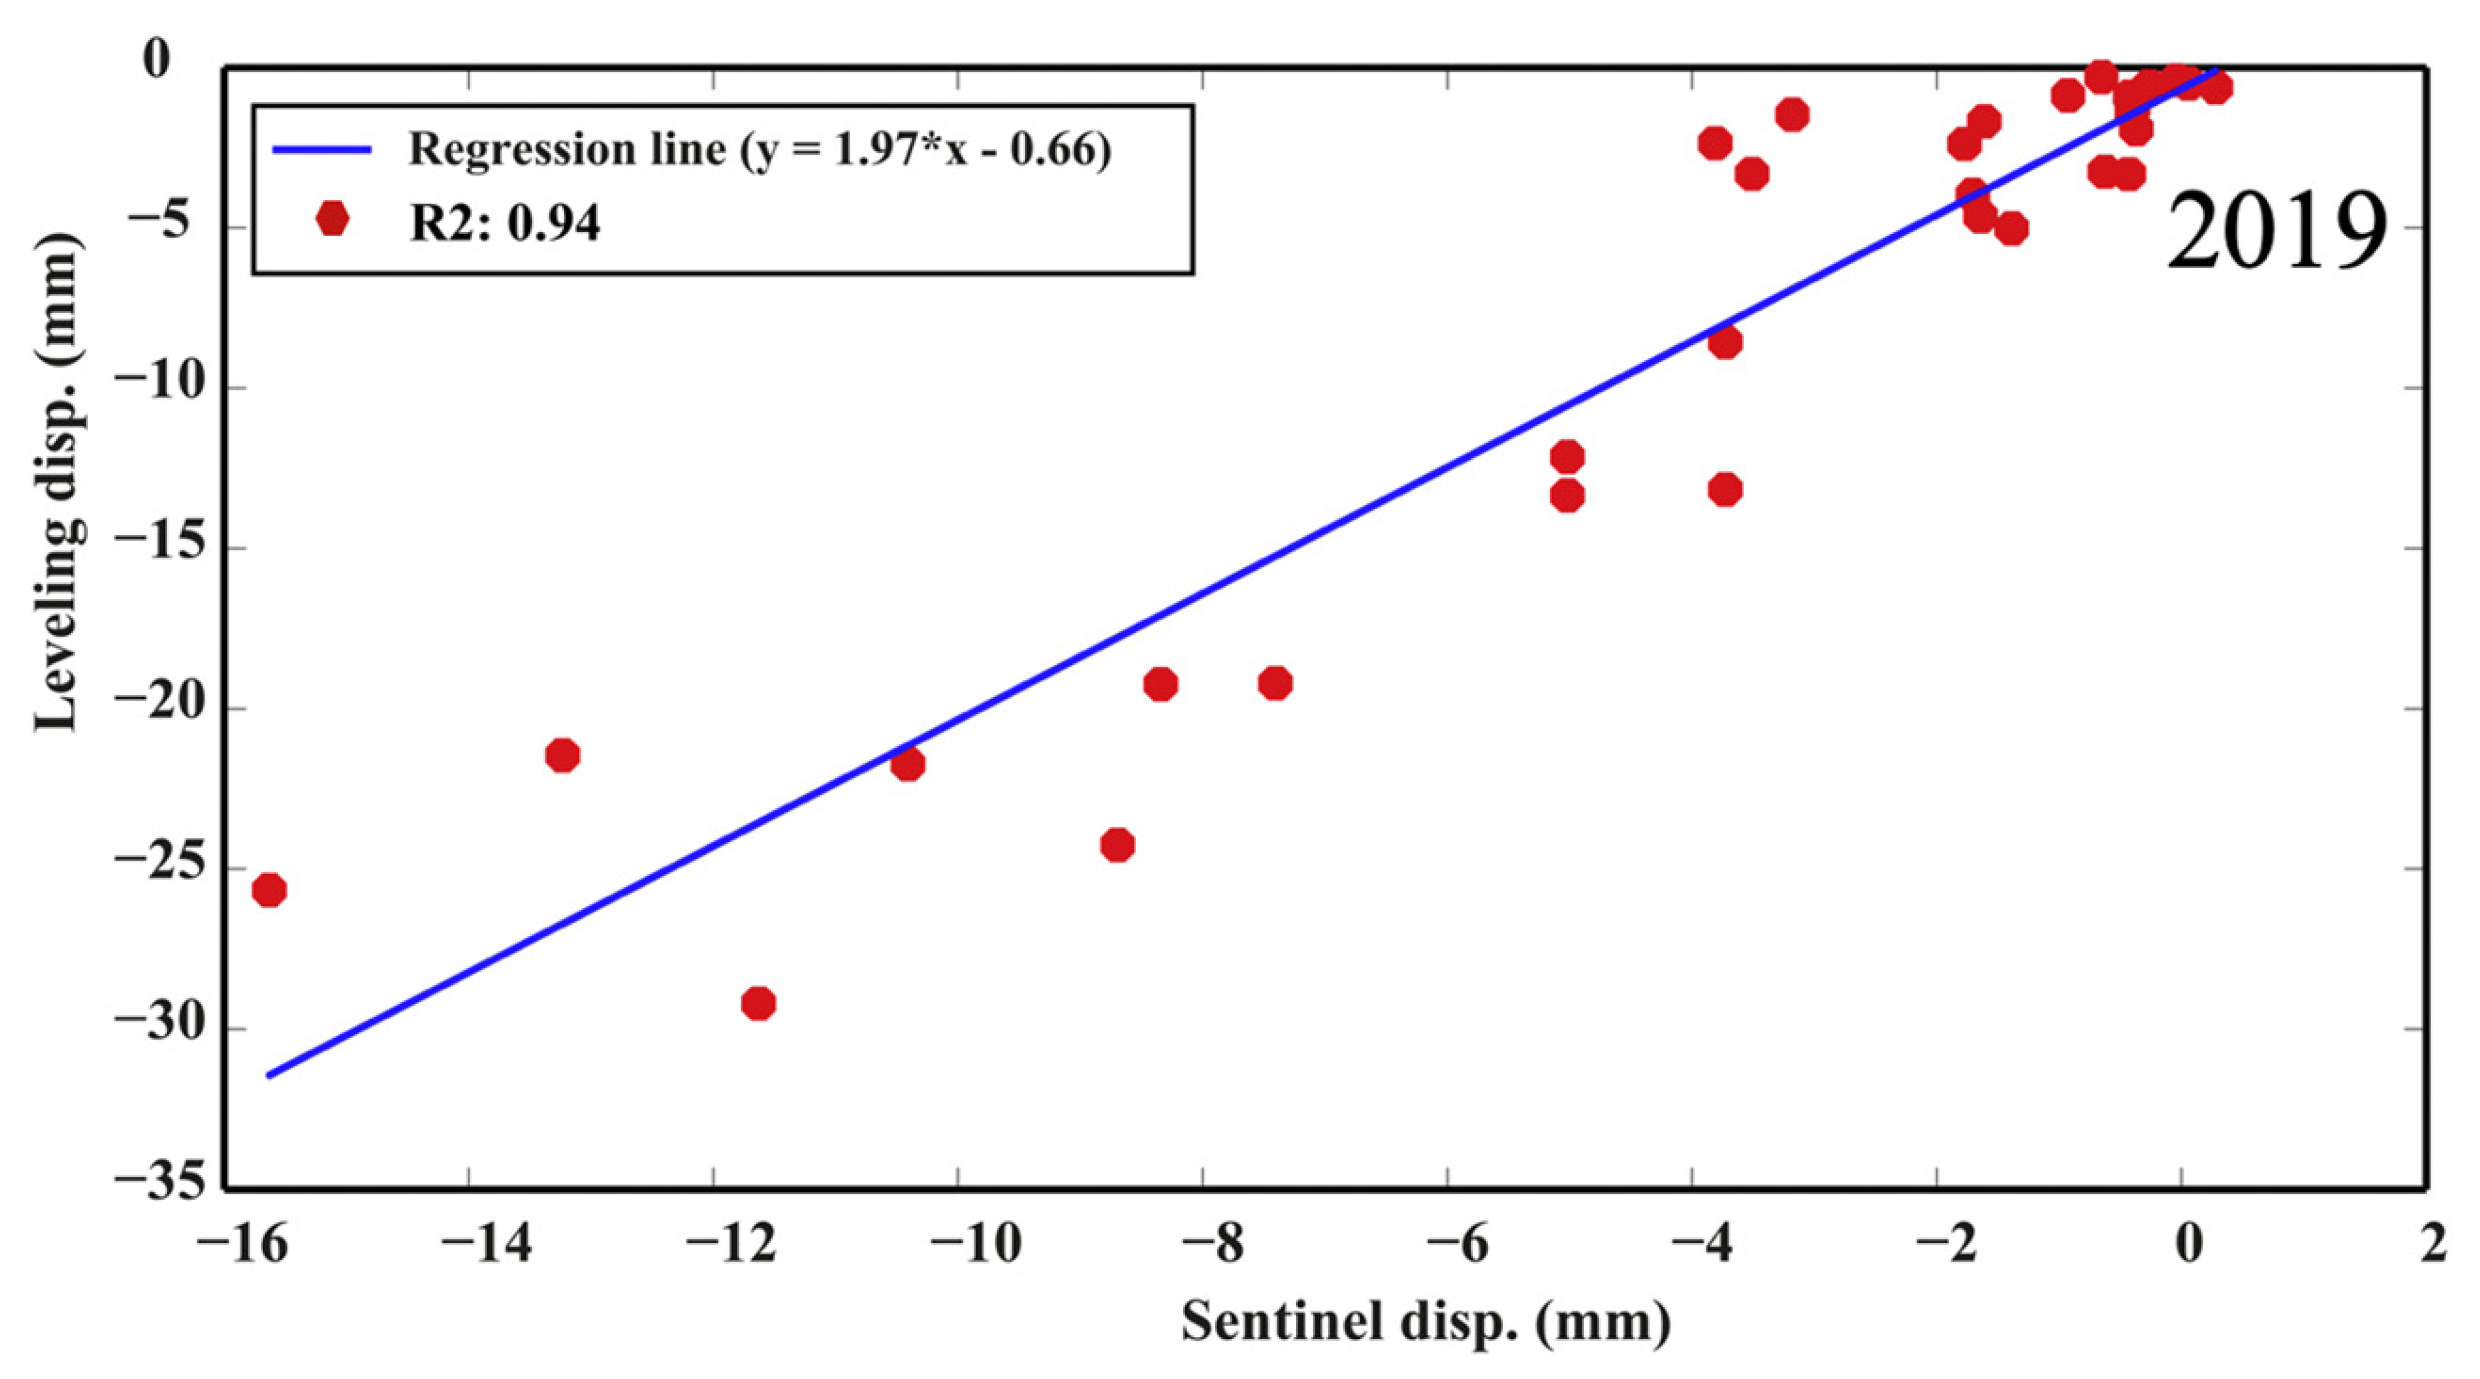
The distribution of deformation values between the leveling and Sentinel-1A results was linearly fitted, as shown in Figure 12, and showed a correlation coefficient of 0.94 in 2019.
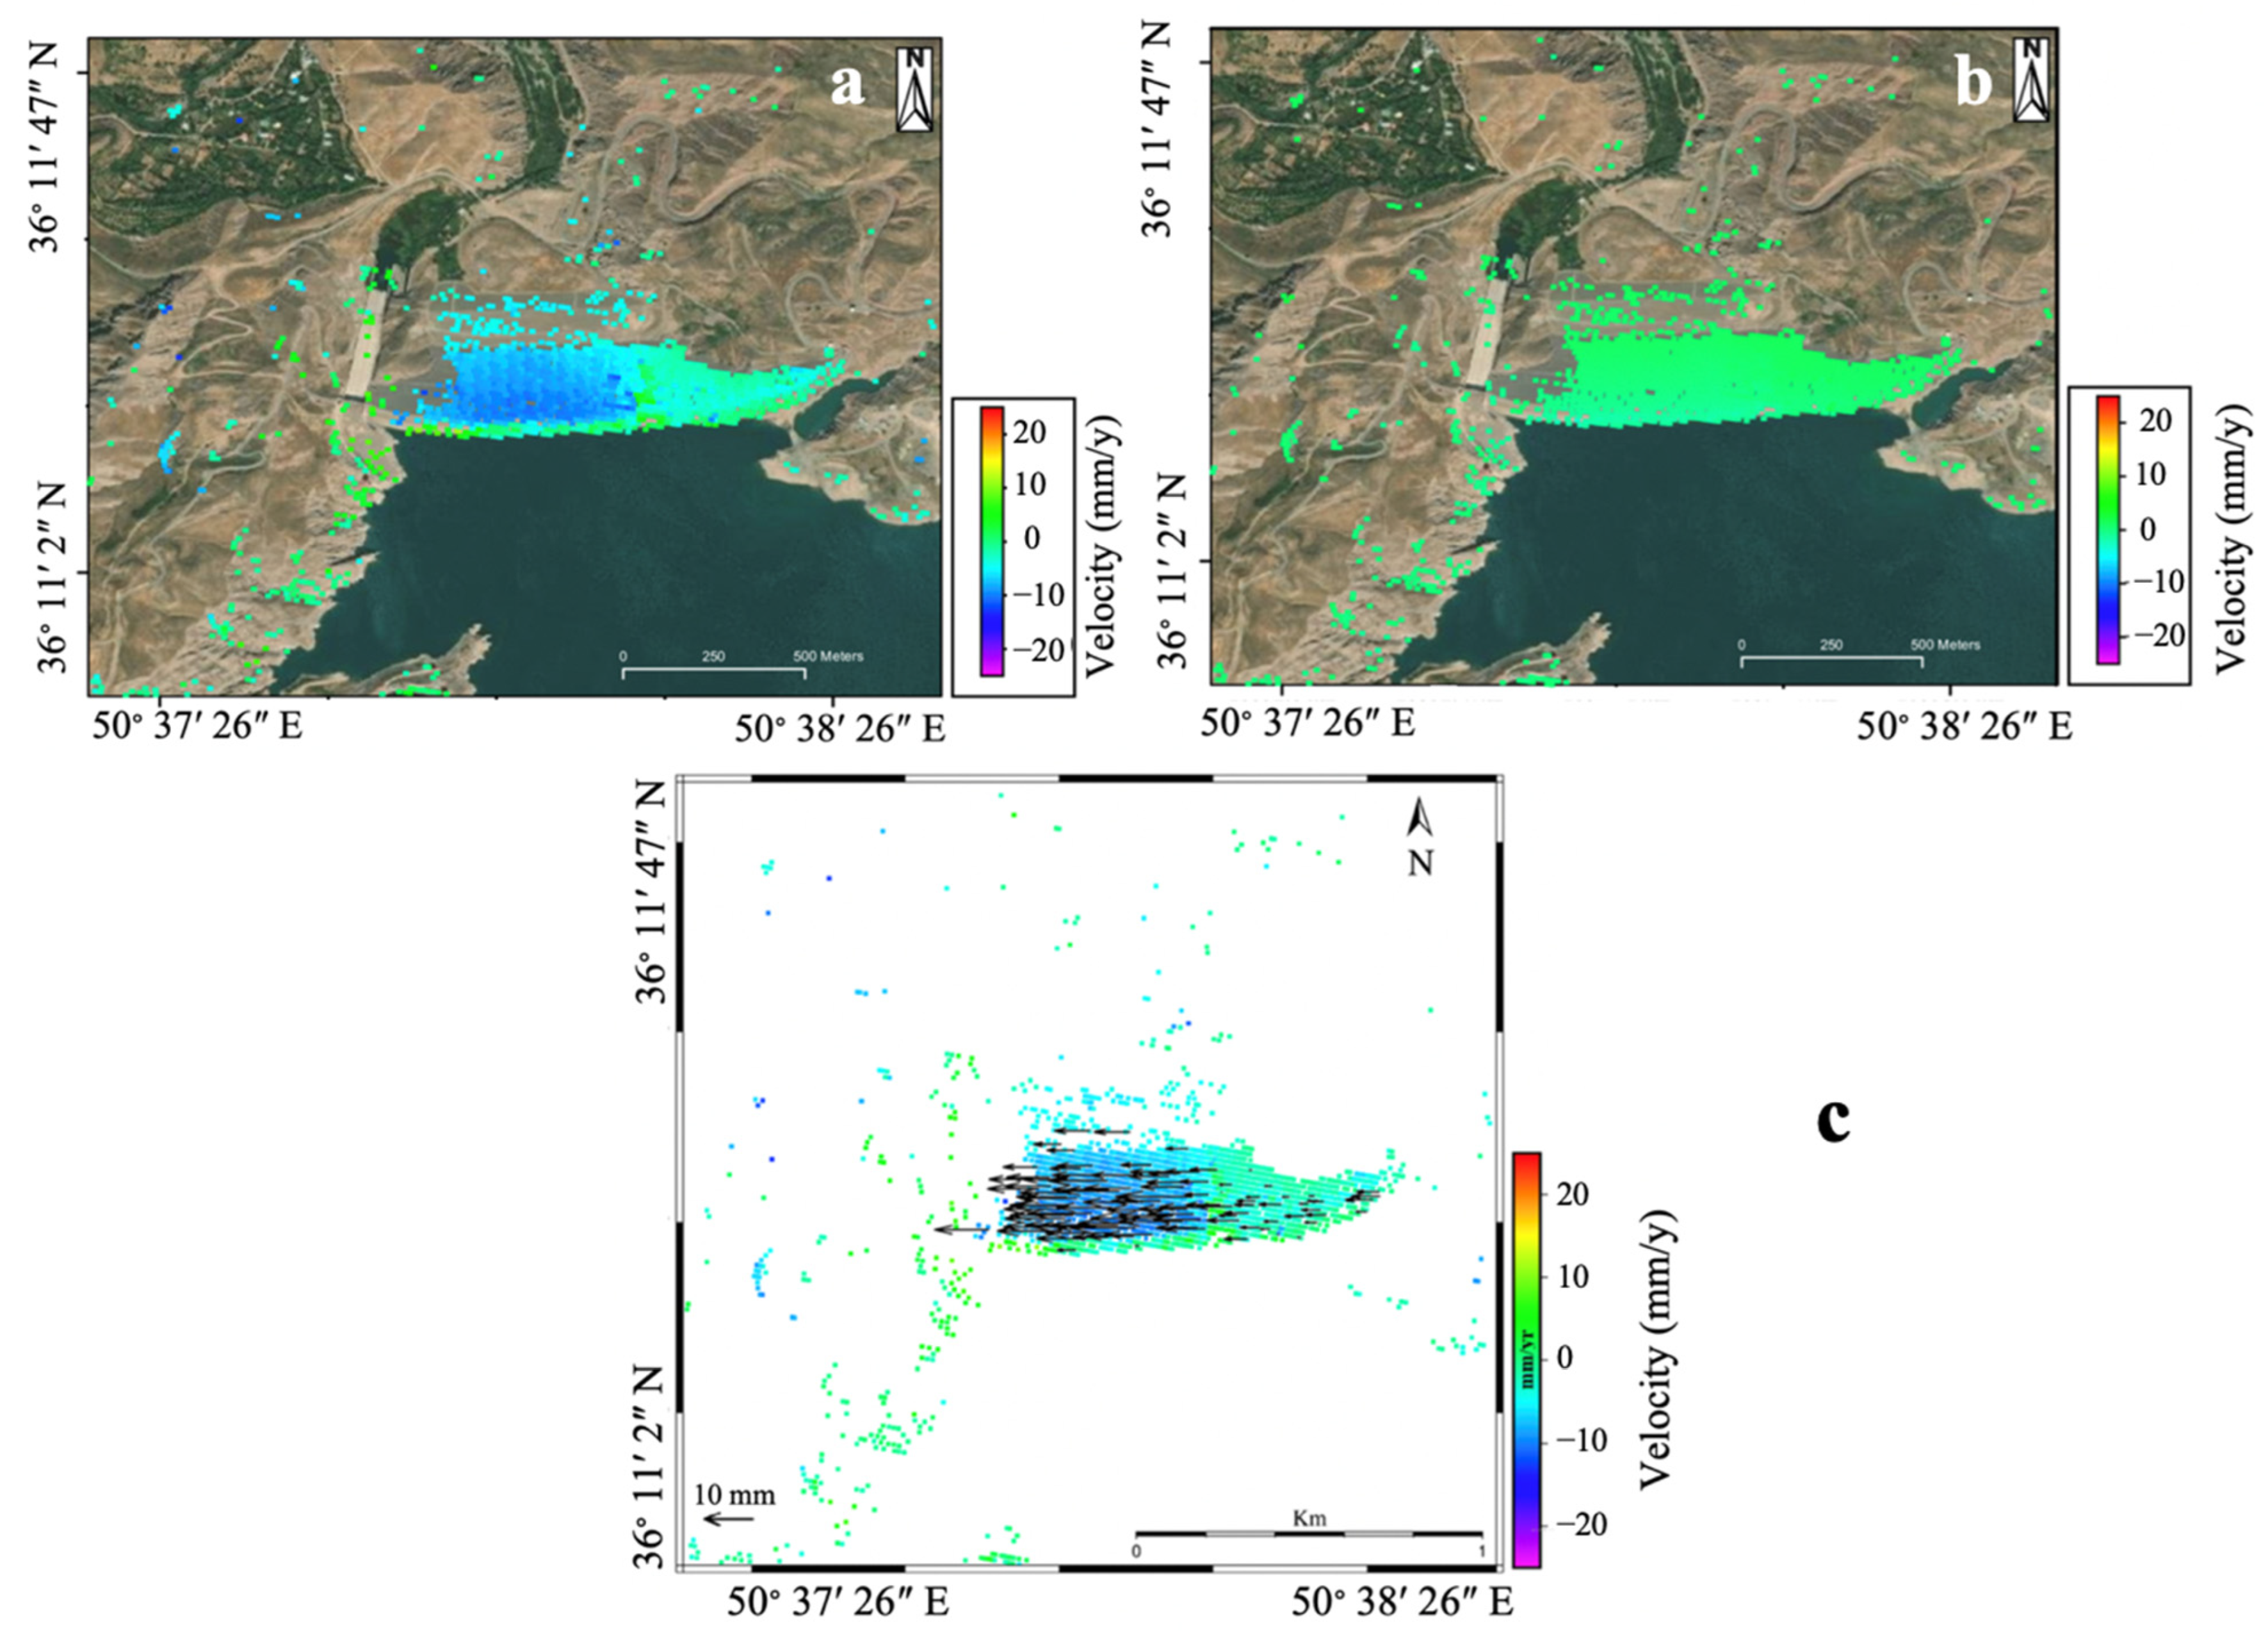
Figure 13 indicates the vertical and horizontal velocity of the dam. The horizontal velocity of the dam from the east to the west is around 10 mm/yr, and from the InSAR time series, this implies different patterns of settlement in the center and downstream area. We decomposed ascending and descending data using Equation (1), assuming that the north–south displacement is negligible. Given the inherently low sensitivity of Sentinel-1 and TerraSAR-X near-polar orbit geometries to north–south motions, combined with terrestrial geodetic measurements indicating north–south displacements of less than 1–2 mm yr−1—well within the 2–3 mm yr−1 uncertainty of the LOS time series—the north–south component is regarded as negligible for the purposes of this deformation analysis.
Due to the location of the Taleqan river, the dam is at its highest on the west side, and greater consolidation subsidence, therefore, takes place in that region. As a result, a westward displacement of the dam body by 10 mm/yr occurs at this zone.
As observed by the authors of [39,40], the horizontal displacement of a dam body can be influenced by water-level fluctuations. Therefore, the pattern of the horizontal displacements, as recorded by the terrestrial surveying network (Table 3) and TerraSAR-X processing, is consistent with the expected dam behavior (Figure 9). For this purpose, we chose pillars TC1 and TC2 due to their high displacement values. The Sentinel-1 time series shows that the dam’s body displacement follows a sinusoidal trend, in agreement with the terrestrial surveying network’s behavior. Actually, the linear correlation between TC1 and TC2 Sentinel-1A vertical displacements with respect to water levels is negative. The correlation values are −0.24 and −0.38, respectively. In general, there is no relationship between the displacement rates and water-level changes.

5. Discussion

It is critical to use several measurement approaches to carry out a comprehensive study of monitoring displacements on a dam. The MT-InSAR technique is useful for studying structures with slow and long-range movements, such as dams [11]. In this work, we evaluated the applicability of InSAR for monitoring dams. It was required to compare the displacements obtained by the InSAR technique and the terrestrial surveying network. Firstly, we compared the results from TSX and Sentinel-1. High-resolution TerraSAR-X data reveal that the dam has a maximum deformation rate of almost 20 mm in the LOS direction for the 3 months (80 mm in a year) between May and August 2018. The displacement time-series pattern is consistent with Sentinel-1 data for this time period (Figure 8), with the average RMSE for the difference between the two sensors at the 3 terrestrial surveying points being 1.52 (average of D3 and D7) mm. The mean velocity from Sentinel-1 images between 2014 and 2019 shows LOS velocities of up to 4 mm/yr. Therefore, it can be concluded that the deformation rates obtained by both image types (TSX and Sentinel-1) are in good agreement, implying the high reliability of our deformation results.
To further investigate the relationship between deformation behavior and reservoir conditions, we analyzed correlations between the detrended LOS displacement time series and the daily reservoir water-level record (2014–2019). Water-level data were preprocessed by removing ±2σ outliers and resampling with respect to the 12-day Sentinel-1 acquisition interval. Negative correlations were obtained for the downstream control points TC1 and TC2, indicating displacements away from the satellite during periods of rising reservoir levels. This pattern is consistent with the laterally directed downslope movement driven by increased hydrostatic loading, rather than the vertical settlement of the dam body. Field observations of extensive weathering and the loosening of the downstream riprap further support this interpretation.
In general, the TerraSAR-X SL images’ spatial resolution is up to 1 m, which can enhance deformation monitoring potential. X-band data has previously proven to be appropriate for the high-resolution deformation monitoring of small areas [41]. The density of pixels allows a better understanding and accurate description of deformation phenomena, providing more comprehensive deformation results [42,43,44]. On the other hand, low costs and free access to satellite images are advantages of Sentinel-1.
Additionally, InSAR has the ability to achieve precision similar to a terrestrial surveying network. Taken together, this research offers an approach to using multiplatform data for dam monitoring. Using a multiplatform SAR dataset, more precise deformation of the dam’s body can be detected. Because of the short lifespan of some commercial SAR datasets and conflicts between data orders, it might be challenging to rely on a single platform to cover the whole required period. On the other hand, the use of an operational satellite, such as Sentinel-1, can help us address the time gap in the continuous monitoring of ground stability.

6. Conclusions

The implementation of terrestrial surveying networks is challenging, time-consuming, and costly. Satellite radar interferometry (InSAR) is considered an economical alternative approach for the purpose of monitoring surface displacement. In this study, we demonstrated that the interpretation of InSAR results must be carried out carefully to prevent any misinterpretation of the superficial movement of covering materials [30] as dam settlement. We employed and analyzed Sentinel-1A and TerraSAR-X images obtained between 2014 and 2019. Sentinel-1, with a wavelength of 5.6 cm, has a 12-day repeat cycle, and the figure shows 12-day temporal subsets of data. Since the satellite system can capture images in a fixed time period and has been active since 2014, it enables the investigation of disasters, such as landslides, volcanic eruptions, and subsidence. The InSAR results imply that horizontal displacement has taken place on the Taleqan Dam’s downstream slope since at least 2014, which agrees with the displacements determined from both TerraSAR-X and Sentinel-1 data.
The high-resolution TerraSAR-X images provide precise displacement measurements, although the high cost of TerraSAR-X images meant that we could only order images for a short time period. Despite the lower resolution of Sentinel-1, the coverage was still good, and our results show that the maximum RMSE between Sentinel-1 and TerraSAR-X is only 2 mm from 2014 to 2019, even with different incidence angles. We compared our InSAR results to the results from terrestrial surveying. While the latter method is costly and has limited temporal and spatial sampling (at pillar points), the former is low-cost and can provide almost continuous processing with dense sampling.
However, our results indicate that the similarity in precision should be interpreted cautiously, as the agreement between InSAR and terrestrial surveying is sensor- and site-dependent and remains within uncertainties of approximately 1–3 mm yr−1.
While the results of terrestrial surveying only indicated normal dam behavior, the InSAR results show that the displacement of riprap materials is significant and ongoing. These displacements are limited to the downstream portion, but the area is increasing towards the dam crest. During our field surveys, drastic weathering and erosion of the downstream riprap materials were also observed.

Author Contributions

Conceptualization, M.G. and A.H.; methodology, M.G. and A.H.; software, M.G.; validation M.G. and A.H.; investigation, M.G., A.H. and D.W.; resources, M.G., A.H. and D.W.; data curation; M.G. and A.H.; writing—review and editing, M.G. and A.H. and D.W.; visualization, M.G., A.H. and D.W.; supervision, M.G. and A.H.; project administration, M.G.; funding acquisition, M.G. All authors have read and agreed to the published version of the manuscript.

Funding

This research was supported by a project (3-87-44) collaboratively carried out by the University of Tehran and the Regional Water Company of Tehran Province.

Institutional Review Board Statement

This study did not involve human or animal subjects.

Informed Consent Statement

This study did not involve human participants or animals. Therefore, ethical review and approval were not required.

Data Availability Statement

The datasets generated and analyzed during the current study are available from the corresponding author upon reasonable request.

Acknowledgments

Original TerraSAR-X original data, were kindly provided by the German Aerospace Agency (DLR) under proposal ghadimi_GEO. The Sentinel-1 datasets were freely provided by the European Space Agency (ESA) through the Sentinels Scientific Data Hub. COMET is the UK NERC Centre for the Observation and Modelling of Earthquakes, Volcanoes and Tectonics.

Conflicts of Interest

The authors declare no conflict of interest.

References

  1. Dascal, O. Postconstruction deformations of rockfill dams. J. Geotech. Eng. 1987, 113, 46–59. [Google Scholar] [CrossRef]
  2. Clements, R.P. Post-construction deformation of rockfill dams. J. Geotech. Eng. 1984, 110, 821–840. [Google Scholar] [CrossRef]
  3. Gikas, V.; Sakellariou, M. Settlement analysis of the Mornos earth dam (Greece): Evidence from numerical modeling and geodetic monitoring. Eng. Struct. 2008, 30, 3074–3081. [Google Scholar] [CrossRef]
  4. Kalkan, Y. Geodetic deformation monitoring of Ataturk Dam in Turkey. Arab. J. Geosci. 2014, 7, 397–405. [Google Scholar] [CrossRef]
  5. Marchamalo-Sacristán, M.; Ruiz-Armenteros, A.M.; Lamas-Fernández, F.; González-Rodrigo, B.; Martínez-Marín, R.; Delgado-Blasco, J.M.; Bakon, M.; Lazecky, M.; Perissin, D.; Papco, J.; et al. MT-InSAR and Dam Modeling for the Comprehensive Monitoring of an Earth-Fill Dam: The Case of the Benínar Dam (Almería, Spain). Remote Sens. 2023, 15, 2802. [Google Scholar] [CrossRef]
  6. Ruiz-Armenteros, A.M.; Lazecky, M.; Hlaváčová, I.; Bakoň, M.; Delgado, J.M.; Sousa, J.J.; Lamas-Fernández, F.; Marchamalo, M.; Caro-Cuenca, M.; Papco, J. Deformation monitoring of dam infrastructures via spaceborne MT-InSAR. The case of La Viñuela (Málaga, southern Spain). Procedia Comput. Sci. 2018, 138, 346–353. [Google Scholar] [CrossRef]
  7. Ghadimi, M.; Nezammahalleh. Ma, Construction of a causeway bridge across the lake Urmia and its influence on drying trend of the lake. Int. Arch. Photogramm. Remote Sens. Spat. Inf. Sci. 2015, 40, 211–213. [Google Scholar] [CrossRef]
  8. Ghadimi, M.; Kiani; M. Deformation Risk Assessment of the Lar Dam: Monitoring Its Stability Condition. Sustainability 2024, 16, 4335. [Google Scholar] [CrossRef]
  9. Jansen, R.B. Advanced Dam Engineering for Design, Construction, and Rehabilitation; Springer Science & Business Media: Berlin/Heidelberg, Germany, 1988; ISBN 0442243979. [Google Scholar]
  10. Guler, G.; Kilic, H.; Hosbas, G.; Ozaydin, K. Evaluation of the movements of the dam embankments by means of geodetic and geotechnical methods. J. Surv. Eng. 2006, 132, 31–39. [Google Scholar] [CrossRef]
  11. Vázquez-Ontiveros, J.R.; Ruiz-Armenteros, A.M.; de Lacy, M.C.; Gaxiola-Camacho, J.R.; Anaya-Díaz, M.; Vázquez-Becerra, G.E. Risk Evaluation of the Sanalona Earthfill Dam Located in Mexico Using Satellite Geodesy Monitoring and Numerical Modeling. Remote Sens. 2023, 15, 819. [Google Scholar] [CrossRef]
  12. Stewart, M.; Tsakiri, M. The status of the global positioning system for dam surface monitoring. Proc. Inst. Civ. Eng. Eng. 2001, 149, 249–252. [Google Scholar] [CrossRef]
  13. Massonnet, D.; Rossi, M.; Carmona, C.; Adragna, F.; Peltzer, G.; Feigl, K.; Rabaute, T. The displacement field of the Landers earthquake mapped by radar interferometry. Nature 1993, 364, 138–142. [Google Scholar] [CrossRef]
  14. Stramondo, S.; Trasatti, E.; Albano, M.; Moro, M.; Chini, M.; Bignami, C.; Polcari, M.; Saroli, M. Uncovering deformation processes from surface displacements. J. Geodyn. 2016, 102, 58–82. [Google Scholar] [CrossRef]
  15. Polcari, M.; Montuori, A.; Bignami, C.; Moro, M.; Stramondo, S.; Tolomei, C. Using multi-band InSAR data for detecting local deformation phenomena induced by the 2016–2017 Central Italy seismic sequence. Remote Sens. Environ. 2017, 201, 234–242. [Google Scholar] [CrossRef]
  16. Zhang, S.; Chen, B.; Gong, H.; Lei, K.; Shi, M.; Zhou, C. Three-Dimensional Surface Displacement of the Eastern Beijing Plain, China, Using Ascending and Descending Sentinel-1A/B Images and Leveling Data. Remote Sens. 2021, 13, 2809. [Google Scholar] [CrossRef]
  17. Ferretti, A.; Prati, C.; Rocca, F. Permanent scatterers in SAR interferometry. IEEE Trans. Geosci. Remote Sens. 2001, 39, 8–20. [Google Scholar] [CrossRef]
  18. Hooper, A.; Zebker, H.A. Phase unwrapping in three dimensions with application to InSAR time series. J. Opt. Soc. Am. A 2007, 24, 2737–2747. [Google Scholar] [CrossRef]
  19. Berardino, P.; Fornaro, G.; Lanari, R.; Sansosti, E. A new algorithm for surface deformation monitoring based on small baseline differential SAR interferograms. IEEE Trans. Geosci. Remote Sens. 2002, 40, 2375–2383. [Google Scholar] [CrossRef]
  20. Hooper, A. A multi-temporal InSAR method incorporating both persistent scatterer and small baseline approaches. Geophys. Res. Lett. 2008, 35, L16302. [Google Scholar] [CrossRef]
  21. Casu, F.; Manzo, M.; Lanari, R. A quantitative assessment of the SBAS algorithm performance for surface deformation retrieval from DInSAR data. Remote Sens. Environ. 2006, 102, 195–210. [Google Scholar] [CrossRef]
  22. Tomás, R.; Cano, M.; Garcia-Barba, J.; Vicente, F.; Herrera, G.; Lopez-Sanchez, J.M.; Mallorquí, J.J. Monitoring an earthfill dam using differential SAR interferometry: La Pedrera dam, Alicante, Spain. Eng. Geol. 2013, 157, 21–32. [Google Scholar] [CrossRef]
  23. Zhou, W.; Li, S.; Zhou, Z.; Chang, X. Insar observation and numerical modeling of the earth-dam displacement of shuibuya dam (China). Remote Sens. 2016, 8, 877. [Google Scholar] [CrossRef]
  24. Milillo, P.; Perissin, D.; Salzer, J.T.; Lundgren, P.; Lacava, G.; Milillo, G.; Serio, C. Monitoring dam structural health from space: Insights from novel InSAR techniques and multi-parametric modeling applied to the Pertusillo dam Basilicata, Italy. Int. J. Appl. Earth Obs. Geoinf. 2016, 52, 221–229. [Google Scholar] [CrossRef]
  25. Di Martire, D.; Iglesias, R.; Monells, D.; Centolanza, G.; Sica, S.; Ramondini, M.; Pagano, L.; Mallorquí, J.J.; Calcaterra, D. Comparison between differential SAR interferometry and ground measurements data in the displacement monitoring of the earth-dam of Conza della Campania (Italy). Remote Sens. Environ. 2014, 148, 58–69. [Google Scholar] [CrossRef]
  26. Al-Husseinawi, Y.; Li, Z.; Clarke, P.; Edwards, S. Evaluation of the stability of the Darbandikhan Dam after the 12 November 2017 Mw 7.3 Sarpol-e Zahab (Iran–Iraq border) earthquake. Remote Sens. 2018, 10, 1426. [Google Scholar] [CrossRef]
  27. Neokosmidis, S.; Elias, P.; Parcharidis, I.; Briole, P. Deformation estimation of an earth dam and its relation with local earthquakes, by exploiting multitemporal synthetic aperture radar interferometry: Mornos dam case (Central Greece). J. Appl. Remote Sens. 2016, 10, 26010. [Google Scholar] [CrossRef]
  28. Honda, K.; Nakanishi, T.; Haraguchi, M.; Mushiake, N.; Iwasaki, T.; Satoh, H.; Kobori, T.; Yamaguchi, Y. Application of exterior deformation monitoring of dams by DInSAR analysis using ALOS PALSAR. In Proceedings of the 2012 IEEE International Geoscience and Remote Sensing Symposium, Munich, Germany, 22–27 July 2012; pp. 6649–6652. [Google Scholar]
  29. Regional Water Company of Iran, Behaviour Report of the Taleqan Dam; Regional Water Company of Iran location: Sanandaj, Iran, 2016.
  30. Ghadimi, M. Investigation of riprap stability of a dam: Risk assessment by InSAR method and rock mechanical test. Geomat. Nat. Hazards Risk 2022, 13, 1441–1456. [Google Scholar] [CrossRef]
  31. SARscape Technical Description. 2012. Available online: http://www.sarmap.ch/pdf/SARscapeTechnical.pdf (accessed on 5 July 2020).
  32. Hanssen, R.F. Radar Interferometry: Data Interpretation and Error Analysis; Springer Science & Business Media: Berlin/Heidelberg, Germany, 2001; Volume 2, ISBN 0792369459. [Google Scholar]
  33. Schmidt, D.A.; Bürgmann, R. Time-dependent land uplift and subsidence in the Santa Clara valley, California, from a large interferometric synthetic aperture radar data set. J. Geophys. Res. Solid Earth 2003, 108, 2416. [Google Scholar] [CrossRef]
  34. Shanker, P.; Zebker, H. Persistent scatterer selection using maximum likelihood estimation. Geophys. Res. Lett. 2007, 34, L22301. [Google Scholar] [CrossRef]
  35. Hooper, A. A statistical-cost approach to unwrapping the phase of InSAR time series. In Proceedings of the International Workshop on ERS SAR Interferometry, Frascati, Italy, 25–29 January 2010; Volume 30. [Google Scholar]
  36. Sandwell, D.; Mellors, R.; Tong, X.; Wei, M.; Wessel, P. Open radar interferometry software for mapping surface deformation. Eos 2011, 92, 234. [Google Scholar] [CrossRef]
  37. Wessel, P.; Smith, W.H.F.; Scharroo, R.; Luis, J.; Wobbe, F. Generic mapping tools: Improved version released. Eos. Trans. Am. Geophys. Union 2013, 94, 409–410. [Google Scholar] [CrossRef]
  38. Prats-Iraola, P.; Scheiber, R.; Marotti, L.; Wollstadt, S.; Reigber, A. TOPS interferometry with TerraSAR-X. IEEE Trans. Geosci. Remote Sens. 2012, 50, 3179–3188. [Google Scholar] [CrossRef]
  39. Konakoglu, B.; Cakir, L.; Yilmaz, V. Monitoring the deformation of a concrete dam: A case study on the Deriner Dam, Artvin, Turkey. Geomat. Nat. Hazards Risk 2020, 11, 160–177. [Google Scholar] [CrossRef]
  40. Bayrak, T. Verifying pressure of water on dams, a case study. Sensors 2008, 8, 5376–5385. [Google Scholar] [CrossRef] [PubMed]
  41. Gao, M.; Gong, H.; Li, X.; Chen, B.; Zhou, C.; Shi, M.; Guo, L.; Chen, Z.; Ni, Z.; Duan, G. Land subsidence and ground fissures in Beijing capital international airport (bcia): Evidence from quasi-ps insar analysis. Remote Sens. 2019, 11, 1466. [Google Scholar] [CrossRef]
  42. Fornaro, G.; Pauciullo, A.; Reale, D.; Verde, S. Multilook SAR tomography for 3-D reconstruction and monitoring of single structures applied to COSMO-SKYMED data. IEEE J. Sel. Top. Appl. Earth Obs. Remote Sens. 2014, 7, 2776–2785. [Google Scholar] [CrossRef]
  43. Wu, S.; Yang, Z.; Ding, X.; Zhang, B.; Zhang, L.; Lu, Z. Two decades of settlement of Hong Kong International Airport measured with multi-temporal InSAR. Remote Sens. Environ. 2020, 248, 111976. [Google Scholar] [CrossRef]
  44. Wang, Y.; Bai, Z.; Zhang, Y.; Qin, Y.; Lin, Y.; Li, Y.; Shen, W. Using TerraSAR X-band and sentinel-1 C-band SAR interferometry for deformation along Beijing-Tianjin intercity railway analysis. IEEE J. Sel. Top. Appl. Earth Obs. Remote Sens. 2021, 14, 4832–4841. [Google Scholar] [CrossRef]
Figure 1. (a) The Taleqan Dam’s location. (b) The yellow rectangles correspond to the frames covered by the ascending and descending TerraSAR-X data, and the red rectangles mark the ascending Sentinel-1 coverage, with the whole frame shown in panel (a) and the cropped section shown in (b). The blue box shows the location of the Taleqan Dam. (c) The geological map of the Taleqan Dam.
Sustainability 18 00173 g001
Figure 2. Field photographs. (a) The granulation of the riprap layer on the downstream part of the dam was deformed, and it is outlined by the red parallelogram. (b) Uplift of stairs on the downstream side of the dam, as a part of the stairs shown in (a).
Sustainability 18 00173 g002
Figure 3. The flowchart of data processing.
Sustainability 18 00173 g003
Figure 4. The baseline network for the TerraSAR-X small baseline time-series analysis. (a) Ascending; (b) descending (x axis represents the temporal baseline; y axis represents the perpendicular baseline).
Sustainability 18 00173 g004
Figure 5. Location of the geodetic points and horizontal displacement collected in March 2012, December 2013, and May 2019. The red triangles and circles (green, blue, and dark blue) depict the fixed and target points, respectively. D, CD, CU, and TC are all target points as well. The red star represents the settlements aligned on the dam’s upstream side. Horizontal profiles are AA′, BB′, CC′, and DD′, while vertical profiles are NN′, MM′, and II′.
Sustainability 18 00173 g005
Figure 6. (a) Mean LOS velocity from TerraSAR-X from May 2018 to Aug 2018 in ascending orbit. The black diamond marks the reference point. (b) The mean linear velocity of TerraSAR-X from May 2018 to August 2018 in descending orbit. The diamond marks the reference point.
Sustainability 18 00173 g006
Figure 7. The maximum rate of displacement in the downstream part of the dam.
Sustainability 18 00173 g007
Figure 8. Mean LOS velocity for Sentinel-1 (2014–2019) processed using GMTSAR. The diamond is the reference point. Positive towards the satellite.
Sustainability 18 00173 g008
Figure 9. Cumulative vertical displacement obtained via field measurements from 2012 to 2019 along the horizontal (ad) and vertical (eg) profiles. The greatest subsidence occurred in the AA′ profile, in the middle of the dam crest, at a rate of −24 mm in 2019. In the BB′ profile, the greatest subsidence is related to D3 with −12 mm in 2019. The rate of displacement in the CC′ and DD′ profiles increased in the eastward direction in 2019 at −4.25 mm and −2.5 mm, respectively. In the MM′ and NN′ profiles, the rate of displacement increases from the downstream part of the dam to the crest, which has the greatest displacement. The majority of the displacements in II’ are in the dam’s upper section.
Sustainability 18 00173 g009
Figure 10. Vertical displacements determined from terrestrial surveying. Ascending orbit of TerraSAR-X and Sentinel-1 for three survey points marked in Figure 3 from 2014 to 2019.
Sustainability 18 00173 g010
Figure 11. Comparison at two points between Sentinel-1 and TerraSAR-X vertical displacements and the vertical from terrestrial surveying. The point locations are marked in Figure 3.
Sustainability 18 00173 g011
Figure 12. Internal accuracy verification using results from the c-band and leveling. Scatter plot and linear fit of the deformation rate for the leveling and Sentinel-1 results.
Sustainability 18 00173 g012
Figure 13. Eastward (a), vertical (b), and vector (c) velocity of the dam from TerraSAR-X data.
Sustainability 18 00173 g013
Table 1. Detailed information on TerraSAR-X images.
Acquisition Date OrbitModeResolution (m)Image Size Inc   ( θ ) ° Heading AnglesBand
10 May 2018–17 August 2018AscendingSpotlight110 × 534.3350X
14 May 2018–10 August 2018DescendingSpotlight110 × 532.8190X
Table 2. Detailed information on Sentinel-1 images.
Acquisition DateOrbitModeResolution (m) Inc   ( θ ) ° Heading AnglesBand
8 October 2014–10 July 2019Ascending(IW)20 × 532.3350C
Table 3. Horizontal eastward ( x ), northward ( y ) ,   a n d   t o t a l   ( D ) displacements relevant to the March 2012 and May 2019 surveying campaign (incidence and angle [29]). Semi-minor axes and semi-major axes of the error ellipse are represented by A and B, respectively, at the 95% confidence interval, and Az represents the azimuth of the major axis of the ellipse. Errors and uncertainties are generally 2 mm or less.
Point Name x
(mm)
y
(mm)
D
(mm)
AZ
(deg)
A
(mm)
B
(mm)
XY
D1−4.01−1.444.272501.91.750.64339996636.1855455775
D2−14.394.4815.072872.21.850.641731850636.1855023562
D31.9877.28151.61.350.640076889736.1854595218
D44.898.719.99292.31.950.637298264136.185385866
D56.553.347.36631.91.350.637298264136.1853858660
D6−2.28−0.382.312601.91.650.641696458436.1864152025
D7−2.792.94.023161.81.750.640039879936.1863724348
D8−0.156.436.433581.91.550.638928688236.1863431099
D9−1.541.832.393202.01.950.640004082936.1872728855
D10−1.691.862.513172.01.950.638892354436.1872438453
CD1−1.37−5.765.921932.01.750.645691461136.1852464386
CD2−9.5−10.3614.052221.91.550.643426267136.1848705525
CD3−0.73−13.8513.871831.71.250.640103668236.1847838634
CD414.39−6.215.661131.61.450.637325096636.1847108890
CD56.42−1.836.671061.71.250.635707223836.1848183256
TC1−8.70.598.722741.81.450.64175889136.1848263772
TC21.7112.0612.1881.71.350.638992331436.1847556593
Max. horizontal displacement denoted by red color.
Disclaimer/Publisher’s Note: The statements, opinions and data contained in all publications are solely those of the individual author(s) and contributor(s) and not of MDPI and/or the editor(s). MDPI and/or the editor(s) disclaim responsibility for any injury to people or property resulting from any ideas, methods, instructions or products referred to in the content.