1. Introduction
Buildings, as significant energy consumers, account for approximately 30% of the total final energy consumed worldwide. This substantial energy usage contributes to 26% of global greenhouse gas emissions related to energy consumption, highlighting the critical role of building energy efficiency [
1]. In addition, buildings represent a substantial portion of the energy demand within power generation systems, consuming nearly 50% of the total capacity. This significant reliance on buildings for energy highlights their pivotal role in achieving carbon neutrality by 2050. Decarbonizing the building sector is essential for mitigating the climate crisis and transitioning to a sustainable energy future [
2].
Retrofitting plays a crucial role in achieving carbon neutrality by modifying specific components of a building rather than completely reconstructing it. This approach offers significant advantages over rebuilding, particularly from a life cycle assessment perspective. Green retrofitting notably enhances energy efficiency and environmental sustainability in existing buildings [
3]. In South Korea, for instance, 42.6% of existing buildings are 30 years old or older [
4]. As a result, the government policies are focused on improving the energy efficiency of these old buildings [
5].
Green remodeling and retrofitting are effective strategies for enhancing the sustainability of existing buildings. While green remodeling involves significant structural modifications, green retrofitting typically focuses on improving energy efficiency and reducing environmental impact by changing one or more parts of the existing buildings. Green retrofitting is recognized for its economic, environmental, and social benefits [
6]. Retrofit projects leverage comparable technologies to deliver substantial energy savings and higher cost-benefit outcomes, offering a cost-effective alternative to new construction, with average costs approximately 30% lower [
7]. Retrofitting buildings with advanced insulation and energy-efficient technologies is critical for enhancing thermal performance, reducing heat loss, and lowering energy consumption [
8,
9,
10,
11]. For instance, novel insulation for external walls can reduce the total heat transfer coefficient of U-value by up to 47.9% [
11], while solar pond windows can achieve reductions of U-value up to 84.5% [
9]. However, retrofitting solutions must be carefully evaluated, as they can introduce challenges such as thermal bridges, which may inadvertently increase heating and cooling loads [
10]. Despite these potential drawbacks, innovative and smart retrofit technologies ultimately support the goal of achieving carbon neutrality [
8]. Studies indicate that the residential sector achieves the highest energy savings from retrofitting, as evidenced by over 20,000 publications per year on the topic since 2013 and an analysis of 50 case studies highlighting this trend [
12].
Previous research on green retrofitting primarily addressed policies, costs, and methodologies to identify feasible retrofit technologies for specific local contexts. Globally, various policies were implemented to promote green retrofitting, with financial support and public awareness emerging as key factors. However, significant gaps remain in policy frameworks [
13,
14]. For instance, in China, the second-largest contributor to building energy consumption, the lack of an integrated policy system and diverse financial support mechanisms hindered the adoption of green retrofit technologies [
13]. Similarly, studies in Hong Kong revealed insufficient alignment between green retrofit policies and technologies, with certain policies lacking clear specifications [
14]. In South Korea, current green retrofit policies require substantial improvements, including revisions to financial policies, the introduction of active systems, and increased public awareness of green retrofitting benefits [
15]. In addition, one study even showed regional differences in priorities: UK experts placed greater emphasis on economic performance, particularly cost, while Chinese experts prioritized technical criteria, such as durability. UK experts also highlighted thermal comfort under indoor environmental quality, whereas Chinese experts prioritized visual comfort. These results underscored cultural and professional differences in evaluating green retrofit technology by providing a balanced framework for sustainability strategies [
16]. Thus, one study investigated methods to enhance collaboration among stakeholders—government, developers, and occupants. Using evolutionary game theory, it examined the interaction mechanisms and identified key factors influencing stakeholder behavior. The study found that occupants, due to limited economic capacity, were less responsive to changing conditions, highlighting the need for supportive policy environments. It was also found that financial incentives, such as subsidies, significantly encouraged developers to adopt green retrofit practices. Finally, promoting life-cycle awareness among developers was critical, as energy-saving performance serves as a strong motivator [
17].
Numerous studies explored the costs associated with green retrofitting. Survey findings indicated that over 50% of respondents expressed support for green retrofitting their homes and were willing to invest an initial amount of up to approximately USD 3700 [
18]. Furthermore, research has identified that the primary incentive for residents to undertake green retrofitting was the potential for long-term cost savings through reduced utility expenses. Another study demonstrated that adopting readily available and proven retrofit technologies was able to achieve up to a 40% reduction in primary energy demand and associated emissions. However, economic analyses showed significant challenges in implementing certain solutions, particularly involving thermal insulation of building envelopes and ventilation systems with heat recovery [
19]. In addition, one study highlighted that high-rise apartments had a cost-effective energy-saving potential exceeding 70%, which was able to increase to over 80% when considering occupant behavior, such as window usage [
20]. The findings underscored the importance of integrating occupant behavior into cost-optimal calculations for achieving substantial and consistent results. The study also revealed that cost-effective retrofit solutions for low-rise residential buildings may not be suitable for high-rise buildings, with significant variations in cost-optimal solutions between these categories. These insights emphasized the need for personalized approaches to cost-optimal energy retrofitting, based on building type and sub-category distinctions. Thus, one study presented a stepwise screening methodology for building energy retrofit and maintenance plans, integrating life-cycle cost analysis and Monte Carlo simulations to address economic and risk factors [
21].
Accordingly, to identify affordable green retrofit options, several studies were conducted. Intelligent methodologies that effectively utilize textual data from existing projects can help devise suitable green retrofitting strategies. For example, a decision-making approach combining case-based reasoning and random forest was employed to analyze a database of 109 green retrofit projects, enabling the identification of similar cases and the revision of outdated measures [
22]. Another study highlighted the value of case-based reasoning in supporting green building retrofit decisions by leveraging knowledge from past projects. A database of 71 retrofit cases was analyzed, detailing attributes such as general building information, components, energy performance, and costs. A synthetic optimization weighting method, informed by expert opinion and attribute characteristics, was applied to evaluate these cases. This method underscored the importance of learning from past projects to improve planning and outcomes in future green retrofitting projects [
23].
Several studies focused on the importance of energy-efficient and sustainable building retrofits, presenting various methodologies and case studies. A critical evaluation of Sri Lankan hotel buildings revealed that green retrofits, such as biomass boilers, energy-efficient chillers, and solar PV systems, offered significant energy savings and financial viability, while certain technologies, like LED televisions, were less cost-effective [
24]. Energy retrofitting in public and educational buildings highlighted the significant benefits of green renovation strategies in reducing energy consumption and environmental impact. The University of Oradea campus in Romania underwent extensive green renovations. Over the past decade, 16 buildings, encompassing 30% of the campus area, were modernized with measures such as improved insulation, high-efficiency heating systems using geothermal water, and enhanced building envelopes. These efforts led to a 20–88% reduction in energy consumption and a 41.82–86% decrease in CO
2 emissions across the renovated spaces, while geothermal water consumption dropped by 21% [
25]. A case study on a public building retrofit demonstrated that green remodeling effectively improved the building envelope, reducing heat transfer coefficients and heat losses. The new insulation and high-efficiency windows resulted in a predicted 40% reduction in heating energy demand [
26].
Focusing on residential buildings, a life cycle cost analysis-based thermal performance optimization model was developed to enhance the energy efficiency of existing residential buildings. The model determined the optimal insulation thickness for the roof, external walls, and floors over basements, proposing that the equivalent U-value of all opaque building envelope components should be equal for maximum efficiency. In addition, methods for calculating the ultimate and optimal energy-saving ratios were introduced. A case study in Beijing revealed that compared to the limit value method (LVM), the optimization model could reduce insulation material usage by up to 73.59% and insulation investment costs by up to 64.93%. However, the analysis revealed that while improving window performance contributes to energy savings, it may not always yield the most financially viable returns. Thus, a balance between technical advancements and economic viability was essential when selecting retrofit measures [
27].
Additional investigations described the broader implications of residential passive retrofitting on indoor environmental quality (IEQ), emphasizing the need for strategies that balance energy efficiency with occupant comfort. While passive retrofits enhanced IEQ, aspects like acoustic and visual comfort remained underexplored, calling for holistic approaches to retrofit design. Moreover, systematic reviews underlined the necessity of integrating advanced decision-making frameworks, such as multi-objective optimization and simulation-based tools, to refine retrofit measures [
28]. A study of traditional Albanian residential buildings (16th–19th century) analyzed thermal performance and potential retrofit measures using computational simulations. Seven retrofit scenarios, including wall and roof insulation and improved glazing, were tested across different climatic zones. The results showed energy performance improvements of up to 46.3% and thermal comfort gains of 7.2 °C in winter, with a payback period of 7.9 years. The study provided a framework for retrofitting historic buildings, particularly in Mediterranean climates, to enhance energy efficiency and comfort [
29]. A study on the renovation of a 1960s single-family house in Germany examined the impact of a new retrofitting strategy, incorporating prefabricated elements with integrated ventilation and a new thermal envelope, on energy efficiency and indoor environmental quality (IEQ). In situ measurements showed improvements, including a 2.5 °C increase in indoor air temperature, a 3.8% decrease in relative humidity, and a slight increase in CO
2 levels. Simulations of a home office scenario indicated up to 77% heating energy savings and further IEQ enhancements. The findings highlighted the effectiveness of this retrofitting approach in improving both energy performance and occupant comfort [
30].
Particularly, studies on secondary glazing systems demonstrated their effectiveness as retrofit solutions for improving the thermal performance of single-glazed aluminum-framed windows. A study in New Zealand tested four secondary glazing products—plastic film, magnetically attached plastic sheets, plain glass, and low-E glass—showing substantial reductions in thermal transmittance. Among them, low-E glass achieved the highest improvement (290%), followed by magnetically attached plastic sheets (150%), plastic film (140%), and plain glass (130%). These findings highlighted the potential of secondary glazing to enhance energy efficiency in older residential buildings, making it a viable retrofit option for improving indoor thermal comfort and reducing heating energy demand in regions with similar climates [
31]. Even for historic buildings, a study on traditional window retrofitting assessed the impact of various insulation strategies on reducing heat loss. Using a calibrated two-dimensional heat conduction model, the study estimated that conduction and radiation heat loss through single-glazed windows can be reduced by 40–50% with curtains or plain blinds, 50–60% with shutters or insulating blinds, and over 60% with low-emissivity secondary glazing. Combining secondary glazing with additional insulation methods further enhanced performance, making traditional windows capable of meeting modern energy regulations. Additional improvements, such as insulating frames or double glazing, could further optimize energy efficiency [
32].
In addressing policy and practical challenges, one study targeted the achievement of energy saving for residential retrofits by 2020, and found that the goal was technically feasible yet challenging without a shift toward deeper retrofits such as active and renewable systems. These findings collectively highlighted the need for innovative, region-specific strategies that align energy savings, cost efficiency, and occupant well-being, providing a robust foundation for future research and implementation in sustainable building retrofits [
33].
In summary, various retrofit measures have been extensively studied as essential strategies for achieving carbon neutrality in existing buildings. While research on green retrofitting technologies for building envelopes has expanded, studies focusing on low-cost, high-efficiency, and easily implementable solutions for actual residential buildings, particularly older ones, remain limited. This research highlights the potential of green retrofitting to provide affordable and effective solutions for actual residential buildings, particularly for low-income residents of buildings aged 30 years or older where the installation of retrofit measures is difficult due to the older windows and frames. The green retrofitting of this research offers an accessible means of upgrading residences without requiring extensive renovations. This research focuses on evaluating the effectiveness of straightforward green retrofit technologies for improving window performance, with a specific emphasis on reducing heating energy use and greenhouse gas emissions. Experiments were conducted using secondary glazing and windproof materials to enhance the performance of thermal insulation and air tightness. In addition, simulations were performed to assess the effectiveness of these technologies under various built year conditions. Finally, a utility bill analysis was conducted for the apartment buildings that installed the affordable green retrofit technologies.
The following section details the materials and methods used in this research.
Section 3 presents the findings and discussion derived from three different approaches. Finally,
Section 4 provides concluding remarks.
2. Materials and Methods
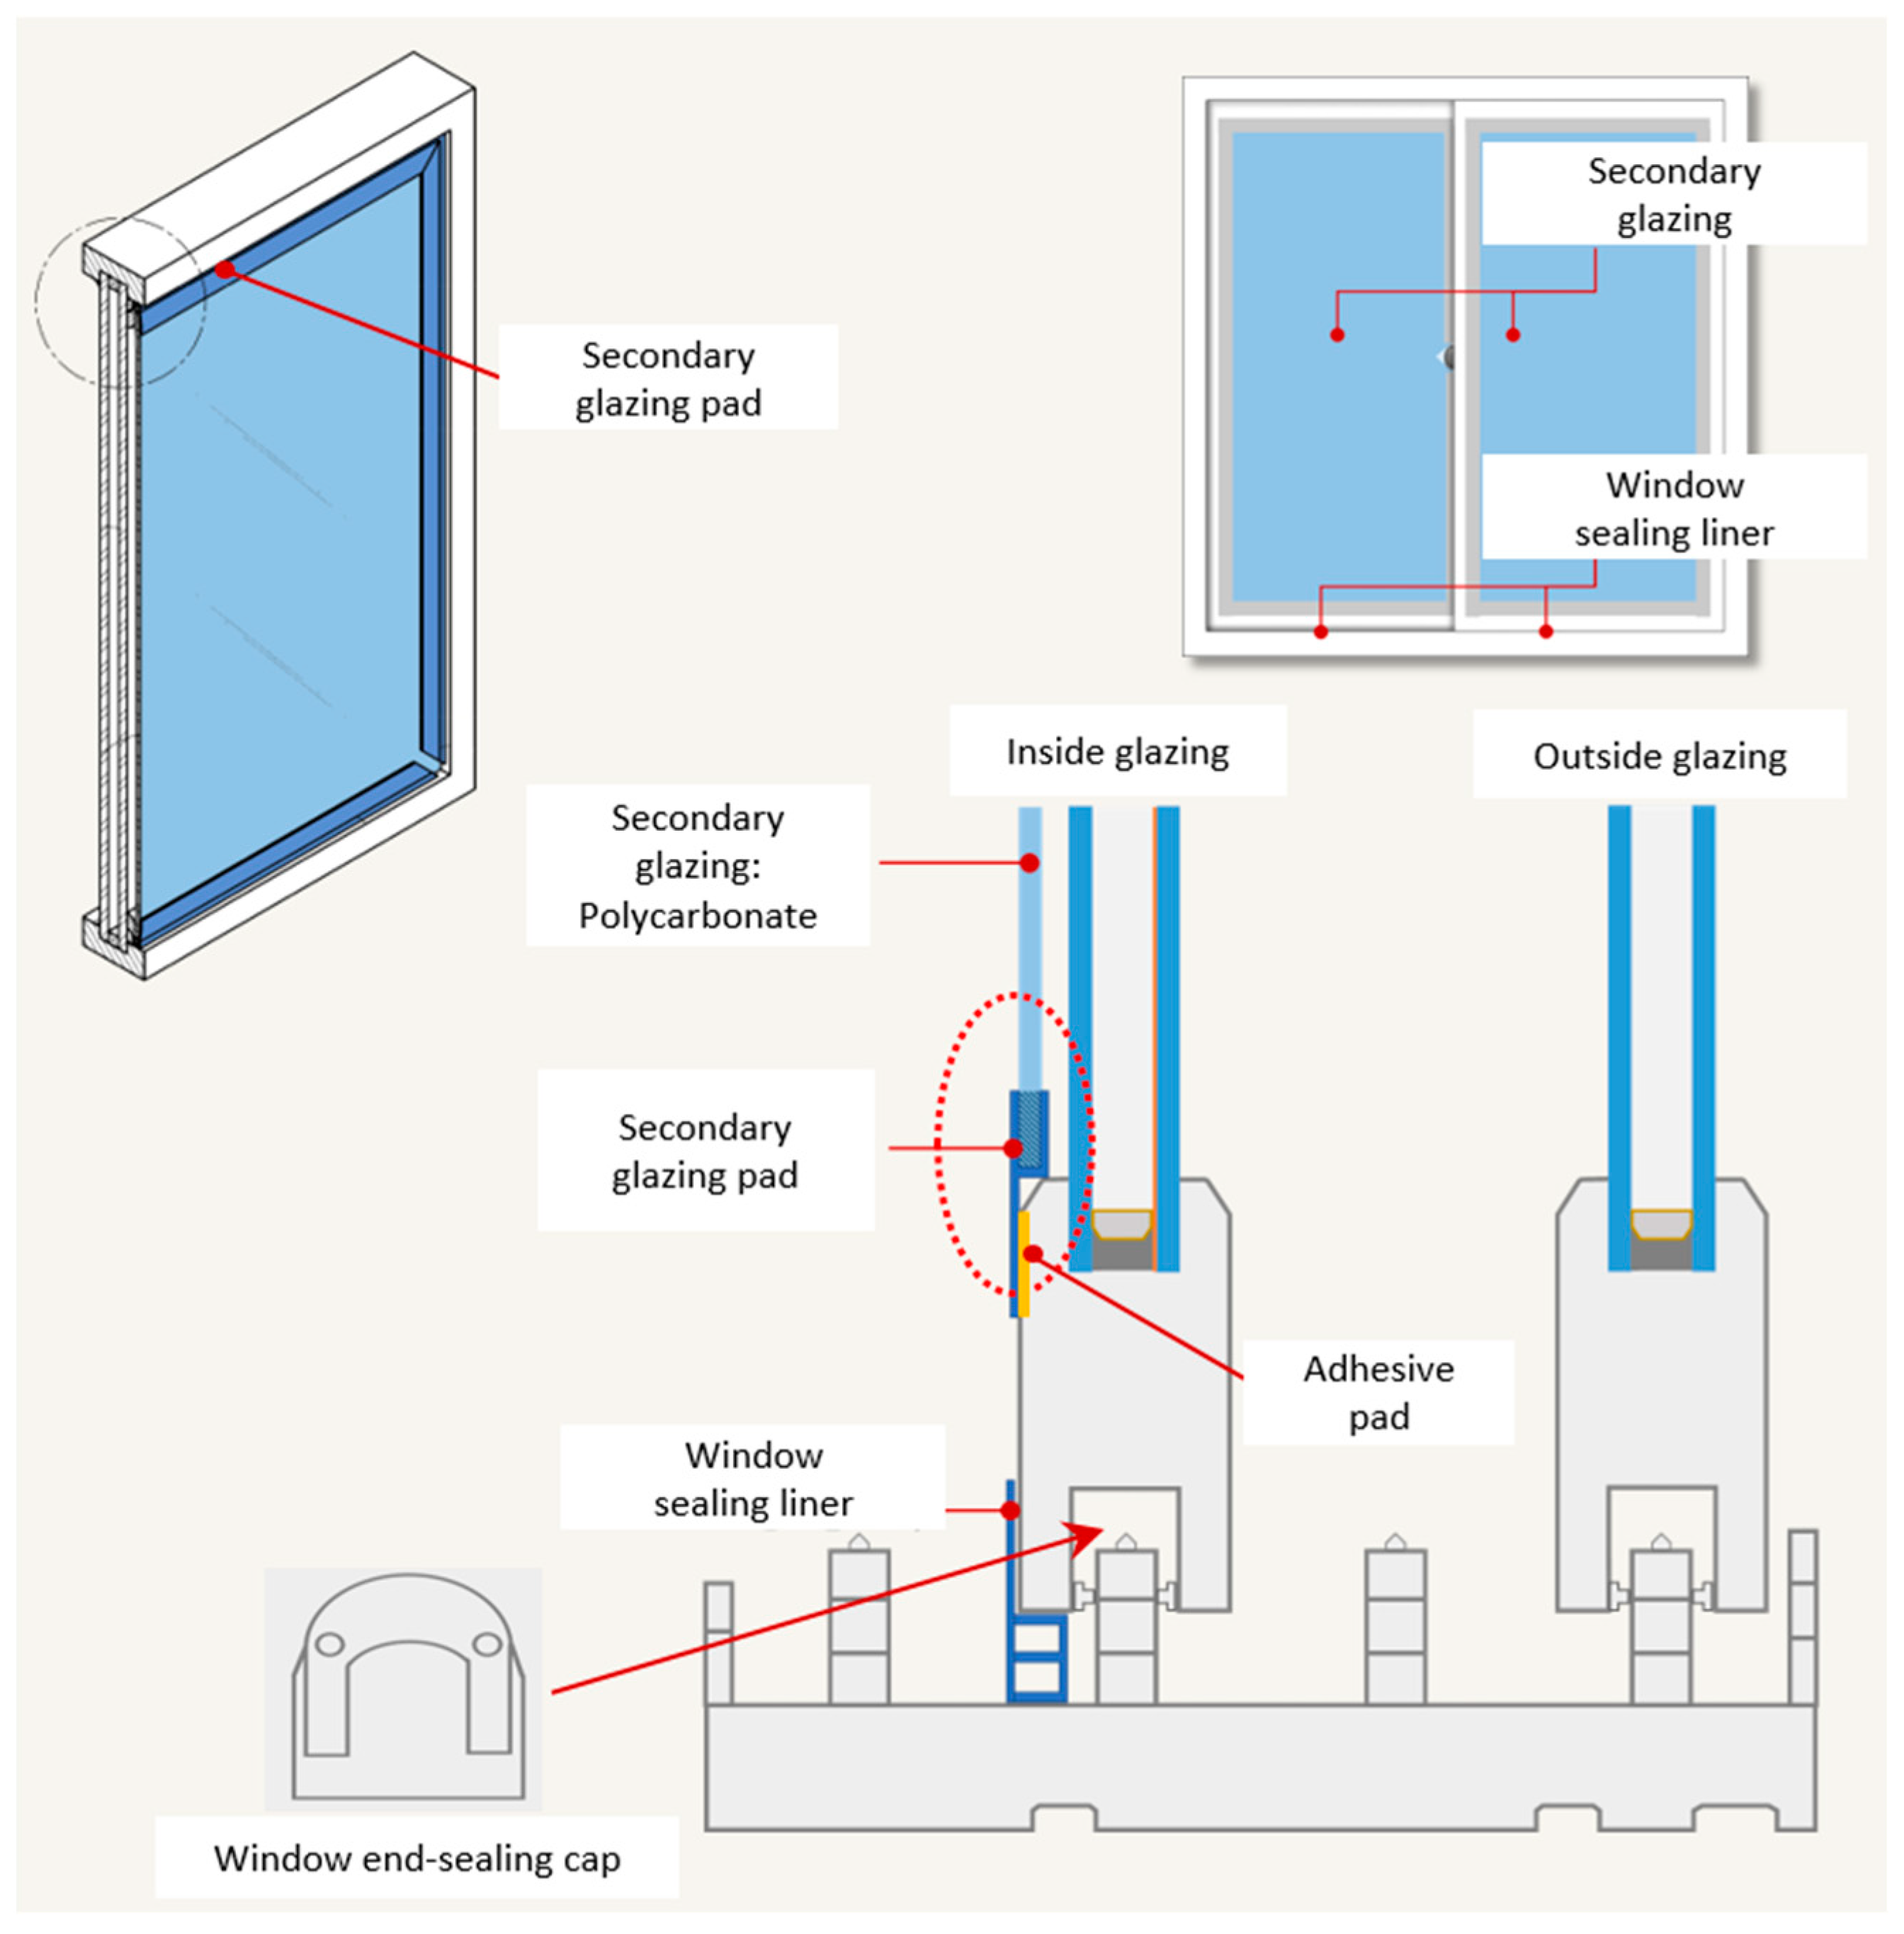
In this research, easy-to-implement green retrofit technologies for windows in older residential buildings were developed (see
Figure 1). For the secondary glazing, a transparent polycarbonate glazing with a thickness of 2 T (mm) and a secondary glazing pad was developed. The lightweight polycarbonate glazing ensured minimal obstruction of the window view. The secondary glazing pad, equipped with an adhesive pad, facilitated easy attachment to the window frame. To enhance fixing strength, screws can be used to reinforce the attachment on older window frames where the adhesive may not provide sufficient support.
Figure 2 shows the dimensions of the secondary glazing pad. The developed secondary glazing and pad can be useful for improving thermal insulation performance, as well as condensation prevention and sound insulation performance.
For windproofing, a window sealing liner was developed, with the upper part made of rigid and transparent Polyvinyl Chloride (PVC), and the lower part was made of flexible PVC for the vertical part and rigid PVC for the horizontal part. This design accommodated the unevenness commonly found in older window frames, enabling smooth window operation. In addition, a U-shaped window end-sealing cap was developed, which was made of the rigid Acrylonitrile Butadiene Styrene (ABS) material, and the injection part was molded with flexible PVC. The dimensions of the window sealing liner and end-sealing cap are shown in
Figure 2. The window sealing liner and window end-sealing cap can be useful for enhancing airtightness performance, as well as the prevention of noise, insects, fine dust, and window vibrations caused by strong winds or typhoons. Notably, all of the developed green-retrofit technologies for windows are designed to be homeowner-installable, requiring no technical expertise.
To enhance the performance of the older building envelope, specifically windows, and improve the applicability of the developed green retrofit technologies, this research focused on three key attributes: high efficiency, cost-effectiveness, and easy implementation. To achieve high efficiency, thermal insulation performance was improved using the secondary glazing and pad, while air tightness was enhanced through the application of the window sealing liners and end-sealing caps. The performance of these green retrofit technologies was evaluated under controlled experimental conditions, as detailed in
Section 2.1. In addition, a simulation study was conducted to assess the potential benefits of the developed technologies, as described in
Section 2.2. Lastly, a utility bill analysis was performed using actual energy consumption data from six residences, providing real-world insights into the effectiveness of the retrofit measures. The methodology for the utility bill analysis is discussed in
Section 2.3.
2.1. Experimental Analysis
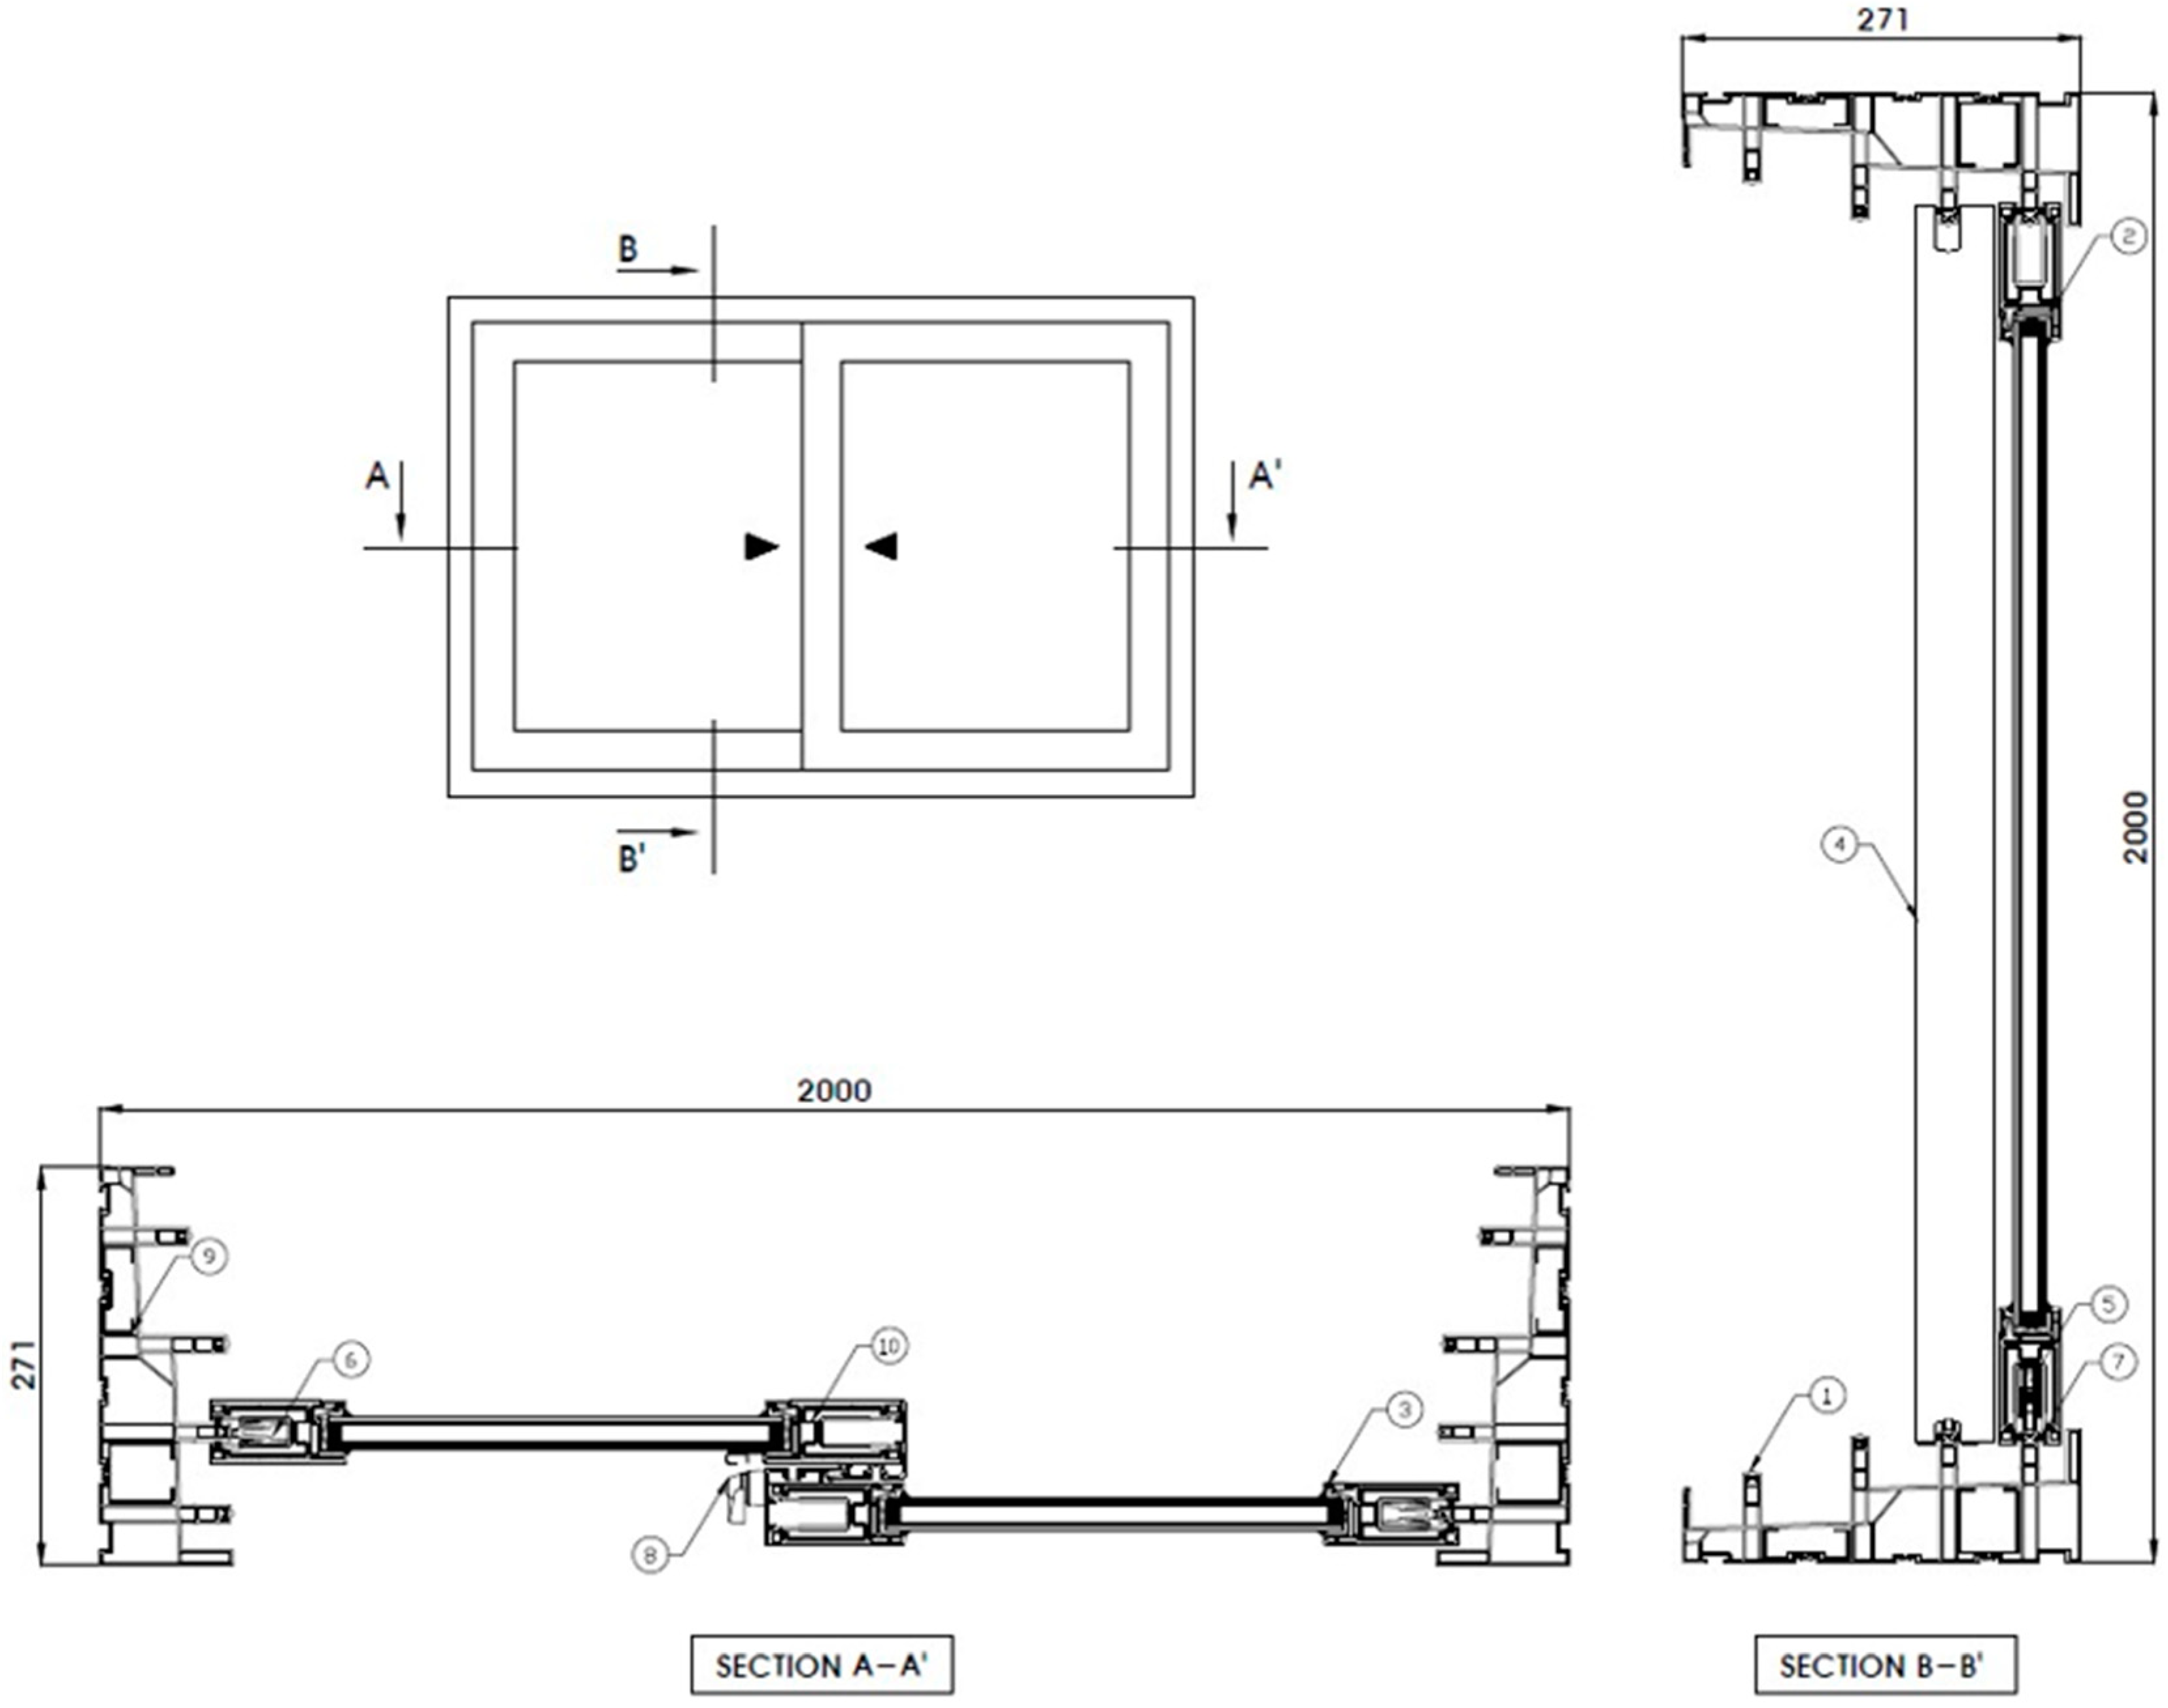
An experimental study was conducted to evaluate the performance of the secondary glazing system. A test sample with dimensions of 2000 mm (width) × 2000 mm (height) × 271 mm (depth) was prepared for laboratory testing. The test sample comprised a double-pane window with a 12 mm air space. One pane was 5 mm thick, and the other was a 5 mm low-emissivity pane. The testing method followed the KS F 2278:2017 standard (Korean Industrial Standard, category F, published in 2017) [
34], which specifies procedures for assessing the thermal performance of windows. The KS standard evaluates the thermal performance of the entire window unit, encompassing the frame and edge effects. The standard outlines the requirements for the test sample and the test frame. Subsequently, it defines the methods for measuring the surface thermal resistance of the reference panel, requiring the stabilization of both the nine surface and air temperatures in the protective thermal box and the low-temperature chamber, respectively. The standard then proceeds to detail the methods for calculating the calibrated heat flow rate. Finally, it outlines the procedure for determining the heat flow rate of a test sample between the protective thermal box and the low-temperature chamber. The U-value is determined by analyzing heat transfer resulting from the temperature difference after the installation of the secondary glazing system. The standard specifies the measurement of temperatures and heat flow rate over a 90 min period for three steady-state conditions (i.e., a 30 min interval for one steady-state condition). Details of the test conditions and equipment specifications are provided in
Table 1.
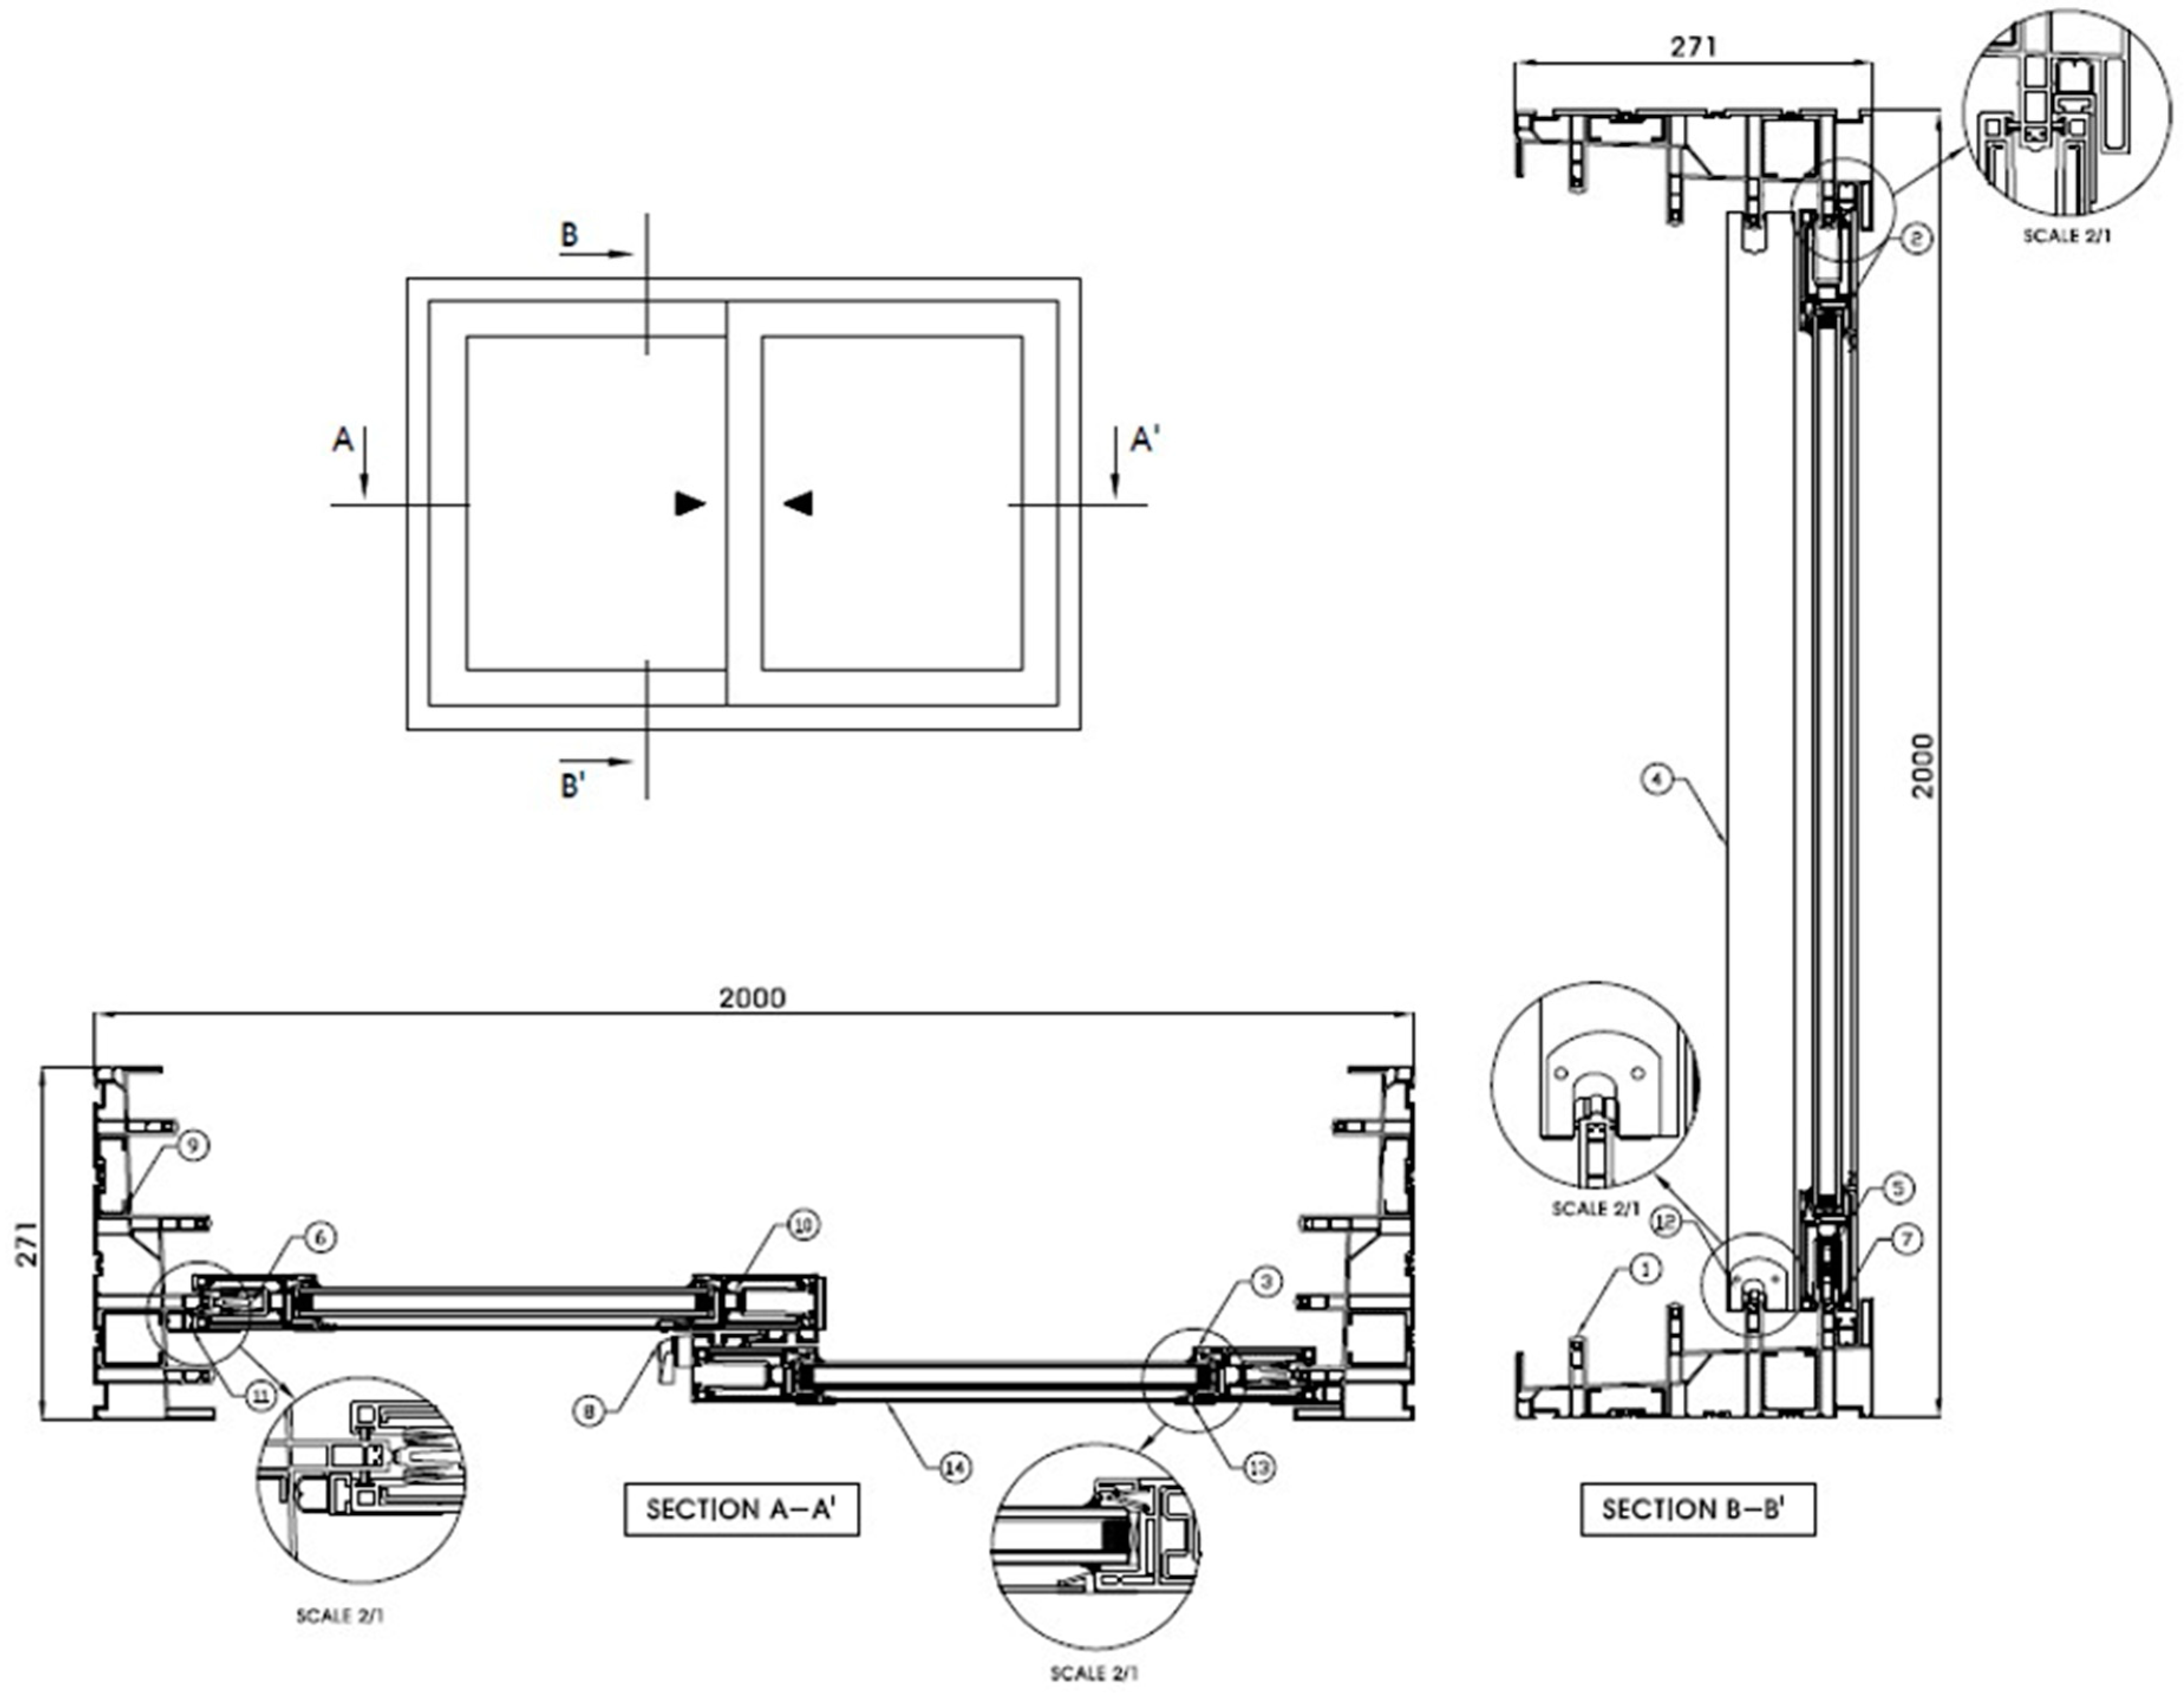
Table 2 provides detailed information about the test sample. The numbered components in
Table 2 correspond to the circled numbers in
Figure 3, which illustrates the cross-sectional views of the secondary glazing system before and after installation.
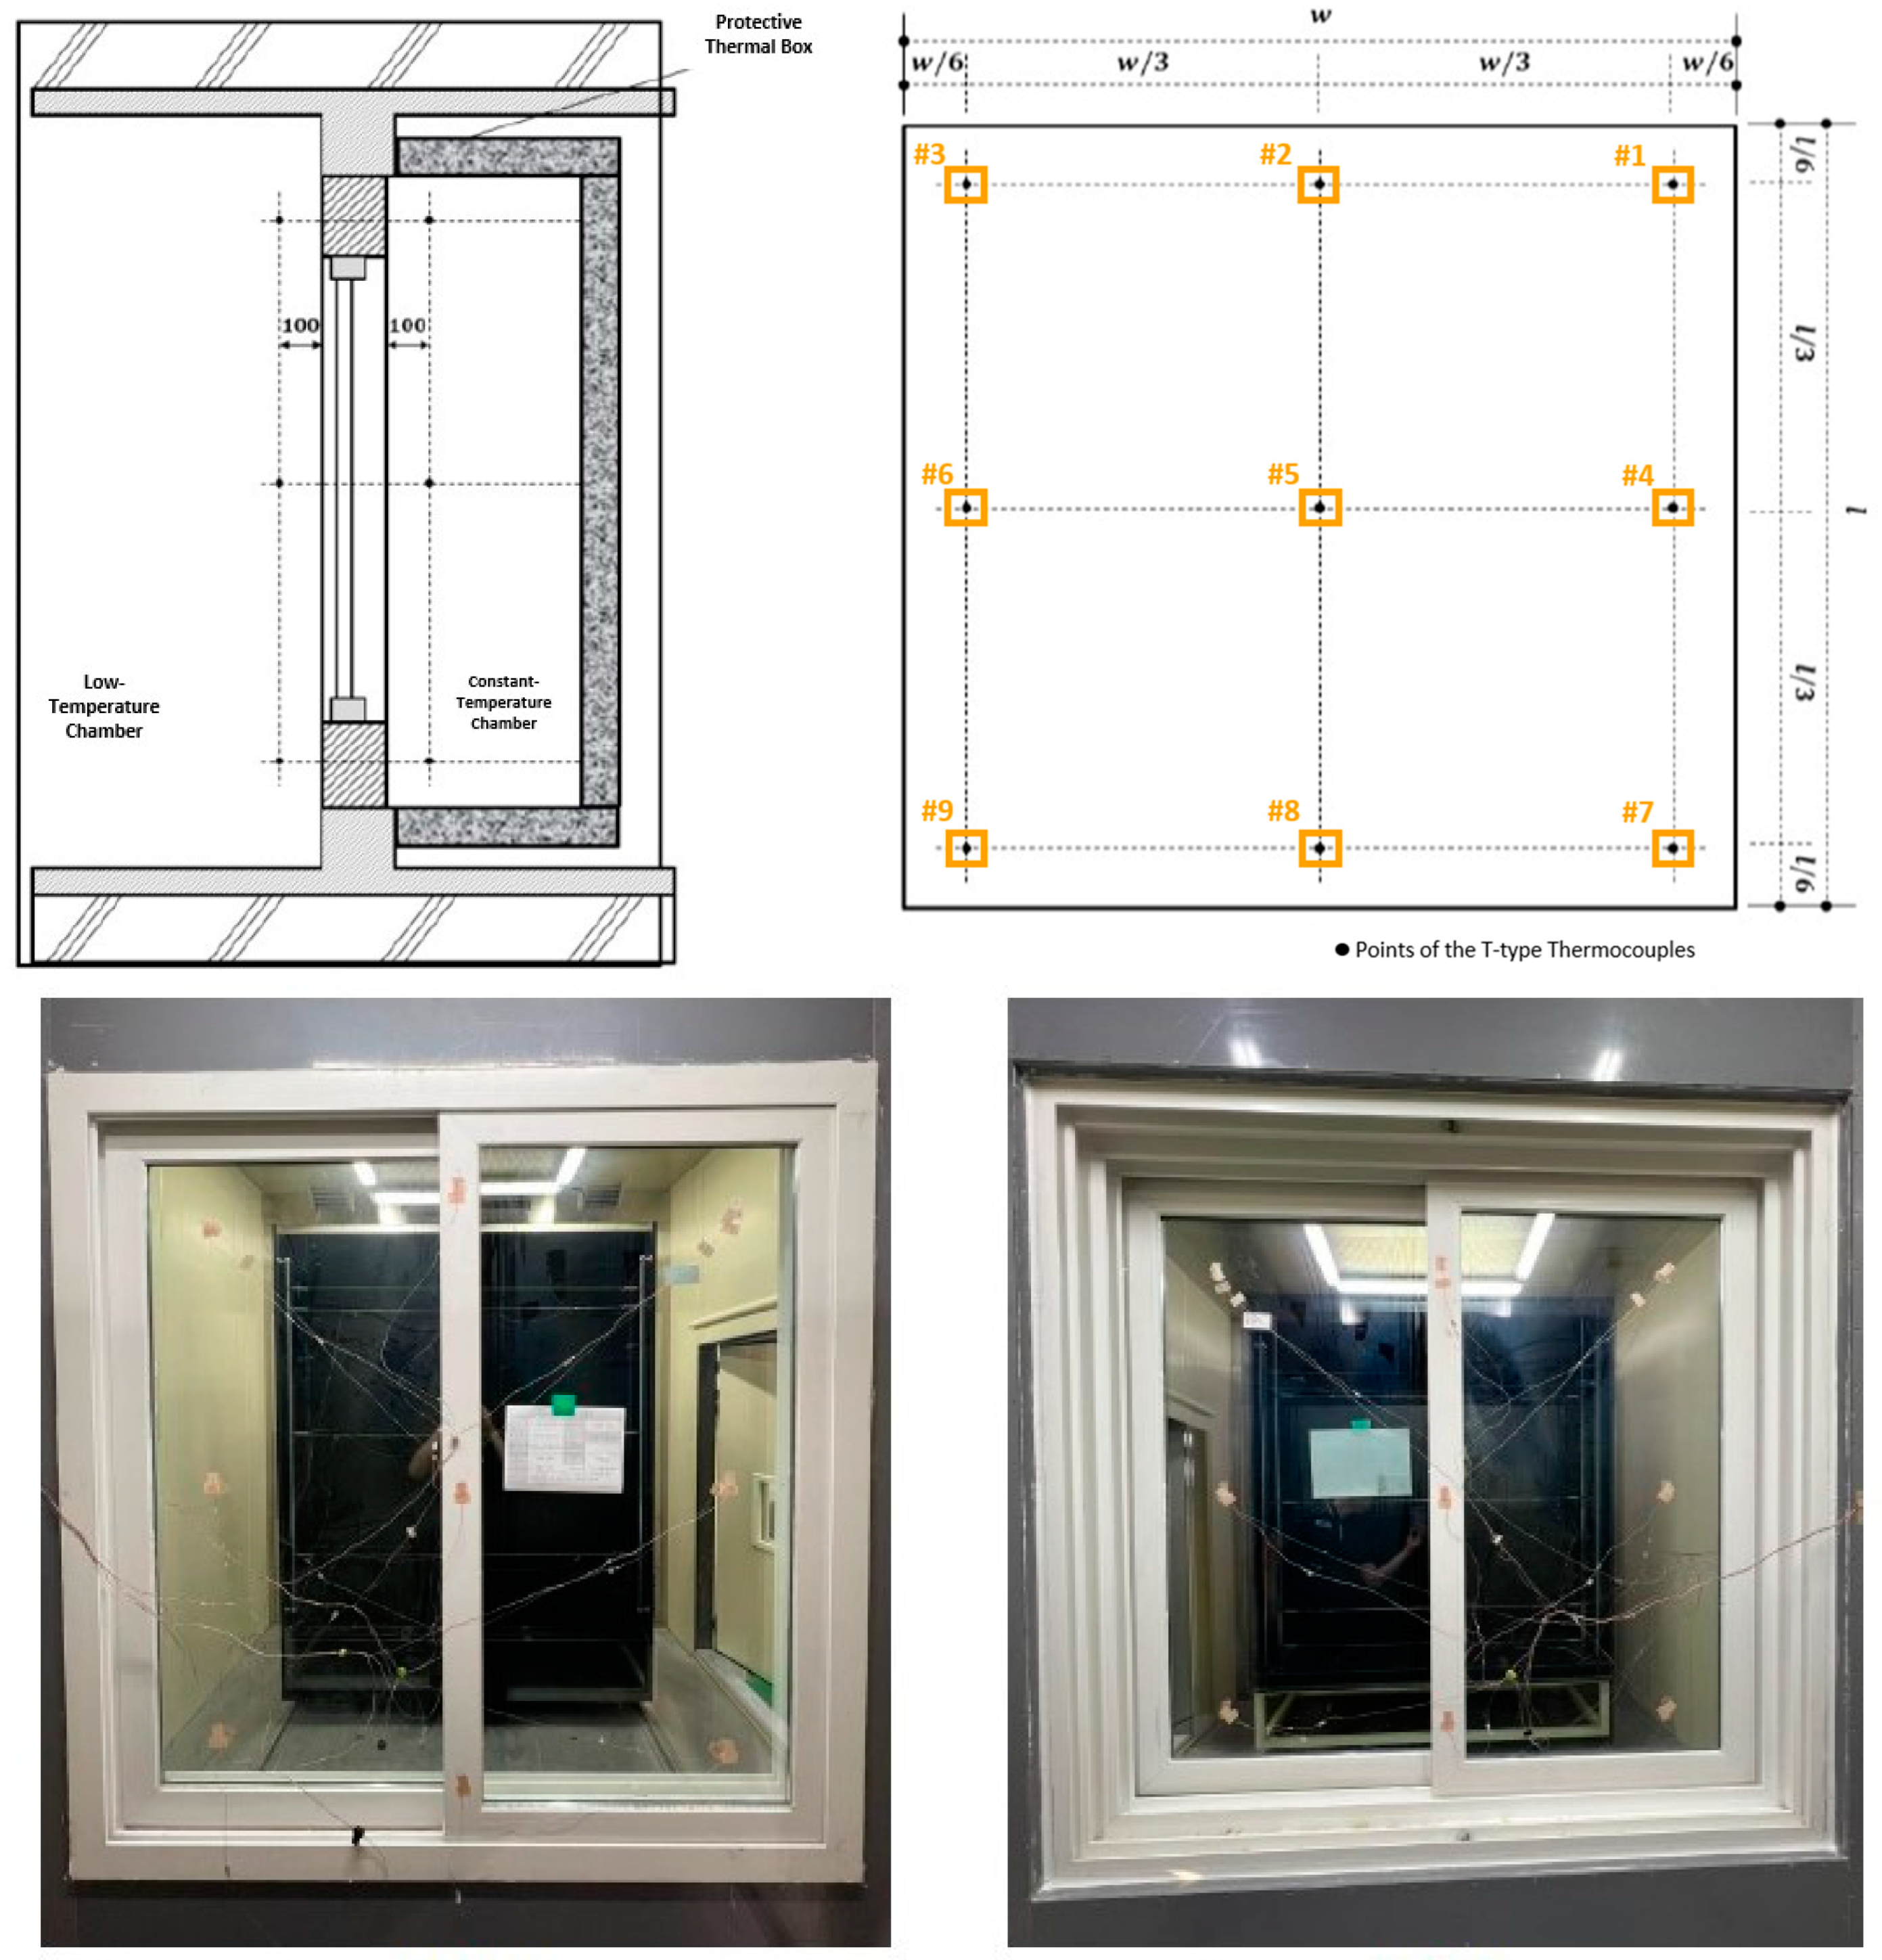
Figure 4 shows the test chamber setup (left) and the placement of T-type thermocouples for U-value measurement (right). The test sample was mounted on an attachment frame comprising a front panel (10 mm Polyvinyl Chloride (PVC) board), Expanded Polystyrene (EPS) (Type 1, Grade 1, 280 mm), and a rear panel (10 mm PVC board). To ensure accurate thermal insulation, gaps between the attachment frame and the test sample were filled with insulation and urethane foam, then sealed tightly with silicone. The test sample was positioned between the low-temperature chamber and the constant-temperature chamber with the protective thermal box.
Air temperatures were measured at nine points (100 mm from the test sample surface, see the upper-left drawing in
Figure 4) in both the low-temperature and constant-temperature chambers using T-type thermocouples with a temperature range of −200 °C to 400 °C and an accuracy of ±0.2%. These thermocouples, with a diameter of 25 mm, were strategically placed at the nine points, each located at the center of an equally divided section of the test sample (refer to the upper-right drawing in
Figure 4). The surface temperatures were also measured at the nine points when the reference panel was installed within the test sample frame. The numbers represent the data points used for classification. The lower-left and lower-right pictures in
Figure 4 present the test sample positioned in the constant-temperature chamber and the low-temperature chamber, respectively. To measure heat transfer before and after the installation of the secondary glazing system, each heater and fan power supply, with an accuracy of 0.05% ± 10 mV, was used along with a power meter certified by the Korean Standard. The total heat flow rate was obtained by summing the heat inputs (W) of the heater and the air circulating fan. Once the controlled environments with distinct temperature conditions were established, the test started, ensuring stable temperature and heat flux conditions. While a more comprehensive analysis would necessitate measurements of the top and bottom corner temperatures to accurately account for thermal bridging and edge effects arising from the thermal conductivity differences between glazing and frame materials [
35], this research focuses on determining the total U-value of the window, considering the thermal impact of the middle window frame.
Figure 5 presents sample data collected during the measurements. The upper graph shows the measured air temperatures at the nine points in the protective thermal box, along with the heater and fan power consumption before the installation of the secondary glazing system. The lower graph shows the corresponding measurements after the secondary glazing system was installed. Both graphs show the stabilized data trends over 90 min, including the three 30 min intervals.
Using Equations (1)–(3), the surface thermal resistance of the reference panel was calculated in both the protective thermal box and the low-temperature chamber. The reference panel, constructed from EPS exhibiting no aging effects (i.e., no release of forming gases), was installed within the test sample frame. Subsequently, at each of the nine measurement points, the surface thermal resistance was calculated, and the average values were obtained for each side of the chambers. The airflow was adjusted until the average thermal resistance (
in the protective thermal box stabilized within the range of 0.11 ± 0.02 m
2·K/W and the average thermal resistance (
) in the low-temperature chamber stabilized within the range of 0.05 ± 0.02 m
2·K/W.
Here, is the thermal resistance of the reference panel (m2·K/W), is the average thickness of the reference panel (m), is the thermal conductivity of the reference panel (W/m·K), is the air temperature in the protective thermal box (K or °C), is the air temperature in the low-temperature chamber (K or °C), is the surface temperature in the protective thermal box (K or °C), and is the surface temperature in the low-temperature chamber (K or °C).
Equations (4)–(6) outline the calculation of the calibrated heat flow rate (W). Using Equation (4), the heat flow rate of the reference panel was determined. Subsequently, when the reference panel was installed, the calibrated heat flow rate was calculated using Equation (5). To develop the correction equation (Equation (6)) for the calibrated heat flow rate through the protective thermal box and the test sample frame, the average air temperature in the constant-temperature chamber was adjusted at least three times within a range of −2 °C to +2 °C relative to the average air temperature in the protective thermal box, while maintaining a stable temperature in the low-temperature chamber. The slope coefficient (‘a’), representing the calibrated heat flow rate (from Equation (5)) as a function of the average air temperature difference between the constant-temperature chamber and the protective thermal box, and the intercept coefficient (‘b’) were then determined using linear regression analysis based on the three data points.
Here, is the average surface temperature in the protective thermal box (K or °C), the average surface temperature in the low-temperature chamber (K or °C), is the area of the reference panel (m2), is the heat input to the heater (W), is the heat input to the air circulating fan (W), is the heat input to the reference panel (W), is the average air temperature in the protective thermal box (K or °C), and is the average air temperature in the low-temperature chamber (K or °C).
Using Equation (7), the corrected surface thermal resistance was calculated. The coefficients ‘a’ and ‘b’ were determined as 5.5291 and 10.441, respectively, from Equation (6), and the calibrated heat flow rate was accordingly applied in Equation (8) using the measured air temperature difference between the protective thermal box and the low-temperature chamber. Using Equations (8) and (9), the window U-value was calculated. Finally, the final U-value was determined by averaging the window U-values obtained from three 30 min measurement intervals.
Here, A is the area of the window test sample (m2), is the heat input to the heater (W), is the heat input to the air circulating fan (W), is the calibrated heat flow rate from the correction equation (W), and R is the thermal resistance of the window test sample (m2·K/W).
KS F 2292:2019 (Korean Industrial Standard, category F, published in 2019) [
36] was used as the testing standard for assessing air tightness. The experiment was conducted under controlled laboratory conditions. Prior to the installation of the secondary glazing system, the indoor environment was maintained at a temperature of 21 ± 0 °C, a relative humidity of 68 ± 1%, and an atmospheric pressure of 1000 ± 0 hPa. Following the installation of the secondary glazing system, the indoor environment was maintained at a temperature of 22 ± 0 °C, a relative humidity of 61 ± 1%, and an atmospheric pressure of 999 ± 0 hPa. Airflow rate measurements were conducted using the meters with measurement ranges of 0–30 m
3/h and 0–300 m
3/h, respectively, and an accuracy of ±1.5% of the measured value. The pressure meter had a measurement range of 0–500 Pa, with an accuracy of ±0.2%.
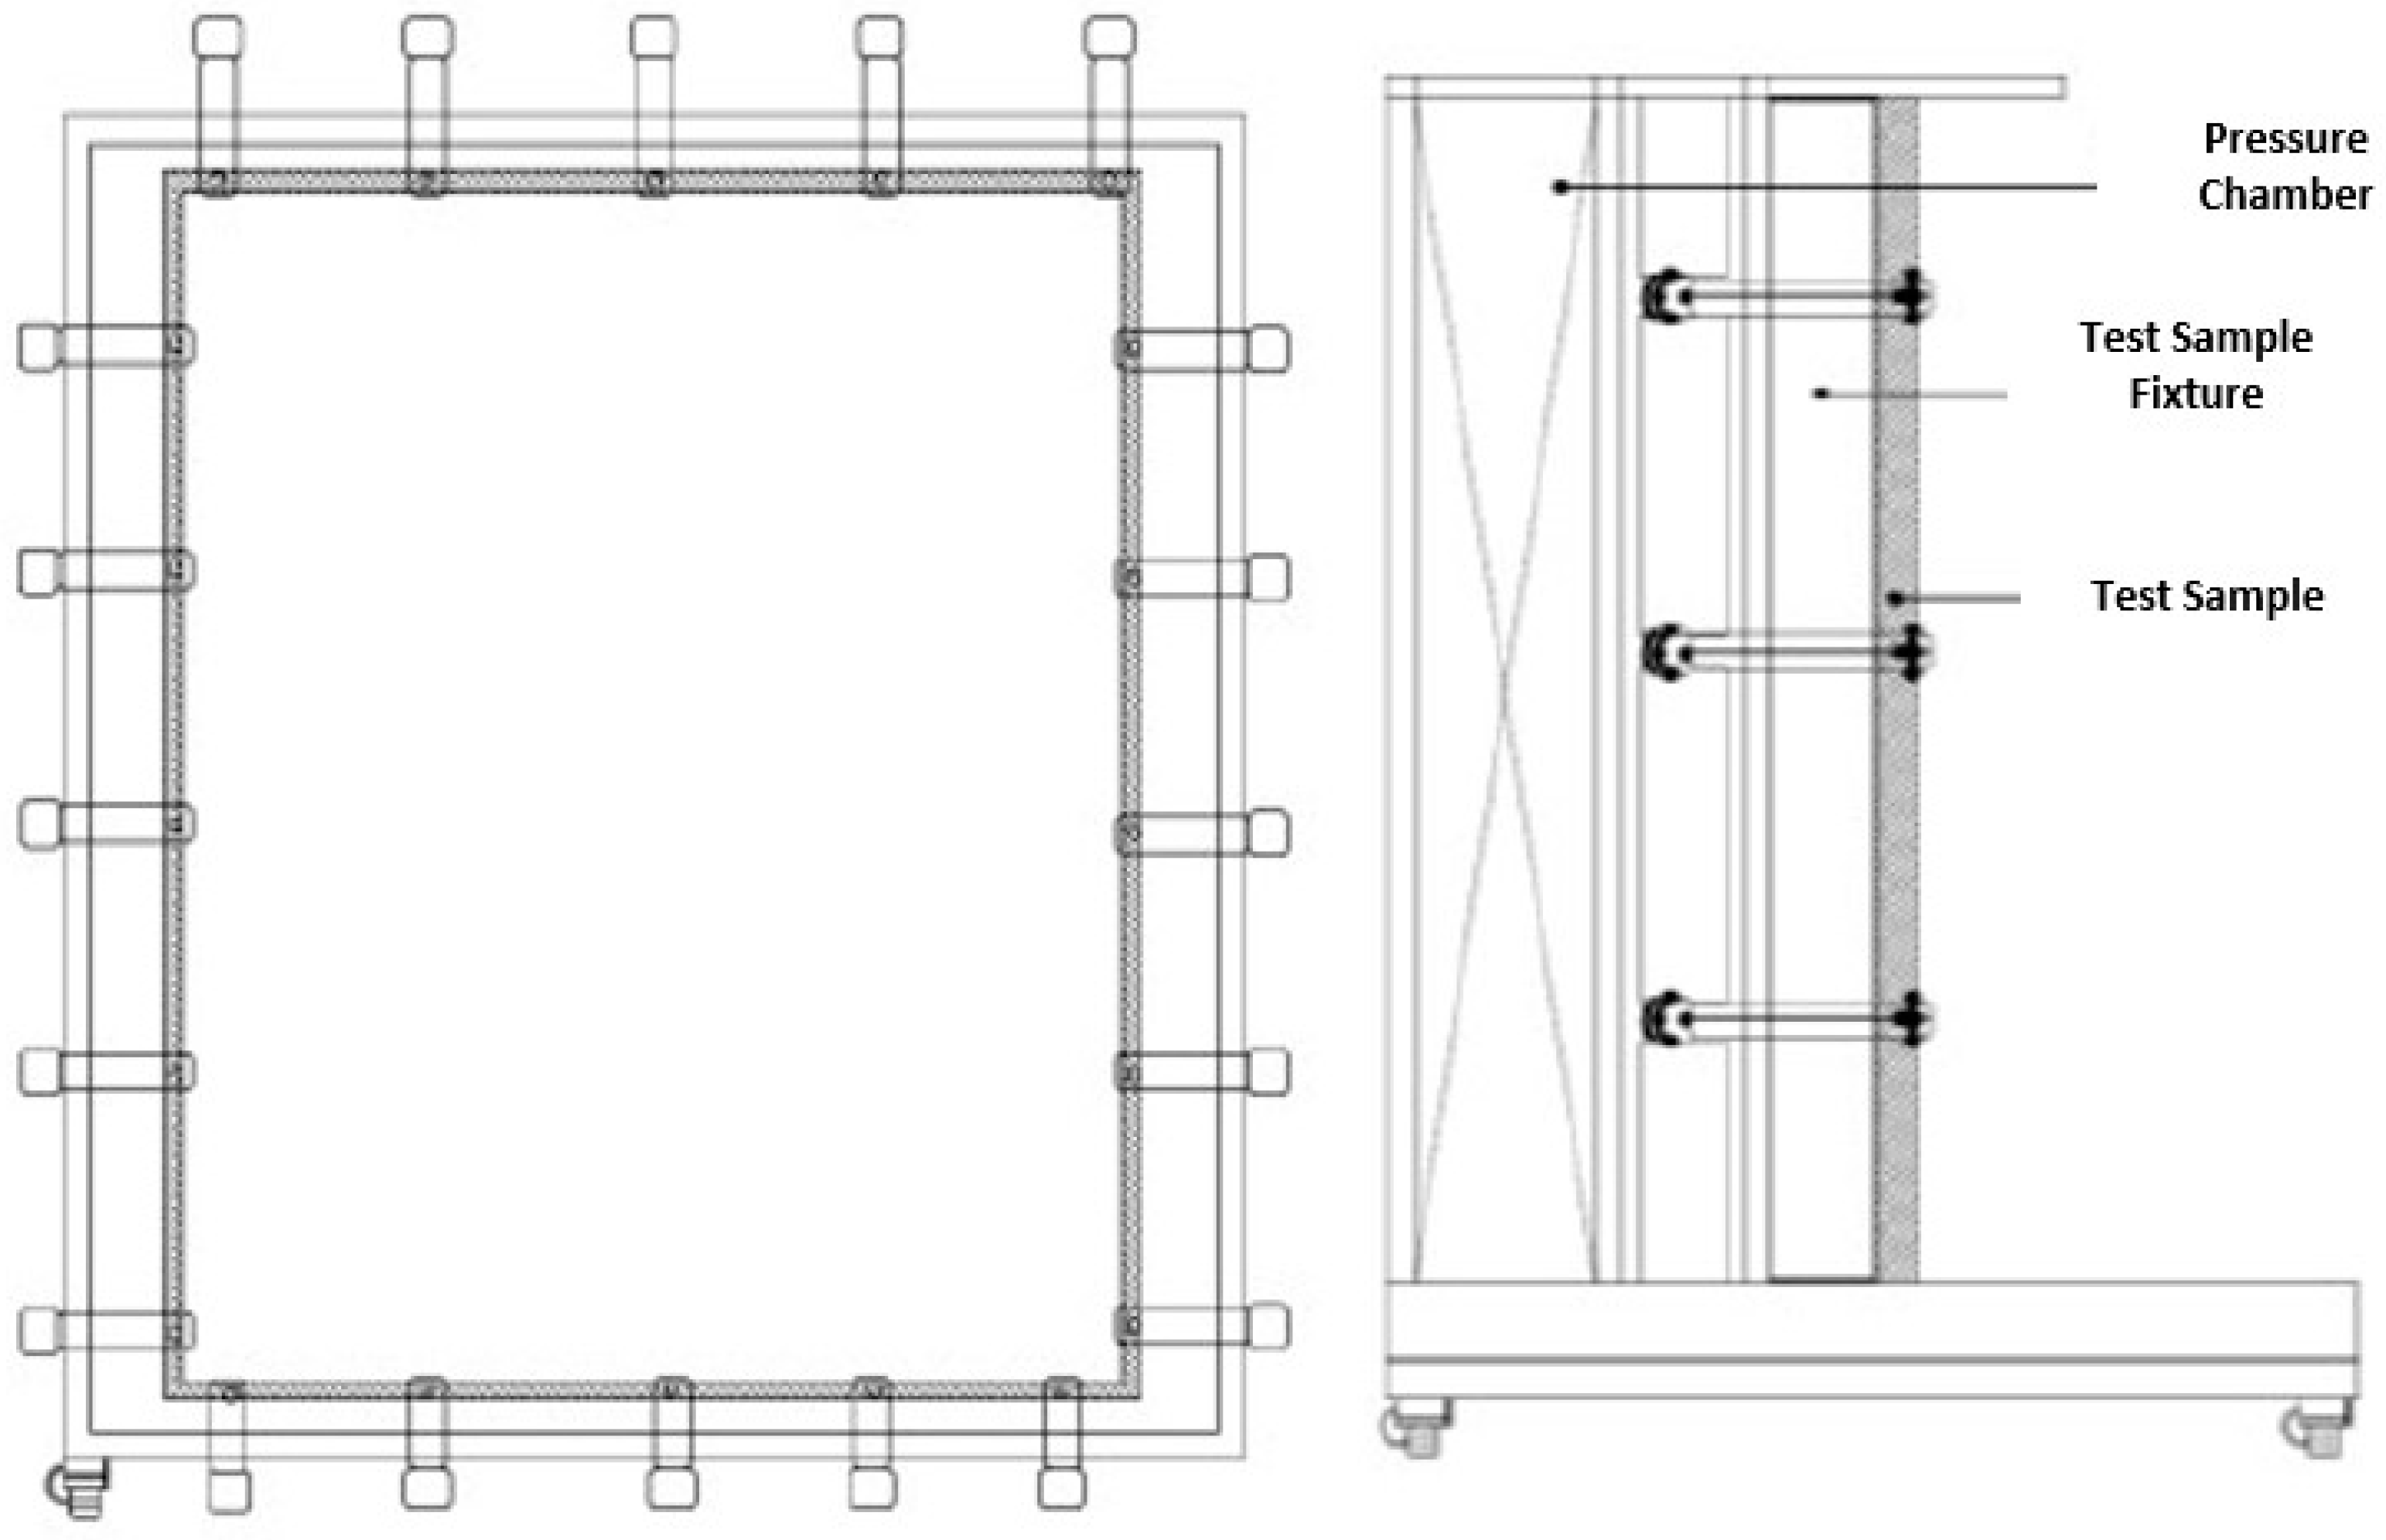
Figure 6 presents the schematic drawing of the test chamber and test sample, alongside their corresponding photograph.
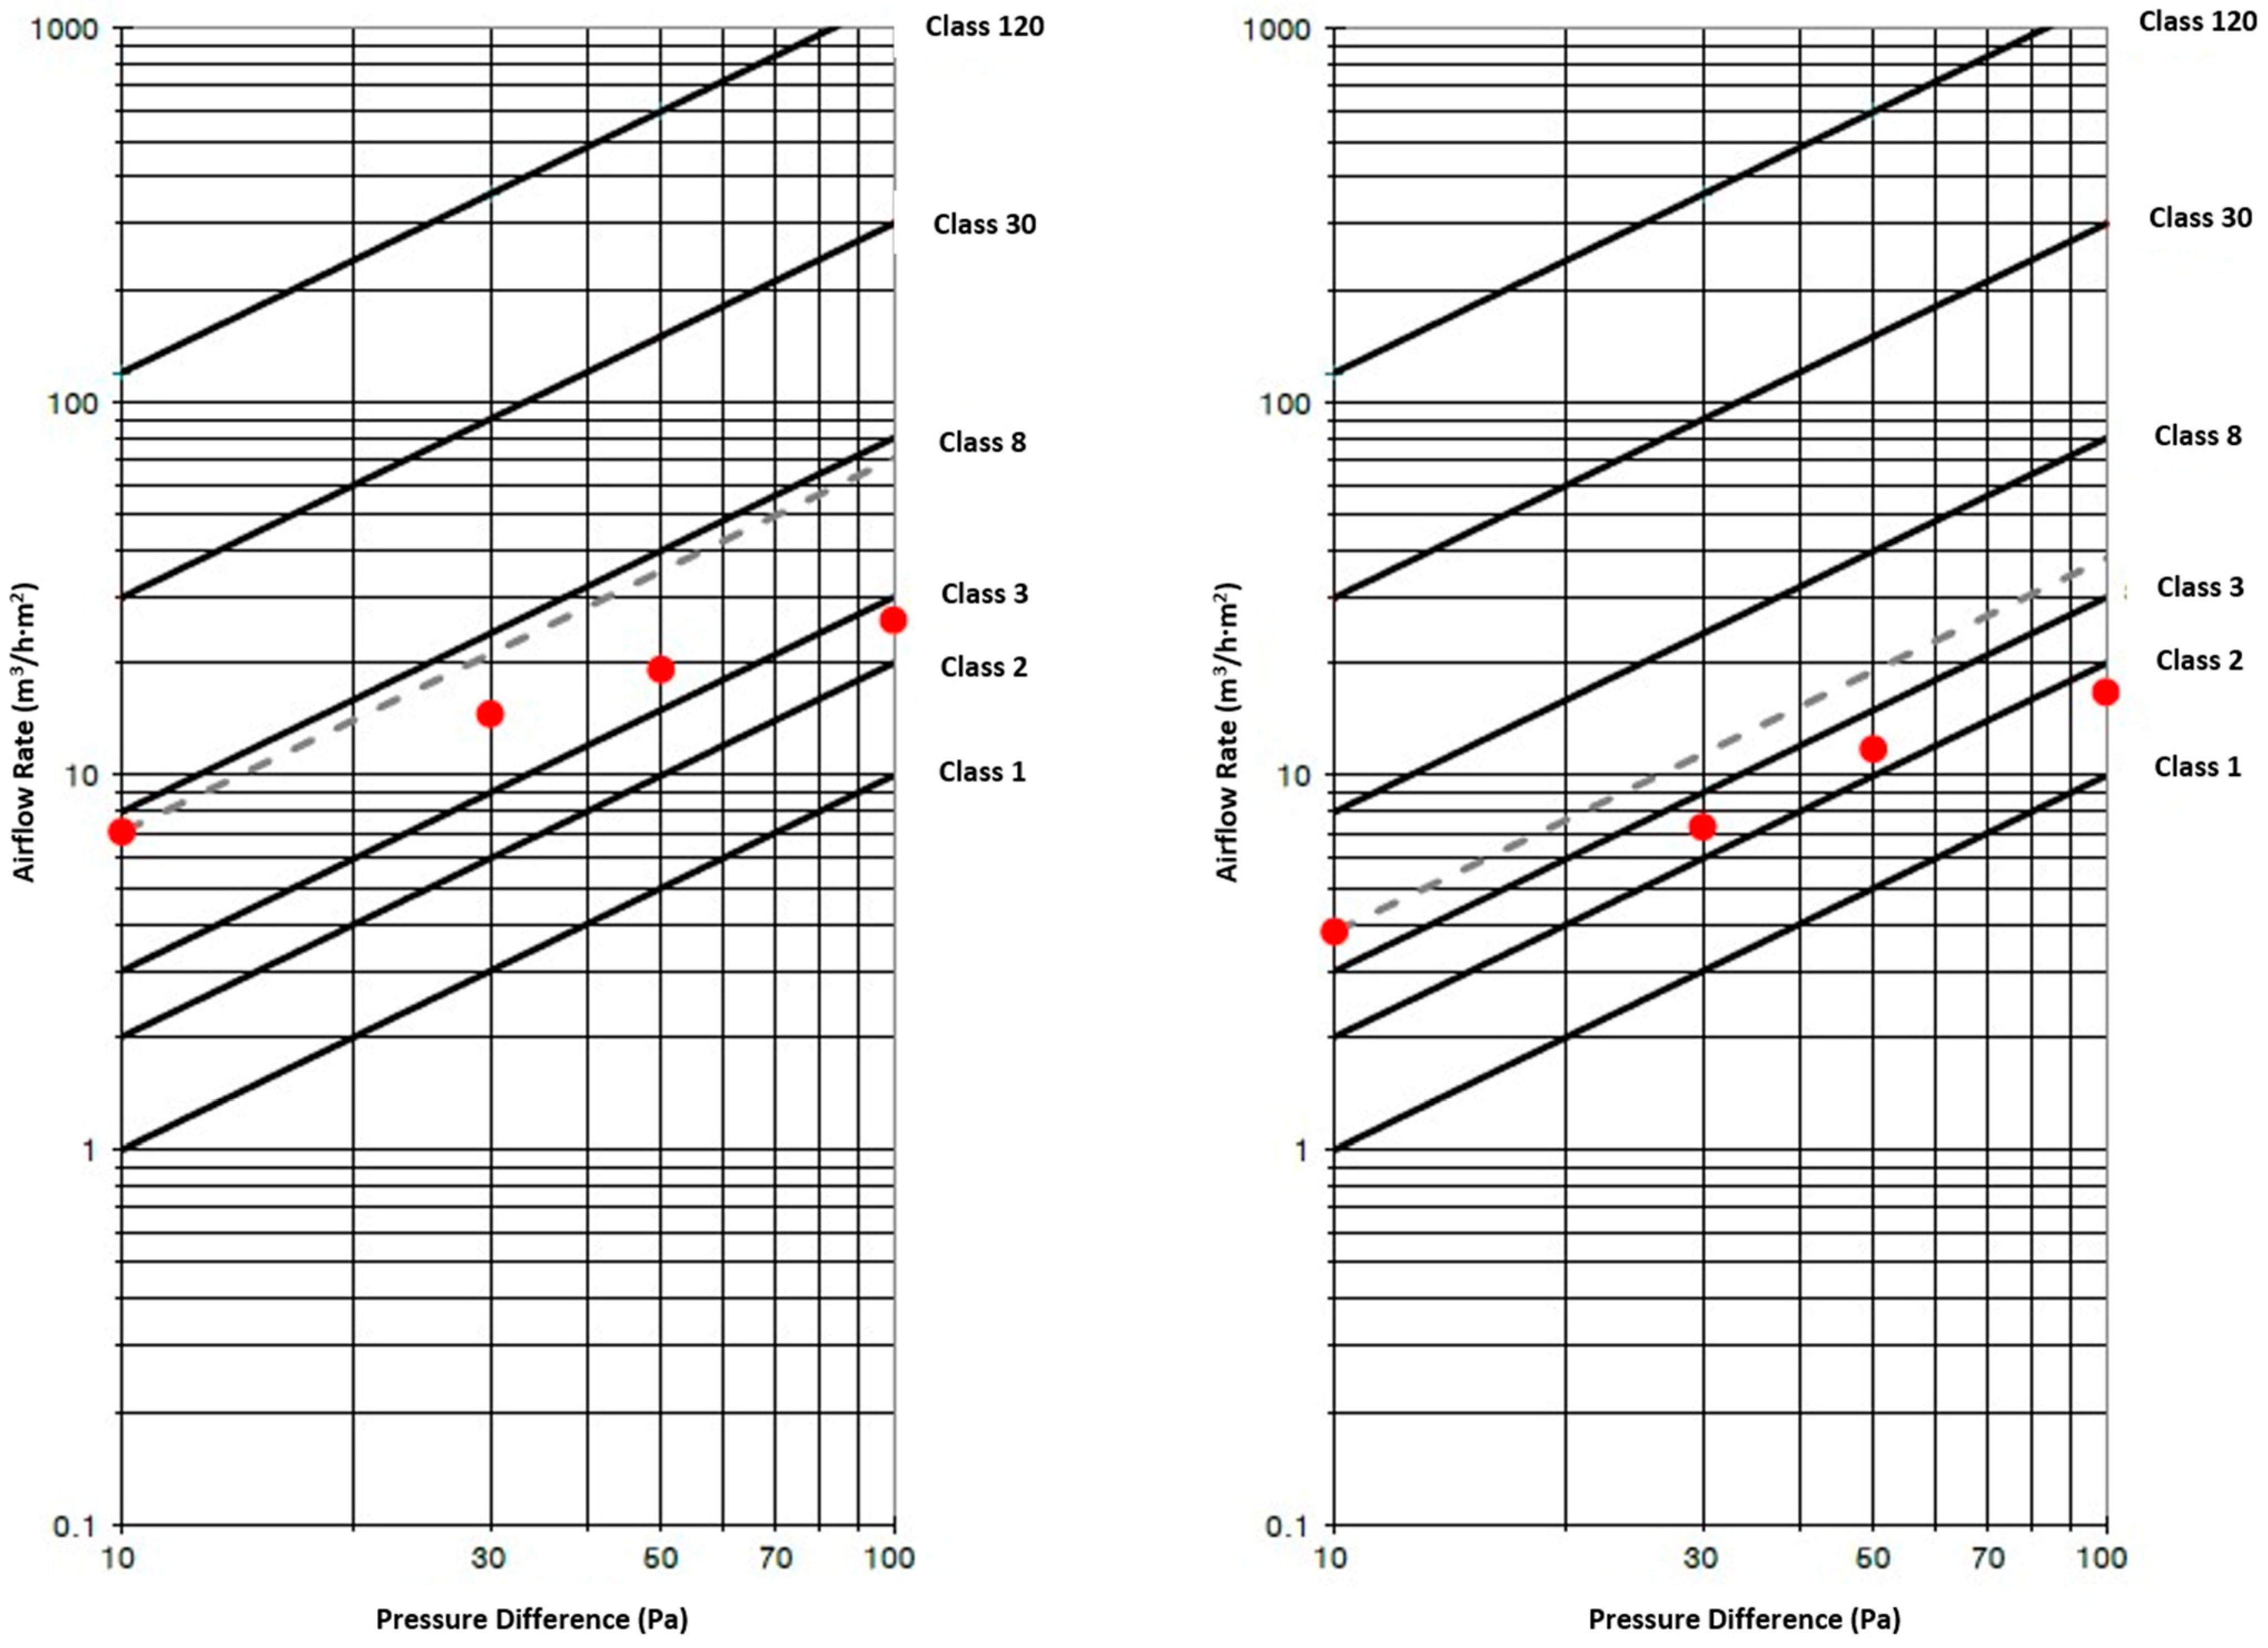
Prior to testing, a preconditioning phase was conducted. During this phase, the window was rapidly pressurized to 250 Pa to establish a reference state and ensure proper sealing around the window perimeter. Following preconditioning, air leakage measurements were performed across a series of pressure difference levels: 10, 30, 50, and 100 Pa, as shown in
Figure 7. At each pressure difference level, steady-state conditions were achieved before measuring the air leakage rate, which was determined by monitoring changes in pressure. The air leakage rate at each pressure difference level was determined using Equation (10), and the final air leakage rate was obtained from the average of the five measurements. At the two final air leakage rates of 10, 30, and 50 Pa, the maximum air leakage rate was selected. The total uncertainty of the window U-value and air leakage rate was calculated following the methodology outlined in [
37].
Here, is the measured flowrate (m3/h), A is the area of the window test sample (m2), is 1013 (hPa), is the atmospheric pressure in the test room (hPa), is 293(273 + 20) (K), and is the temperature in the test room (K).
2.2. Simulation Analysis
This section outlines the method for the simulation analysis. In South Korea, residential buildings over 30 years old account for 52% of the total housing stock [
4], and more than 50% of the population resides in apartment buildings [
38]. For this research, a typical middle-floor unit in an aging, government-subsidized apartment building was selected as a case study. The modeled building featured a long corridor and a rectangular floor plan, with a total floor area of 68 m
2.
The ECO2 program, developed by the Korean government and based on DIN V 18599 standards [
39], was used for the simulation analysis. This program used a quasi-steady-state algorithm to simulate the annual energy performance of buildings. The simulation focused on assessing the energy performance of the building to evaluate the impact of the proposed green retrofit technologies.
This research employed the ECO2 program following the procedure to investigate the impact of various input variables on the energy performance of a typical aging, government-subsidized apartment model. Simulations were conducted using the variations in key building characteristics based on the construction year. The analysis accounted for a range of construction years to reflect the updates of building codes and construction practices over time. The simulation results were systematically analyzed to identify key trends and relationships between the input variables and the annual energy performance. This approach provided insights into the influence of construction year and associated building characteristics on energy efficiency, highlighting opportunities for targeted improvements in retrofit strategies.
Table 3 presents a list of summarized parameters and their corresponding input values for the apartment model. The defined ranges for key parameters, such as Infiltration rate, Window U-value, and Wall U-value, enable the exploration of a wide spectrum of building scenarios for the built year and their subsequent impact on annual heating energy performance. The natural gas heating system used for the model had a capacity range of 5–40 kW and an efficiency of 75–93%, varying according to the construction year.
2.3. Utility Bill Analysis
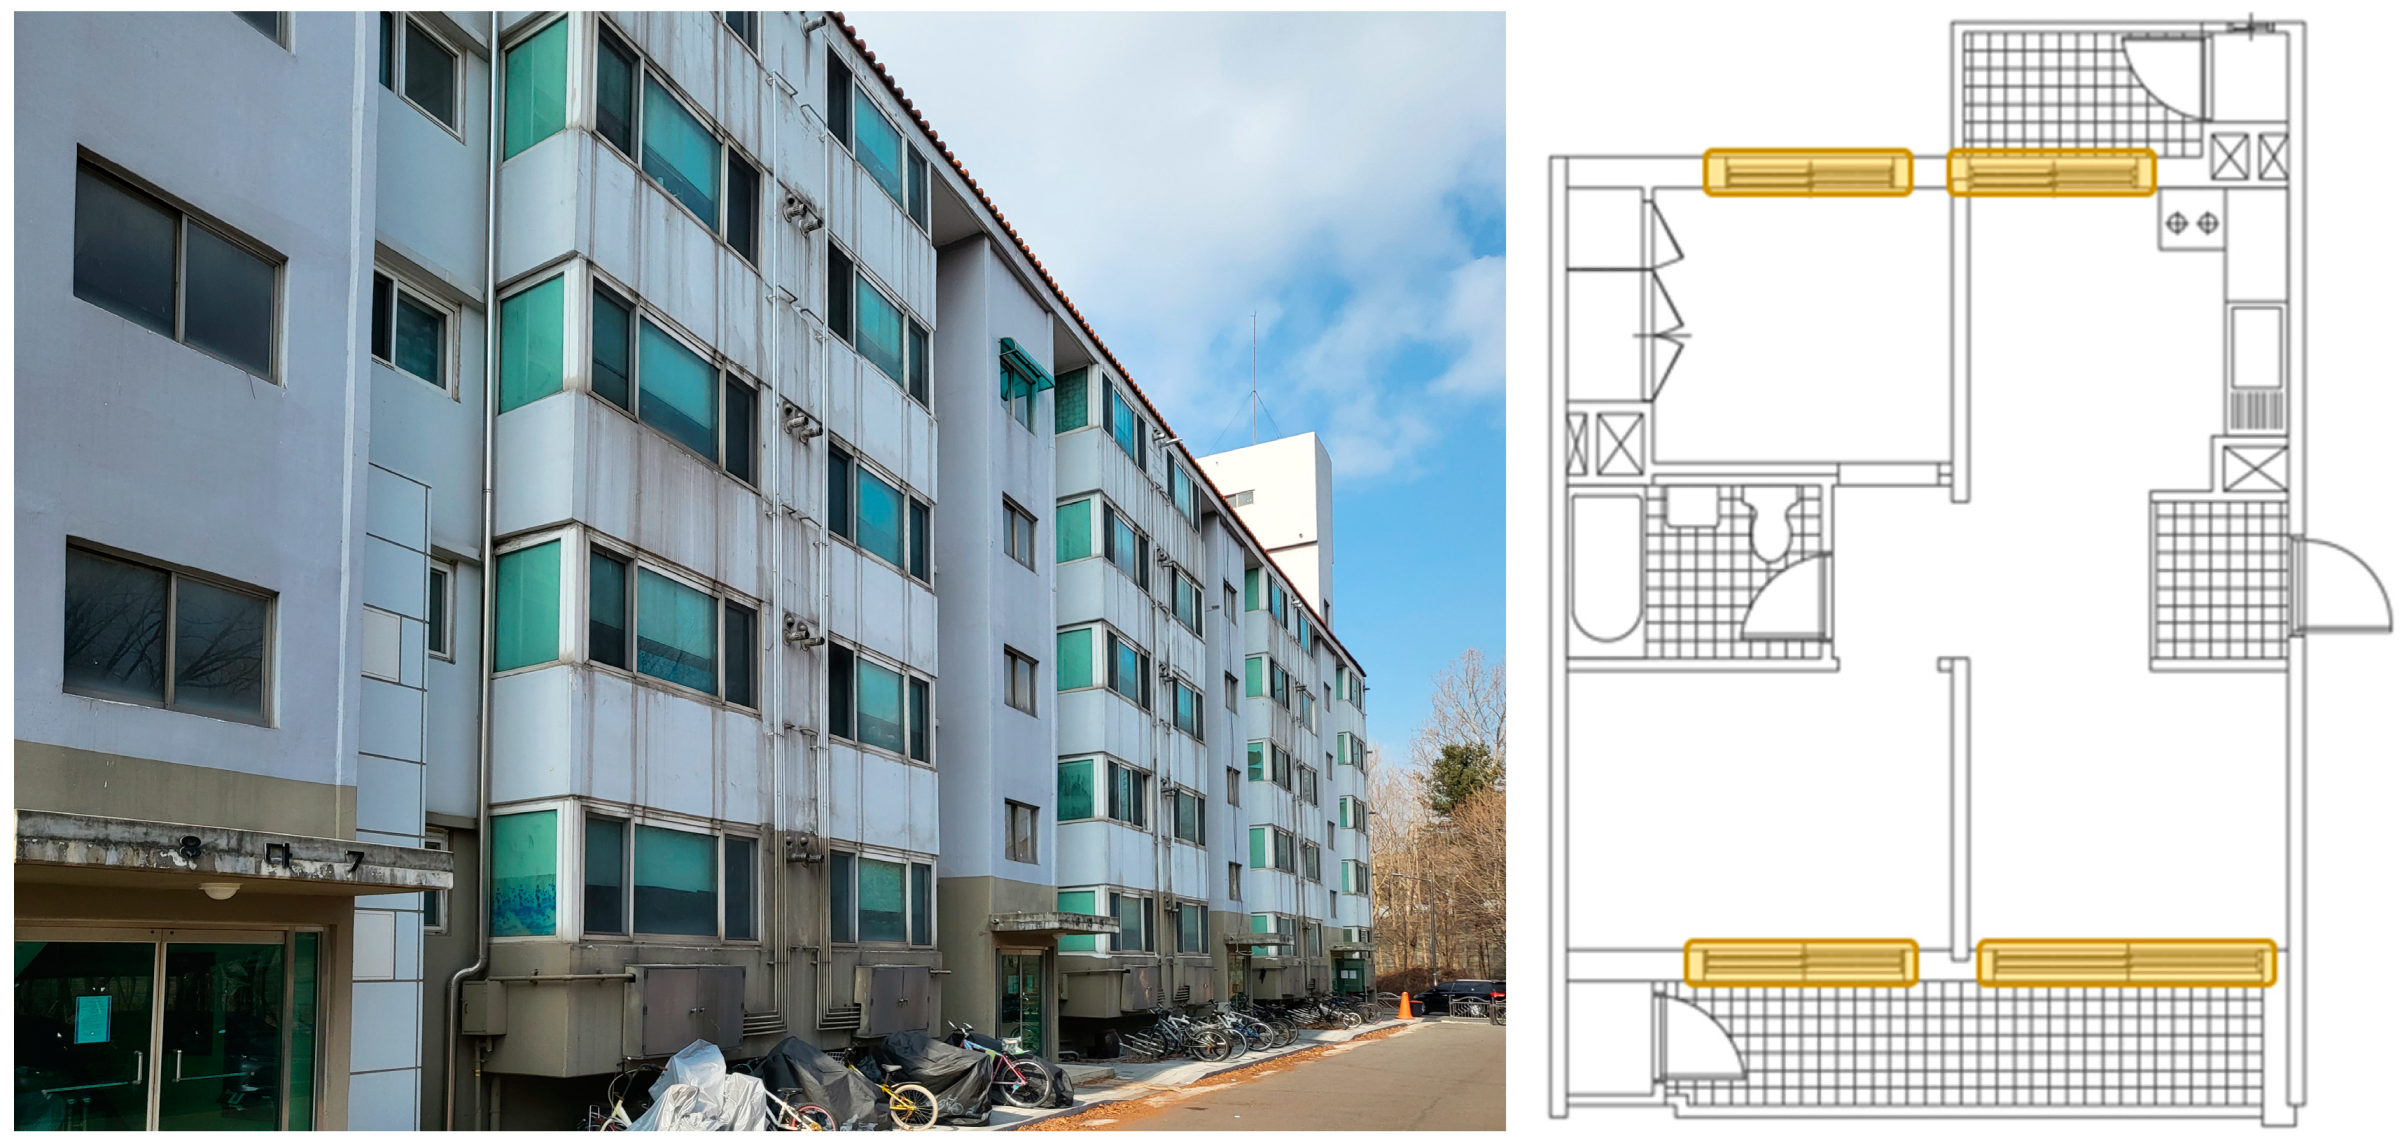
A case study apartment building located in the southwestern area of Seoul, South Korea, where a high concentration of older buildings existed, was selected for the utility bill analysis [
26].
Figure 8 shows a representative floor plan of the selected apartment building and the locations where the green retrofit technologies were installed for the windows. Constructed in 1993, the apartment units were over 30 years old. The size of the selected units was 46.9 m
2. The secondary glazing system was installed in May or June 2023. Six residences within the building were chosen for the utility bill analysis.
The method was used to calculate weather-adjusted energy savings, including data preprocessing, change-point regression analysis, model evaluation, and the calculation of energy savings. The initial step involved preprocessing the data of utility bills and weather data to ensure data quality and consistency. Outdoor temperature data were obtained from the Korea Meteorological Administration’s Jongno District weather station [
40], which was located approximately 12.5 km away from the selected apartment buildings. Subsequently, a change-point linear regression analysis was conducted to identify significant shifts in energy consumption patterns. Following the regression analysis, the model’s accuracy and goodness-of-fit were evaluated by assessing metrics of the coefficient of determination (R
2) and Coefficient of Variation of the Root-Mean-Square Error (CV-RMSE). Finally, the weather-adjusted energy savings were calculated based on the results of the change-point analysis.
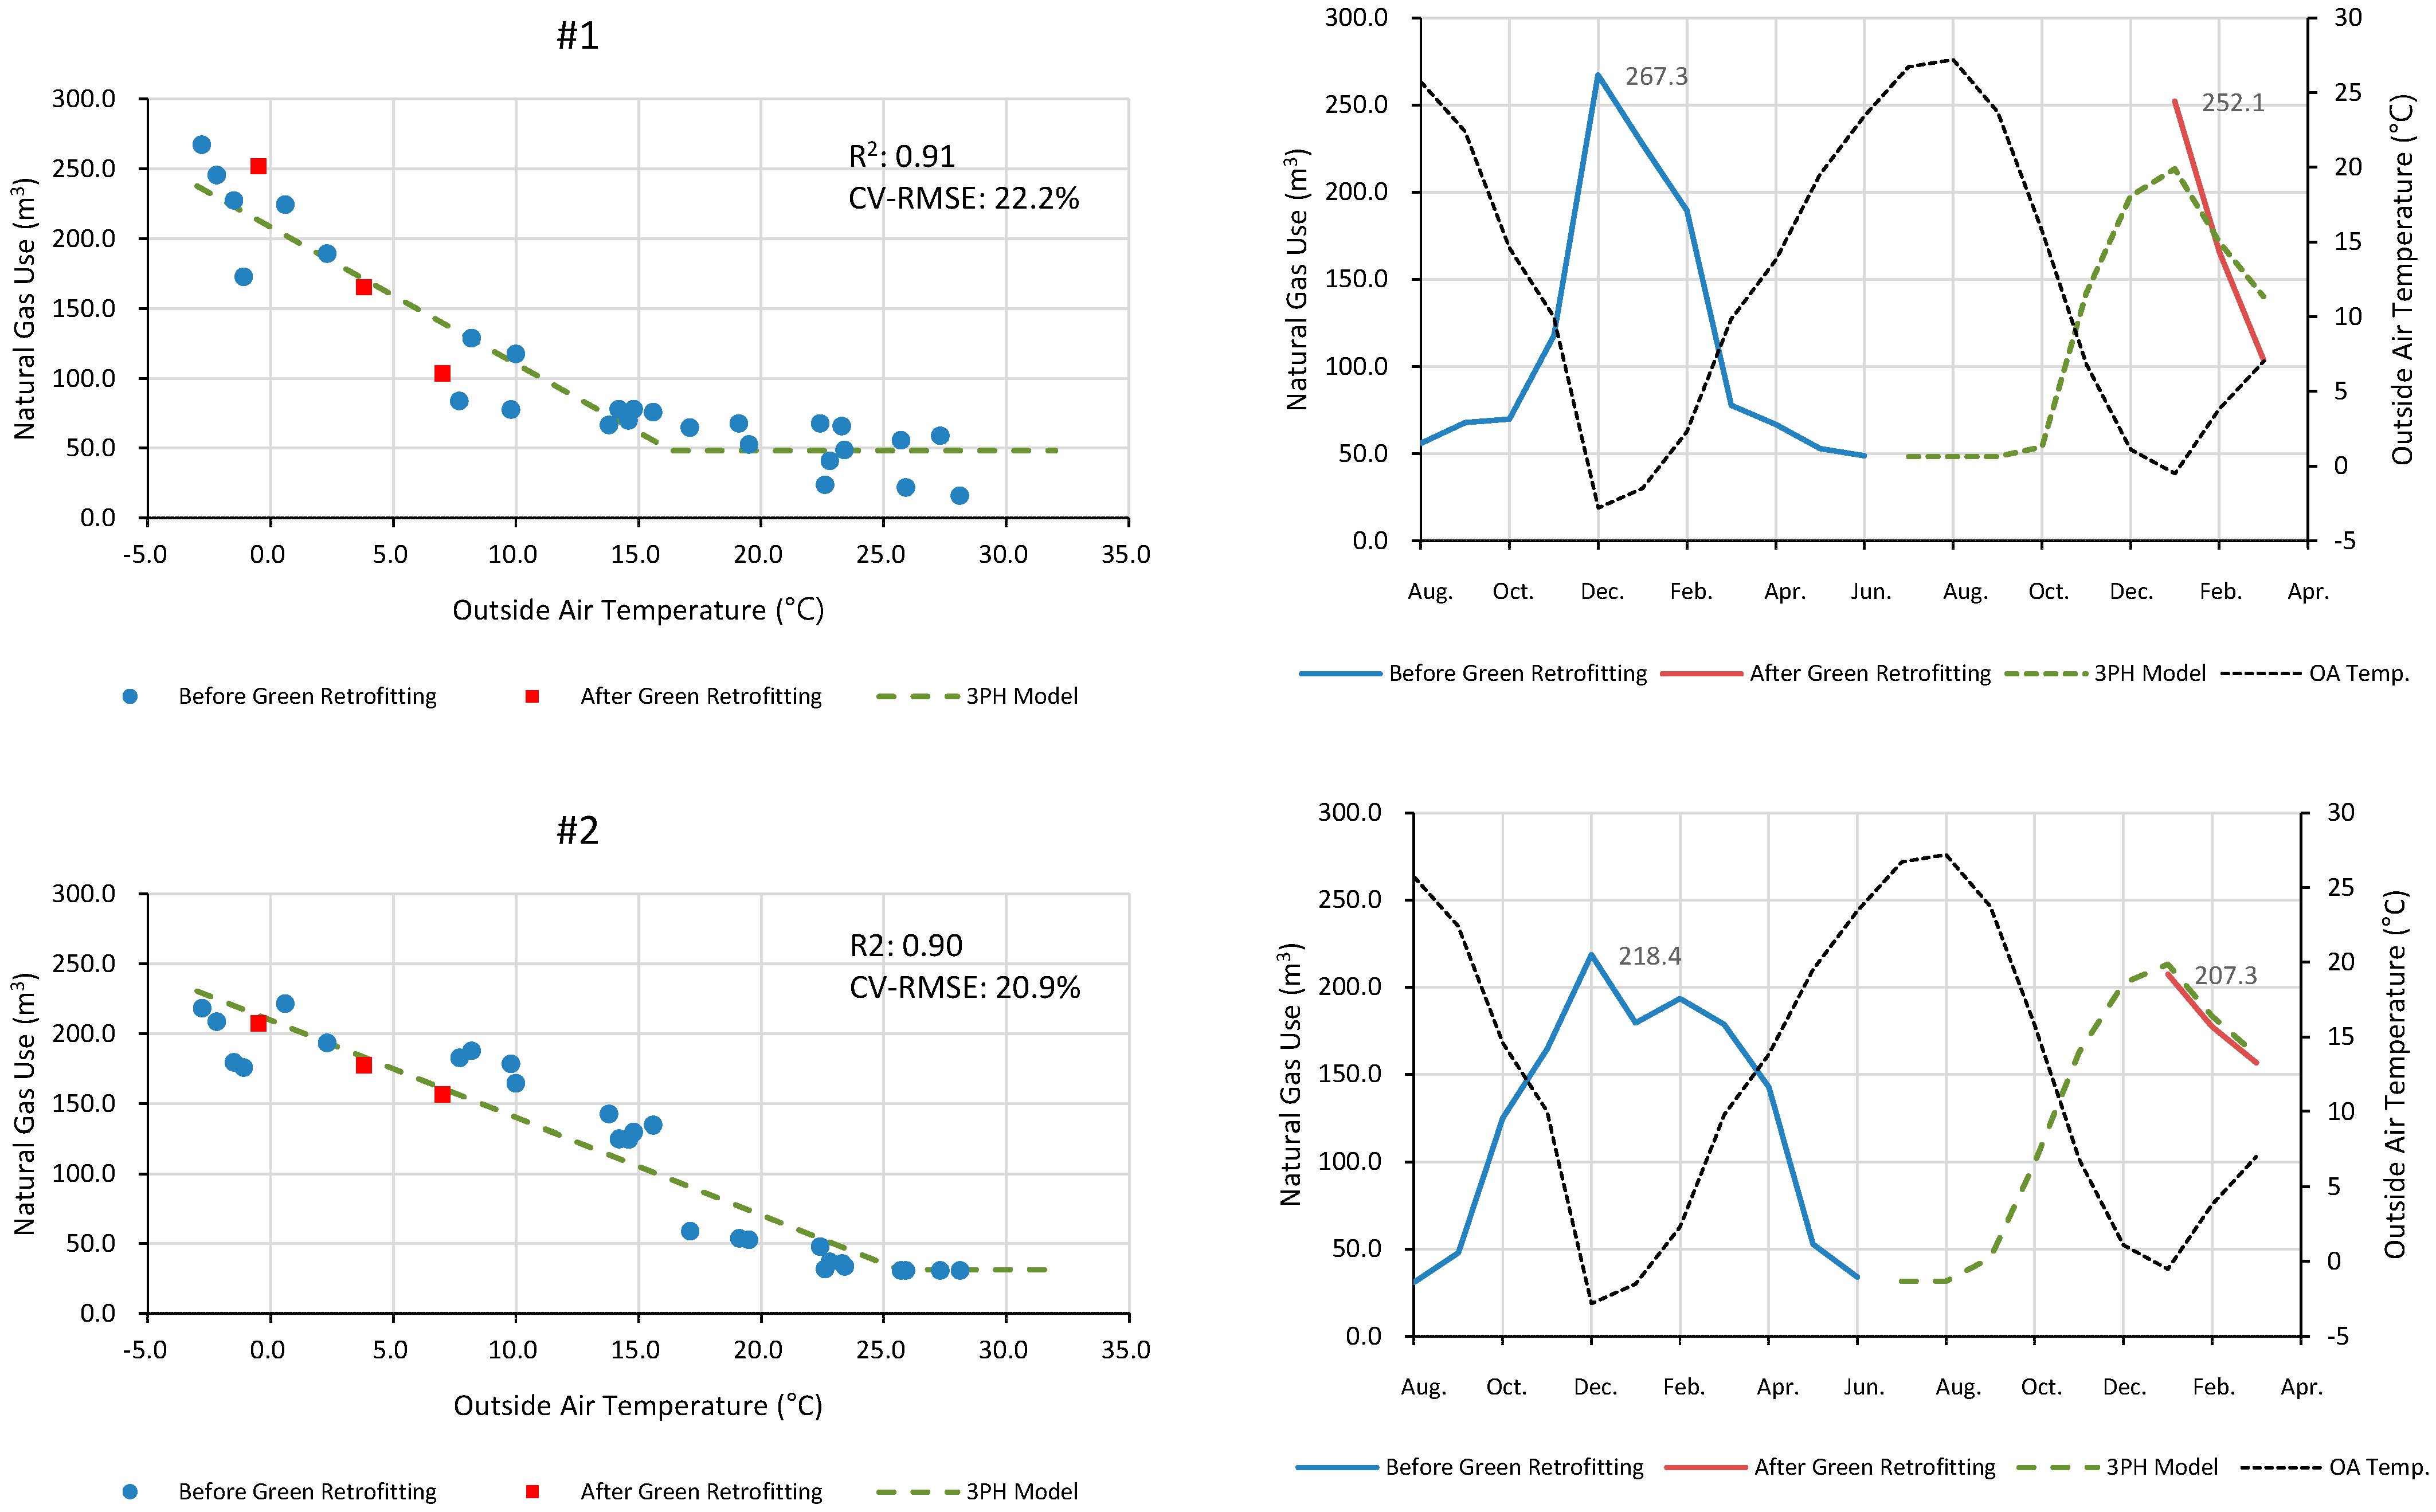
This research employed the Inverse Modeling Toolkit (IMT) [
41], developed by ASHRAE, for data analysis. The three-parameter heating (3PH) change-point model, as expressed in Equation (11), was used. Natural gas consumption was measured in cubic meters (m
3), representing the volume of gas at standard temperature and pressure conditions: 0 °C and 1 atmosphere (101.325 kPa).
Here, Etot is the total natural gas use, TOA is the monthly average outdoor air temperature, Ew.i. is the non-weather-related natural gas use, HS is the heating slope, and Th.p. is the heating change-point temperature. The notation means that if TOA is higher than Th.p., then the value is changed to zero.
The performance of the 3PH model was evaluated using the coefficient of determination (R
2) and the Coefficient of Variation of the Root-Mean-Square Error (CV-RMSE), as defined in Equations (12) and (13), respectively. R
2 assesses the model’s overall fit, while CV-RMSE provides a standardized measure of prediction accuracy. CV-RMSE was chosen as a performance metric because it emphasizes the model’s predictive capabilities rather than simply reflecting the variability within the data, as RMSE does [
42].
Here, is natural gas use from the monthly bill data, is natural gas use predicted by the change-point regression model, is the average of natural gas use data from the monthly bill data, is the number of natural gas use data points, and is the number of parameters.
Following the method of a previous study [
43], statistical thresholds for model evaluation were established as an R
2 value of 70% and a CV-RMSE of 30%. Recognizing the potential for increased variability in natural gas consumption in residential settings due to factors such as occupant behavior and domestic hot water usage, a 10% flexibility was applied to the CV-RMSE threshold, setting the upper limit at 40%.
4. Conclusions
This research evaluated the effectiveness of easy-to-implement green retrofit technologies for windows using three distinct approaches: experimental analysis, simulation analysis, and utility bill analysis. The primary objective was to enhance the energy efficiency of older residential buildings by focusing on three key attributes: high efficiency, cost-effectiveness, and ease of implementation. The findings demonstrated the significant potential of secondary glazing and windproofing materials in improving building performance.
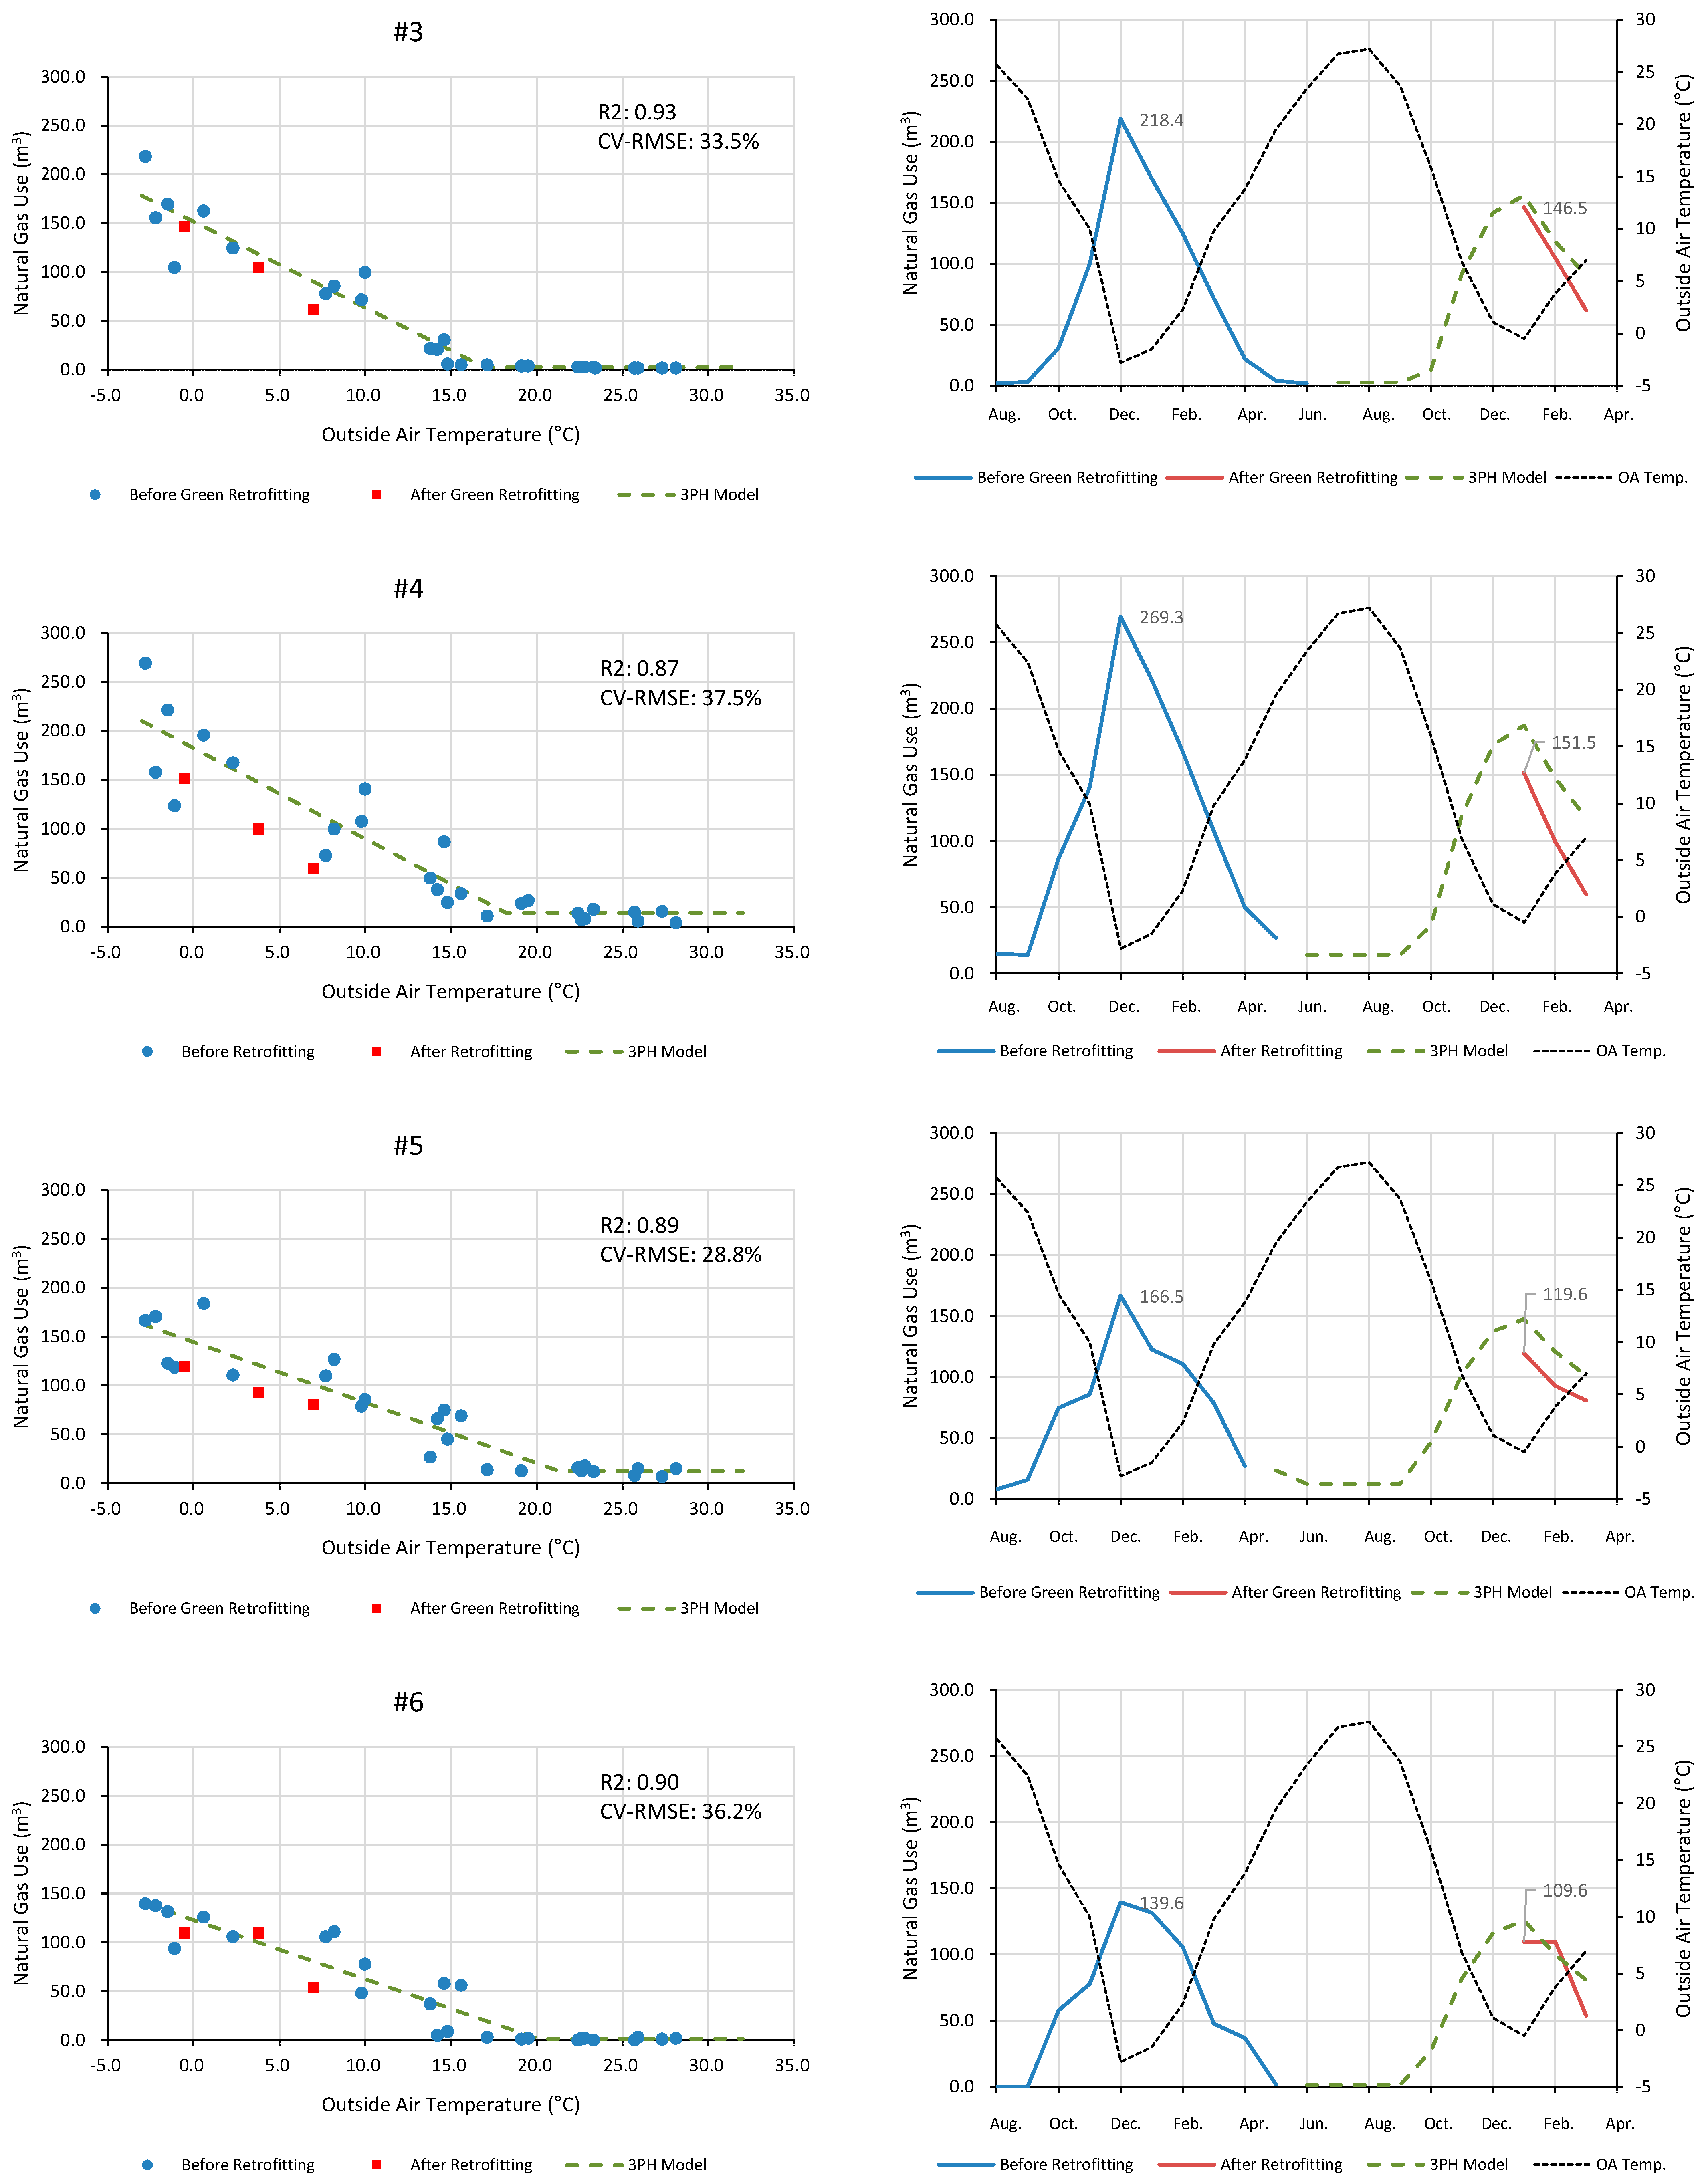
In the experimental analysis, window thermal performance was assessed using the KS F 2278:2017 standard, while airtightness was evaluated based on the KS F 2292:2019 standard. The results indicated a 21.1% reduction in the window U-value and a 45.9% improvement in airtightness, highlighting the effectiveness of the secondary glazing system. The simulation analysis utilized the ECO2 program, which applies a quasi-steady-state algorithm to estimate the annual energy performance of a typical middle-floor unit in an aging, government-subsidized apartment building. The findings revealed heating energy reductions ranging from 5.4% to 16.3%, depending on the construction year of the building. The utility bill analysis was conducted using the change-point regression model (3PH model) to estimate weather-adjusted natural gas savings for six households. The results showed savings ranging from 0.6% to 31.3% between January and March 2024.
Beyond improving thermal insulation, the developed retrofit technologies provided additional advantages, including condensation prevention and sound insulation. Furthermore, the window sealing liner and end-sealing cap enhanced airtightness, reduced external noise, and protected against dust, insects, and wind-induced vibrations. These benefits underscored the versatility and practicality of the proposed solutions.
Economic analysis highlighted the cost-effectiveness of the retrofit technologies. The production and installation costs of the secondary glazing system and sealing components were significantly lower than the expense of full window replacements, making them an affordable and scalable solution. In addition, a resident satisfaction survey indicated high approval ratings, with occupants reporting improved airtightness, noise reduction, dust prevention, and ease of window operation.
The findings of this research provide a solid foundation for future research and policy development to promote energy-efficient retrofit technologies in older residential buildings. Further studies should focus on evaluating the long-term performance of these solutions under diverse climatic conditions and across a broader range of residential building types. Comprehensive economic assessments of different retrofit strategies will help guide policy decisions and encourage wider adoption. By integrating cost-effective, high-efficiency, and easy-to-implement retrofit technologies, older residential buildings can achieve significant heating energy savings, reduced carbon emissions, and improved occupant comfort. Expanding the adoption of these low-cost and scalable solutions is essential for enhancing housing welfare, upgrading aging building stock, and advancing carbon neutrality in South Korea and beyond.


