Article

Pathway Simulation and Evaluation of Carbon Neutrality in the Sichuan-Chongqing Region Based on the LEAP Model

1
School of Automation, Chengdu University of Information Technology, Chengdu 610225, China
2
Power System Security and Operation Key Laboratory of Sichuan Province, State Grid Sichuan Electric Power Research Institute, Chengdu 610041, China
3
Artificial Intelligence Key Laboratory of Sichuan Province, Sichuan University of Science & Engineering, Yibin 644000, China
4
College of Carbon Neutrality Future Technology, Sichuan University, Chengdu 610065, China
*
Author to whom correspondence should be addressed.
Sustainability 2025, 17(7), 3233; https://doi.org/10.3390/su17073233
Submission received: 29 January 2025 / Revised: 25 March 2025 / Accepted: 29 March 2025 / Published: 4 April 2025

Abstract

Facing the intensifying global climate change pressures and China’s strategic commitment to carbon peaking and carbon neutrality, this study focuses on the multiple challenges faced by the Sichuan-Chongqing region, the economic core of southwest China, in optimizing its energy structure, controlling carbon emissions, and exploring sustainable development pathways. The study uses the LEAP (Long-range Energy Alternatives Planning) model to simulate energy demand and carbon emission trends under different policies and innovative technologies by constructing various scenarios. By conducting a comparative analysis of the LEAP model’s projection results under four scenarios (baseline scenario, alleviative scenario, low-carbon scenario, and high-efficiency low-carbon scenario), this study quantifies the energy demand and carbon emission pathways in the Sichuan-Chongqing region. The results show that optimizing the energy structure and improving energy efficiency are key to achieving carbon neutrality in the Sichuan-Chongqing region. Under the high-efficiency low-carbon scenario, the region is expected to reach peak energy consumption by 2050 and achieve a significant reduction in carbon emissions by 2060, with emissions dropping to 58.1% of the total emissions in 2050 and falling below 25% of the base year’s emissions. The industry sector is expected to account for 77.6% of total emissions. This study highlights the positive impact of widespread clean energy adoption on carbon reduction and demonstrates the importance of industrial restructuring and low-carbon technological innovation, among other green technologies, in promoting economic and environmental sustainability. Furthermore, by quantitatively analyzing carbon emission pathways under different scenarios, the study provides quantitative support and policy references for Sichuan-Chongqing and other regions to implement more scientific emission reduction measures and carbon neutrality pathway planning. The findings contribute to advancing regional collaborative governance, enhancing the scientific rigor of policy implementation, and fostering global climate governance cooperation, ultimately contributing to the coordinated and sustainable development of the ecological environment, economy, and society, embodying the “Sichuan-Chongqing efforts”.

1. Introduction

In the context of global efforts to address climate change, achieving carbon peaking and carbon neutrality has become a critical strategic goal for countries [1]. It helps protect ecosystems, promote high-quality economic development, and improve the overall well-being of society, directly linking to the sustainable development of the economy, society, and the environment. As the largest carbon emitter globally, China has clearly set the targets of reaching carbon peaking by 2030 and achieving carbon neutrality by 2060, outlining specific requirements for future development planning and policy formulation [2]. Cities, as hubs of economic and social activities, account for a significant portion of energy consumption and carbon emissions, playing a crucial role in the process of carbon neutrality. The low-carbon transformation of cities not only involves adjustments to the energy structure, industrial upgrades, transportation, and construction but also requires coordinated innovation through policies, technologies, and market mechanisms [3].
As a pivotal economic hub in southwestern China, the Sichuan-Chongqing region has achieved GDP growth rates surpassing the national average in 2024, driven by its digital economy, advanced manufacturing, and automotive industry clusters. While experiencing rapid economic growth, the region is actively promoting sustainable development and is committed to building a resource-efficient and environmentally friendly society. Endowed with abundant hydro-power and natural gas resources, Sichuan leads the nation in hydro-power installed capacity [4], which dominates its electricity mix, while the region collectively contributes nearly one-third of China’s natural gas output, primarily supplied to eastern regions. Renewable energy accounts for 70% and 40% of total energy consumption in Sichuan and Chongqing, respectively, far exceeding national averages. However, the region faces significant challenges in optimizing its energy structure and enhancing carbon emission controls due to its dual industrial landscape—coexisting traditional energy-intensive industries and emerging green sectors. Key obstacles include structural rigidity (e.g., hydropower’s inherent volatility), high capital requirements for low-carbon retrofits in traditional industries, natural gas supply–demand imbalances, and weaknesses in grid interconnection and energy storage systems [5]. Exploring carbon neutrality strategies in Sichuan Province and Chongqing City is not only crucial for advancing the region’s energy transition but also provides a practical theoretical reference for national-level carbon neutrality initiatives [6,7].
Currently, research on carbon neutrality pathways has made some progress. First, many studies focus on carbon emission analysis in individual industries or sectors. For example, some research has explored the carbon reduction pathways in the power sector, investigating the application of clean energy substitution and energy efficiency improvements in power systems (e.g., Liu and Wu 2024) [8]. In the industrial sector, researchers have primarily focused on the application of industrial efficiency technologies and carbon capture, utilization, and storage (CCUS) technologies (e.g., Liu et al., 2017) [9]. However, these studies often lack a comprehensive analysis of entire urban systems and fail to reflect the synergistic effects between multiple sectors [10,11,12]. As a result, this study tends to provide solutions for specific sectors (such as industry and transportation) rather than addressing the challenges of carbon neutrality at the city level [13,14,15].
Second, existing studies mostly concentrate on short- and medium-term carbon peaking, with less focus on long-term carbon neutrality pathways [16]. For instance, Michel et al. (2023) [17] used quantitative models to analyze the feasibility of carbon peaking in China by 2030 and proposed several policy recommendations but did not delve into the pathway for achieving carbon neutrality by 2060. While short- and medium-term carbon peaking research is undoubtedly important, the long-term goal of carbon neutrality involves more structural transformations, spans a longer time frame, and requires coordination across multiple sectors of technological development and policy support [18]. Consequently, short-term studies alone cannot fully meet the demands for long-term low-carbon development.
Moreover, there is relatively little research on the coordinated effects of multiple pathways and technologies. Although many studies discuss various carbon reduction pathways, they often focus on a single type of measure, such as energy efficiency improvement or the promotion of renewable energy (e.g., Bai et al., 2024) [19]. However, the effect of single measures is limited, especially for large cities and economically developed regions, where reliance on a single pathway makes it challenging to achieve carbon neutrality. A few studies have explored comprehensive pathways, such as combining demand-side management, clean energy transition, and carbon sink technologies to reach carbon neutrality goals (e.g., Huang et al., 2023) [20], but they still lack a quantitative analysis of the synergy between different measures. Additionally, cities and regions vary in economic structure, energy resource endowment, and carbon emission characteristics, implying that each city requires a personalized carbon neutrality pathway solution.
Lastly, most existing studies rely on qualitative analysis, with relatively few quantitative assessments, especially for multi-sector, multi-pathway evaluations in complex urban systems. For instance, many studies have proposed recommendations for carbon reduction measures and policy frameworks, but these studies lack rigorous quantitative evaluation methods and cannot accurately predict carbon emission trends under different policy combinations or their contribution to city-level carbon neutrality goals (e.g., Liang et al., 2024) [21,22,23]. Only through quantitative models can policymakers be provided with scientific and reliable decision-making support.
The LEAP (Long-range Energy Alternatives Planning) model is a flexible energy–environment system modeling tool that can simulate energy demand, carbon emission pathways, and the impacts of various policies and technological measures on carbon emissions [24]. Using the LEAP model to explore carbon neutrality pathways not only enables a bottom-up analysis of the effects of different energy transition intensities on carbon emissions but also facilitates a cross-sectoral analysis of the synergistic effects of carbon reduction among various industries, along with an evaluation of the role of innovative technologies in achieving carbon neutrality; therefore, the LEAP model provides scientific support for countries and regions in formulating sustainable development strategies, advancing energy transitions, reducing carbon emissions, and enhancing economic, social, and environmental sustainability. Previous research using the LEAP model in various regions of China mainly focuses on the following four aspects:
(1) National and regional energy system modeling [10] (e.g., the national energy technology model C3IAM/NET (REF), multi-model collaborative analysis of the power industry).
(2) Exploration of localized pathways [25] (e.g., hydropower-dominated and diversified transitions, synergy between renewable energy and energy storage, integration of abandoned mineral resources with new energy).
(3) Cross-sectoral coordination and policy simulation [26] (e.g., assessing the impact of different carbon pricing scenarios on industries through carbon emission trading system simulations).
(4) Support for technological innovation and industrial transformation [27] (e.g., evaluation of hydrogen energy and carbon capture technologies, planning of new power systems)
In these studies, the LEAP model proved to be a useful tool in providing quantitative references and decision support for local governments in formulating low-carbon transition policies. Additionally, this study can serve as a scientific basis for other regions in China to conduct LEAP-based energy system modeling, cross-sectoral coordination, policy simulations, and localized pathway exploration.
To address the limitations of existing research, this paper proposes a comprehensive carbon neutrality pathway simulation method for the Sichuan-Chongqing region based on the LEAP model. Unlike traditional qualitative analyses [28,29], this approach integrates energy consumption and carbon emission data from multiple sectors using scenario analysis to simulate carbon emission changes under different policies and technological measures. By examining the interactions among factors such as economic growth, energy structure, industry, and transportation in the Sichuan-Chongqing region, the study assesses the contributions and synergies of various emission reduction measures, providing robust support for formulating customized carbon neutrality strategies. It aims to promote the development of a lower-carbon, more efficient, and renewable energy system in the Sichuan-Chongqing region while optimizing resource allocation and enhancing environmental resilience. Furthermore, the methodology proposed in this study can serve as a reference for other regions, contributing to sustainable development at both national and global scales and providing decision-making support for green, low-carbon transitions and long-term ecological improvement.

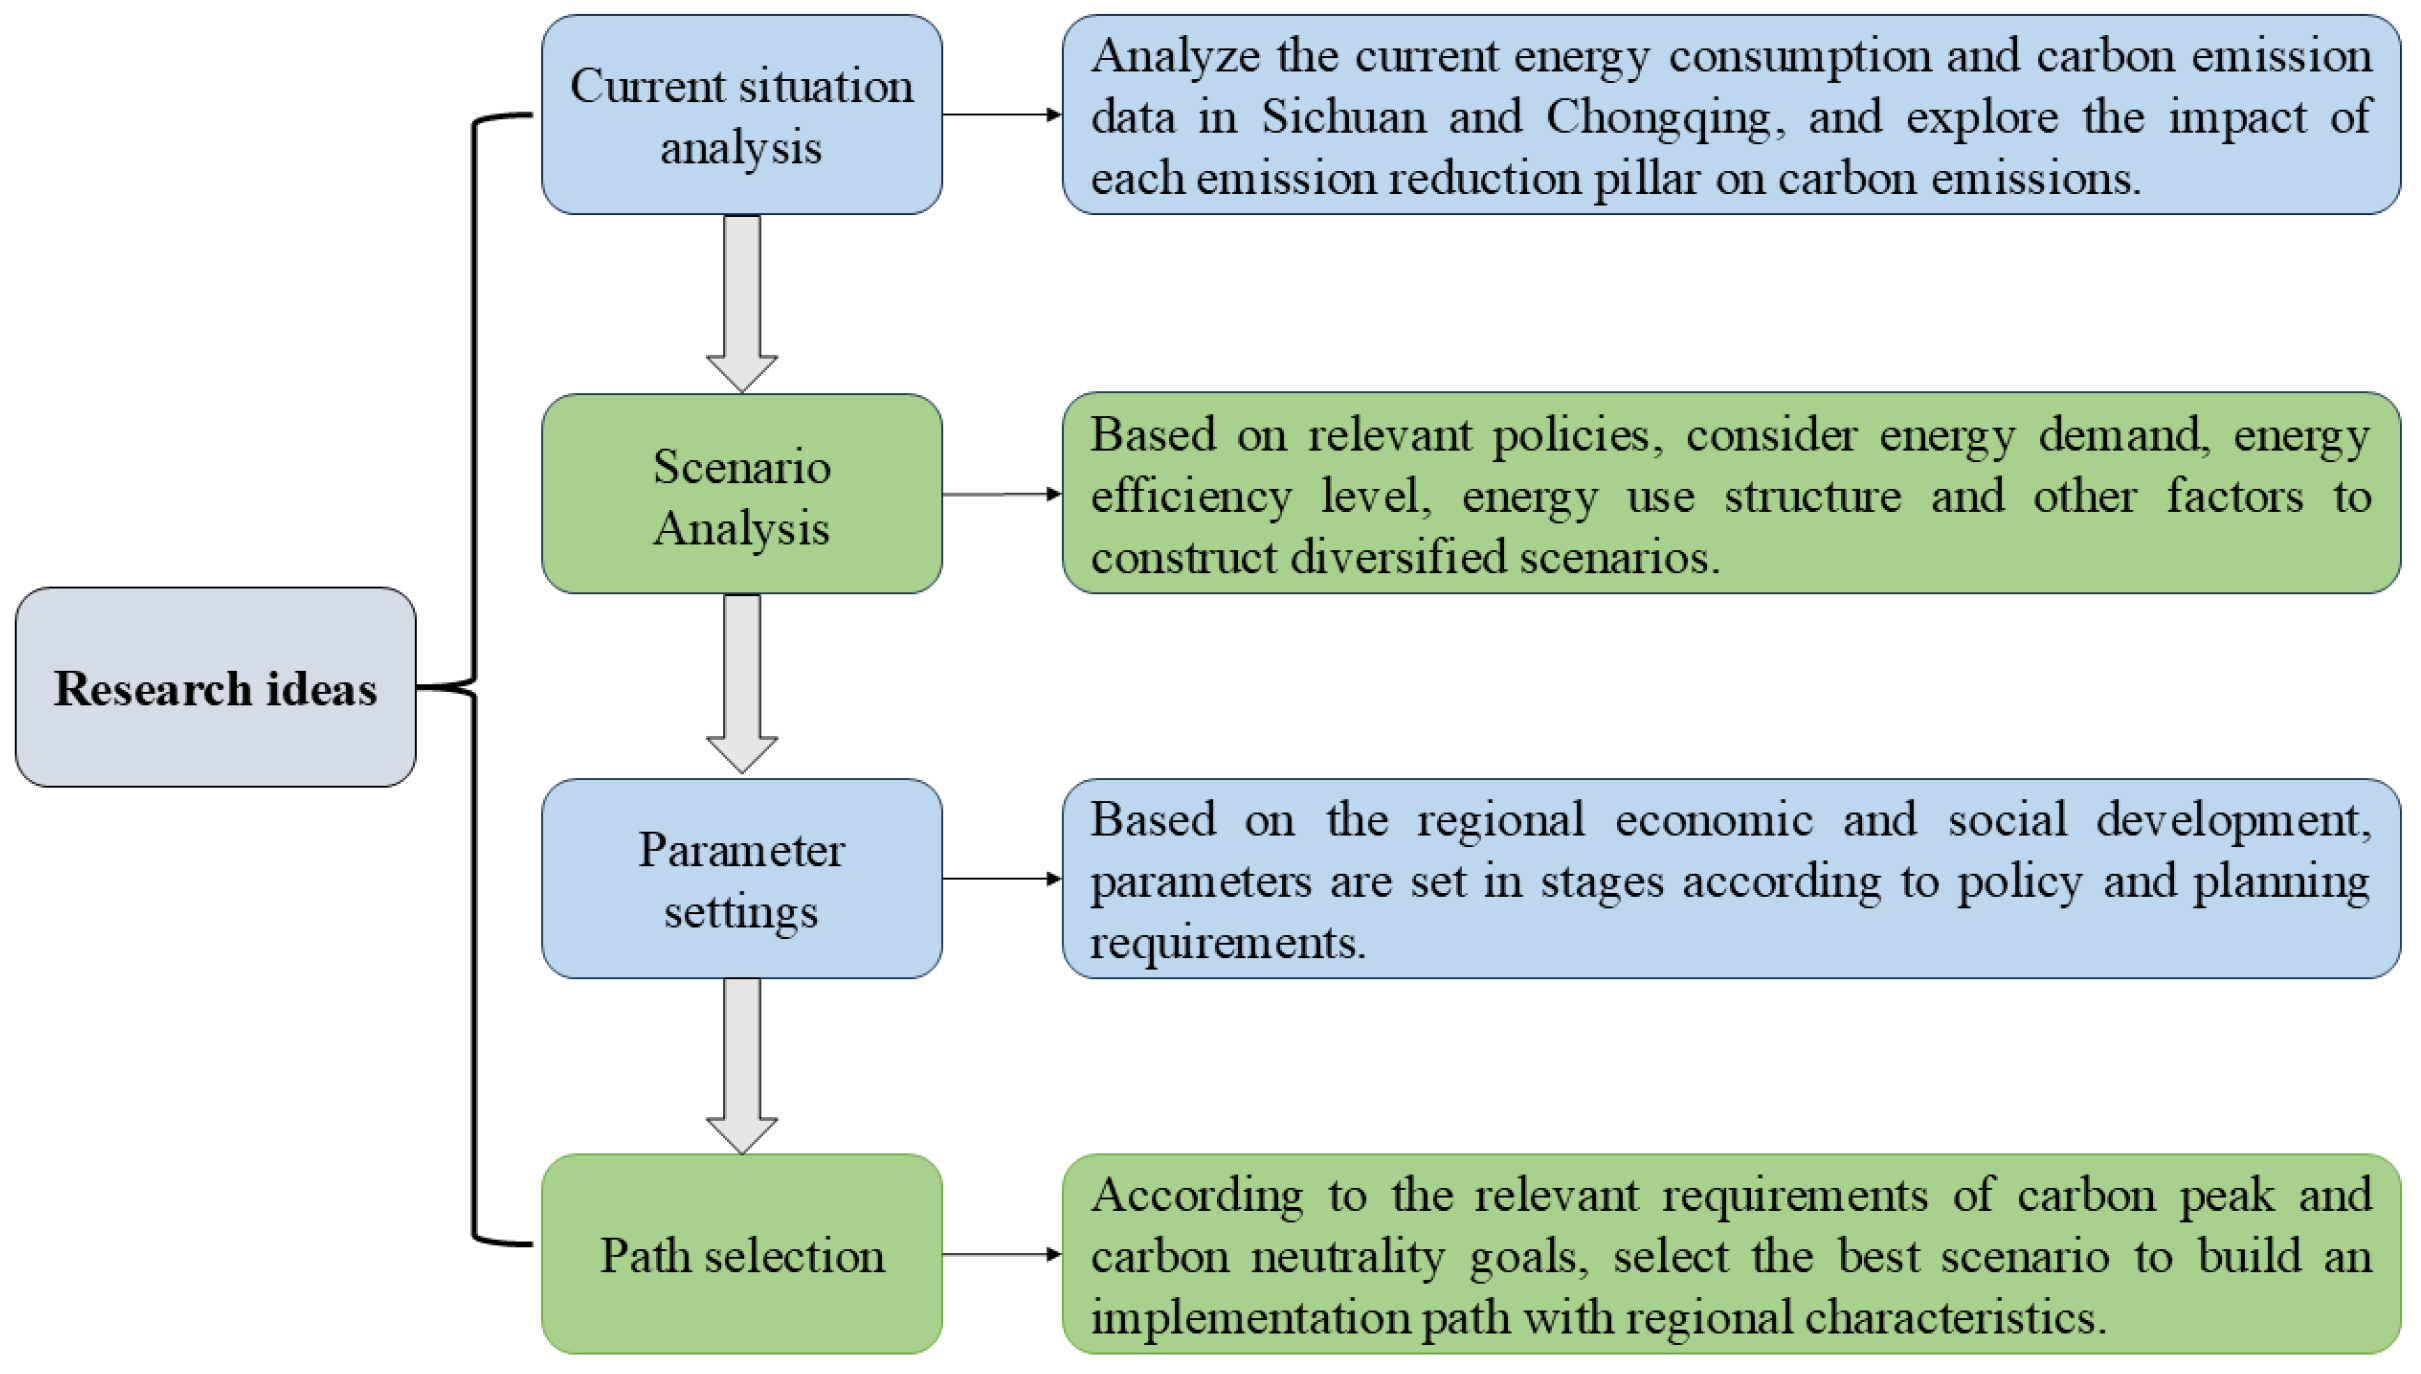
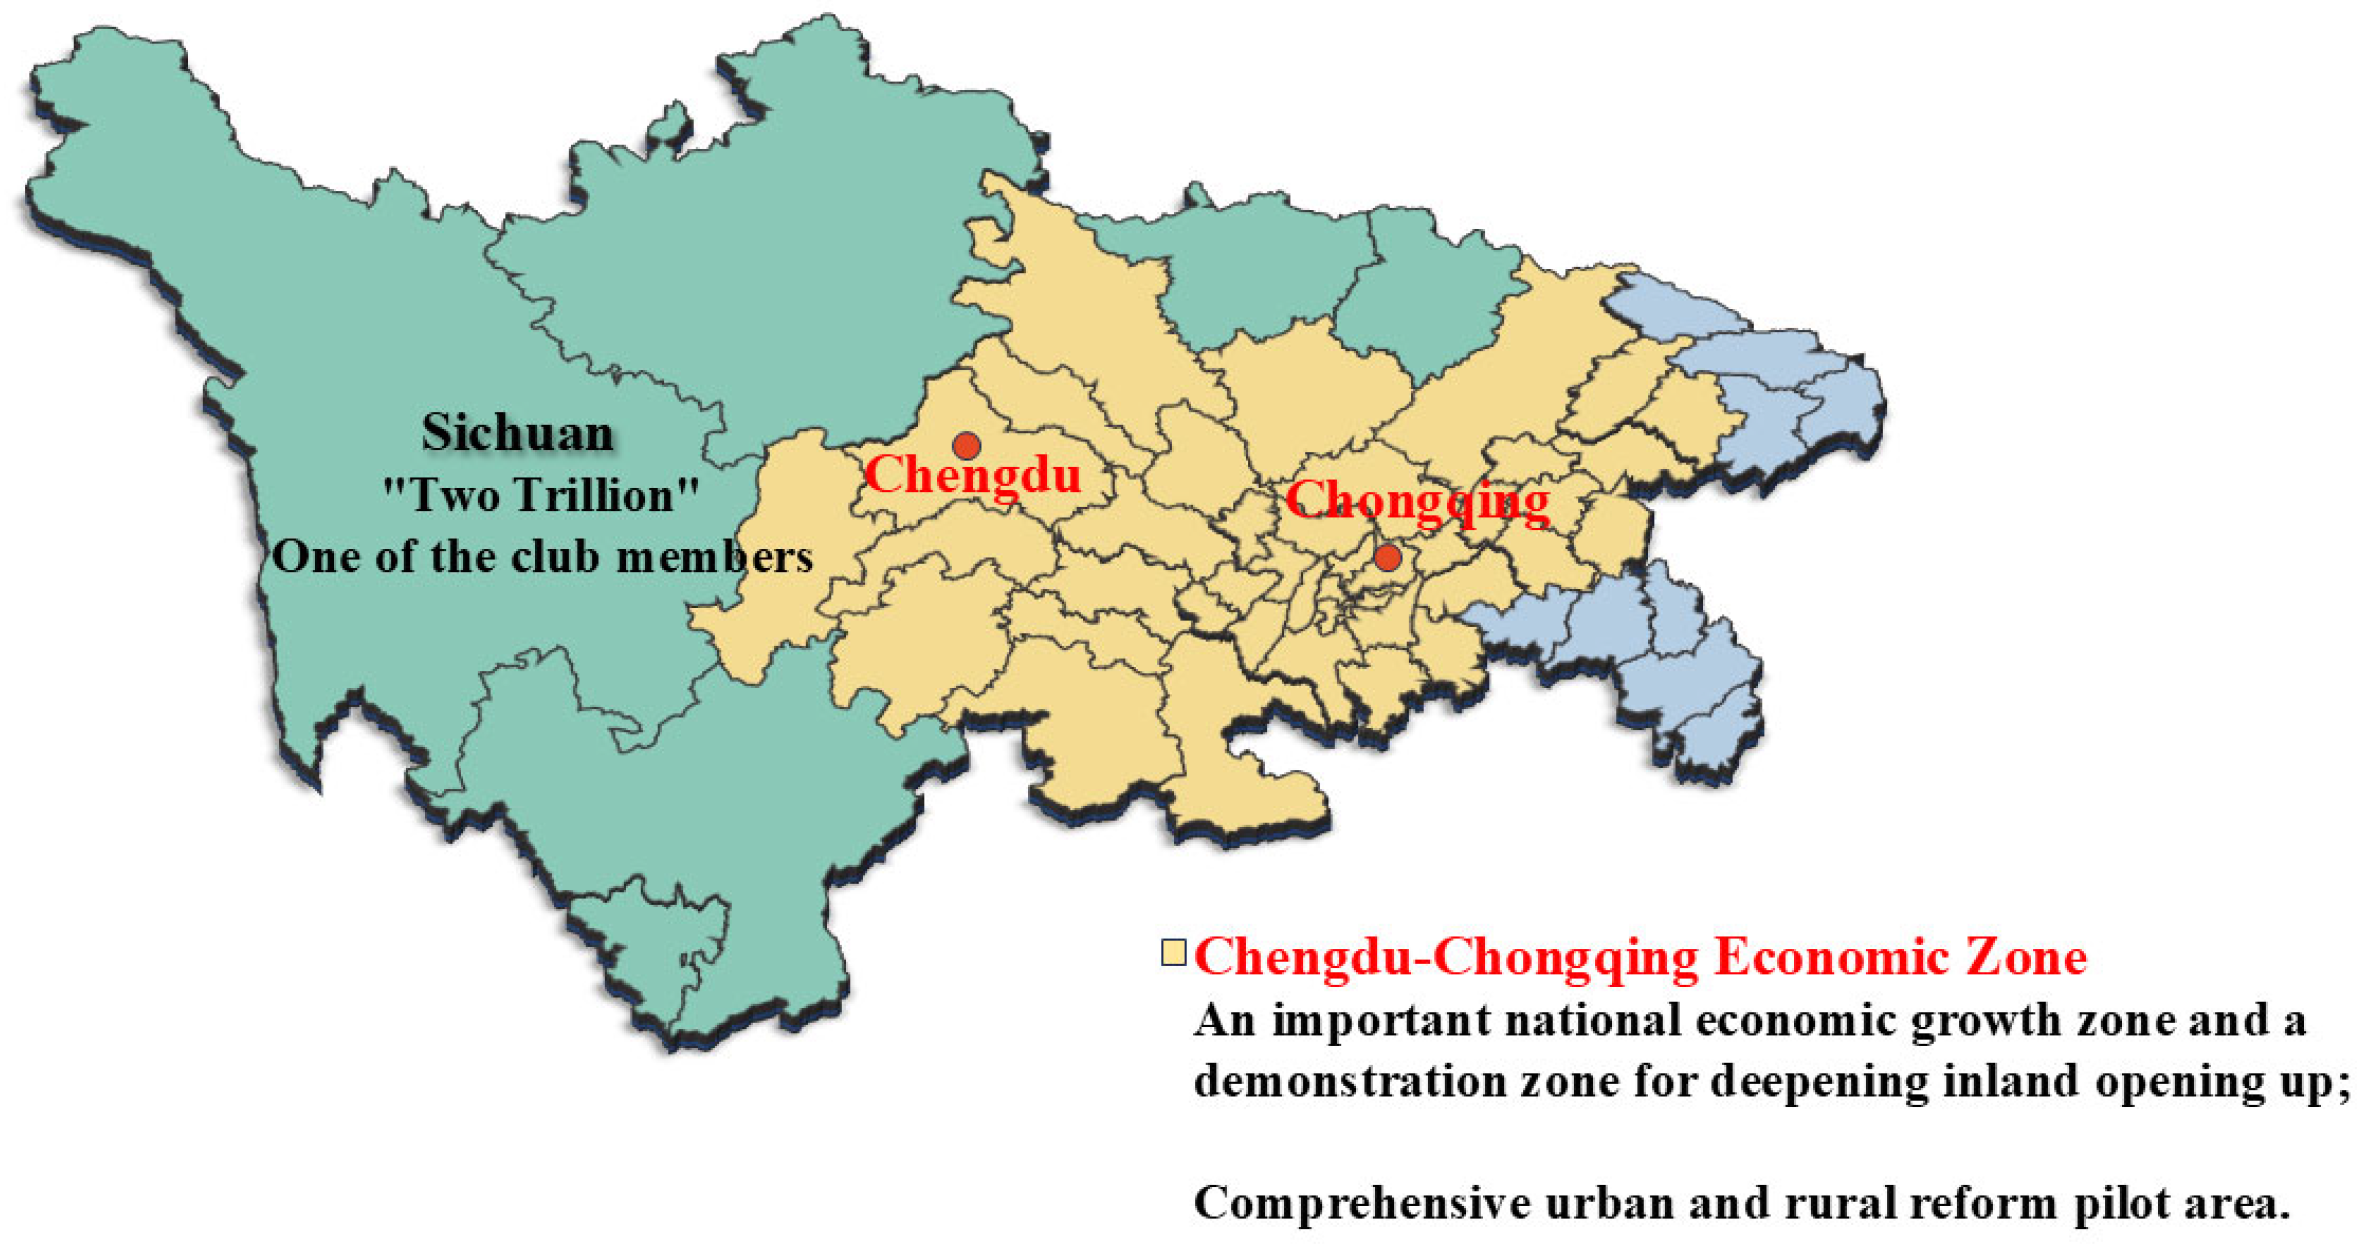
2. Research Approach and Regional Data Sources

To comprehensively demonstrate the key characteristics of the carbon neutrality pathway for the Sichuan-Chongqing region, this paper proposes a systematic research process and methodology (see Figure 1): (1) Collect current economic growth and energy structure data for major sectors in the Sichuan-Chongqing region and analyze the region’s current carbon emissions; (2) Based on policy requirements, comprehensively consider energy demand, energy efficiency improvements, and energy structure optimization to construct different scenario models; (3) In conjunction with the region’s economic and social development, gradually set key parameters according to relevant policies and plans, and use the LEAP model to calculate carbon emissions and energy demand changes under each scenario within the planned timeframe; (4) Analyze the model results, evaluate whether each scenario meets the carbon neutrality targets, and select the most effective scenario to form a carbon neutrality implementation plan with regional characteristics.
The Sichuan-Chongqing region, comprising Sichuan Province and Chongqing City (see Figure 2), exhibits a diversified industrial structure due to its unique geographical location and significant economic importance. This paper collected detailed energy consumption and carbon emission data for the Sichuan-Chongqing region from 2015 to 2020 through sources such as local statistical yearbooks [30,31] and the CEADs database [32], covering key sectors such as industry, transportation, and construction. Additionally, based on relevant national and local government policy documents, such as the 14th Five-Year Plan for Energy Development of Sichuan Province [33], the 14th Five-Year Plan for Energy Development of Chongqing Municipality [34], and the Action Plan for Carbon Peaking Before 2030 [35], combined with the region’s economic and social development plans, this paper provides a comprehensive analysis of the region’s energy structure and carbon emission characteristics.
Taking 2020 as the base year, this study constructs a carbon emission and energy demand forecasting model for the Sichuan-Chongqing region based on the LEAP model to conduct a quantitative analysis of the changes in energy demand and carbon emissions from 2020 to 2060. By developing different scenarios, the study considers various factors (such as the activity level, energy intensity, energy structure, and other parameter changes) that influence carbon emissions and energy demand during the planning period. It evaluates the impact of each factor and assesses whether the scenarios meet the standards for achieving carbon neutrality, ensuring that the prediction of future carbon neutrality pathways is both reasonable and feasible.

3. Current Carbon Emission Analysis and Model Construction

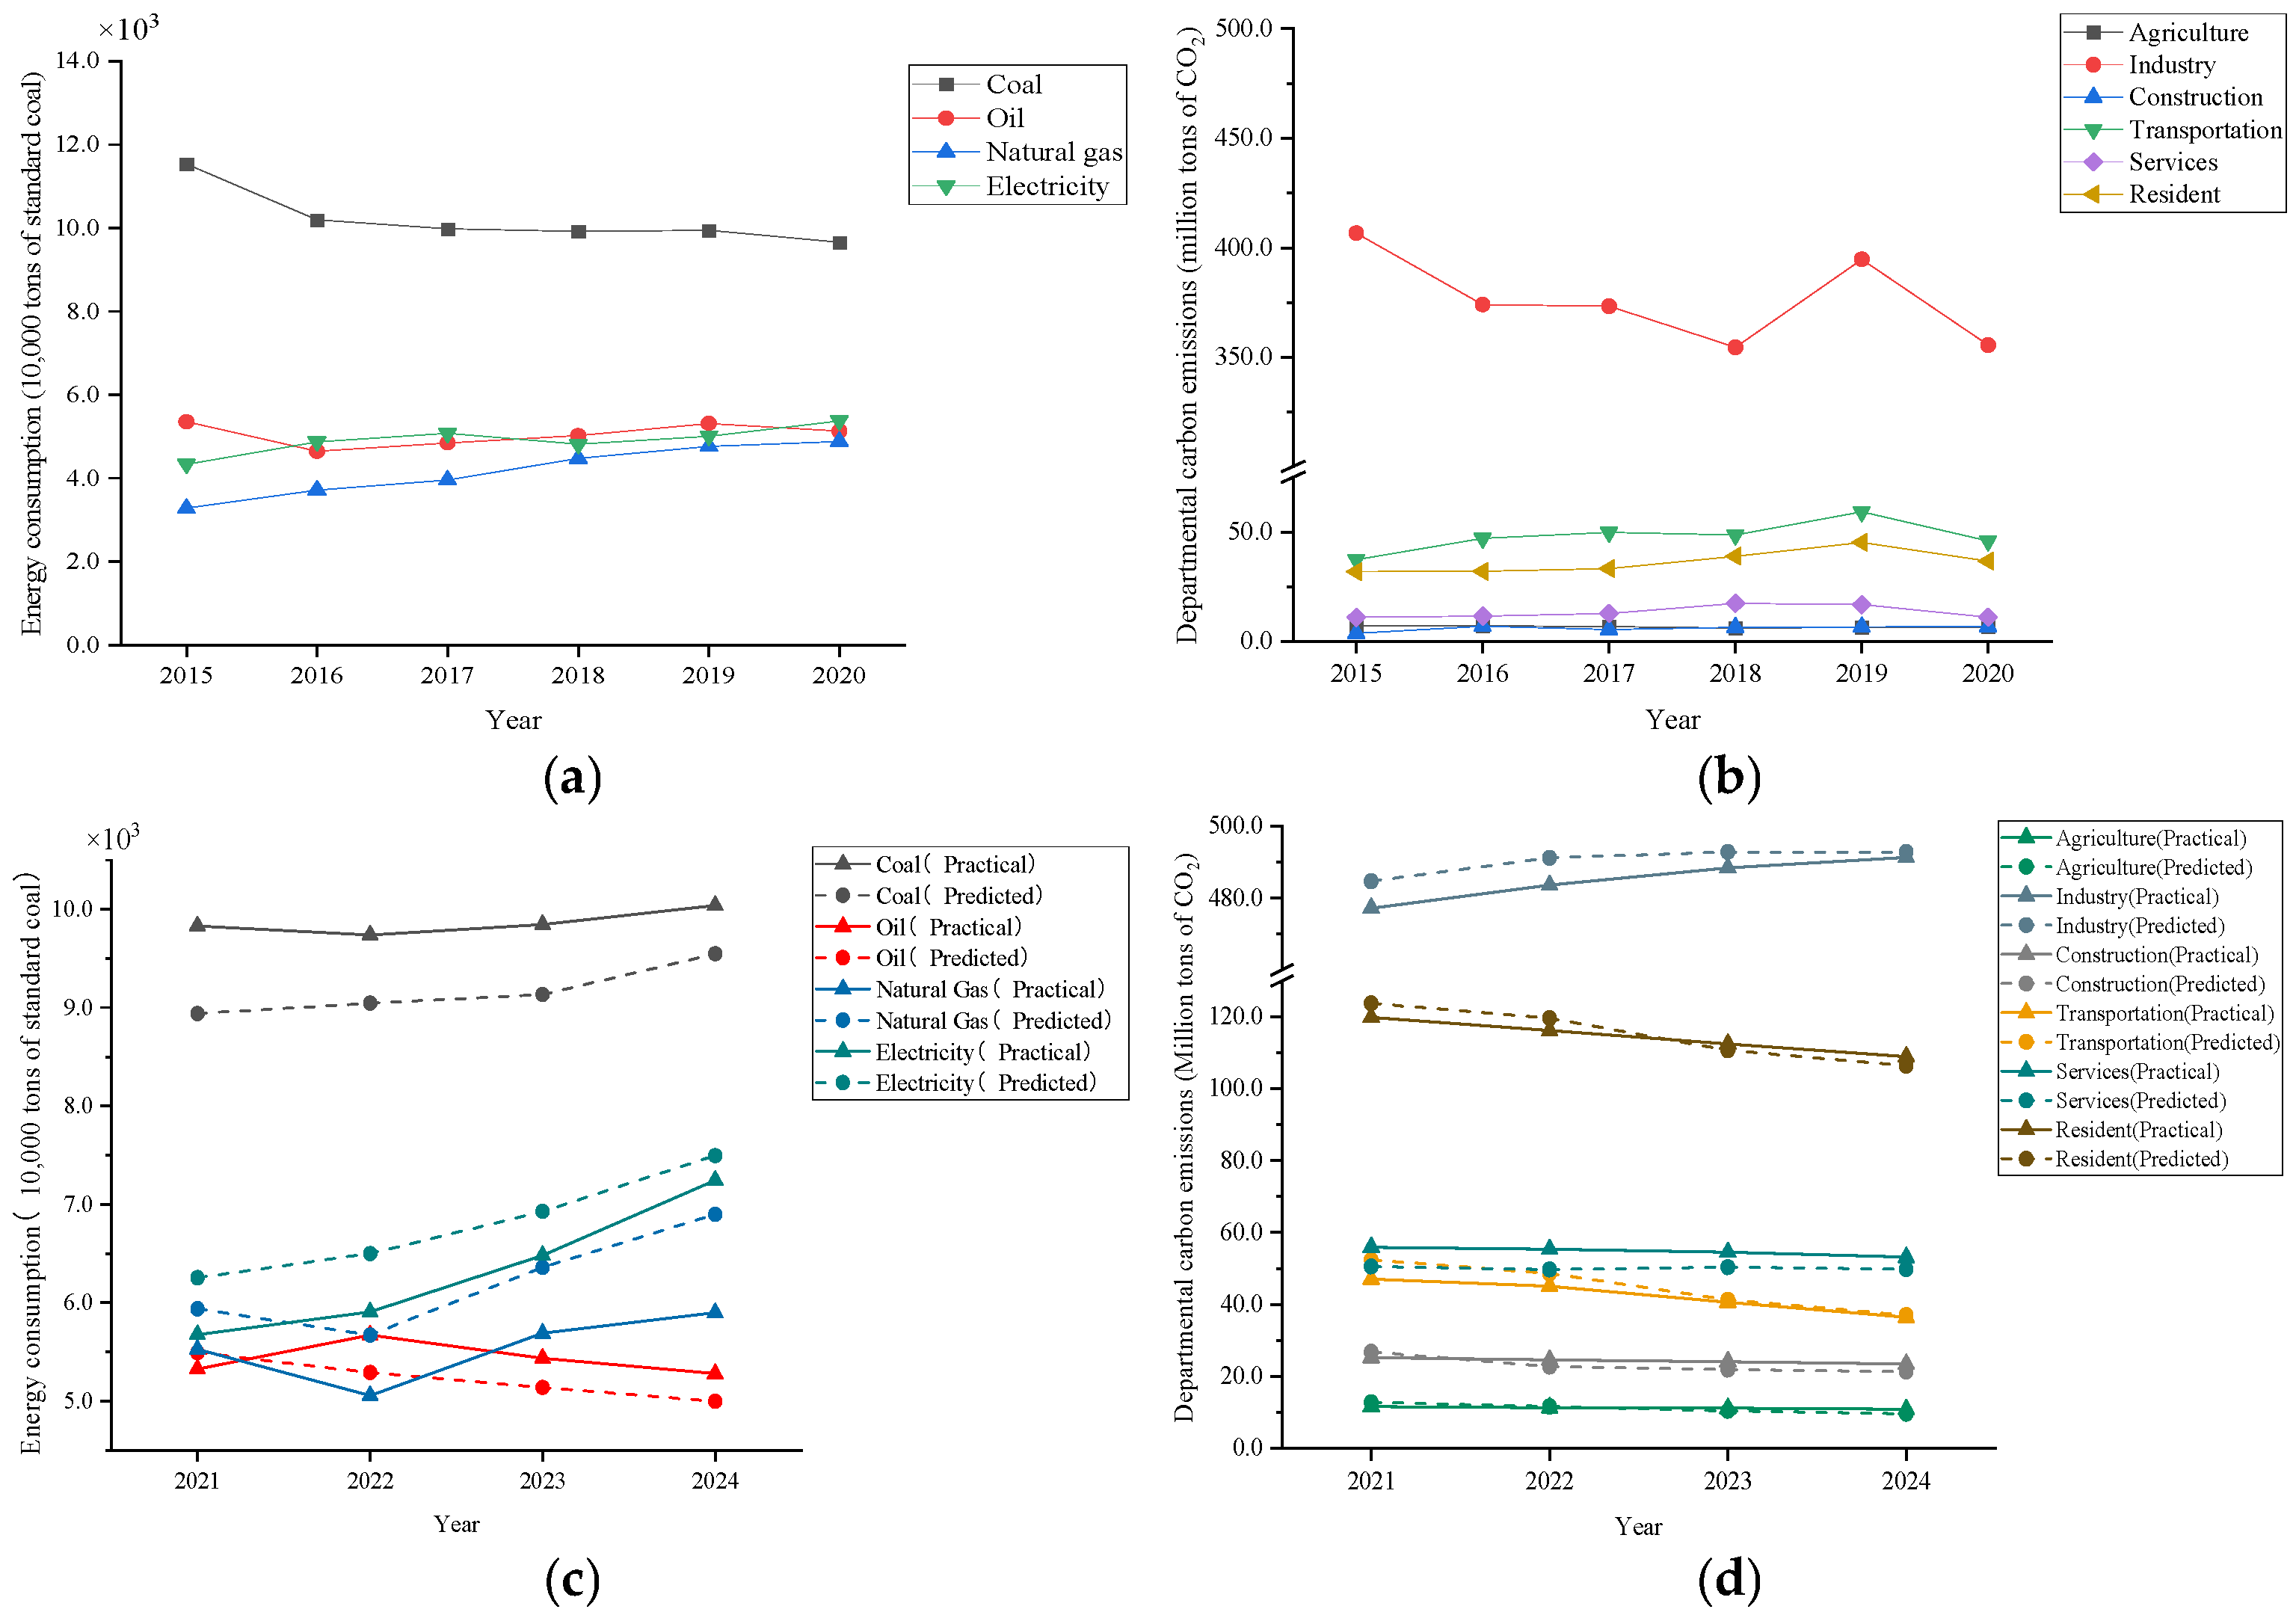
3.1. Analysis of Energy Consumption and Carbon Emissions in the Sichuan-Chongqing Region over the Years

This study organizes relevant data from the Sichuan Statistical Yearbook, Chongqing Statistical Yearbook, and the China Carbon Accounting Database (CEADs) [25,26,27], including data on GDP, energy consumption, building area, population changes, and carbon emissions from various types of consumption. It analyzes the energy consumption and carbon emissions of the Sichuan-Chongqing region from 2015 to 2020, with the results shown in Figure 3.
However, with the gradual implementation of energy conservation and emission reduction policies by the national and local governments, the Sichuan-Chongqing region has recently shown preliminary signs of optimizing its energy structure. According to the data in Figure 3a, the consumption of traditional fossil fuels has decreased, particularly coal and oil, which have stabilized after 2020. It is expected that coal consumption will be controlled below 70 million tons by 2025. This shift indicates that the promotion of renewable energy will be further strengthened, with hydro-power, wind power, photovoltaic power, and biomass power generation playing a dominant role in the Sichuan-Chongqing region [36]. Optimizing the traditional energy structure by building a clean power system, upgrading conventional power generation methods, and deploying energy storage facilities will help reduce the share of fossil fuel consumption and achieve end-use electrification [37]. These strategies will be key to achieving carbon peaking and carbon neutrality in the region [38].
Regarding the transition in energy consumption patterns, carbon emissions exhibited a fluctuating trend from 2015 to 2020. As shown in Figure 3a, although energy consumption is gradually shifting towards cleaner energy sources—characterized by a decline in the consumption of traditional high-carbon energy sources (coal and oil) and an increase in electricity and natural gas consumption—total carbon emissions have not shown a significant decrease. Additionally, traditional power generation methods are gradually being replaced by hydro-power and photovoltaic power generation, while coal-to-gas policies and the expansion of natural gas combined heat and power (CHP) are actively progressing [39]. However, despite these changes, total carbon emissions have not shown a significant reduction. As shown in Figure 3b, the industry sector remains the main source of carbon emissions in the Sichuan-Chongqing region, particularly with high-energy-consuming sectors accounting for a large proportion. At the same time, the carbon emissions from the transportation and service sectors have remained stable, both maintaining levels between 20 to 30 million tons. This is closely related to the region’s rapidly growing economic activities and transportation demands.
Based on this, the study further analyzes the changes in energy structure and demand across six major sectors in the Sichuan-Chongqing region, based on industry policies that outline targets for GDP, building completion area, and population development plans. Using the LEAP model, different scenarios are established according to various policy implementations to simulate carbon emission changes under different policy intensities [40]. Based on the simulation analysis results, this study evaluated the feasibility of achieving carbon neutrality and conducted an in-depth analysis of the effectiveness of various emission reduction strategies. To validate the accuracy of the model’s predictions, we forecasted the changes in energy consumption and carbon emissions for the period from 2021 to 2024 and compared them with the actual data collected during the same period. As shown in Figure 3c,d, the model’s predictions align closely with the actual data. Through multiple scenario simulations, this study explores the pathways to achieving carbon neutrality under various policy environments and economic development conditions, aiming to identify the optimal scenario as the carbon neutrality implementation pathway for the Sichuan-Chongqing region.

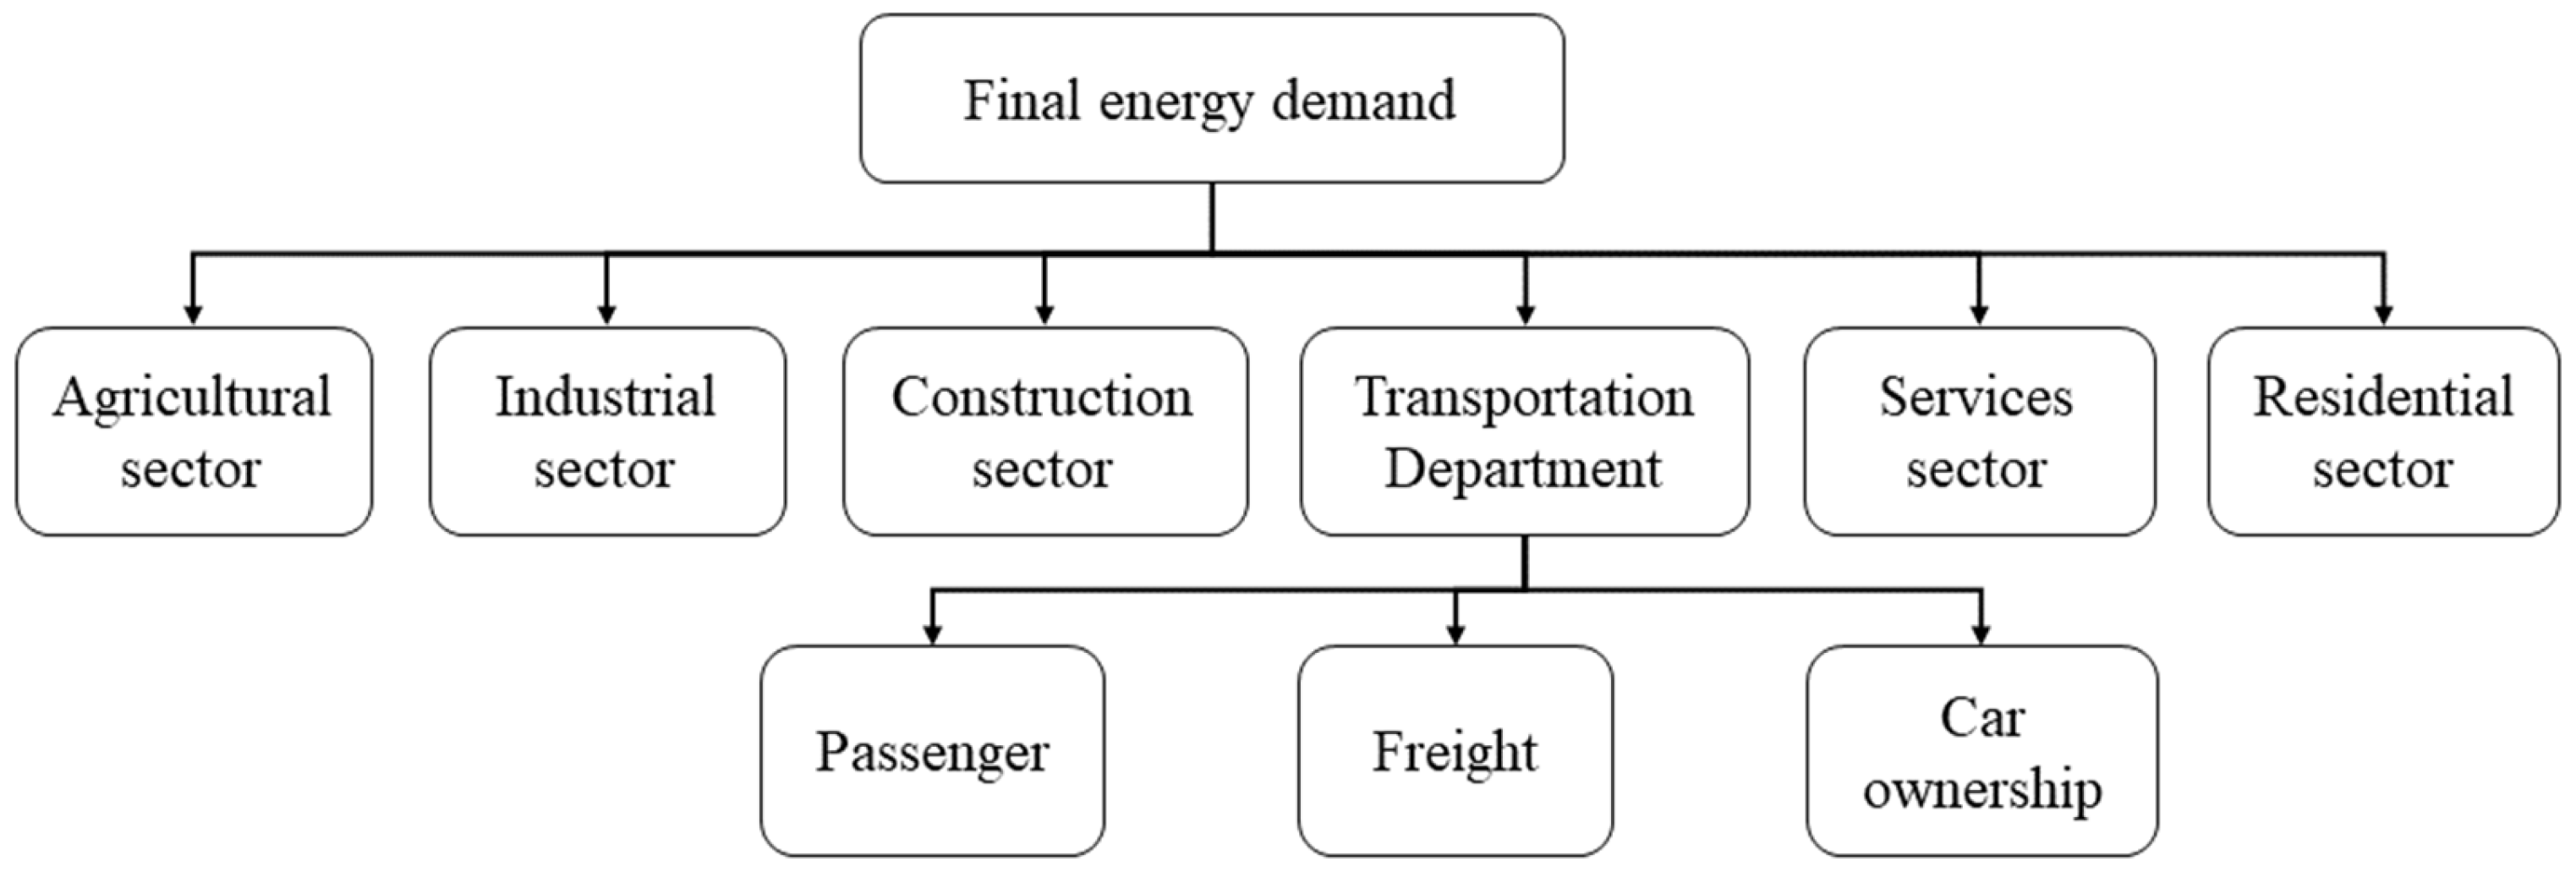
3.2. LEAP Model Construction and Scenario Analysis

(1)
Selection of Baseline Year Parameters
To ensure the accuracy of the LEAP model’s scenario design and carbon dioxide emission calculations, it is necessary to reasonably divide the terminal energy consumption sectors based on the actual energy consumption in the Sichuan-Chongqing region. This study refers to the terminal sector classification methods in the “China Energy Statistical Yearbook” [41] and combines the statistical data of Sichuan Province and Chongqing Municipality, dividing the energy consumption sectors of the region into six categories: agriculture, industry, construction, transportation, services, and residents [25]. This classification comprehensively covers the major energy consumption sectors in the region and forms the model framework of this study (see Figure 4).
During the baseline year parameter setup, this study relies on local statistical yearbooks, combined with the activity levels and energy consumption data of each terminal energy consumption sector, to ensure the accuracy and realism of the model’s initial conditions. Table 1 lists the activity levels and energy consumption of various sectors in the Sichuan-Chongqing region for the year 2020. In the subdivision of the transportation sector, special consideration is given to the impact of freight transportation, passenger transportation, and vehicle ownership. It is assumed that the energy consumption of non-commercial transportation is directly related to vehicle ownership; thus, the baseline year data for the transportation sector are more detailed (see Table 2).
By setting data for the base year, the LEAP model, with its modular architecture, dynamic scenario simulation, and uncertainty quantification features, provides methodological and tool support for the multi-scenario forecasting of energy–environment systems [35]. The model analyzes a large amount of historical data and combines various policies, technologies, and economic environments to predict carbon emissions under different scenarios, providing a solid foundation for accurately explaining the dynamic changes in energy consumption structure and carbon emissions in the Sichuan-Chongqing region.
(2)
Carbon Neutrality Scenario Construction for the Sichuan-Chongqing Region
To explore different pathways for achieving carbon neutrality in the Sichuan-Chongqing region, this study constructs four typical scenarios based on the region’s energy demand, energy efficiency improvement potential, and energy structure optimization level: Baseline Scenario (BAS), Alleviative Scenario (A), Low-Carbon Scenario (L), and High-Efficiency Low-Carbon Scenario (HL) [42]. The details are as follows:
(1) Baseline Scenario (BAS): In the baseline scenario, economic and population growth in the Sichuan-Chongqing region drives an annual increase in activity levels across various sectors. Although there are some improvements in energy efficiency, the overall industrial structure remains unchanged, and energy consumption is still dominated by fossil fuels. The promotion of clean energy is slow, resulting in a limited reduction in carbon emissions, with a heavy reliance on traditional fossil fuels such as coal and oil.
(2) Alleviative Scenario (A): Under the alleviative scenario, moderate adjustments are made to the industrial structure. Within the framework of existing policies, the Sichuan-Chongqing region gradually promotes the development of renewable energy and the adoption of electrification across various industries. However, the intensity of these adjustments remains relatively low [43]. A significant proportion of fossil fuels is retained in the industry, transportation, services, and residents sectors, and improvements in energy efficiency are considered negligible. This scenario reflects a moderate transition driven by policy, suitable for a short-term transition phase.
(3) Low-Carbon Scenario (L): The low-carbon scenario further intensifies the optimization of the energy structure compared to the alleviative scenario. The use of clean energy is rapidly promoted, especially in the industrial and transportation sectors. By 2050, coal is expected to be phased out, and the transportation system will transition to “electricity instead of oil”. The overall energy structure shifts towards low carbon, leading to a significant reduction in carbon emissions.
(4) High-Efficiency Low-Carbon Scenario (HL): The high-efficiency low-carbon scenario represents the most effective emission reduction pathway. By significantly improving energy efficiency, enhancing energy intensity, and replacing traditional fossil fuels with clean energy, the Sichuan-Chongqing region is expected to achieve a high level of electrification by 2060. Terminal electrification rates in the residents and services sectors will exceed 95%, while in other sectors, electrification rates will surpass 98%, leading to a substantial reduction in carbon emissions [44,45].
The design of these scenarios is based on the existing policy documents for the Sichuan-Chongqing region, such as the “Sichuan Carbon Peak Implementation Plan” and the “Chongqing 14th Five-Year Energy Development Plan” [28,30]. Using the LEAP model, this study quantitatively simulates the carbon emission pathways for each scenario from 2020 to 2060, analyzing the contributions and synergies of various emission reduction measures in detail. This provides a data reference for the development of low-carbon policies in the Sichuan-Chongqing region. Table 3 outlines the changes in energy intensity and the development assumptions for each scenario.
This study provides clear pathway recommendations for the implementation of the carbon neutrality strategy in the Sichuan-Chongqing region through a comparative analysis of different scenarios, offering methodological references for the formulation of low-carbon development policies in other regions of China.
(3)
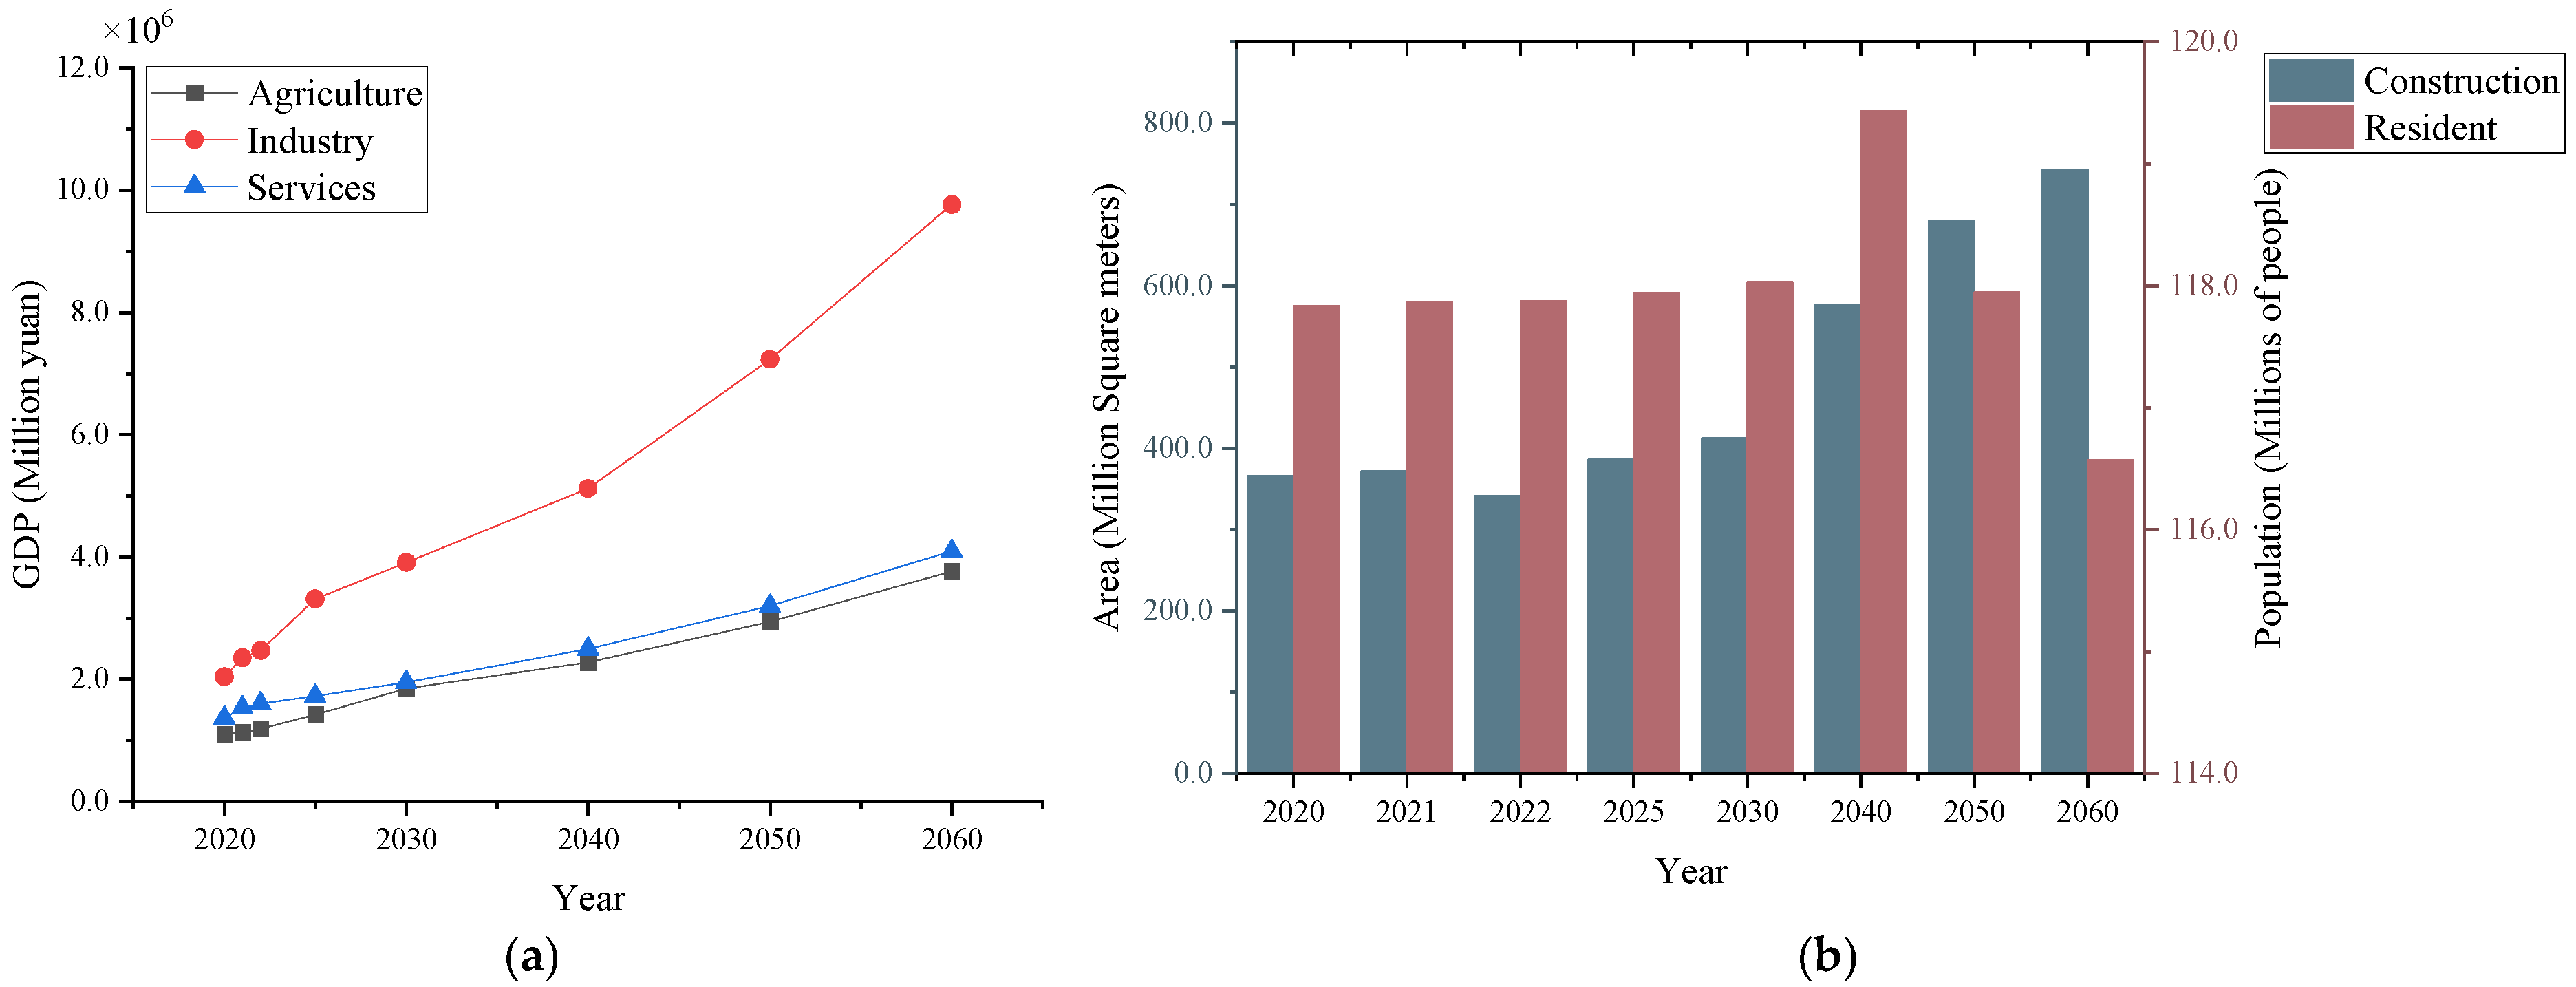
Relationship Between Economic Development and Energy Consumption in the Sichuan-Chongqing Region
There is a close bidirectional relationship between energy consumption and economic development. On one hand, increased energy consumption can drive economic expansion; on the other hand, rapid economic development often leads to increased energy demand, which in turn results in rising greenhouse gas emissions and exacerbates environmental pressure. As a key economic growth pole in southwest China, the Sichuan-Chongqing region will experience significant industrial development in the coming decades, facing the dual challenges of energy consumption and carbon emission control.
According to the “14th Five-Year Plan for National Economic and Social Development and the 2035 Vision Outline of Sichuan Province [46]”, the Sichuan-Chongqing region’s GDP is expected to double by 2035 compared to 2020, forming a modernized industrial system. At the same time, the government is actively promoting industrial structure optimization, enhancing energy efficiency, and developing clean energy.
In agriculture, Sichuan is accelerating the development of ecological and organic farming, advocating for low-carbon agricultural planting models, and promoting green agricultural transformation by reducing the use of fertilizers and pesticides. In the industry sector, the “Sichuan Industrial Green Development Action Plan” clearly states that by 2025, energy consumption per unit of industrial added value will decrease by more than 15%, and new industrial projects are required to meet green manufacturing standards. In the services sector, the “Chongqing Low-Carbon Service Industry Action Plan” aims to reduce carbon emissions from key service industries by more than 20% by 2025 [47]. These policies provide a framework and direction for the low-carbon transition in the Sichuan-Chongqing region [15].
Based on these policy goals, this study forecasts the future activity levels of the six sectors in the Sichuan-Chongqing region and presents predictions for the output of agriculture, industry, and services in Figure 5a. The activity levels for the construction and residents sectors are forecasted based on changes in building area and population, as shown in Figure 5b [48].
In the transportation sector, future energy consumption is highly correlated with economic development. The “China 2050 Low-Carbon Development Path: Energy Demand and Carbon Emission Scenario Analysis” report mentions that by 2030 [49], China’s freight turnover will reach 36.03 trillion ton-kilometers, passenger turnover will reach 13.87 trillion person-kilometers, and the number of passenger vehicles will reach 323 million. Based on historical data for the Sichuan-Chongqing region, this study estimates the region’s share in the national transportation sector and forecasts freight turnover, passenger turnover, and vehicle ownership from 2020 to 2060 [13,50,51]. The specific forecast data is detailed in Table 4. Meanwhile, Table 5 lists the energy intensity settings for each sector.
The comprehensive analysis indicates that in the coming decades, the Sichuan-Chongqing region will face challenges in coordinating economic growth with energy consumption.
To address global climate change and actively respond to the national “dual carbon” strategy, the Sichuan-Chongqing region has set an ambitious vision of peaking carbon emissions before 2030 and achieving carbon neutrality before 2060. During this period, various sectors have successively released relevant policies and set phased goals. For example, the ‘14th Five-Year Plan for the Development of Carbon Neutral Transportation in Sichuan Province’ clearly states that by 2025, more than 75% of vehicles in highway passenger transport should use new energy vehicles, and the carbon emission intensity of transport turnover should be reduced by 4–5% [14,52]. This implies that by 2025, electricity should account for 75% of the energy structure in passenger transport, and through adjustments in energy structure and energy consumption intensity, the total emissions in passenger transport will be reduced to about 95% of the baseline year level. The ’Sichuan Province Carbon Emission Peak Implementation Plan’ further emphasizes the promotion of low-energy and low-carbon buildings, including measures such as using renewable energy to reduce dependence on fossil energy, using environmentally friendly building materials to reduce waste emissions, and optimizing emission reduction strategies through the intelligent management and evaluation of the entire lifecycle carbon footprint [53]. The goal is to achieve a renewable energy substitution rate of 8% for urban buildings by 2025.
The transportation sector also plans to achieve high-level electrification by 2030, with higher fuel efficiency standards for vehicles. By 2030, it is expected that 40% of newly added transport vehicles (excluding motorcycles) will be powered by new energy and clean energy. Additionally, the carbon intensity of commercial transport per unit turnover is projected to decrease by approximately 9.5% compared to 2020, the comprehensive energy consumption per unit turnover for rail transport is expected to decrease by 10%, and petroleum consumption for land transportation is projected to peak during the 15th Five-Year Plan period [24].
Based on an in-depth analysis of policies and plans for various sectors, this study precisely set the core parameters (see Figure 6 and Table 6). These parameters will be used in different scenarios in the LEAP model to scientifically predict the carbon emission pathways for the Sichuan-Chongqing region, with the specific results discussed in Section 4.

4. Result Analysis

4.1. Overall Trends of Energy Consumption and Carbon Emissions in the Sichuan-Chongqing Region

When discussing the strategy for achieving carbon neutrality in the Sichuan-Chongqing region, it is essential to consider the region’s urbanization development, industrialization stage, economic growth trends, and energy resource endowments in order to formulate a reasonable and sustainable carbon neutrality pathway. This process not only requires identifying the peak carbon emission year and peak emission level but also requires establishing a timeline for the carbon neutrality target to ensure that the emission reduction process aligns with economic and social development. At the same time, emphasis should be placed on optimizing the energy structure and promoting green industrial transformation to drive a low-carbon, circular, and efficient sustainable development model. Additionally, room must be reserved to accommodate uncertainties arising from future technological innovations and changes in economic and social structures, ensuring the necessary flexibility for adjustments during strategy implementation. By building a resilient and environmentally friendly energy system and fostering the coordinated development of policies, technologies, and market mechanisms, the region can serve as a reference and model for sustainable development at both the national and global levels.
According to the results in Figure 7a, under the baseline scenario (BAS), alleviative scenario (A), and low-carbon scenario (L), overall energy consumption shows an upward trend, making it difficult to achieve peak energy consumption. Particularly in the alleviative scenario, due to insufficient efforts in energy structure transformation, energy demand continues to grow, driven by economic development, while improvements in energy efficiency remain limited. As a result, total energy consumption is higher than in the other scenarios. In contrast, in the baseline and low-carbon scenarios, the transition in energy structure and the increased use of renewable energy help reduce energy demand to some extent. Compared to these scenarios, the high-efficiency low-carbon scenario (HL) effectively controls the growth of energy consumption by enhancing energy efficiency and optimizing the energy structure. It is expected to achieve peak energy consumption before 2050. By 2060, total energy consumption is projected to be controlled at approximately 356.7 million tons of standard coal, representing only a 32.26% increase compared to 2020. Figure 7b illustrates the carbon emission trends in the Sichuan-Chongqing region under different scenarios. In the baseline scenario (BAS), carbon emissions continue to rise, but the growth rate gradually slows down between 2020 and 2040, reaching a stagnation point around 2040 before accelerating again. The possible reason for this stagnation is a significant improvement in energy efficiency and an increasing share of emerging clean energy sources [54]. However, from 2040 to 2060, emissions gradually increase again, possibly due to a sharp rise in the demand for clean energy (such as electricity and natural gas), where the production and transportation processes generate substantial carbon emissions, leading to a slow overall increase. In the alleviative scenario (A), the growth rate of carbon emissions from 2020 to 2040 is faster compared to the BAS scenario, but it also exhibits stagnation around 2040. By 2040, emissions are projected to be 86.8 million tons of CO2 equivalent higher than in the BAS scenario. The emissions in the A scenario are expected to peak in 2051 at 1157.6 million tons of CO2 equivalent and then gradually decrease to 1088.7 million tons of CO2 equivalent, representing a 52.14% increase compared to 2020. In contrast, the low-carbon scenario (L) and the high-efficiency low-carbon scenario (HL) achieve earlier carbon peaking. The peak carbon emissions in the low-carbon scenario (L) are expected to occur in 2028 at 925.2 million tons of CO2 equivalent, only 29.26% higher than in 2020, followed by a gradual decline to 74.32% of the baseline year level. Under the high-efficiency low-carbon scenario, carbon emissions begin to decline from 2020 and are expected to achieve significant reductions by 2060, decreasing to 24.36% of the baseline year level.
The research results indicate that by improving energy efficiency and optimizing the energy structure, the Sichuan-Chongqing region can not only effectively curb the growth trend of energy consumption but also significantly reduce carbon emissions, thereby promoting a green low-carbon transition and fostering sustainable development. Particularly under the high-efficiency low-carbon scenario, the region can achieve the maximum carbon reduction while ensuring sustained and stable economic growth, providing strong support for the coordinated development of the economy, environment, and society. This systematic scenario analysis helps to more accurately predict the pathway to carbon neutrality, aiding both the region and beyond in formulating feasible green development strategies. It provides an ideal reference plan for the Sichuan-Chongqing region and offers guidance for formulating and implementing carbon reduction strategies and measures in Sichuan-Chongqing and other regions, contributing to the achievement of global sustainable development goals.

4.2. Trends in Changes in Energy Demand

Figure 8 shows the changes in energy demand for different energy sources in the Sichuan-Chongqing region from 2020 to 2060 under four scenarios. As illustrated in the figure, energy demand varies significantly across scenarios over time, particularly in the changing proportions of fossil fuels and electricity demand.
In the Alleviate Scenario, energy demand growth is particularly notable. As shown in Figure 8b, total energy demand reaches 1.1 billion tons of standard coal by 2060, far exceeding the other scenarios. This high growth in demand is primarily attributed to insufficient improvements in energy efficiency, while fossil fuels continue to occupy a large share of the energy mix. Although electricity demand gradually increases, fossil energy remains the dominant source. This energy structure fails to adequately address the trends in future energy transitions, resulting in limited potential for reducing carbon emissions and improving energy efficiency.
In contrast, under the Baseline Scenario, as shown in Figure 8a, energy demand exhibits a steady but relatively moderate growth trend. By 2060, total energy demand reaches 729 million tons of standard coal, slightly higher than in the low-carbon and high-efficiency low-carbon scenarios. In this scenario, the share of fossil fuel demand gradually decreases, and electricity demand rises steadily. However, improvements in energy efficiency are not significant, and the transformation of the energy structure is limited, leading to only moderate reductions in carbon emissions.
The Low-Carbon Scenario shows more significant results compared to the Baseline Scenario. As shown in Figure 8c, the energy structure undergoes significant adjustments, with electricity gradually becoming the dominant energy source. By 2060, electricity accounts for 71.42% of total energy demand. Over time, fossil fuel demand declines sharply, and the use of clean energy and electricity increases significantly. This reflects an orderly transition of the energy structure under carbon reduction policies, effectively reducing carbon emissions and improving energy efficiency. However, the Low-Carbon Scenario still fails to achieve peak energy demand, and a common feature of the BAS, A, and L scenarios is that the growth rate of carbon emissions in all three scenarios experiences an inflection point around 2042. After 2042, the growth rate accelerates, possibly due to the widespread use of new energy sources, which generates substantial carbon emissions during their production, exploration, and transportation processes.
In the High-Efficiency Low-Carbon Scenario, as shown in Figure 8d, the growth of energy demand is effectively controlled, and it starts to gradually decline after peaking around 2050. By 2060, total energy demand is approximately 350 million tons of standard coal, with electricity accounting for 77.32% of the energy mix. This scenario achieves a gradual phase-out of fossil fuels in the energy structure through significant improvements in energy efficiency and the accelerated adoption of clean energy, making electricity and other clean energy sources the primary energy providers. This scenario aligns with the requirements for future green and efficient development, not only effectively controlling energy demand but also significantly reducing carbon emissions.
In summary, the changes in energy demand across different scenarios are influenced not only by economic development but also by adjustments in the energy structure and improvements in energy efficiency. While the Alleviate Scenario leads to increased energy demand, it does not significantly reduce carbon emissions due to the continued reliance on fossil fuels. However, the Low-Carbon Scenario and the High-Efficiency Low-Carbon Scenario achieve optimized energy demand and effective carbon emission reductions through the electrification process and the application of clean energy. Particularly in the High-Efficiency Low-Carbon Scenario, the Sichuan-Chongqing region is expected to achieve stable control of energy demand by 2060, making it the most promising pathway for achieving carbon neutrality.

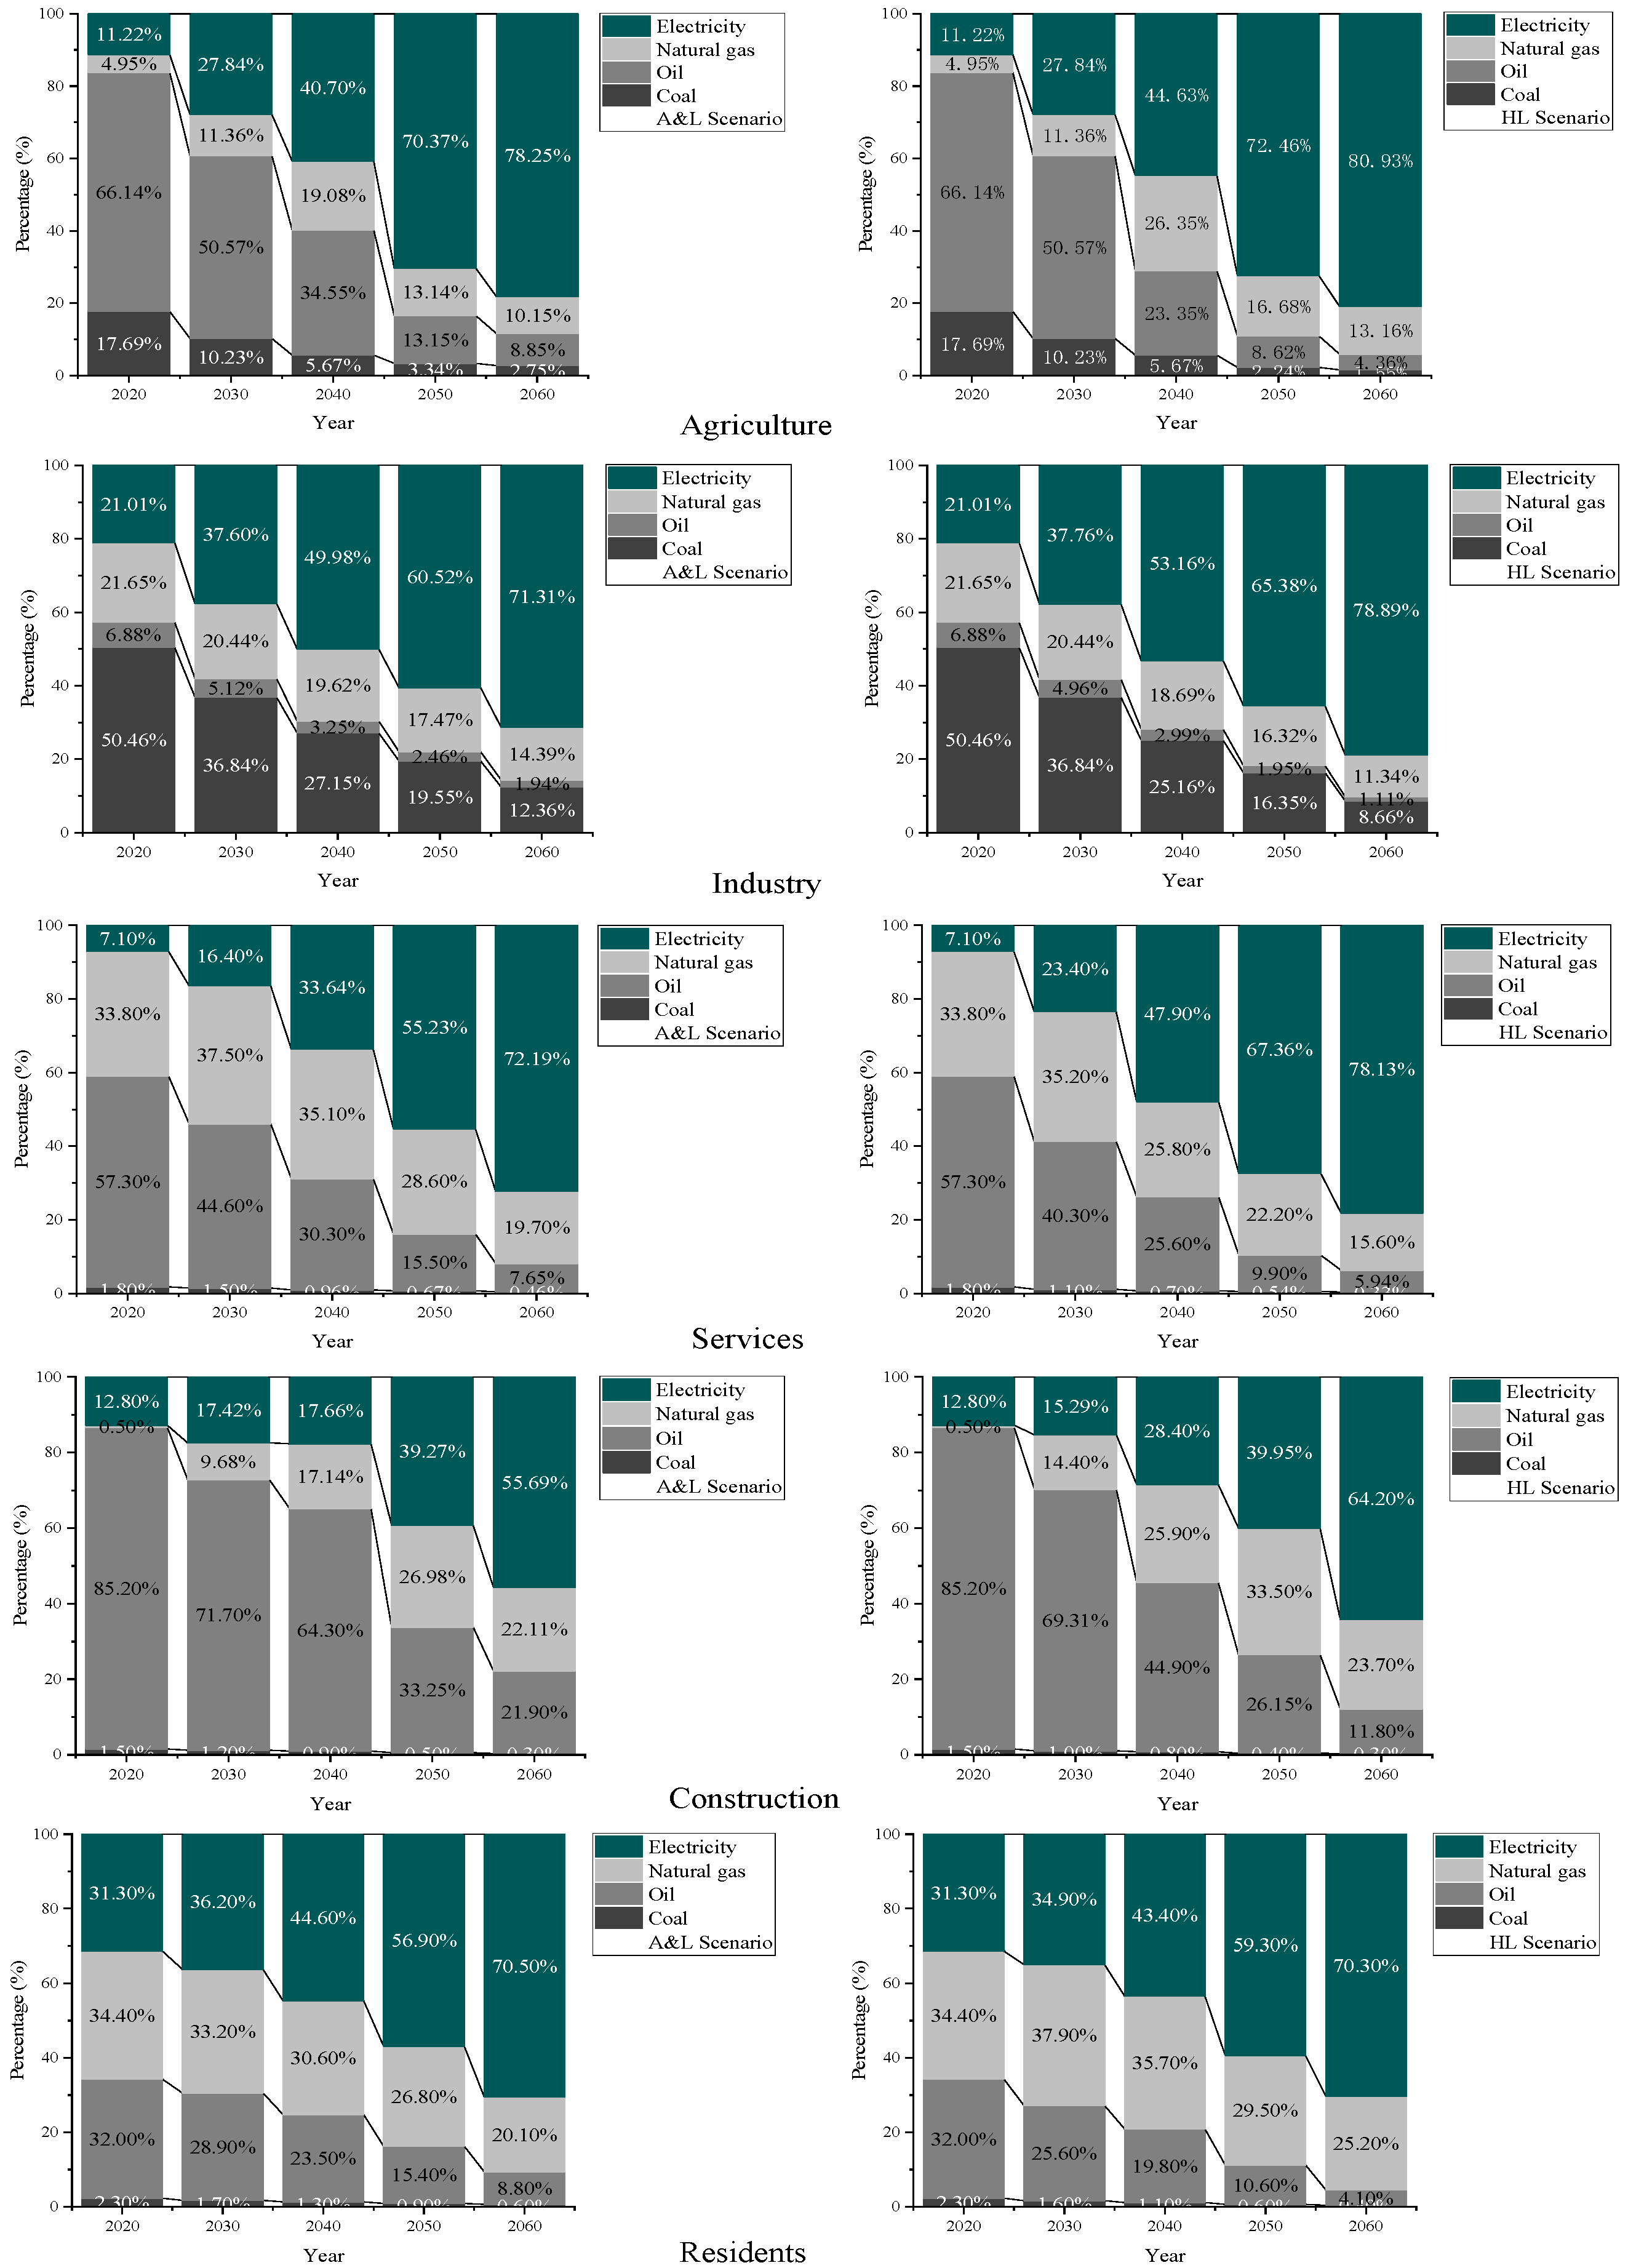
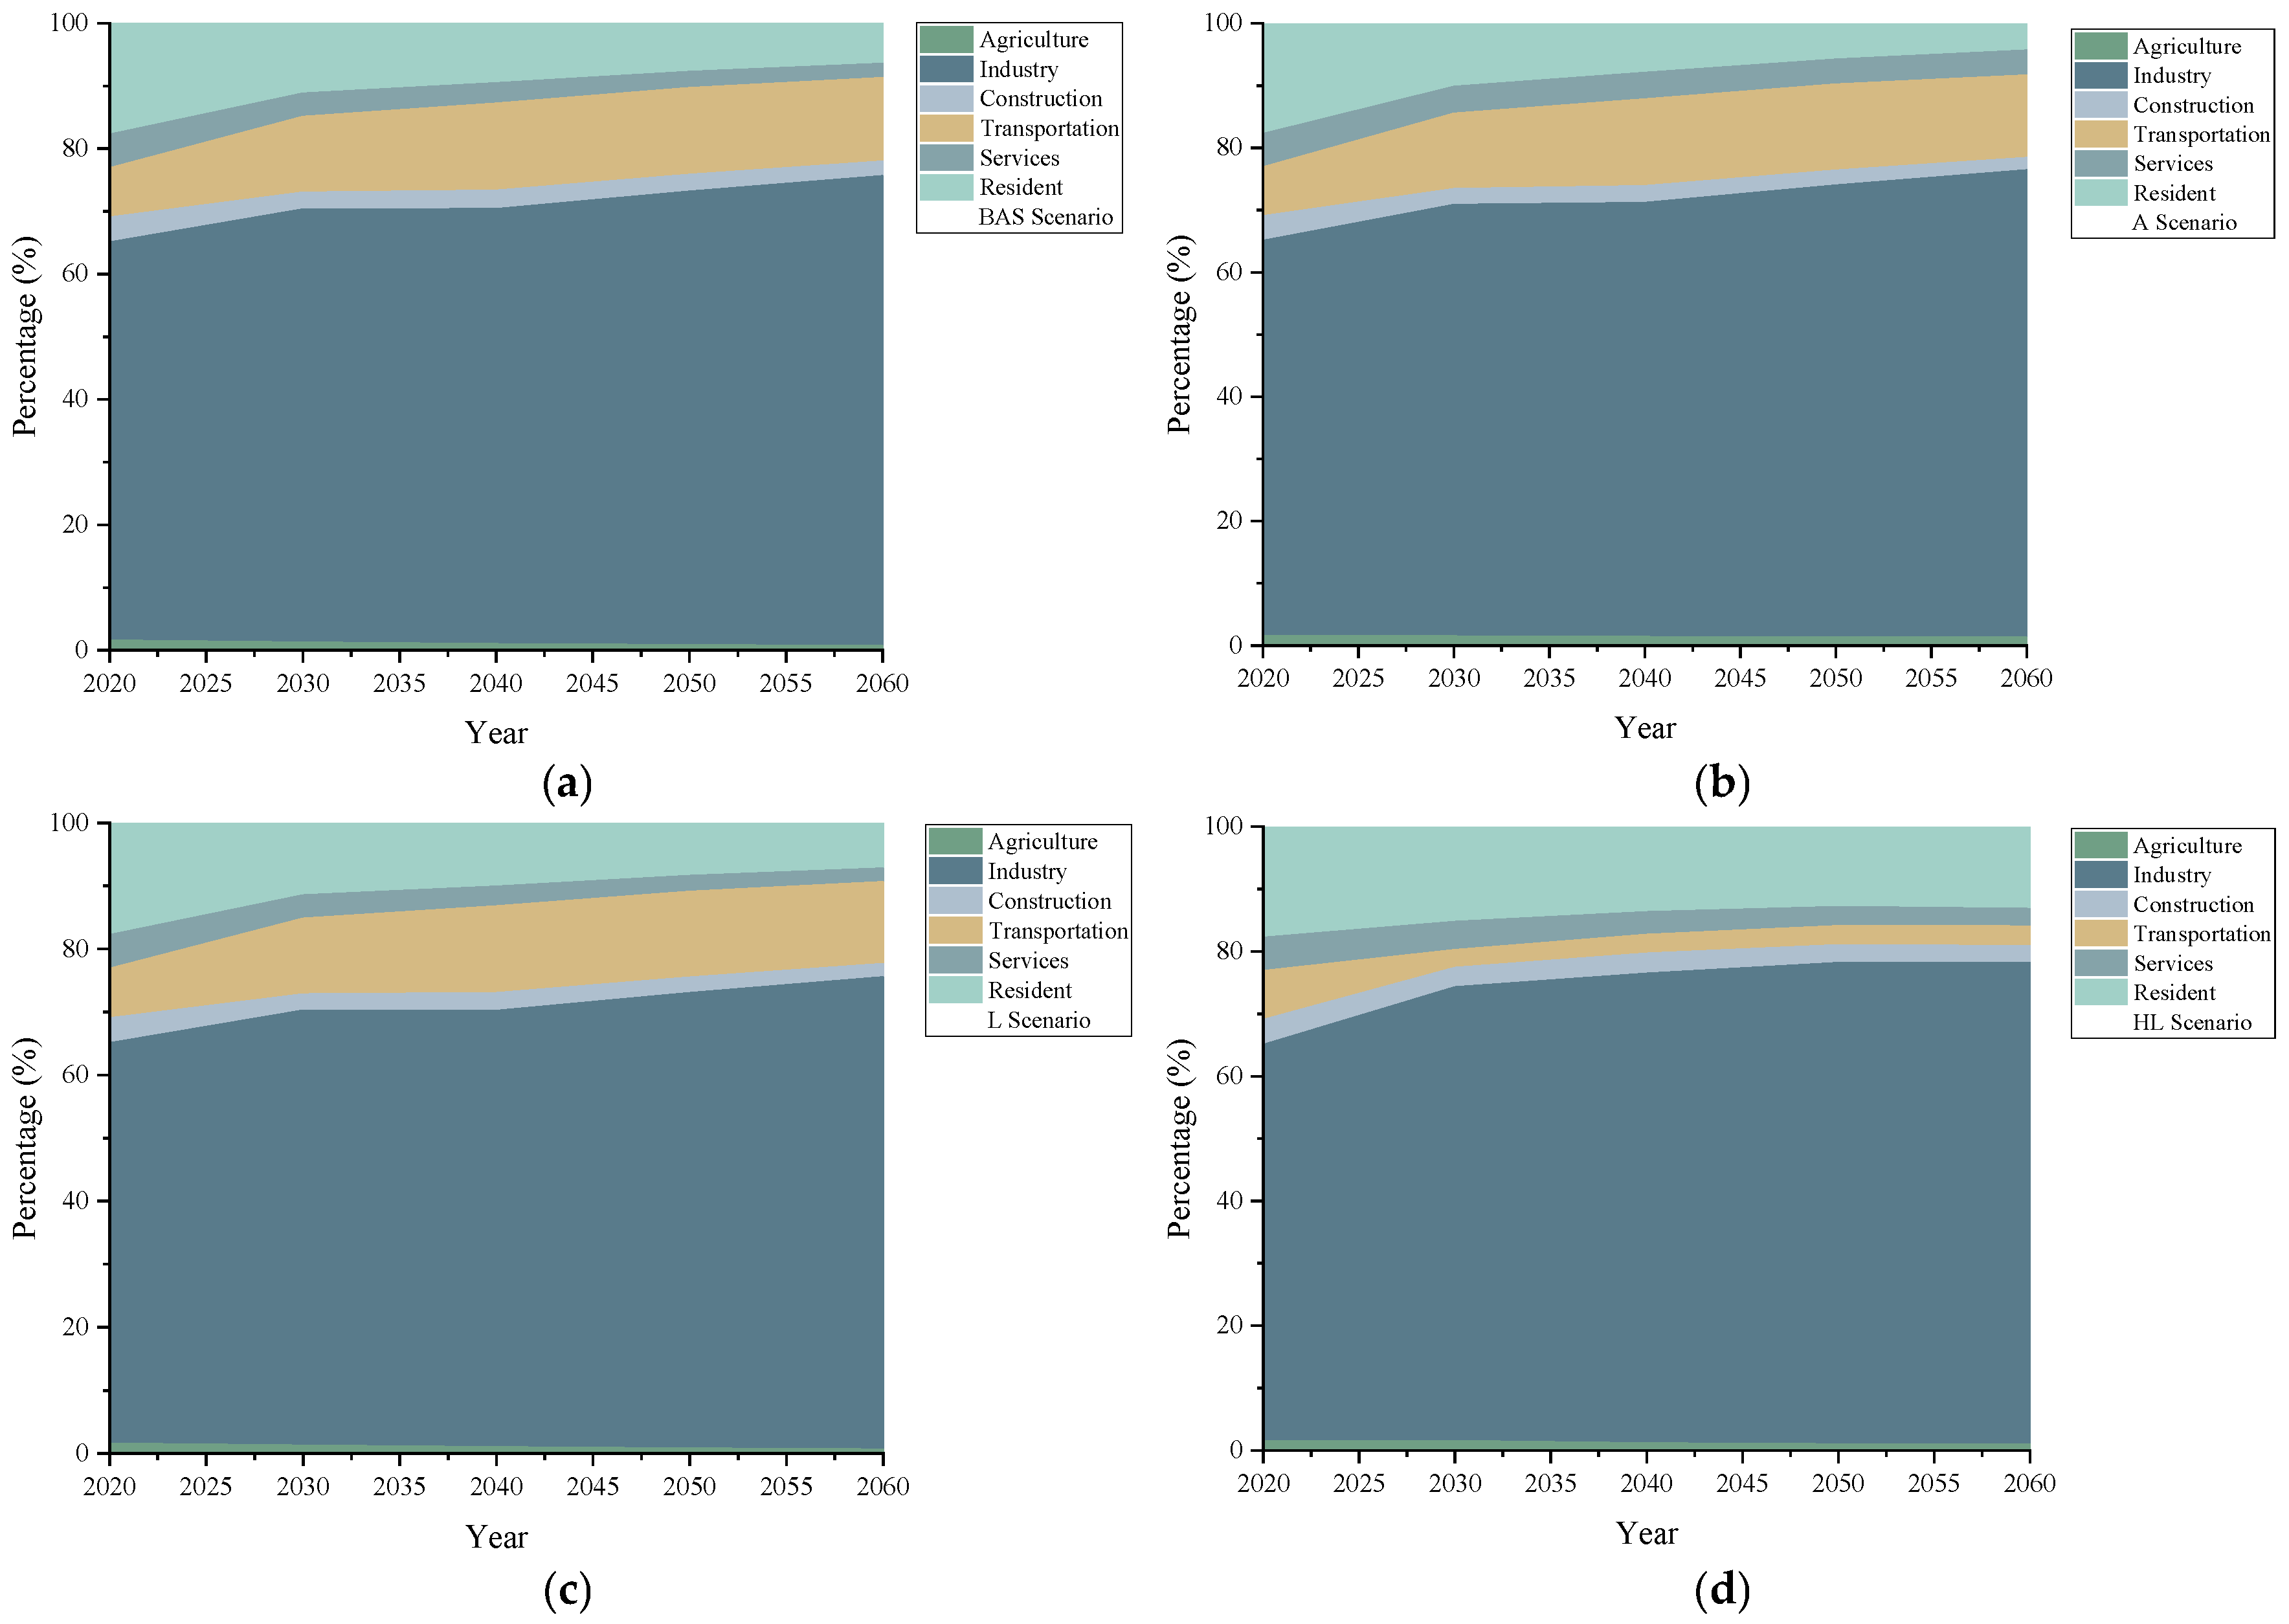
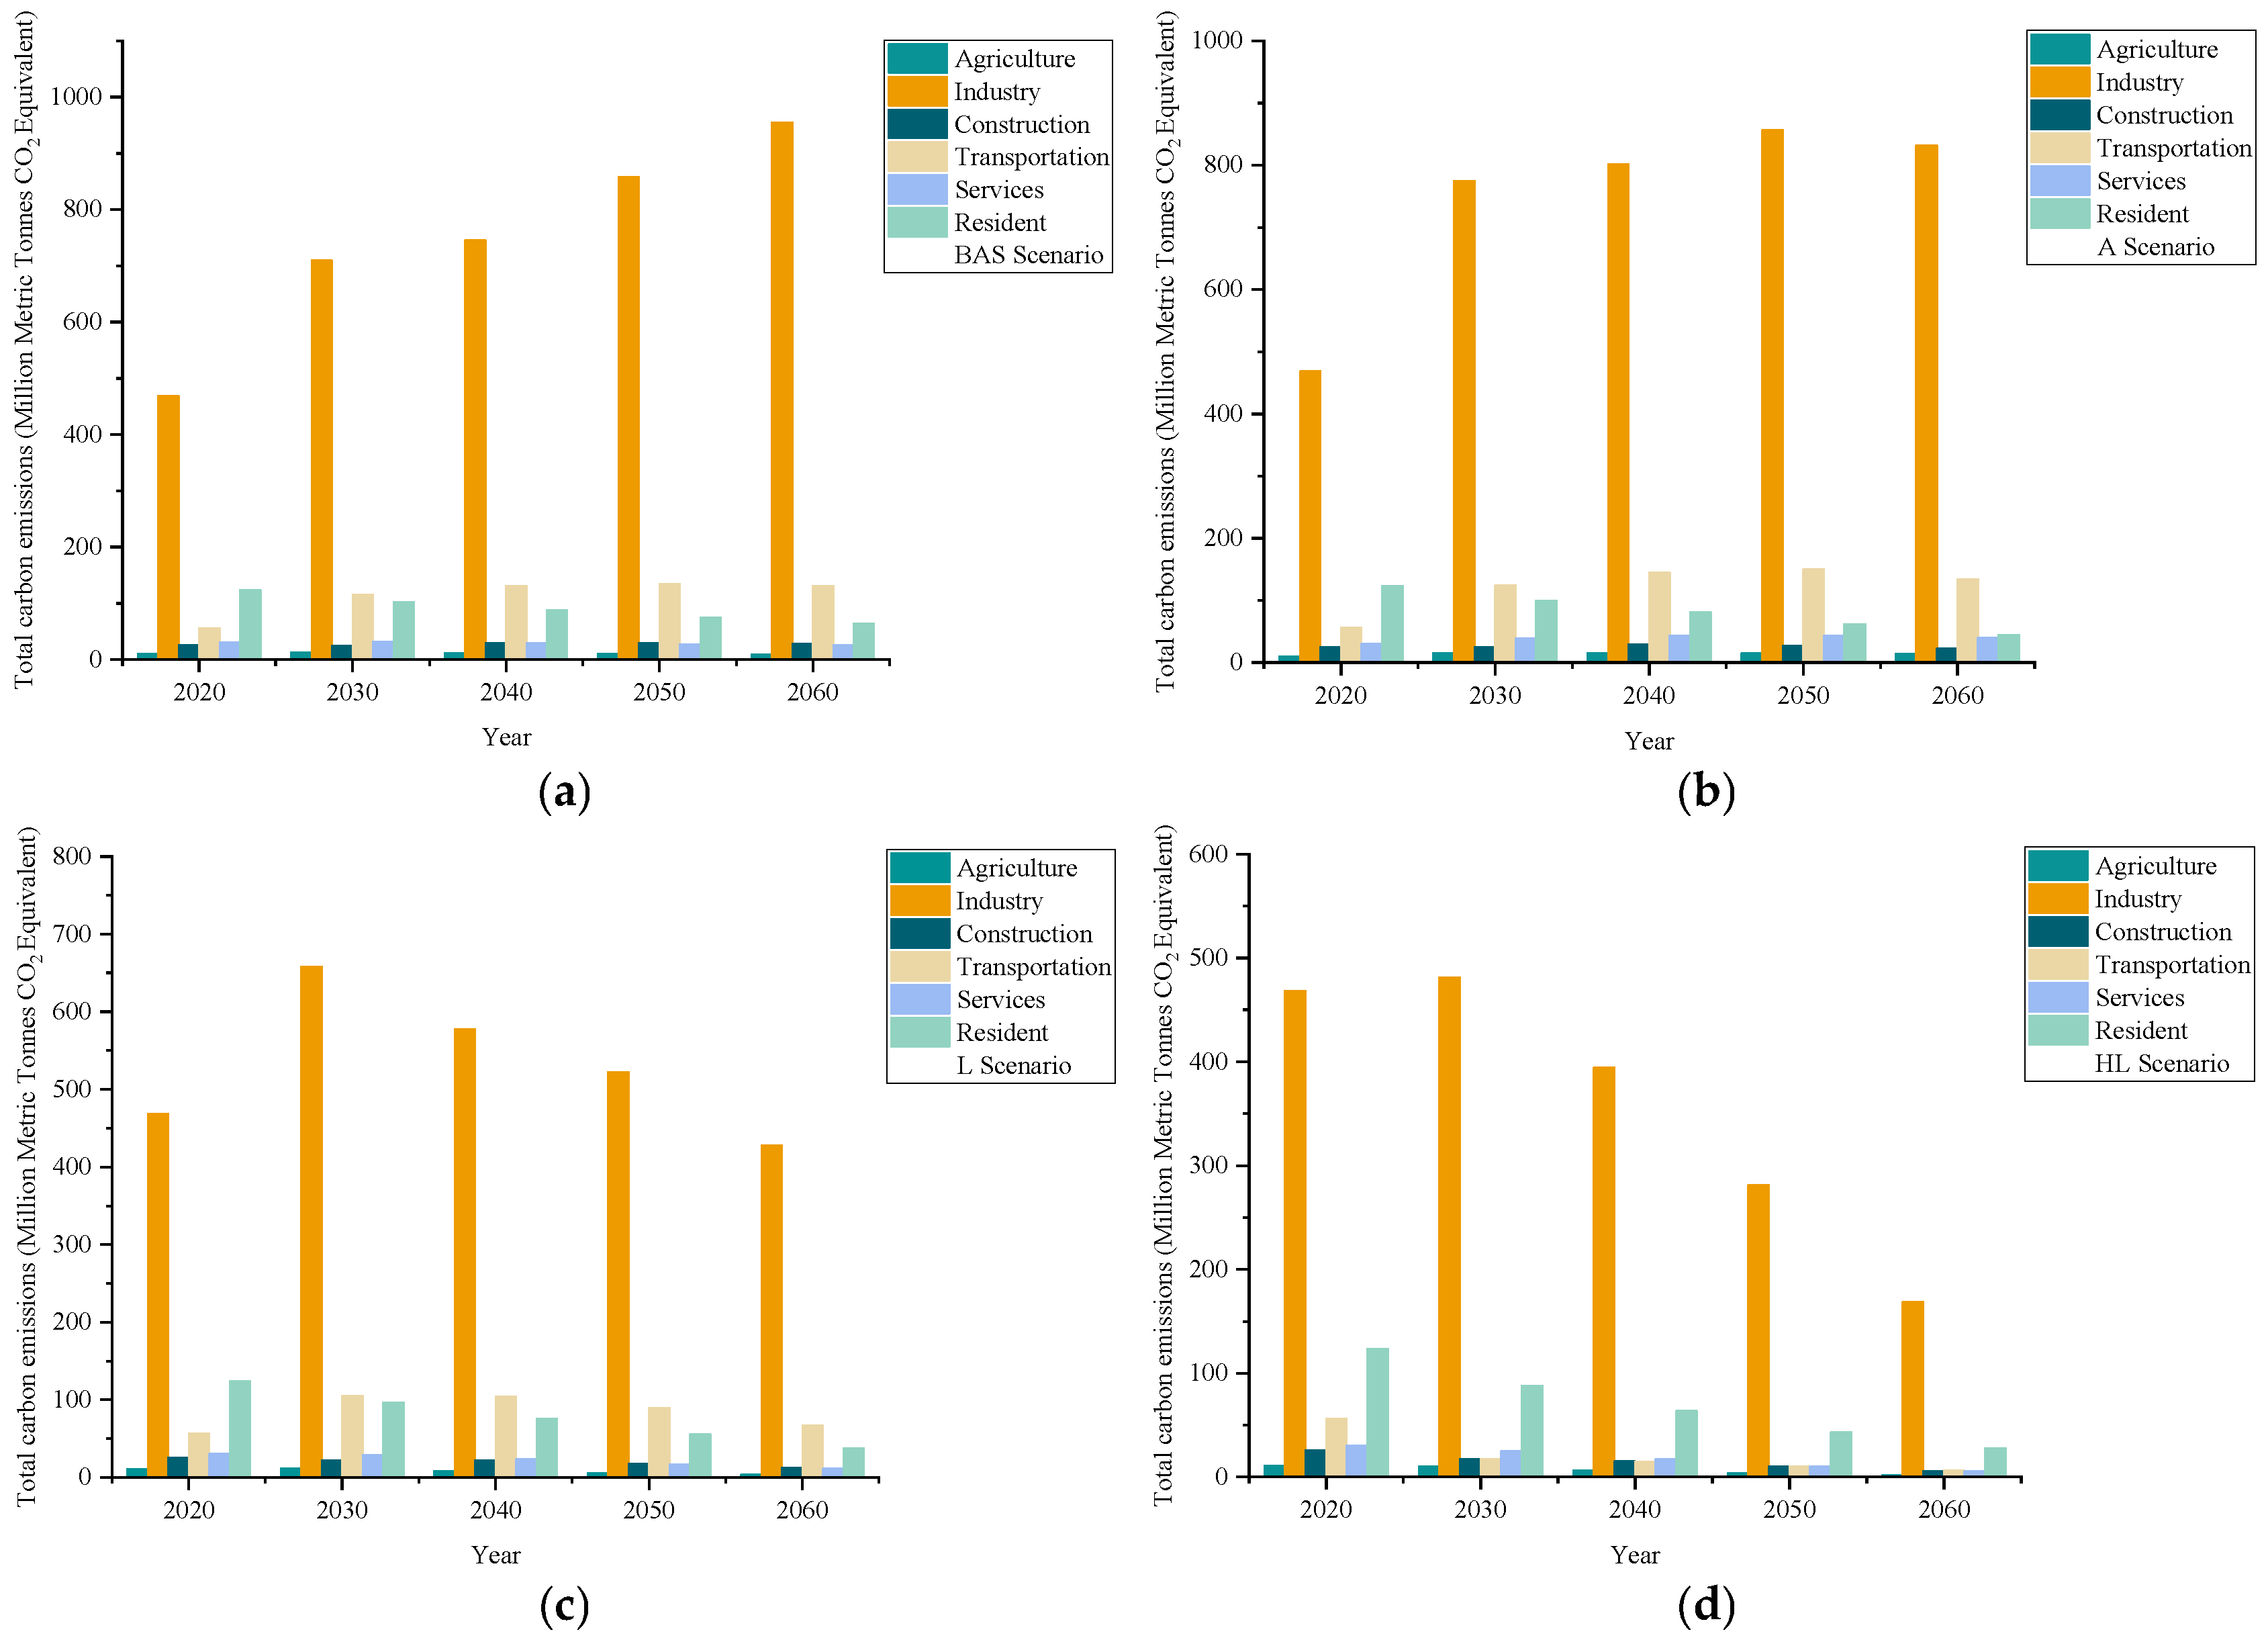
4.3. Energy Demand and Carbon Emission Characteristics by Sector

Figure 9 shows the proportion of energy demand by sector in the Sichuan-Chongqing region under different scenarios. Overall, although there are differences between the scenarios, some common trends are evident. First, the industry sector holds the largest share of energy demand in all scenarios, highlighting the industry’s central role in the economic development of the Sichuan-Chongqing region and its heavy reliance on energy. To achieve the goal of doubling the region’s GDP by 2035 [46], industrial energy demand is expected to continue rising, which will increase the pressure on carbon reduction in the region.
Second, energy demand in the transportation sector shows significant changes. As traditional fossil fuels such as coal and oil are gradually replaced, the use of electricity and other clean energy sources is driving the energy structure transformation in the transportation sector. In the High-Efficiency Low-Carbon Scenario (HL), the energy demand of the transportation sector is significantly reduced, reflecting the future trend of electrification and clean energy replacing fuel-powered vehicles. In addition, while energy demand in the services sector and residents sector grows, the overall change is relatively small, mainly influenced by economic and population growth. In these sectors, the application of clean energy has yet to have a significant impact on overall energy demand.
In contrast, the energy demand of the construction and agriculture sectors accounts for a relatively small share, reflecting their lower contribution to overall energy consumption in the Sichuan-Chongqing region. However, with the promotion of green building technologies and the advancement of agricultural modernization, energy efficiency in these two sectors is expected to improve in the future.
Figure 10 shows the contribution of various energy types to carbon emissions in the Sichuan-Chongqing region under different scenarios. Consistent with energy demand trends, adjustments in the energy structure directly impact changes in carbon emissions. In the Baseline Scenario (BAS), due to the uncontrolled use of fossil fuels such as coal and oil, traditional energy sources are expected to remain the primary contributors to carbon emissions in the future. After 2042, the growth rate of carbon emissions is expected to accelerate, showing an overall divergent trend, making it difficult to achieve carbon neutrality.
Although the Alleviate Scenario (A) shows some adjustments in the energy structure, the overall carbon emissions remain high. Carbon emissions are expected to increase at a slower rate from 2020 to 2040, and after 2040, they will gradually increase until they peak at approximately 1.163 billion tons of CO2 equivalent in 2047, before slowly declining. By 2060, emissions will have increased by 52.14% compared to the baseline year. The adjustment in the energy structure plays a role in reducing carbon emissions, allowing for the achievement of the carbon peak but making it difficult to reach carbon neutrality in this scenario.
The Low-Carbon Scenario (L) shows more favorable results for carbon emission control. By increasing the use of clean energy sources such as electricity and natural gas and gradually reducing the consumption of fossil fuels, carbon emissions are expected to peak in 2028 and then gradually decline. The adjustment in the energy structure plays a key role in reducing carbon emissions, making the emission reduction pathway more stable in this scenario. However, due to the high remaining carbon emissions (carbon emissions in 2060), achieving carbon neutrality remains challenging.
The High-Efficiency Low-Carbon Scenario (HL) shows the most ideal results. In this scenario, with the widespread use of electricity and clean energy, carbon emissions decline annually from 2020 without a noticeable peak, and the remaining carbon emissions are 24.38% of the baseline year. This indicates that by significantly improving energy efficiency and promoting the use of clean energy, the Sichuan-Chongqing region is expected to continuously reduce carbon emissions and ultimately achieve carbon neutrality.
In conclusion, as the energy structure is optimized and electrification accelerates, electricity demand is set to become the primary source of energy consumption in the Sichuan-Chongqing region. Although electricity demand will increase, driven by clean energy, total carbon emissions are expected to decline significantly. Especially in the High-Efficiency Low-Carbon Scenario, by significantly improving energy efficiency and widely promoting clean energy, the Sichuan-Chongqing region can not only achieve a continuous reduction in carbon emissions but also promote a green, low-carbon, and circular economic model, ultimately reaching the carbon neutrality goal. Therefore, the future development path should focus on continuously promoting the transformation of the energy structure, improving energy efficiency, and expanding the application of electricity and clean energy. This will not only be key to the region’s low-carbon development but also an important measure for promoting sustainable development, contributing to the coordinated and mutually beneficial development of the economy, environment, and society.

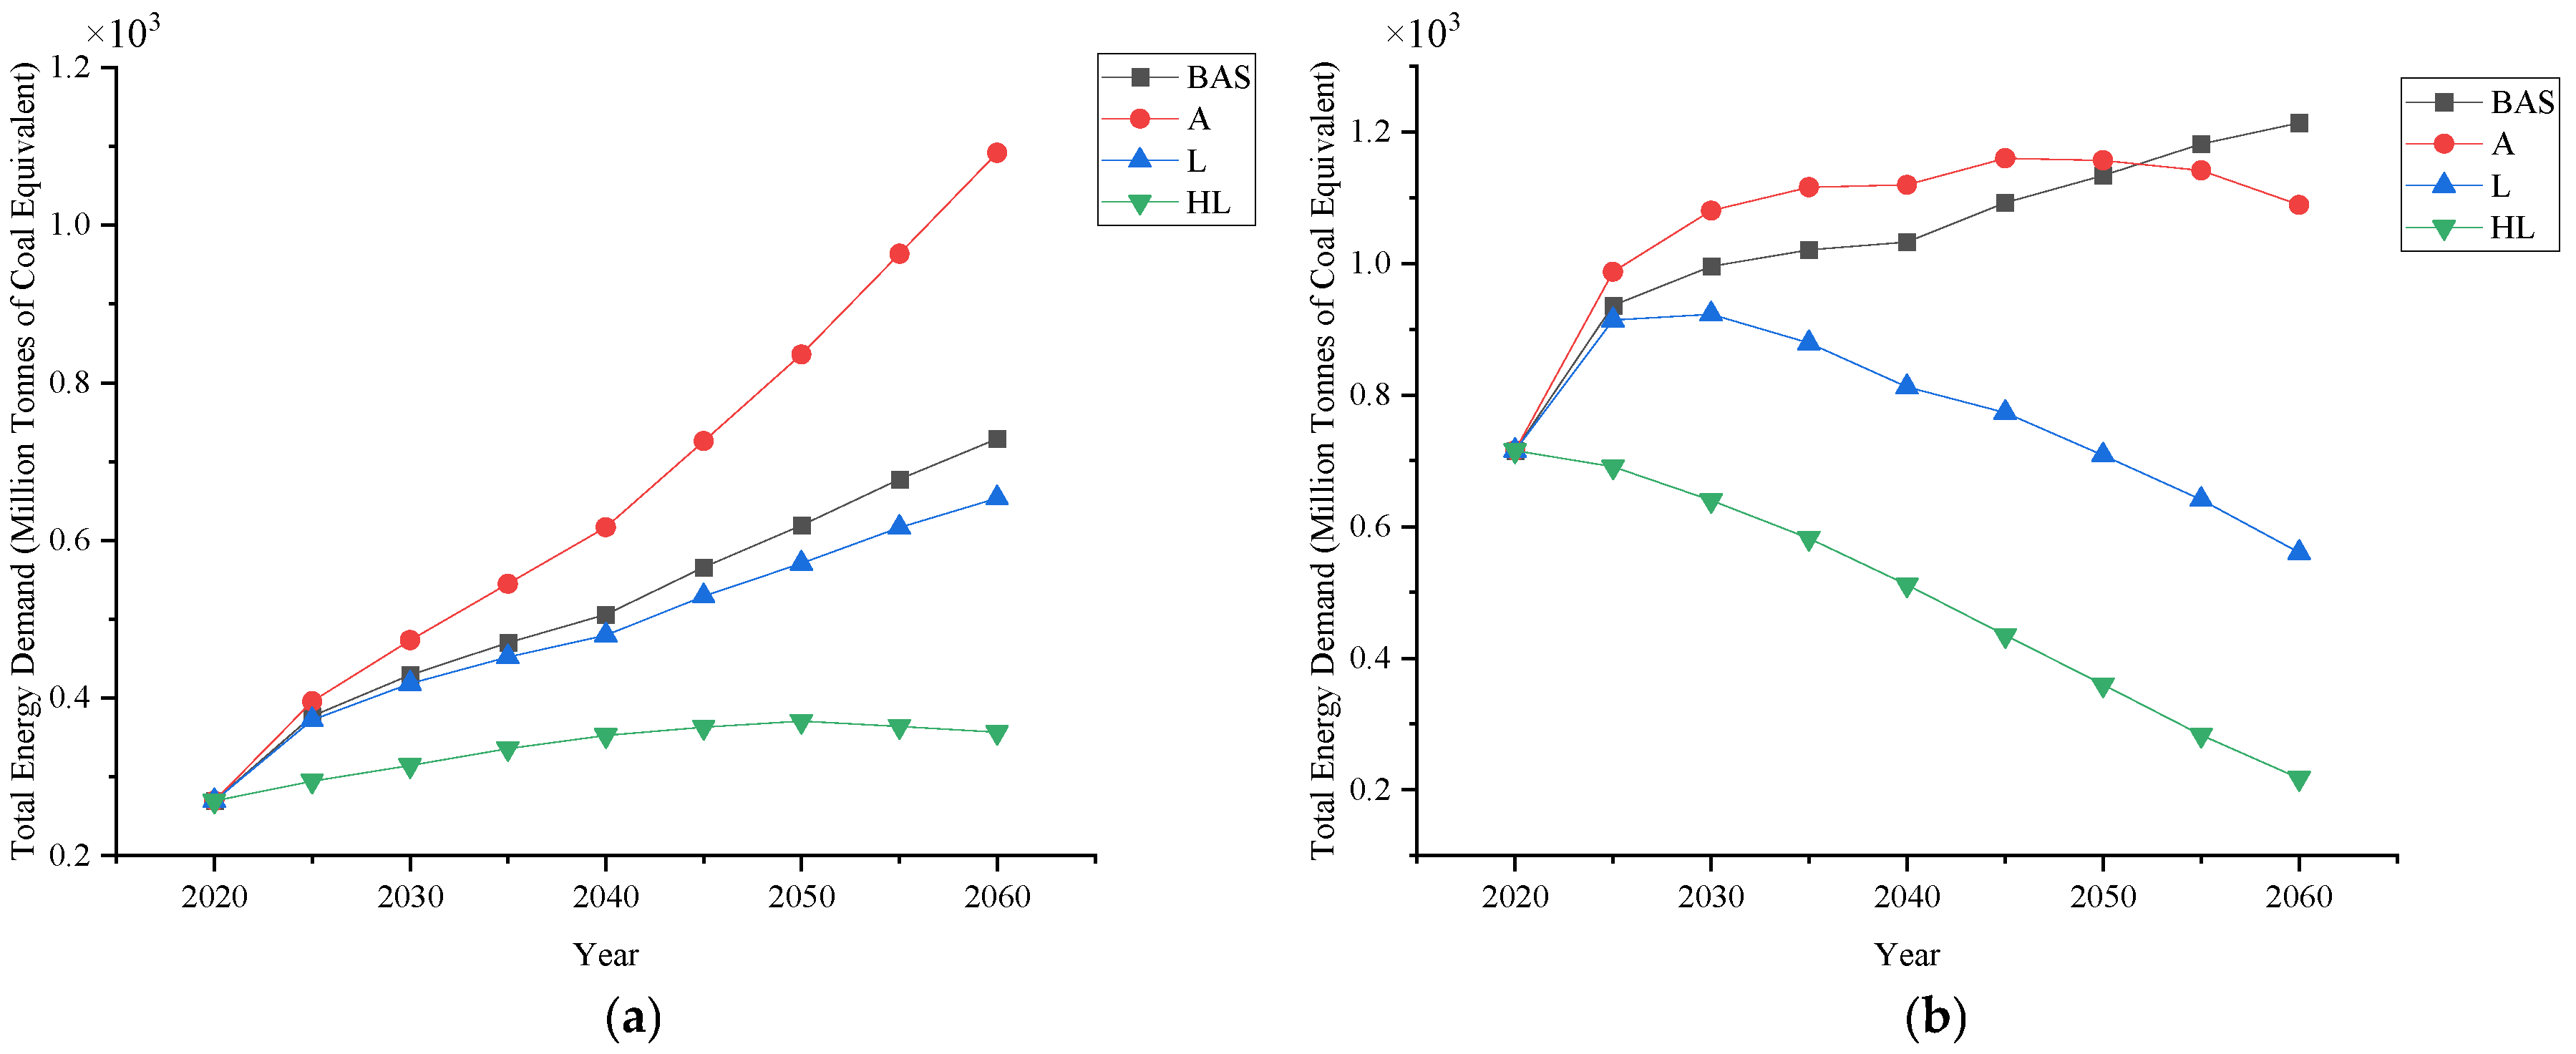
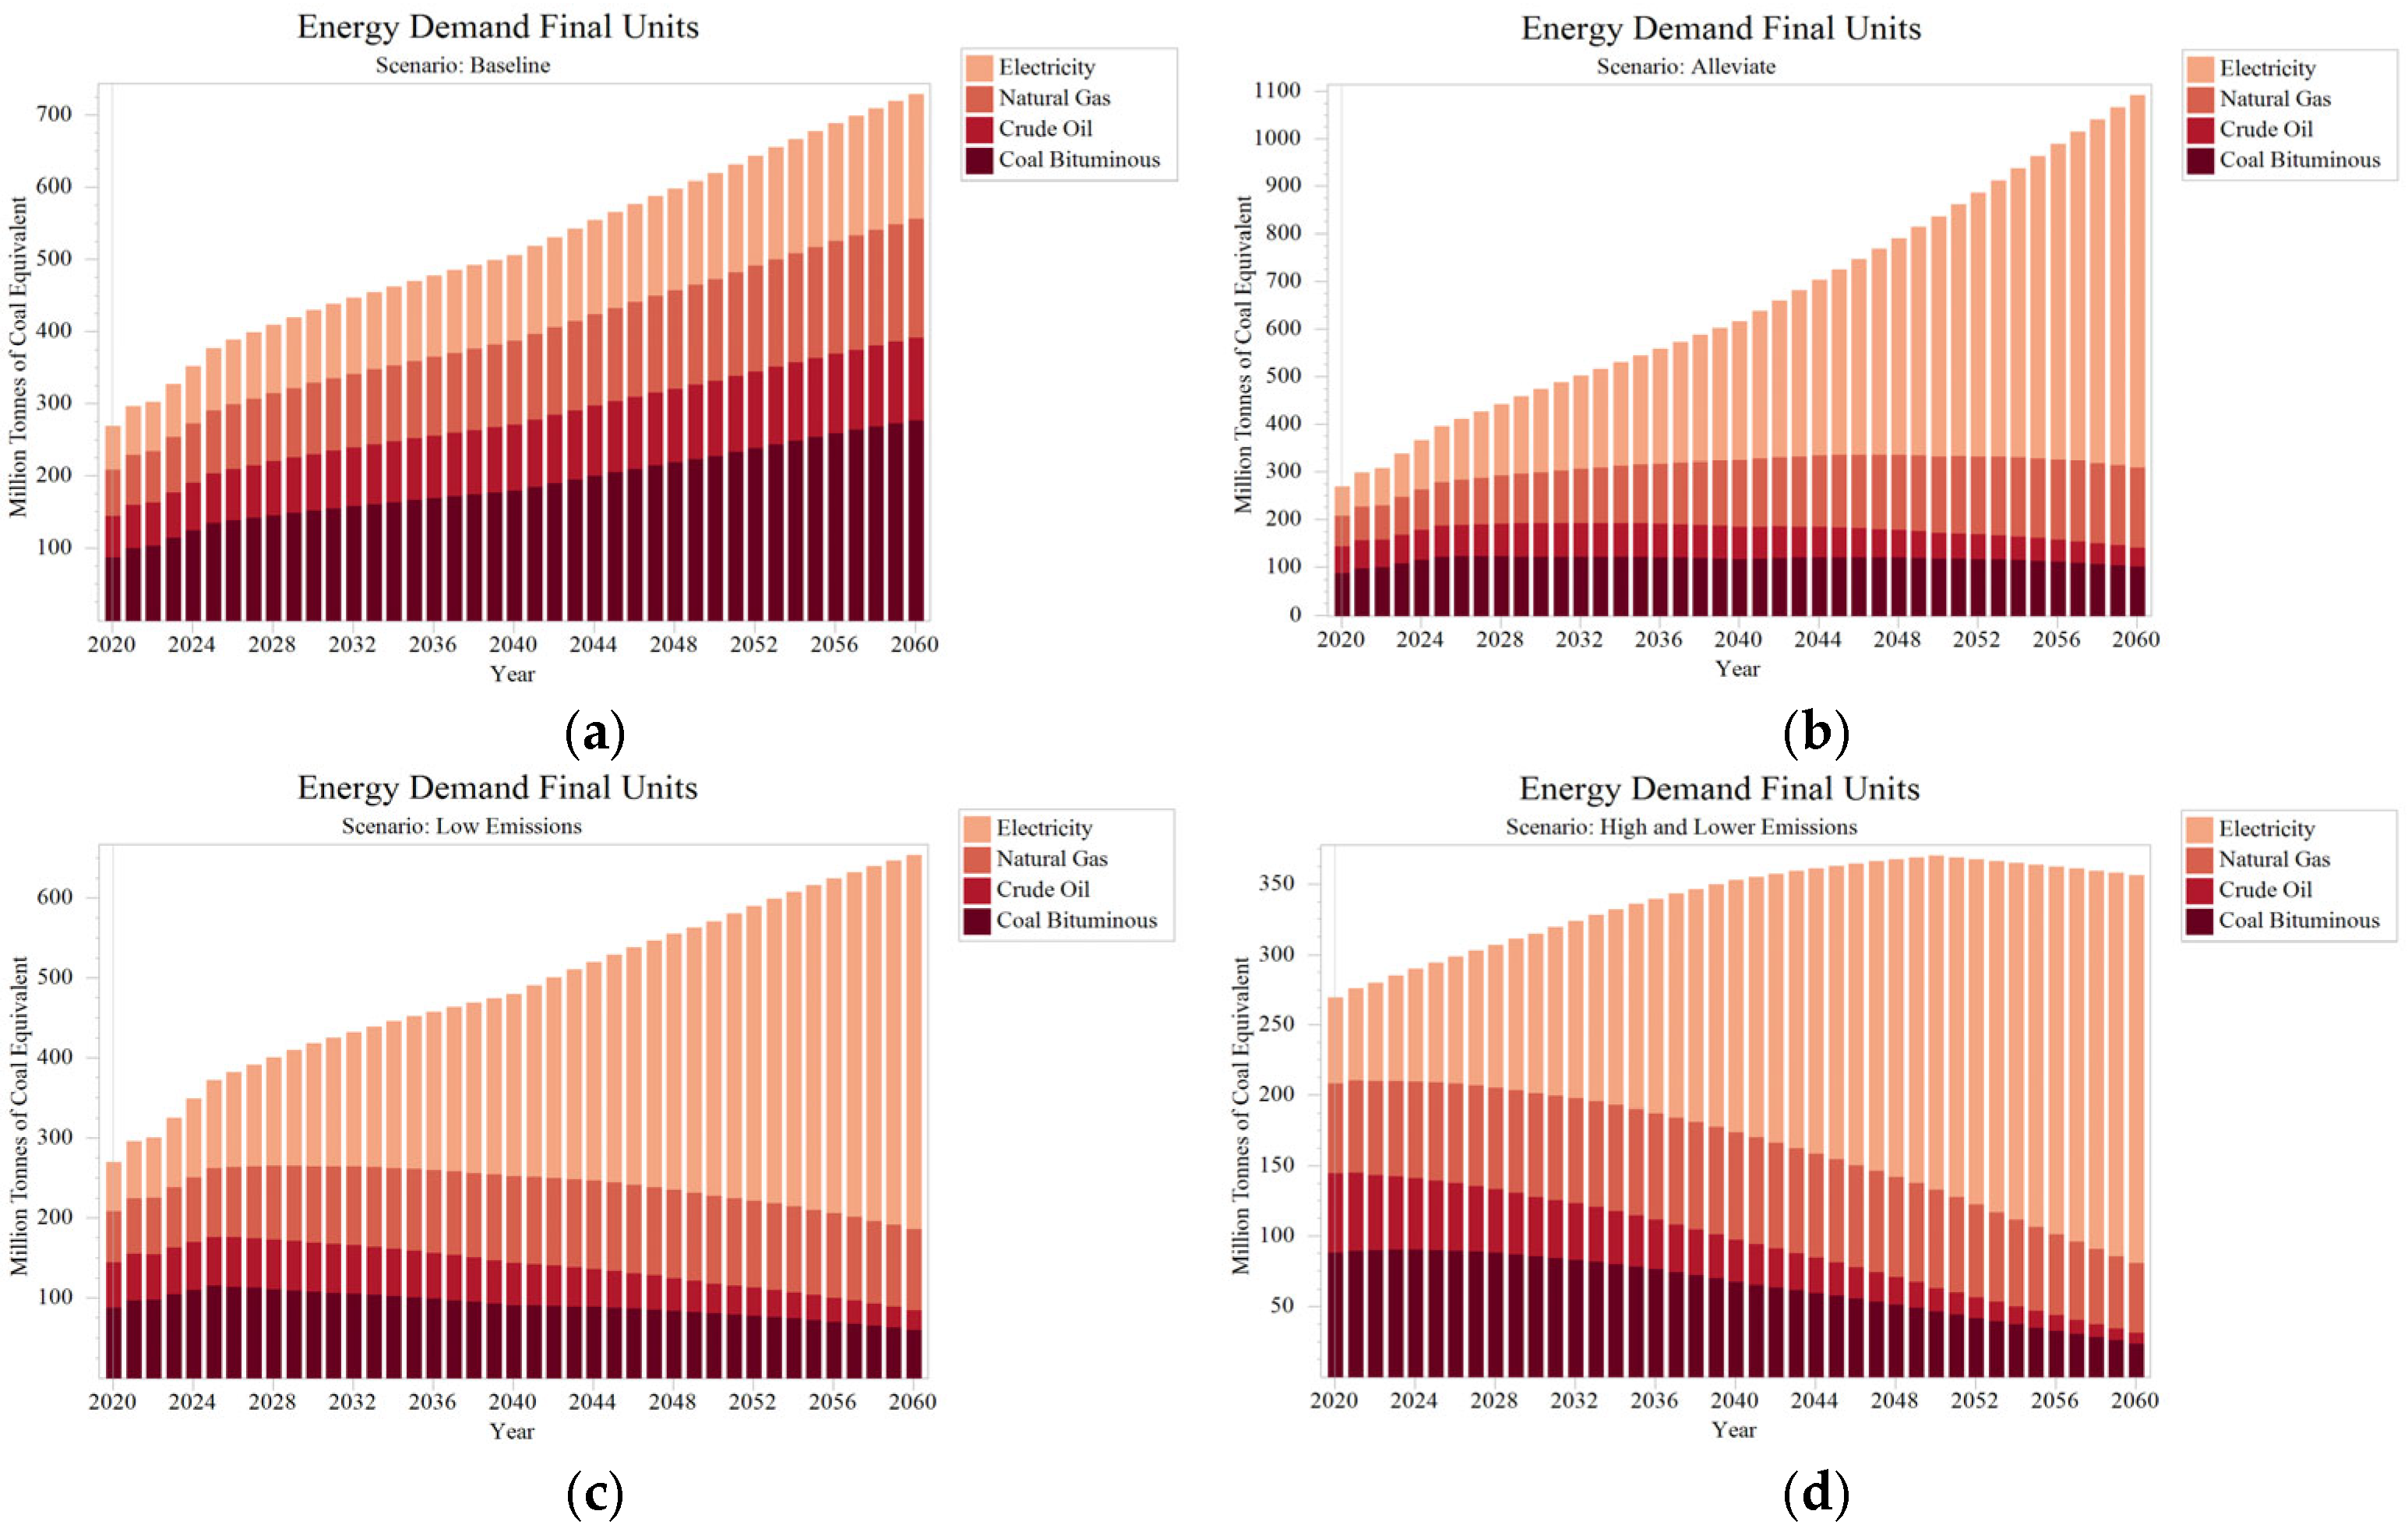
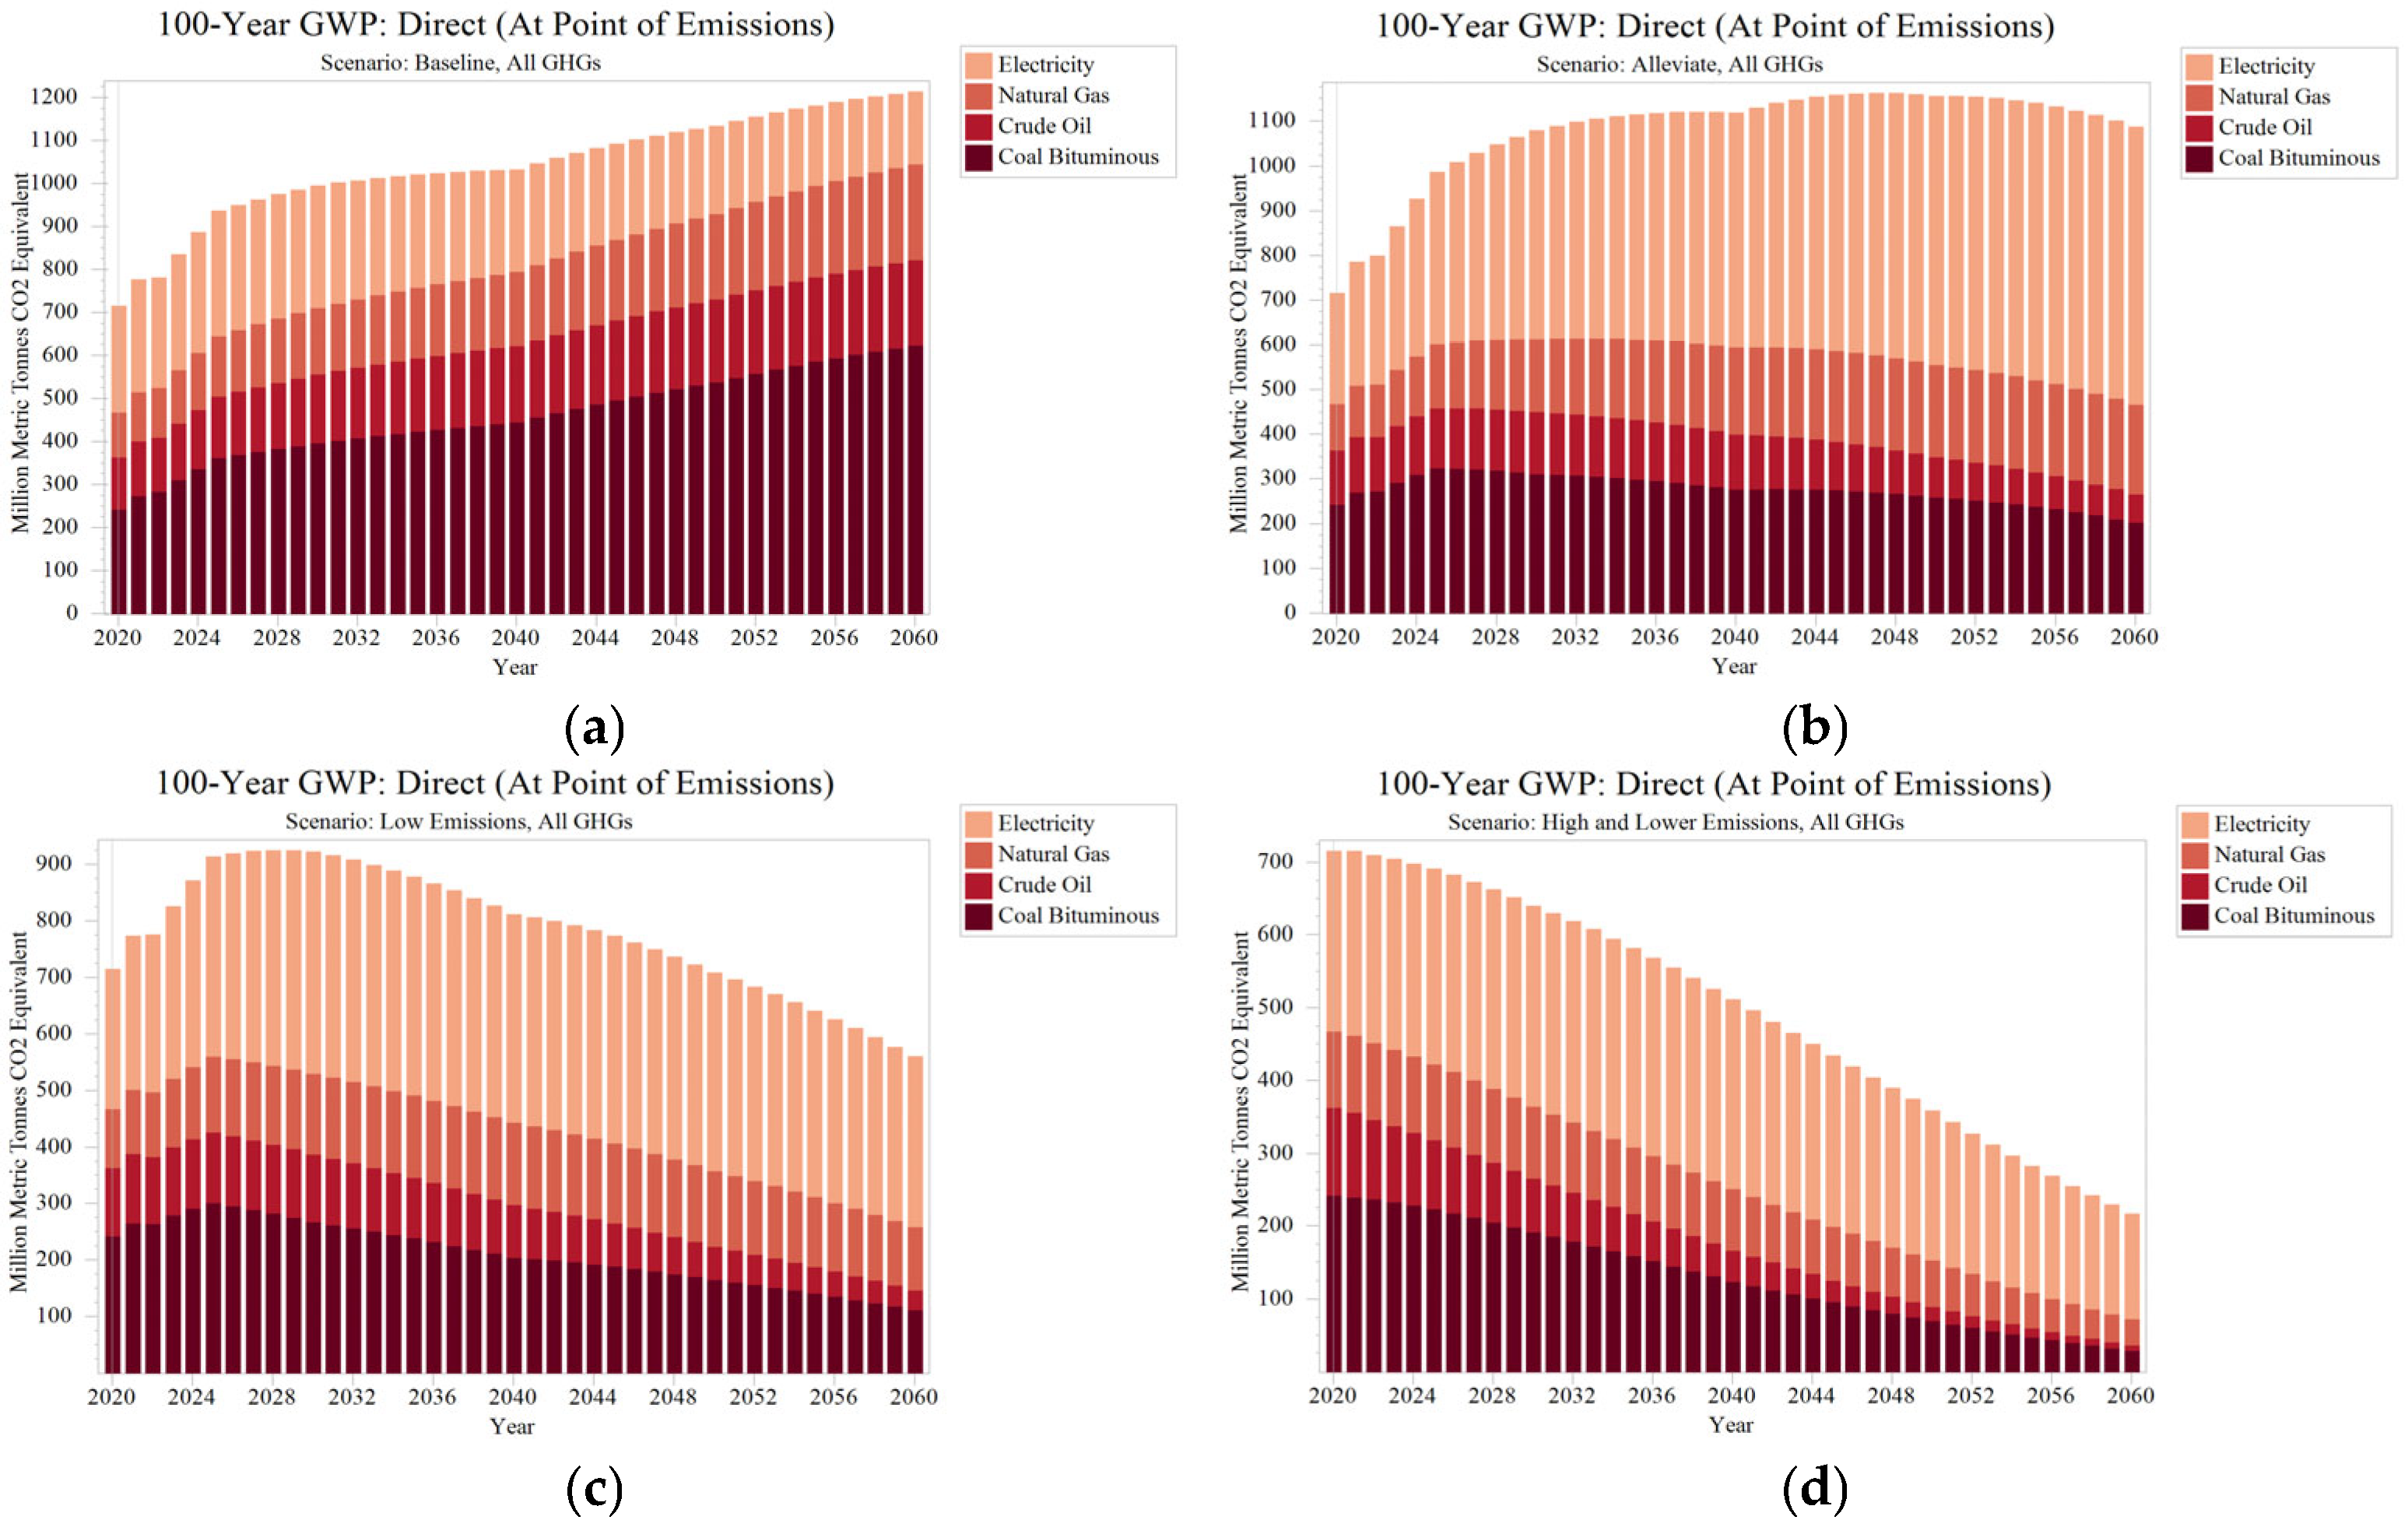
4.4. Analysis of Carbon Peaking and Emission Trends Under Different Scenarios

According to the analysis results from Figure 10 and Figure 11, the carbon peaking time in the Sichuan-Chongqing region varies across different scenarios. Specifically, in the Baseline Scenario (BAS), carbon emissions continue to rise and do not reach a peak. In the Alleviative Scenario (A), emissions are expected to peak in 2047, but it is difficult to achieve carbon neutrality after reaching the peak. In the Low-Carbon Scenario (L), the peak time is further advanced to 2028. Notably, in the High-Efficiency Low-Carbon Scenario (HL), carbon emissions continuously decline from 2020 without a significant peak. This demonstrates that improvements in energy efficiency and the optimization of the energy structure are the key driving forces for achieving carbon neutrality in the Sichuan-Chongqing region.
As shown in Figure 11, the total carbon emissions from multiple sectors in the Sichuan-Chongqing region generally follow a “peak and then decline” or “continuous decline” trend across different scenarios. The industry sector dominates carbon emissions in all scenarios due to its wide coverage and high energy demand. In the BAS and A scenarios, the overall trend in the industry sector shows an increase, indicating that due to minimal improvements in energy efficiency and insufficient adjustments in the energy structure, the industry sector needs to consume more energy and generate more carbon emissions to meet the expected GDP target. This trend reflects the close relationship between changes in energy demand and the optimization of the energy structure. In the four scenarios, the peak carbon emissions from the industry sector range from 400 million to 900 million tons of CO2 equivalent, underscoring the sector’s importance in regional carbon emissions.
In contrast, the carbon emissions from other sectors are relatively small, ranging between 10 and 120 million tons of CO2 equivalent. These sectors include transportation, construction, agriculture, services, and residents. Although these sectors contribute less to overall emissions, they also show significant emission reductions as energy efficiency improves and the energy structure gradually transitions, particularly with the advancement of electrification. The multi-sector and multi-field energy structure adjustment creates a cumulative effect on overall carbon reduction, strongly promoting the carbon neutrality process in the Sichuan-Chongqing region.
To ensure the achievement of the 2060 carbon neutrality target and the smooth implementation of the sustainable development strategy in the Sichuan-Chongqing region, coordinated measures must be taken across multiple fields. First, promoting energy-saving technologies in the industry sector is crucial, as this sector has significant potential for energy savings. Second, the development of green buildings and public transportation will significantly reduce carbon emissions from the construction and transportation sectors. Third, increasing the share of clean energy in the energy structure, especially expanding the application of hydropower, wind power, and photovoltaic power generation, will greatly reduce reliance on fossil fuels [55]. Additionally, actively developing and utilizing natural gas, biomass energy, and geothermal energy as substitutes for traditional fossil fuels will also contribute positively to carbon reduction.
Meanwhile, establishing a carbon trading market, implementing stringent energy-saving and emission-reduction policies, and raising public awareness of environmental protection are also necessary steps. Moreover, these measures help promote resource recycling and environmental protection, drive the establishment of a green, low-carbon economic model, and provide a solid foundation for ecological civilization construction and sustainable development. These policy measures will encourage industries and individuals to actively participate in carbon reduction actions through economic incentives and social responsibility, thereby effectively reducing carbon emissions while ensuring continuous economic growth and gradually achieving the goal of carbon neutrality [56].

5. Conclusions

This study analyzed the current state of energy consumption and carbon emissions in the Sichuan-Chongqing region and quantitatively assessed the carbon emission pathways from 2020 to 2060 using the LEAP model. The results show that the Baseline Scenario (BAS) fails to achieve a carbon emissions peak, while in the Alleviative Scenario (A), carbon emissions are expected to peak in 2047. In contrast, under the Low-Carbon Scenario (L) and High-Efficiency Low-Carbon Scenario (HL), carbon emissions peak in 2028 and 2020, respectively. Notably, in the High-Efficiency Low-Carbon Scenario, carbon emissions decrease year by year from 2020, and by 2060, they are expected to drop to approximately 200 million tons of CO2 equivalent. This remaining carbon emissions volume can be offset through negative emission technologies such as BECCS, carbon sinks, or purchasing emission allowances, thereby achieving urban carbon neutrality by 2060 [57].
The results further emphasize that optimizing the energy structure and improving energy efficiency are key to achieving carbon neutrality in the Sichuan-Chongqing region. Under the Low-Carbon Scenario (L), electricity demand is projected to account for 71.42% of total energy demand by 2060, while fossil fuel demand will significantly decrease. In the High-Efficiency Low-Carbon Scenario (HL), total energy demand begins to decline after 2050, with total energy consumption reaching 350 million tons of standard coal by 2060 and electricity demand accounting for 77.32%. The substitution effect of clean energy is particularly significant, enabling the Sichuan-Chongqing region to peak in energy consumption by 2050 and significantly reduce carbon emissions by 2060.
Comprehensive analysis indicates that achieving the carbon neutrality goal in the Sichuan-Chongqing region requires the coordinated efforts of clean energy transformation, energy-saving technology promotion, and policies and market mechanisms. The widespread adoption of clean energy is key to driving the transformation of the green energy structure, while the promotion of energy-saving technologies helps build a more sustainable economic model. Policies and market mechanisms provide institutional support for the application of green technologies and the control of greenhouse gas emissions. This study emphasizes that by advancing electrification and improving energy efficiency in energy-intensive sectors such as industry, transportation, and construction, the Sichuan-Chongqing region is expected to significantly reduce carbon emissions. These strategies not only provide methodological and technical support for achieving the carbon neutrality goal and promoting low-carbon sustainable development in the region but also play a vital role in addressing climate change, fostering regional cooperation, and realizing sustainable economic, social, and environmental development. Furthermore, these experiences and strategies also offer valuable references for low-carbon transitions in other regions.

Author Contributions

Conceptualization, X.X. and Y.L.; methodology, H.Z.; software, Y.L.; validation, Y.L., H.Z., and Z.C.; formal analysis, Y.L.; investigation, Y.Z.; resources, X.X.; data curation, Z.C.; writing—original draft preparation, Y.L.; writing—review and editing, H.Z.; visualization, Y.L.; supervision, Z.C.; project administration, H.Z.; funding acquisition, X.X. All authors have read and agreed to the published version of the manuscript.

Funding

This research was funded by Sichuan Science and Technology Program, grant number NO:2024ZHCG0182, and Artificial Intelligence Key Laboratory of Sichuan Province, grant number NO:2023RYY01.

Institutional Review Board Statement

Not applicable.

Informed Consent Statement

Not applicable.

Data Availability Statement

The datasets used and/or analyzed during the current study are available from the corresponding author on reasonable request.

Conflicts of Interest

The authors declare no conflicts of interest.

References

  1. Zhang, Z.; Hu, G.; Mu, X.; Kong, L. From low carbon to carbon neutrality: A bibliometric analysis of the status, evolution and development trend. J. Environ. Manag. 2022, 322, 116087. [Google Scholar] [CrossRef]
  2. Raza, S.; Ghasali, E.; Raza, M.; Chen, C.; Li, B.; Orooji, Y.; Lin, H.; Karaman, C.; Maleh, H.K.; Erk, N. Advances in technology and utilization of natural resources for achieving carbon neutrality and a sustainable solution to neutral environment. Environ. Res. 2023, 220, 115135. [Google Scholar] [CrossRef]
  3. Li, R.; Liu, Q.; Cai, W.; Liu, Y.; Yu, Y.; Zhang, Y. Echelon peaking path of China’s provincial building carbon emissions: Considering peak and time constraints. Energy 2023, 271, 127003. [Google Scholar] [CrossRef]
  4. Xin, L.Y. Sichuan Has the Largest Installed Hydropower Capacity in China at 89.04 Million Kilowatts. Sichuan Daily, 20 December 2021; p. 001. [Google Scholar]
  5. Liang, H.M.; Wen, L.P. Discussion on the interconnection benefits of the Northwest Power Grid and the Sichuan-Chongqing Power Grid. Northwest Electr. Power Technol. 2001, 4–9+2. [Google Scholar]
  6. Fang, H.; Li, H. Analysis of Influencing Factors and Prediction of the Peak Value of Industrial Carbon Emission in the Sichuan-Chongqing Region. Sustainability 2024, 16, 4532. [Google Scholar] [CrossRef]
  7. Slamersak, A.; Kallis, G.; O’Neill, D.W. Energy requirements and carbon emissions for a low-carbon energy transition. Nat. Commun. 2022, 13, 15. [Google Scholar] [CrossRef]
  8. Liu, P.; Wu, J. Study on the diffusion of CCUS technology under carbon trading mechanism: Based on the perspective of tripartite evolutionary game among thermal power enterprises, government and public. J. Clean. Prod. 2024, 438, 140730. [Google Scholar]
  9. Liu, H.J.; Were, P.; Li, Q.; Gou, Y.; Hou, Z. Worldwide Status of CCUS Technologies and Their Development and Challenges in China. Geofluids 2017, 2017, 6126505. [Google Scholar]
  10. Ren, Z.; Zhang, S.; Liu, H.; Huang, R.; Wang, H.; Pu, L. The feasibility and policy engagements in achieving net zero emission in China’s power sector by 2050: A LEAP-REP model analysis. Energy Convers. Manag. 2024, 304, 118230. [Google Scholar]
  11. Han, J.; Li, J.; Tang, X.; Wang, L.; Yang, X.; Ge, Z.; Yuan, F. Coal-fired power plant CCUS project comprehensive benefit evaluation and forecasting model study. J. Clean. Prod. 2023, 385, 135657. [Google Scholar] [CrossRef]
  12. Zhao, K.K.; Cui, X.Z.; Zhou, Z.H.; Huang, P.X. Impact of uncertainty on regional carbon peak paths: An analysis based on carbon emissions accounting, modeling, and driving factors. Environ. Sci. Pollut. Res. 2022, 29, 17544–17560. [Google Scholar] [CrossRef]
  13. Zhang, Y.; Kong, Y.; Quan, J.; Wang, Q.; Zhang, Y.; Zhang, Y. Scenario analysis of energy consumption and related emissions in the transportation industry-a case study of Shaanxi Province. Environ. Sci. Pollut. Res. Int. 2024, 31, 26052–26075. [Google Scholar] [PubMed]
  14. Li, B.; Zhou, W.; Xian, Y.; Guan, X. Forecasting the energy demand and CO2 emissions of industrial sectors in China’s Beijing-Tianjin-Hebei region under energy transition. Environ. Sci. Pollut. Res. 2024, 31, 7283–7297. [Google Scholar] [CrossRef]
  15. Zhang, C.; Luo, H. Research on carbon emission peak prediction and path of China’s public buildings: Scenario analysis based on LEAP model. Energy Build. 2023, 289, 113053. [Google Scholar]
  16. Lili, S.; Huijuan, C.; Quansheng, G. Will China achieve its 2060 carbon neutral commitment from the provincial perspective? Adv. Clim. Change Res. 2022, 13, 169–178. [Google Scholar]
  17. Elzen, M.d.; Fekete, H.; Höhne, N.; Admiraal, A.; Forsell, N.; Hof, A.F.; Olivier, J.G.J.; Roelfsema, M.; Soest, H.v. Greenhouse gas emissions from current and enhanced policies of China until 2030: Can emissions peak before 2030? Energy Policy 2016, 89, 224–236. [Google Scholar]
  18. Zou, Z.; Ahmad, M. Economic digitalization and energy transition for green industrial development pathways. Ecol. Inform. 2023, 78, 102323. [Google Scholar] [CrossRef]
  19. Bai, Y.; Huang, Y.; Jiang, M.; Zhao, P.; Qi, Q.; Wang, Q. Spillover effects of structure-adjustment pollution reduction measures in China’s iron and steel industry. J. Environ. Manag. 2024, 368, 122133. [Google Scholar] [CrossRef]
  20. Huang, Y.; Wang, Y.; Peng, J.; Li, F.; Zhu, L.; Zhao, H.; Shi, R. Can China achieve its 2030 and 2060 CO2 commitments? Scenario analysis based on the integration of LEAP model with LMDI decomposition. Sci. Total Environ. 2023, 888, 164151. [Google Scholar]
  21. Liang, X.; Fan, M.; Huang, X.; Cai, C.; Zhou, L.; Wang, Y. Spatial distributed characteristics of carbon dioxide emissions based on fossil energy consumption and their driving factors at provincial scale in China. Energy 2024, 309, 133062. [Google Scholar]
  22. Wang, T.; Lun, X.X. [Construction Path of “Zero Carbon” Power Plant Based on the LEAP Model]. Huan Jing Ke Xue = Huanjing Kexue 2024, 45, 5632–5640. [Google Scholar] [PubMed]
  23. Ji, J.; Cao, L.; Bi, Y.; Zeng, Y.; Wang, D. Low-Carbon Transformation in Megacities: Benefits for Climate Change Mitigation and Socioeconomic Development—A Case Study of Shenzhen, China. Sustainability 2024, 16, 6062. [Google Scholar] [CrossRef]
  24. Li, S.; Kong, W.; Wang, Y.; Yuan, L. Medium and long-term energy demand forecasts by sectors in China under the goal of “carbon peaking & carbon neutrality”: Based on the LEAP-China model. Energy 2024, 310, 133017. [Google Scholar]
  25. Golfam, P.; Ashofteh, P.-S. Environmental-economic analysis of regional energy system under different supply and demand side scenarios with LEAP model. Environ. Dev. Sustain. 2024, 1–22. [Google Scholar] [CrossRef]
  26. Wan, F.; Li, J. Exploring hydrogen metallurgy to CO2 emissions reduction in China’s iron and steel production: An analysis based on the life cycle CO2 emissions—LEAP model. Energy Rep. 2024, 11, 4552–4563. [Google Scholar] [CrossRef]
  27. Hanson, E.; Nwakile, C.; Hammed, V.O. Carbon capture, utilization, and storage (CCUS) technologies: Evaluating the effectiveness of advanced CCUS solutions for reducing CO2 emissions. Results Surf. Interfaces 2025, 18, 100381. [Google Scholar] [CrossRef]
  28. Ping, W.X.; Wei, D.; Gu, L.S.; Liang, Z.J.; Lan, K.W. Spatial Correlation Network and Influencing Factors of Interprovincial Carbon Peak and Carbon Neutrality Capacity in China. Environ. Sci. 2025, 1–18. [Google Scholar] [CrossRef]
  29. Xing, Z.W.; Ming, C.J.; Meng, L.Y.; Dan, H.Y.; Feng, J.H. Global regional carbon neutrality estimation under different emission reduction policies based on the RICE model. Clim. Environ. Res. 2024, 29, 329–338. [Google Scholar]
  30. Zeng, J. (Ed.) Sichuan Statistical Yearbook 2023; China Statistics Press: Beijing, China, 2024; pp. 4–5. ISBN 978-7-5230-0162-2. [Google Scholar]
  31. Yang, H.; Li, T. (Eds.) Chongqing Statistical Yearbook 2023; China Statistics Press: Beijing, China, 2024; p. 5. ISBN 978-7-5230-0161-5. [Google Scholar]
  32. Guan, D.B.; Zhu, L.; Li, S.Y. Carbon Emission Accounts and Datasets. Available online: https://www.ceads.net/ (accessed on 14 September 2024).
  33. People’s Government of Sichuan Province. Sichuan Province “14th Five-Year Plan” for Energy Development. Available online: https://www.scgw.gov.cn/UploadFile/ArticFile/2022/3/21/bb8b27f5-7ca9-4954-8657-333367f7cd60.pdf (accessed on 15 October 2024).
  34. Chongqing Municipal People’s Government. Interpretation of the “14th Five-Year Plan” for Energy Development in Chongqing (2021–2025). Available online: https://www.cq.gov.cn/zwgk/zfxxgkml/zcjd_120614/bmjd/202206/t20220627_10859804.html (accessed on 14 October 2024).
  35. State Council of the People’s Republic of China. Carbon Peaking Action Plan Before 2030. Available online: https://files.in5.cn/guifan/202110/202110-2030%E5%B9%B4%E5%89%8D%E7%A2%B3%E8%BE%BE%E5%B3%B0%E8%A1%8C%E5%8A%A8%E6%96%B9%E6%A1%88.pdf (accessed on 12 October 2024).
  36. Cai, Z.; Li, Q.; Dai, S. Discussion on key technologies and model for hydropower-dominated electricity spot market in sichuan. In Proceedings of the 2021 China International Conference on Electricity Distribution (CICED), Shanghai, China, 7–9 April 2021; pp. 1074–1078. [Google Scholar]
  37. Energy; New Findings from Sichuan University in the Area of Energy Reported (Optimal Sizing of Hydro-PV-Pumped Storage Integrated Generation System Considering Uncertainty of PV, Load and Price). Energy Weekly News 2019. Available online: https://www.mdpi.com/1996-1073/12/15/3001 (accessed on 14 October 2024).
  38. Qi, Y.; Yu, G. Selection and Optimization of China’s Energy Transformation Pathway Under Carbon-Neutral Targets. Processes 2024, 12, 1758. [Google Scholar] [CrossRef]
  39. Rui, L.L.; Ming, H.Z.; Jie, W.Y.; Bo, Z.Y. Research on marketing strategies for “coal-to-gas” transition in the Sichuan-Chongqing region. Nat. Gas Technol. Econ. 2017, 11, 62–64+83–84. [Google Scholar]
  40. Perissi, I.; Martelloni, G.; Bardi, U.; Natalini, D.; Jones, A.; Nikolaev, A.; Eggler, L.; Baumann, M.; Samsó, R.; Solé, J. Cross-validation of the MEDEAS energy-economy-environment model with the integrated MARKAL-EFOM system (TIMES) and the long-range energy alternatives planning system (LEAP). Sustainability 2021, 13, 1967. [Google Scholar] [CrossRef]
  41. Liu, A.; Ye, L. (Eds.) China Statistical Yearbook 2024; China Statistics Press: Beijing, China, 2024; pp. 4–5. ISBN 978-7-5230-0486-9. [Google Scholar]
  42. Qi, Y.; Liu, H.; Zhao, J.; Zhang, S.; Zhang, X.; Zhang, W.; Wang, Y.; Xu, J.; Li, J.; Ding, Y. Trends and driving forces of agricultural carbon emissions: A case study of Anhui, China. PLoS ONE 2024, 19, e0292523. [Google Scholar] [CrossRef]
  43. Yi, L.X.; Wei, Y.Z.; Xue, L.L. Research on the evolution path of urban electricity consumption driven by terminal electrification. Proc. CSU-EPSA 2025, 1–11. [Google Scholar] [CrossRef]
  44. Armin, A.; Shiva, G.; Ahmad, B. Development and performance evaluation of a photovoltaic-powered induction cooker (PV-IC): An approach for promoting clean production in rural areas. Clean. Eng. Technol. 2022, 6, 100373. [Google Scholar]
  45. Yang, T.; Shu, Y.; Zhang, S.; Wang, H.; Zhu, J.; Wang, F. Impacts of end-use electrification on air quality and CO2 emissions in China’s northern cities in 2030. Energy 2023, 278, 127899. [Google Scholar]
  46. State Council of the People’s Republic of China. The 14th Five-Year Plan for National Economic and Social Development and the Vision for 2035 of the People’s Republic of China. Available online: https://www.gov.cn/xinwen/2021-03/13/content_5592681.htm (accessed on 27 October 2024).
  47. State Council of the People’s Republic of China. Sichuan Province’s “14th Five-Year Plan” Industrial Green Development Plan. Available online: https://www.dazhou.gov.cn/uploadfile/1/Attachment/7e01ad8483.pdf (accessed on 4 November 2024).
  48. Huo, T.; Xu, L.; Feng, W.; Cai, W.; Liu, B. Dynamic scenario simulations of carbon emission peak in China’s city-scale urban residential building sector through 2050. Energy Policy 2021, 159, 112612. [Google Scholar] [CrossRef]
  49. Dai, Y.; Zhu, Y.; Bai, Q. China’s Path to Low-Carbon Development by 2050: Scenario Analysis of Energy Demand and Carbon Emissions. Econ. Res. Ref. 2010, 2–22+33. [Google Scholar] [CrossRef]
  50. Meng, L.; Li, M.; Asuka, J. A scenario analysis of the energy transition in Japan’s road transportation sector based on the LEAP model. Environ. Res. Lett. 2024, 19, 044059. [Google Scholar] [CrossRef]
  51. Xu, M.; Liao, C.; Huang, Y.; Gao, X.; Dong, G.; Liu, Z. LEAP model-based analysis to low-carbon transformation path in the power sector: A case study of Guangdong-Hong Kong-Macao Greater Bay Area. Sci. Rep. 2024, 14, 7405. [Google Scholar] [CrossRef]
  52. People’s Government of Sichuan Province. Sichuan Province “14th Five-Year Plan” for Comprehensive Transportation Development. Available online: https://www.gyct.gov.cn/UploadFile/SiteFile/20160627193049219/2021/11/02/0fc2748ad3d44bc69cdebe2849c18121.pdf (accessed on 15 October 2024).
  53. People’s Government of Sichuan Province. Carbon Peaking Implementation Plan for Sichuan Province. Available online: https://www.eesia.cn/upload/files/2023/1/755debaf57d0675b.pdf (accessed on 16 October 2024).
  54. Ren, Z.; Zhou, B.; Ning, L.; Zheng, W.; Liu, H.; Hu, D.; Sun, J. Optimal dispatch of industrial loads considering process constraints for renewable energy consumption. Int. J. Electr. Power Energy Syst. 2025, 166, 110550. [Google Scholar]
  55. Zhong, F.; Yin, Y.; Tian, J.; Jiang, D.; Mao, Y. Carbon Reduction Pathways for Chinese Provinces: Considering Carbon Intensity Convergence, Regional Development Plans, and Shared Socioeconomic Pathways. Atmosphere 2024, 15, 918. [Google Scholar] [CrossRef]
  56. Qiu, L.; Niu, K.; He, W.; Hu, Y. Two Contribution Paths of Carbon Neutrality: Terrestrial Ecosystem Carbon Sinks and Anthropogenic Carbon Emission Reduction-A Case of Chongqing, China. Sustainability 2023, 15, 11306. [Google Scholar] [CrossRef]
  57. Fan, Y.; Xiu, Y. Construction of an Urban Carbon Neutrality Pathway Research Method Based on an Accounting Model: A Case Study of Chengdu. Urban Dev. Stud. 2023, 30, 113–123. [Google Scholar]
Figure 1. Research approach for the carbon neutrality pathway.
Sustainability 17 03233 g001
Figure 2. Administrative division map of Sichuan-Chongqing region.
Sustainability 17 03233 g002
Figure 3. Energy consumption and carbon emissions in the Sichuan-Chongqing region from 2015 to 2020, and the comparison between the simulated and actual values from 2021 to 2024. (a) Energy consumption; (b) Total carbon emissions; (c) Comparison of energy consumption; (d) Comparison of CO2 emissions.
Sustainability 17 03233 g003
Figure 4. Model Framework Diagram.
Sustainability 17 03233 g004
Figure 5. Activity Levels in Different Industry Sectors in the Sichuan-Chongqing Region from 2020 to 2060. (a) Agriculture, industry, and services; (b) Total carbon emissions among construction and residents.
Sustainability 17 03233 g005
Figure 6. Changes in the Energy Structure of Various Sectors from 2020 to 2060.
Sustainability 17 03233 g006
Figure 7. Total Energy Consumption and Carbon Emissions in Four Scenarios. (a) Energy consumption; (b) Total carbon emissions.
Sustainability 17 03233 g007
Figure 8. Changes in energy demand by energy source in different scenarios from 2020 to 2060. (a) BAS Scenario; (b) A Scenario; (c) L Scenario; (d) HL Scenario.
Sustainability 17 03233 g008
Figure 9. Proportion of energy demand by sector in the Sichuan-Chongqing region from 2020 to 2060. (a) BAS Scenario; (b) A Scenario; (c) L Scenario; (d) HL Scenario.
Sustainability 17 03233 g009
Figure 10. Contribution of various energy types to carbon emissions in the Sichuan-Chongqing region from 2020 to 2060. (a) BAS Scenario; (b) A Scenario; (c) L Scenario; (d) HL Scenario.
Sustainability 17 03233 g010
Figure 11. Changes in sectoral carbon emissions in the Sichuan-Chongqing region from 2020 to 2060. (a) BAS Scenario; (b) A Scenario; (c) L Scenario; (d) HL Scenario.
Sustainability 17 03233 g011
Table 1. Activity levels and energy consumption of various sectors in the base year.
Region AgricultureIndustryConstructionServicesResidents
SichuanActivity Level9216.4013,401.0222,572.7916,844.928371.00
Energy consumption369.5012,898.70643.912094.743370.40
ChongqingActivity Level2749.056990.7714,050.138464.033412.71
Energy consumption105.504249.63491.08572.921411.89
TotalActivity Level11,965.4520,391.7936,622.9225,308.9511,783.71
Energy consumption475.0017,148.331134.992667.664782.29
Note: Unit: Construction activity level—10,000 square meters; Residents activity level—10,000 people; Other sectors activity levels—CNY 100 million; Energy consumption—10,000 tons of Coal Equivalent.
Table 2. Base year parameter settings for the transportation sector.
DepartmentActivity LevelEnergy Consumption
Passenger Transport1836.87471.89
Freight transportation6258.691083.98
Car ownership2089.47513.62
Note: Unit: Passenger transport—100 million people·km; Freight transport—100 million tons·km; Car ownership—10,000 vehicles; Energy consumption—tons of standard coal.
Table 3. Description of different scenarios.
ScenariosCategoryChanges in Energy
Consumption Intensity
Development Situation Assumptions
BASBaseline scenarioReduceContinuing with the current energy consumption model, fossil energy consumption accounts for a large proportion, and clean energy and electricity are not yet popularized.
AAlleviative scenarioConstantCoal is gradually withdrawn from various sectors, crude oil demand gradually decreases, and electricity and clean energy consumption increases.
LLow-carbon scenarioReduceIt is expected that coal will be completely phased out by 2050, and the transportation sector will implement the “oil-to-electricity” approach, which will significantly reduce the demand for crude oil and increase the demand for electricity.
HLHigh-efficiency low-carbon scenarioDecrease fasterIt is planned to significantly phase out coal and oil by 2060; achieve a high level of electrification, with the electrification rate of ordinary industry sectors reaching over 95% and some sectors’ terminal electrification rate exceeding 98%; improve energy efficiency; and gradually reduce power load.
Note: All changes in the table are compared with the base year.
Table 4. Prediction of transportation sector parameters in Sichuan-Chongqing region.
CategoryFreight TurnoverPassenger TurnoverCar Ownership
Units100 Million Ton-Kilometers100 Million Passenger Kilometers10,000 Vehicles
20206258.991836.872089.47
20216782.461947.872219.94
20226923.991282.342349.77
203011,169.3111,846.372812.36
204017,787.8217,564.643735.80
205024,790.7724,091.814032.07
206032,178.1631,384.883222.87
Table 5. Changes in energy consumption intensity of six sectors in Sichuan-Chongqing region from 2020 to 2060.
YearScenarioAgricultureIndustryConstructionTransportationServicesResidents
PassengerFreightCar
Ownership
2020Base
Year
0.039670.8400.02940.2570.1730.2690.1050.4058
2030BAS0.030830.7520.02650.2280.1570.2420.08240.4046
L0.029590.7300.02530.2220.1530.2360.07930.4044
HL0.027780.7100.02310.2190.1490.2330.07260.4042
2040BAS0.023960.6740.02370.2000.1410.2180.06570.4038
L0.022070.6530.02200.1930.1360.2110.06240.4034
HL0.019450.6340.01950.1890.1310.2070.05460.4030
2050BAS0.018620.5990.02110.1740.1260.2000.05070.4030
L0.016460.5780.01900.1660.1200.1920.04700.4024
HL0.013620.5590.01630.1610.1150.1880.04050.4018
2060BAS0.014470.5270.01870.1500.1120.1840.03730.4022
L0.012270.5060.01630.1420.1050.1760.03410.4014
HL0.009540.4870.01340.1360.0990.1720.02860.4005
Note: Unit: Agriculture, Industry, and Service sectors—tons of standard coal per CNY 10,000; Passenger transport—tons of standard coal per 10,000 people·km; Freight transport—tons of standard coal per 10,000 tons·km; Vehicle ownership—tons of standard coal per 10,000 vehicles; Construction sector—tons of standard coal per square meter; Residents sector—tons of standard coal per person.
Table 6. Changes in the energy structure of the transportation sector in Sichuan-Chongqing region (%).
SectorsFuels20202030204020502060
Base YearA&LHLA&LHLA&LHLA&LHL
PassengerOil38.2031.228.223.716.415.55.557.43.64
Natural gas21.3023.026.026.231.720.228.916.721.16
Electricity40.5045.845.850.151.964.365.576.075.21
FreightOil19.7015.615.612.49.38.65.15.74.12
Natural gas36.9041.444.246.255.227.436.422.230.26
Electricity43.4043.040.241.535.664.058.672.265.62
Car ownershipOil93.8775.575.562.855.744.235.121.711.1
Electricity6.1324.524.537.244.355.864.978.388.9
Disclaimer/Publisher’s Note: The statements, opinions and data contained in all publications are solely those of the individual author(s) and contributor(s) and not of MDPI and/or the editor(s). MDPI and/or the editor(s) disclaim responsibility for any injury to people or property resulting from any ideas, methods, instructions or products referred to in the content.

