Article

Optimal Sizing of Hydro-PV-Pumped Storage Integrated Generation System Considering Uncertainty of PV, Load and Price

College of Electrical Engineering, Sichuan University, Chengdu 610065, China
*
Author to whom correspondence should be addressed.
Energies 2019, 12(15), 3001; https://doi.org/10.3390/en12153001
Submission received: 5 July 2019 / Revised: 30 July 2019 / Accepted: 1 August 2019 / Published: 3 August 2019
(This article belongs to the Section A1: Smart Grids and Microgrids)

Abstract

:
Effectively using complementary property of various renewable energy sources by an integrated generation system is a concerned study. Considering the uncertainty of PV, spot price and load, the sizing of integrated generation system with combined market operation is a difficult problem. Based on the above uncertain factors, the sizing method of hydro-PV-pumped storage integrated generation system is proposed in this paper. The output characteristic model is established by utilizing the wide range of hydropower output and flexible schedulability of pumped storage. Then, the volatility ratio of the power exchange curve and load tracking coefficient are the evaluation index of the complementary effect, which ensures the stable and smooth output curve. Further, the uncertainty models of PV, spot price and load are established, considering that, the operation of the power generation system is optimized in the day-ahead market, and the predictive deviation of PV and load is balanced in a real-time market. Based on the above factors, the sizing model of the hydro-PV-pumped storage integrated energy system was proposed based on economics and complementary index. Finally, a case study was undertaken, the sensitivity analysis of the economy and complementarity indices was carried out, as the complementarity index is improved, the economy would be down. Further, the optimal sizing of hydro-PV-pumped storage integrated generation system was obtained, hydropower was a total of 165 MW, PV was 100 MW and pumped storage was 50 MW, that could ensure the economy while meeting the complementary index, the effectiveness of the model proposed was verified.

1. Introduction

With the depletion of fossil energy and the increasing environmental pollution problems, currently vigorous development of renewable energy has been an important strategic measure for energy development in society [1]. However, planning, management and technology are imperfect, the problems of “abandoned water, abandoned light and abandoned the wind” are very prominent. The complementary advantages of different types energy could be achieved by the hybrid renewable energy complementary power generation system, it is of great value to reduce the renewable energy abandonment and build a clean and low-carbon modern energy system [2]. Hydropower with a strong regulation capability is the largest renewable energy source in China, its power generation cost is low [3]. Hydropower plays an important role to achieve complementarity between hybrid energy sources. The output of PV has strong randomness, volatility and intermittent. The large-scale PV’s integration into grid would bring serious challenges for the safety and stability of the power system [4]. Hydropower has a wide range of output and strong adjustment capability, which can compensate for PVs better, the pumped storage power station can suppress the fluctuation of output in a shorter time [5], which would improve the grid’s ability to PV consumption and the schedulability of the total output of the system. For instance, in China the Longyangxia hydro-PV complementary power station has achieved better coordination operation and complementarity, which has greatly weakened the impact of PV’s integration into the power grid [6]. The output model of hydropower is a relatively complex nonlinear function. The upstream and downstream water levels and the net water heads are variables changing over time, the output of hydropower is restricted by the available water resources, has strong seasonal characteristics, therefore, the compensation effect of hydropower on PV is obviously different in different scenarios [7]. Research on the sizing of integrated generation system is particularly important based on multiple typical scenarios.
In the electricity market, the uncertain factors would bring more unknown challenges for the sizing of integrated generation system [8], cost from electricity purchase and profit from electricity sales profit are affected by fluctuating spot price, which would bring higher risks for the economy of the system. The higher the transacted electricity of the complementary system in the spot market is, the greater the impact of the volatility of the spot price on sizing is [9]. The economy of the system is directly affected by the degree of matching between the electricity transaction’s curve and the spot price’s curve. Reasonable sizing of hydro-PV-pumped storage integrated generation system could improve the profit while avoiding risks.
So far, there are some studies that have been done on the optimal sizing of integrated generation system. In [10], the method of the combination of the cost–benefit analysis and the nesting model was proposed, which was effective to optimize the sizing of the PV plant being integrated with hydropower. In [11], Kaiqi Sun et al., proposed an optimal combined operation scheme for pumped storage, which could effectively suppress or compensate for the deviations of predicted output of wind and solar generation. In [12], considering the complementary characteristics of various renewable energy sources, an optimization sizing model was proposed for cascade hydropower stations coupled with renewable energy power generation. In [13], a solar–hydro hybrid power station is established to smooth the power output and reduce the volatility of integration into the grid. All of the above studies analyzed the output characteristics of renewable energy, and the sizing model of the integrated generation system was established to improve the schedulability of the total output curve.
Some researches on renewable energy system’s integration into power grid have been done, the fluctuation of renewable energy such as PV and wind were suppressed by utilizing hydropower and energy storage. In [14], Ioannis Kougias et al., represented a method for testing the complementarity of hydropower and PVs over time, the operation of renewable energy source in the cooperative operation method was explored in time and space. A hybrid energy storage system was established for balancing the cost with the performance in terms of stabilizing the fluctuation power of wind farms and PV stations, and the cost and actually implementing the dispatchability of wind/PV plants was improved in [15]. In [16] a hybrid power system model with solar–wind–hydro power was established to suppress the volatility and randomness of PVs and wind, the stability of its integration into power grid was improved.
In the electricity market, the sizing and optimal operating mode of integrated generation system has also been researched. In [17], the model predictive control (MPC)-based operation strategy was proposed to minimize the purchasing cost by coordinating multiple power supplies from electric energy storage, renewable energy resources and power grid. In [18], the operation strategy of integrated generation system in the electricity market was proposed, the revenue was provided by exploiting their complementary characteristics and an optimal bidding strategy for them. In [19], a dynamic programming model is proposed to solve the short-term scheduling of hydropower that sells energy in a pool-based electricity market with maximizing the revenue. In [20], the sizing method of hybrid energy power generation system was established in the electricity market, on the basis of that the operation mode was proposed to improve the revenue while reducing the risk.
However, the above studies of sizing of the system were insufficient on economics, complementarity and uncertain factors. In this paper, the sizing method of hydro-PV-pumped storage integrated generation system is proposed based on economics and complementary characteristics, with considering uncertainty of PV and load in electricity markets. In the case study, correlation among the complementary index, Pearson correlation coefficient and benefits in different modes are analyzed, further the sizing scheme of system is proposed. The main contributions of the paper are summarized as follows:
(1)
The nonlinear characteristics of the output, reservoir, water level, flow and other variables of cascade hydropower stations are analyzed, and the nonlinear model of ladder water is established, considering the uncertainty of PV’s output, based on the normal probability distribution model the uncertainty model of PV is established. The model of the pumped storage power station is established with consideration of the conversion constraints of units.
(2)
On the basis of the complementary characteristics of the hydropower station, PV and pumped storage, the output characteristic model of hydro-PV-pumped storage integrated generation system is established. The volatility ration of the transaction’s curve and coefficient of load tracking are constructed as the index of complementary effect.
(3)
The uncertainty model of load and spot price are established. The Pearson correlation coefficient is used to define the correlation between the transaction’s curve and the spot price. All of them would affect the economy of the system.
(4)
Considering the above factors, the sizing model of integrated generation system with meeting the complementary and maximum annual revenue is proposed, the economy of the system could be improved while ensuring the complementary index.
(5)
The rest of this paper is organized as followed. In Section 2, the output characteristic model of hydro-PV-pumped storage integrated generation system and performance indices of the system are established. Section 3 represents the sizing model of integrated generation system in the electricity market with considering uncertainty of PV and load. In Section 4, the sizing method of the hydro-PV-pumped storage integrated generation system is proposed. In Section 5, case studies verify the effectiveness of the proposed model. The conclusion is given in Section 6.

2. Hydro-PV-Pumped Storage Integrated Generation System

In this work, the relationship among the power generation system, local load and power grid is shown in Figure 1. In an area, there is an integrated generation system of hydro-PV-pumped storage and local load, the integrated generation system is composed of hydropower, distributed PV and pumped storage. The local load demand is completely provided by the integrated generation system, the transacted electricity with local load, which is settled at a fixed price. The rest of generated electricity is sold in the spot market and is settled at spot price. While the output of the integrated generation system cannot meet the local load demand, the rest of the load demand needs to be purchased from the power grid in the spot market.

2.1. Modeling of the Hydro-PV-Pumped Storage Integrated Generation System

2.1.1. Modeling of the Hydropower Station

The output can be expressed as a constant multiplied by the power generation efficiency of hydropower station multiplied by the net head and average power generation flow at the corresponding period. The model of the hydropower station could be established [21].
P hyd , i , t = 0.00981 η i H i , t Q i , t H .
(1) Equation constraints of hydropower station:
Considering the interval water of the reservoir, which included the natural water, the power generation flow and abandoned water from the upstream reservoir, storage constraints of cascade hydropower stations could be expressed as:
V i , t = V i , t 1 + 3600 ( Q i , t S Q i , t H Q i , t d ) Δ t
V i , 0 = V i , T + Δ V i
Q i , t S = I i , t + Q i 1 , t H + Q i 1 , t d
The net head of a hydropower station would change with the upstream and downstream water levels of the changing. The calculation formula is as follows:
H i , t = Z i , t 1 up + Z i , t up 2 Z i , t down H i , t d
The head loss of a hydropower station can be fitted as a quadratic function on the power generation flow, as follows:
H i , t d = a Q H , i ( Q i , t H ) 2 + b Q H , i
The upstream water level the reservoir can be fitted to a cubic function of the water volume of reservoirs, the formula is as follows:
Z i , t up = a Z V , i V i , t 3 + b Z V , i V i , t 2 + c Z V , i V i , t + d Z V , i
The downstream water level of the hydropower station i can be fitted as a quadratic function on the discharge volume of reservoir, the formula is as follows:
Z i , t down = a Z Q , i ( Q i , t ) 2 + b Z Q , i Q i , t + c Z Q , i
Q i , t = Q i , t H + Q i , t d
(2) Inequality constraint:
P hyd , i min P hyd , i , t P hyd , i max
V i , min V i , t V i , max
Q i , min H Q i , t H Q i , max H

2.1.2. Modeling of the Pumped Storage Station

The pumped storage station includes the upstream reservoir and the downstream reservoir, and the constraints of the upstream and downstream reservoirs are the same. Generally, only the water volume of the upper reservoir is restricted. The calculation formula of the upper reservoir is as follows [22]:
V pm , k , t = V pm , k , t 1 + η pm , k Δ t P pm , k , t η gn , k Δ t P gn , k , t
(1) Constraints of pumped storage station:
V pm , k min V pm , k , t V pm , k max
V pm , k , 0 = V pm , k , T
(2) Working condition constraints of pumped storage units:
y pm , k , t + y gn , k , t 1 y pm , k , t , y gn , k , t { 0 , 1 }
While y pm , k , t = 1 , the pumped storage units is in the pumping state, or y gn , k , t = 1 , the pumped storage units is in the generation state, else y pm , k , t = y gn , k , t = 0 , the pumped storage units is in the idle state.
(3) Output constraints of pumped storage units:
{ y pm , k , t P pm , k min P pm , k , t y pm , k , t P pm , k max y gn , k , t P gn , k min P gn , k , t y gn , k , t P gn , k max
(4) Pumping/generation condition conversion downtime constraint:
The pumped storage unit generally could not perform continuous start-stop conversion in pump and generation conditions, it should shut down at least half an hour, so the constraints of pumped storage unit are as follows:
{ y pm , k , t + y gn , k , t + 1 1 t = 1 , 2 , , T 1 y pm , k , t + 1 + y gn , k , t 1 t = 1 , 2 , , T 1 y pm , k , t + y gn , k , t + 2 1 t = 1 , 2 , , T 2 y pm , k , t + 2 + y gn , k , t 1 t = 1 , 2 , , T 2

2.1.3. Modeling of Distributed PV’s

The probability distribution of PV’s output error obeys normal distribution, the model could be established as follows [23]:
P pv , t da = P pv , t m L AC , i , t [ 1 + k T ( T c , i , t T r ) ] / L stc
P pv , t re = P pv , t da + Δ P pv , t
The reference temperature ( T r ) was 25 °C, and the test light intensity ( L stc ) was 1000 W/m2, which is the normal distribution with zero as mean and σ pv as standard deviation, its probability density function is:
f ( Δ P pv ) = 1 2 π σ pv e ( Δ P pv μ ) 2 2 σ pv 2
σ pv = P pv da × β % , β % is a proportional coefficient that means standard deviation ( σ pv ) occupied predictive output of PV.

2.2. Complementary Index of the Integrated Generation System

Hydro-PV-pumped storage integrated generation system utilizes fully the output characteristics of each power supply to enhance the complementary index of the system, the total output is as follows:
P L , t = i = 1 n hyd P hyd , i , t + j = 1 n pv P pv , j , t + k = 1 n gn P gn , k , t k = 1 n gn P pm , k , t
The complementary generation system can further improve the load tracking index by superimposing the output of each power source. The power output change rate is normalized. The change rate (p.u.) of the total output of the system is normalized as follows:
α L , t = P L , t + 1 P L , t P L max , t = 1 , 2 , , T 1
The change rate (p.u.) of power consumption of load side is normalized as follows:
β V , t = P V , t + 1 P V , t P V max , t = 1 , 2 , , T 1
Based on the above, coefficient of load tracking ( I T ) is as follows:
I T = 1 T 1 t = 1 T 1 | α L , t β L , t |
The nearer I T is to zero, the better the tracking effect of the power generation system to the load curve is, which indicates that the change characteristics of the power generation system and load are more consistent.
In the region, the output of complementary generation system is consumed by the local load and the rest of electricity is sent to the power grid, the value of power exchange to power grid is as follows:
P ch , t = P L , t P V , t
The maximum volatility ratio is:
K ch = max | P ch , t P ch , t 1 P ch max |
The smaller the fluctuation ratio of power is, the better the complementary effect of the system is.

3. Sizing Model of the Integrated Generation System Combined Market Operation

China is about to construct the power spot market, it will be a new round of opportunities and challenges for the main body of the power industry, research on the sizing method of integrated generation system is crucial for combined market operation.

3.1. Uncertainty Model of the Spot Price

In the spot market, the electricity prices have strong uncertainty and volatility, the power generation system would face the high risk caused by the randomness of spot price, the economy of sizing would be directly affected. The electricity price sequence in the spot market is a random time series, historical electricity prices are analyzed in this paper, based on auto regressive integral moving average (ARIMA) model [24], the uncertainty model of spot price is established with considering the volatility of spot price.
λ t re = λ t da + Δ λ t
λ t da = λ t da , p + μ t da , p ( λ max da , p λ t da , p )
1 μ t da , p 1
t μ t d a Γ
λ t da , p is predicted by the ARIMA model, μ t da is the prediction error factor of the day-ahead price [25], Equation (29) represents the upper and lower limits of the error factor and the conservative degree of robust optimization ( Γ ) is 96, which represents the acceptable worst case.

3.2. Degree of Matching between Transaction‘s Curve and Spot Price

The degree of matching between the transaction’s curve and the spot price’s curve was analyzed by the Pearson correlation coefficient, which represents the correlation between the both. If the value obtained is closer to 1, the positive correlation is stronger, otherwise, if the value obtained is closer to −1, the negative correlation is stronger [26].
r P λ = t = 1 T ( P ch , t P ch ¯ ) ( λ t λ ¯ ) t = 1 T ( P ch , t P ch , t ¯ ) 2 t = 1 T ( λ t λ ¯ ) 2

3.3. Uncertainty Analysis of the Load

In the actual operation of the power system, there is a deviation between real-time load and day-ahead predicted load, which would directly affect the benefits of power generation system. The uncertainty model of the local load is established as [27]:
P V , t re = P V , t da + κ t P V , t da
5 % κ t 5 %
t κ t Κ
The conservative degree for robust optimization ( Κ ) is 4.8, which represents the acceptable worst case.

3.4. Sizing of the Hydro-PV-Pumped Storage Integrated Generation System in the Electricity Market

Local load demand is supplied by the hydro-PV-pumped storage integrated generation system, which is settled at a fixed price, the rest of the electricity would be sold in the spot market. Based on complementary indices, uncertainty of spot price and load deviations between day-ahead and real-time, considering the cost of investment, maintenance cost, abandoned water cost of hydropower and generation cost of pumped storage, the sizing model with targeting the greatest annual benefit could be established as,
max R total = n = 1 N { d = 1 D n ( R V d , n + R da d , n + R re d , n C hyd d , n C pm d , n ) } C year

3.4.1. Profit from the Local Load

The local load is settled at a fixed electricity price, the revenue could be expressed as follows:
R V = t = 1 T ( λ m P V , t re Δ t )

3.4.2. Cost of Purchasing Electricity or Profit from Selling Electricity in the Day-Ahead Market

In the day-ahead market, the rest of the generated electricity of the system would be sold, while the generated electricity could not meet the local load demand, the rest load demand should be provided by purchasing electricity. The cost of purchasing electricity or profit from selling electricity could be established as follows,
R da = t = 1 T ( λ t da P ch , t da Δ t )
P ch , t da = P L , t da P V , t da
When P ch , t da < 0 , the power generation system needs to purchase electricity from the day-ahead market, when P ch , t da > 0 , the rest of the generated electricity could be sold in the day-ahead market.

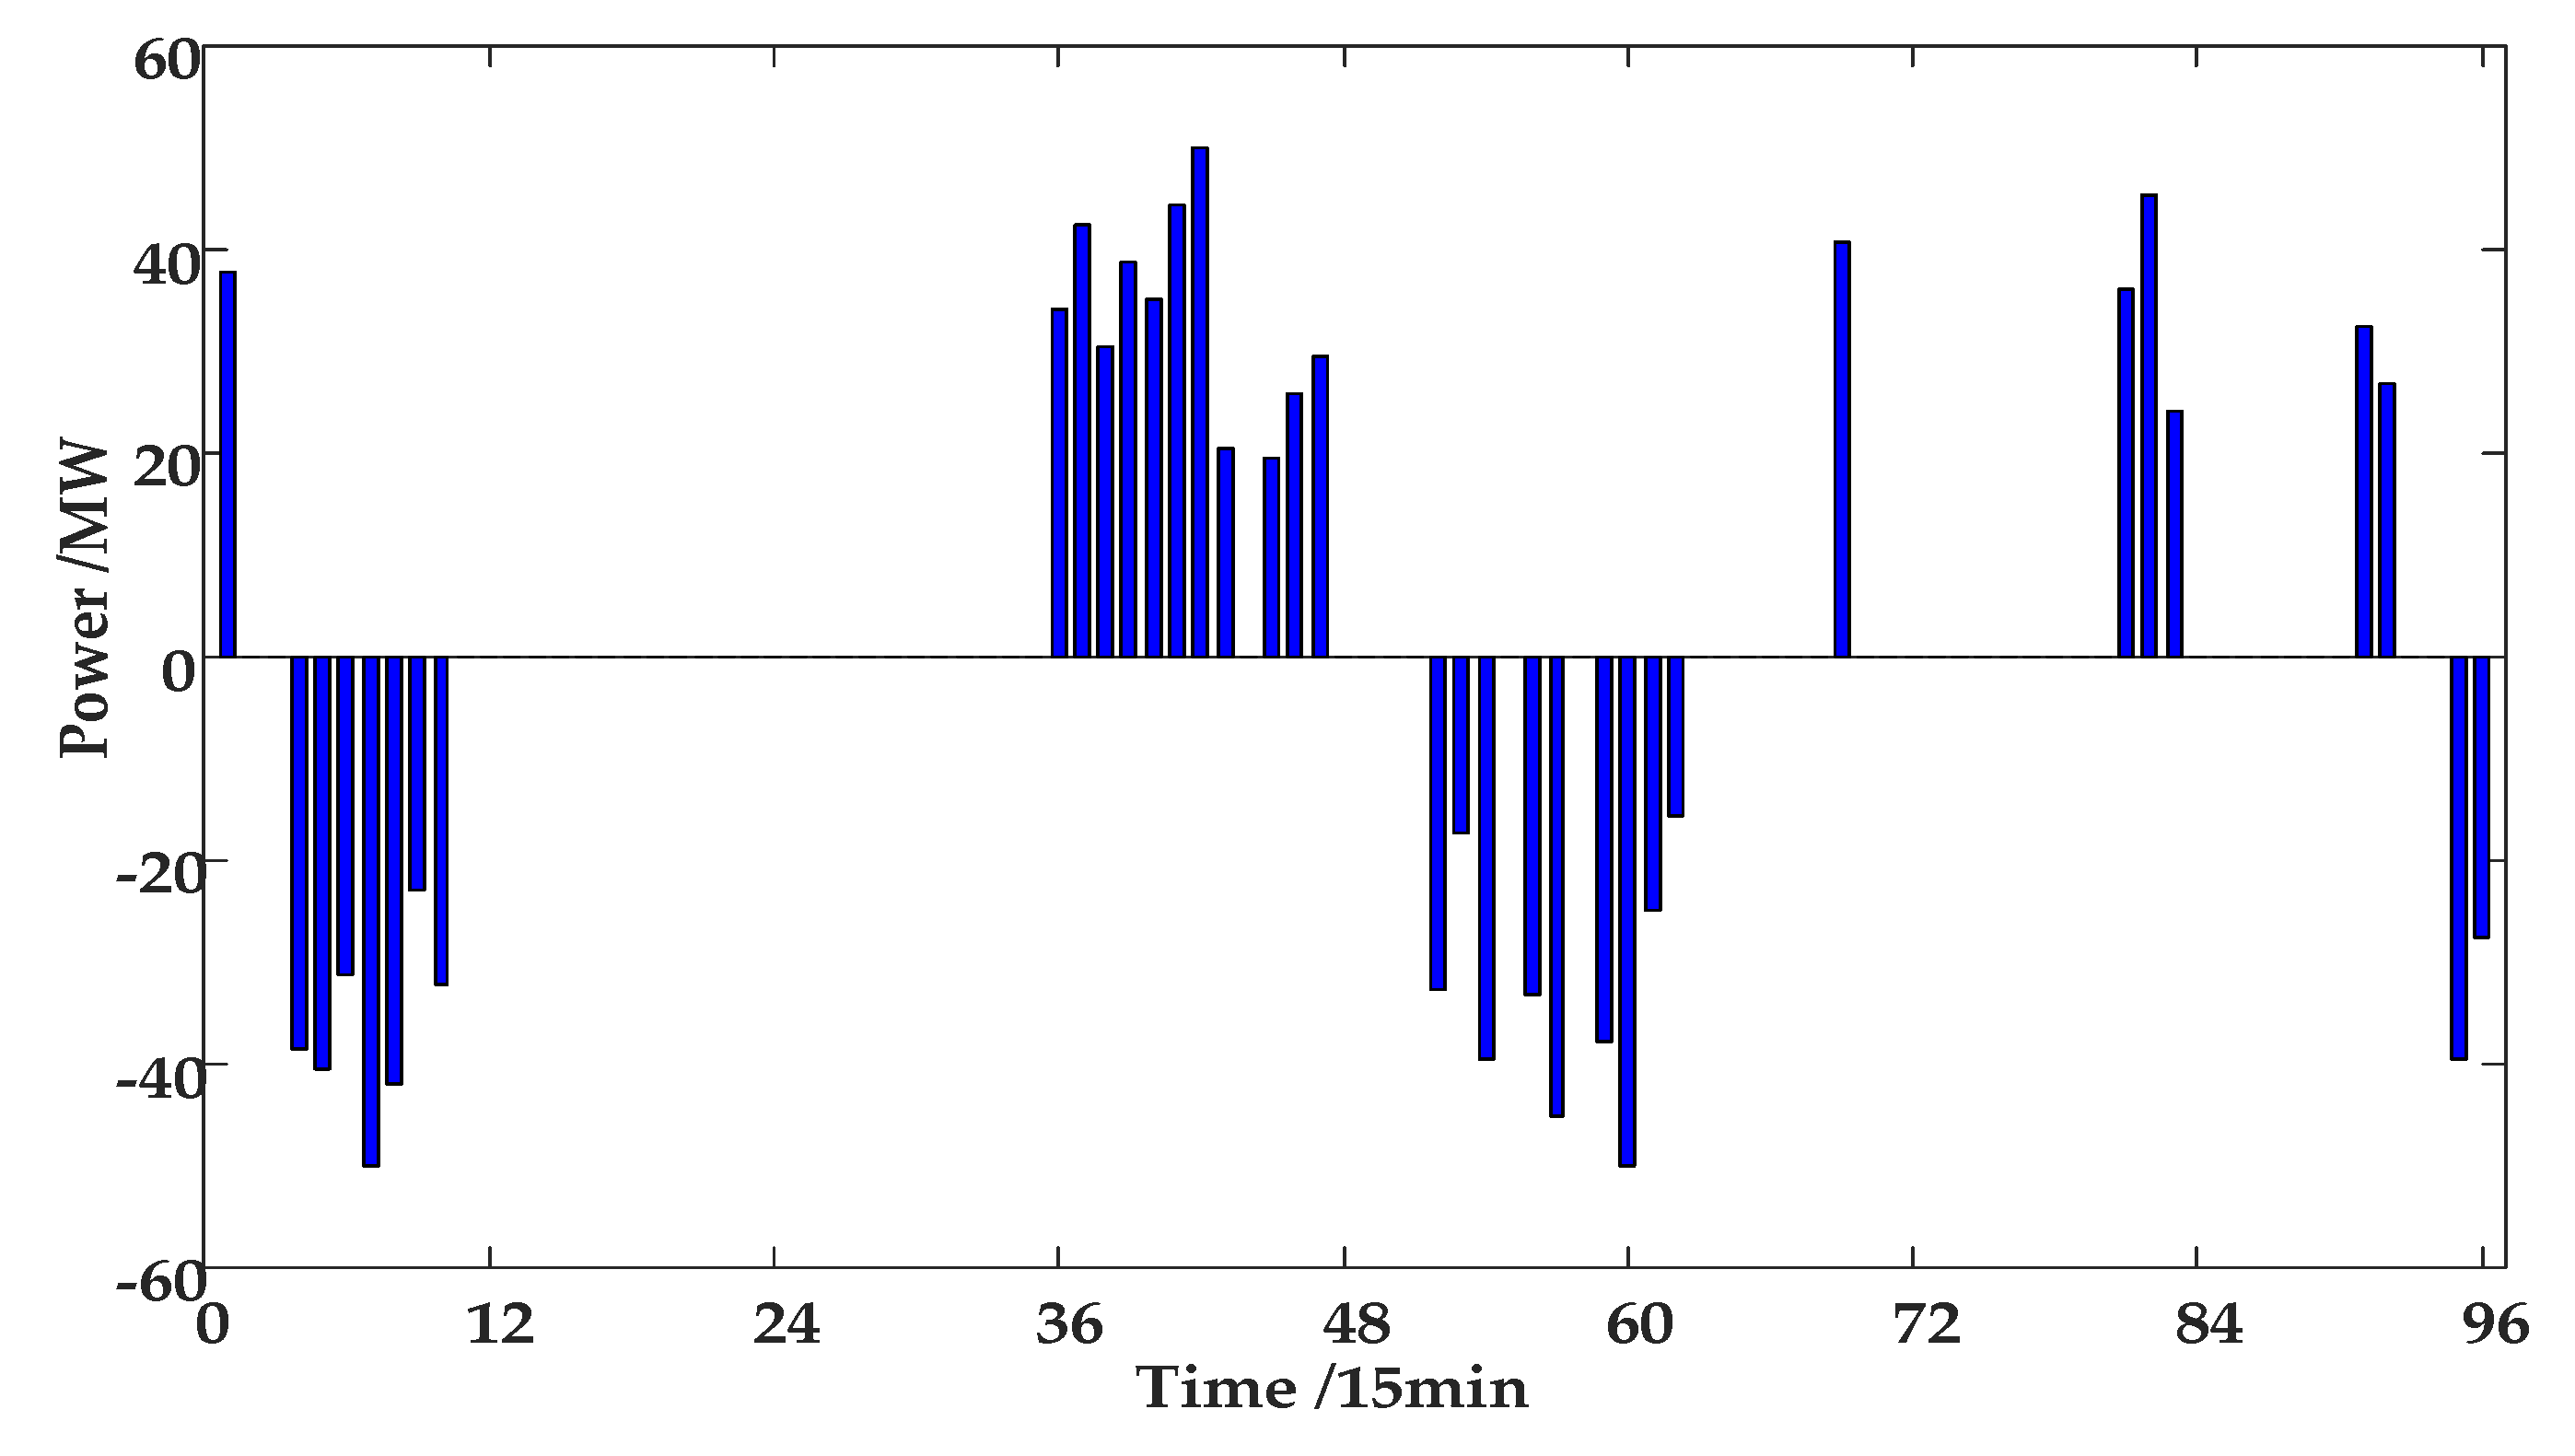
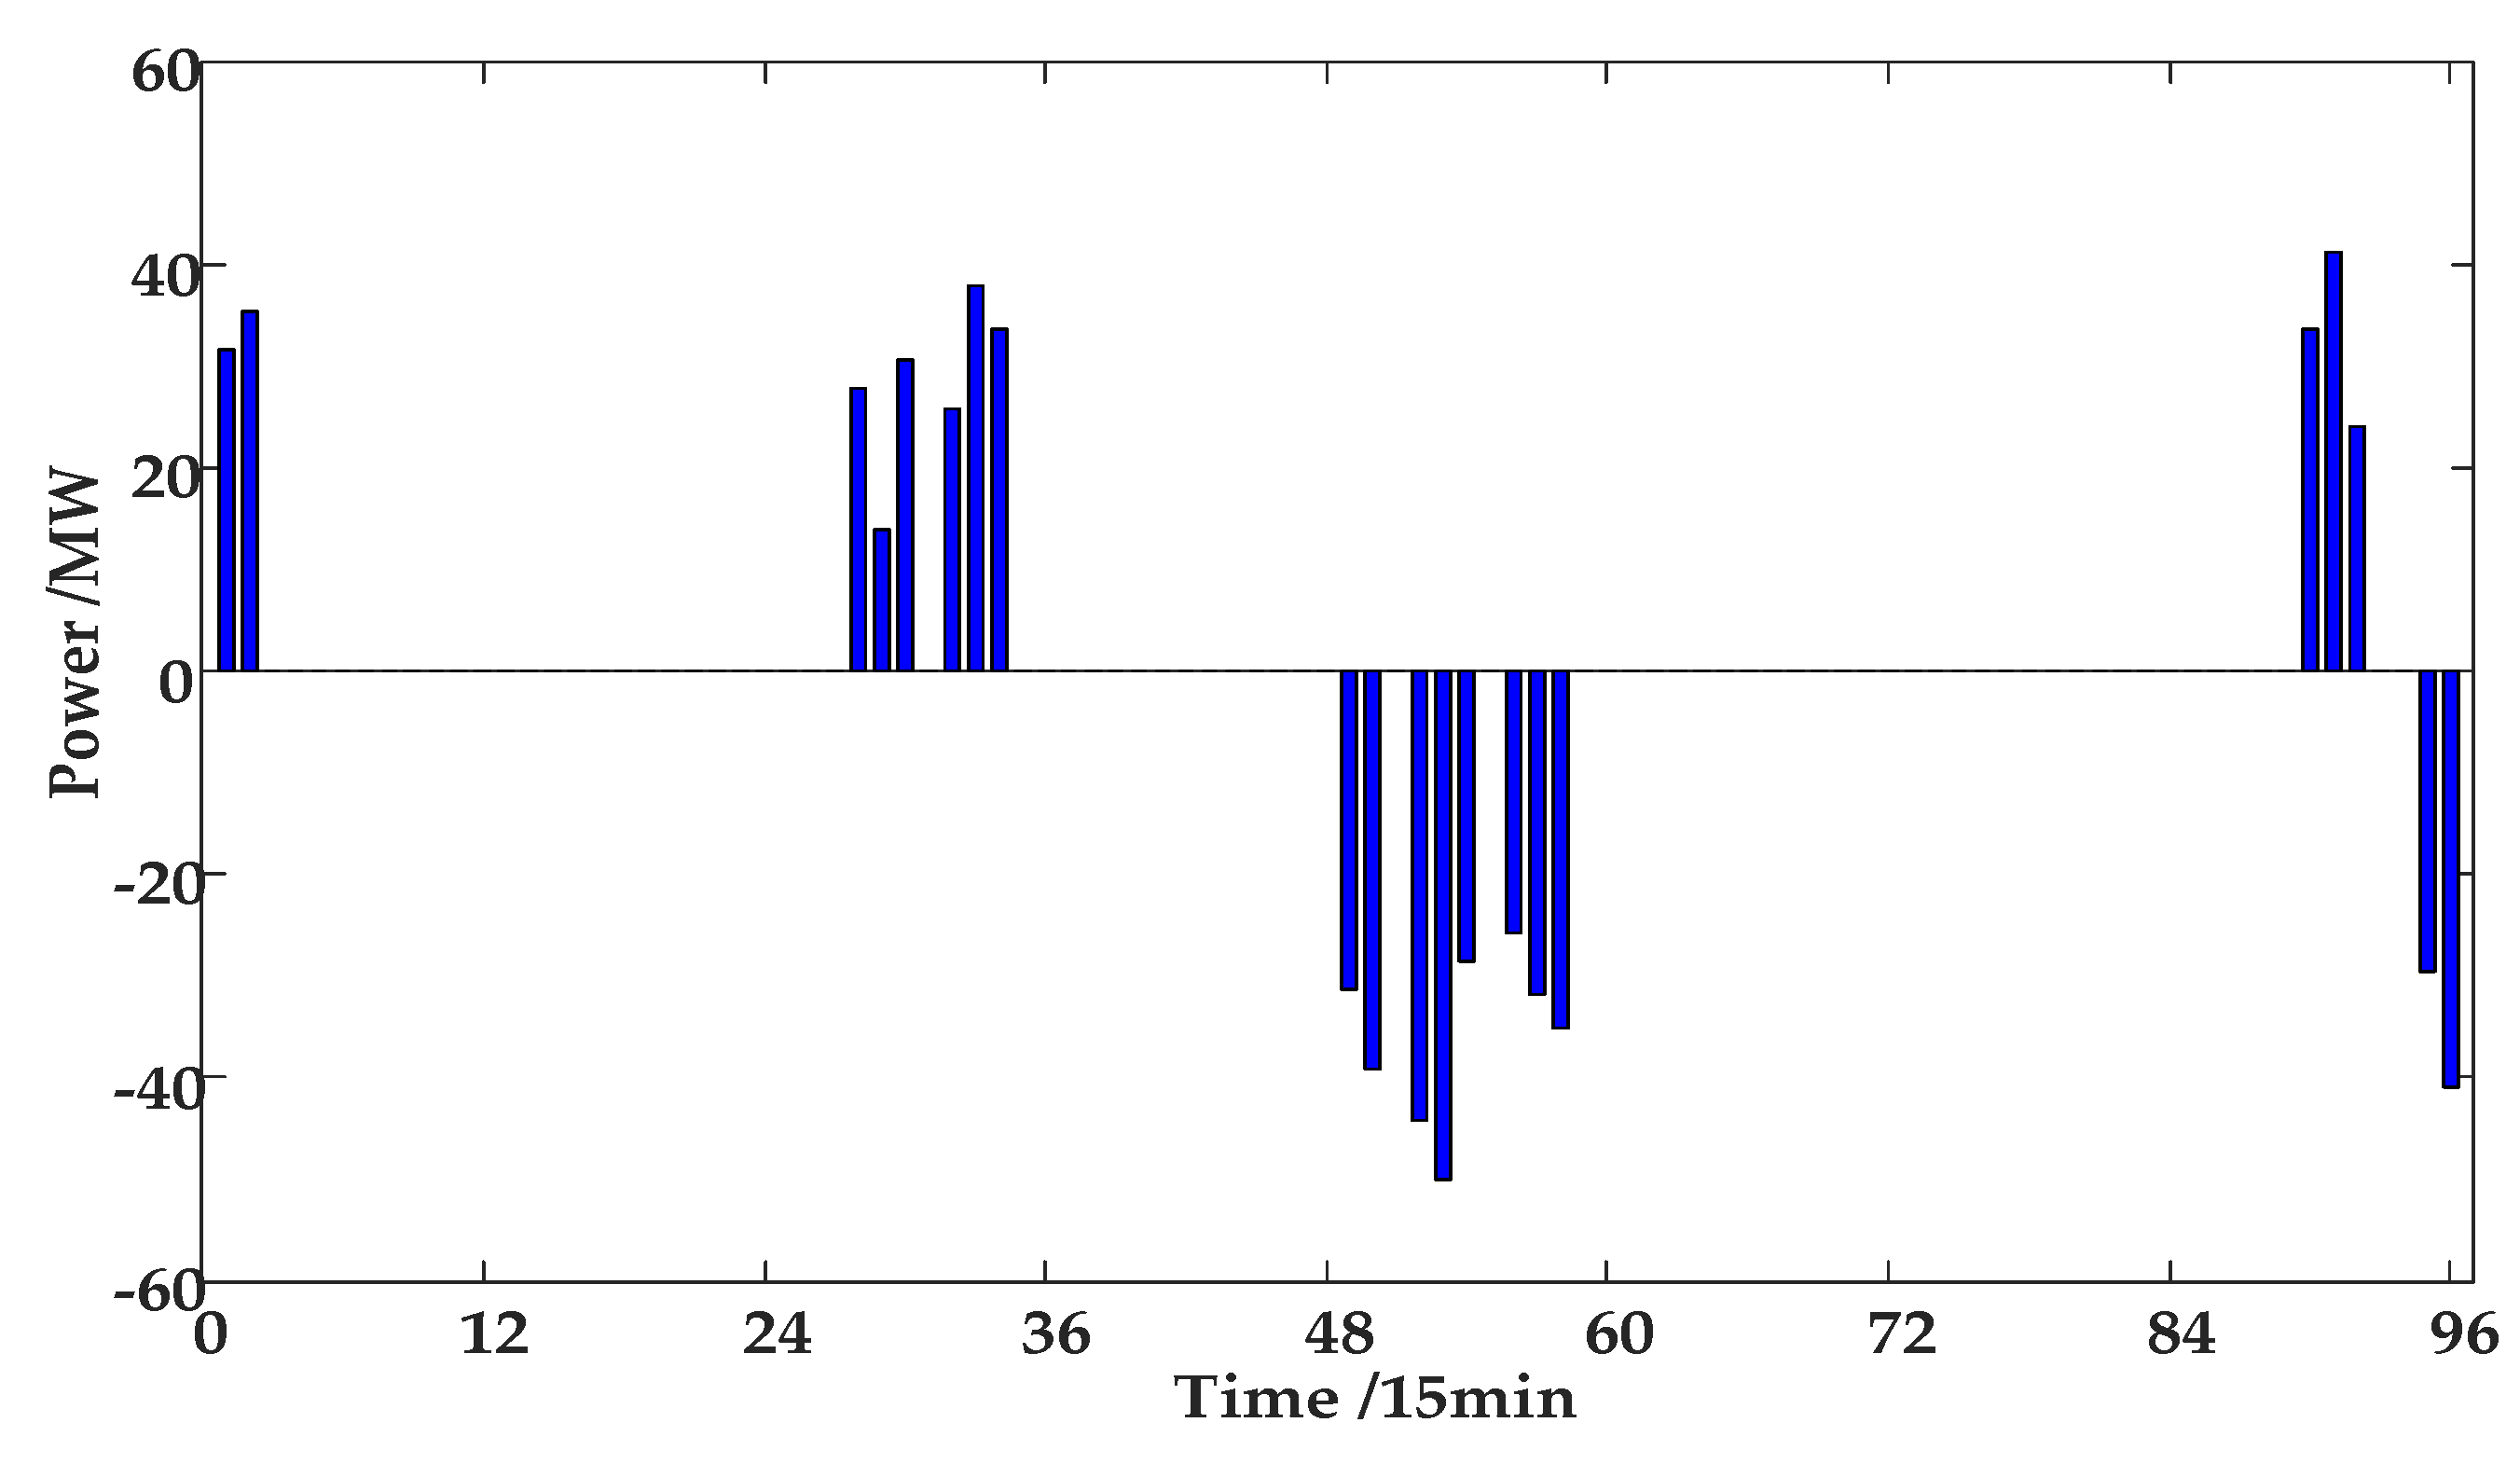
3.4.3. Cost of Purchasing Electricity or Profit from Selling Electricity in the Real-Time Market

The power deviation is balanced by power transaction in the real-time market, electricity is settled at a real-time price, which could be expressed as follows,
R re = t = 1 T ( λ t re P ch , t re Δ t )
P ch , t re = P V , t da P V , t re + P pv , t re P pv , t da
When P ch , t re < 0 , the power generation system needs to purchase electricity from the real-time market, when P ch , t re > 0 , the rest of the generated electricity could be sold in the real-time market.

3.4.4. Abandoned Water Cost of the Hydropower Station

In order to meet the complementary indices of the system, the abandoned water problem might exist, which should be considered in the optimal sizing, abandoned water cost ( C hyd ) could be expressed as follows,
C hyd = t = 1 T i = 1 N i ( λ hyd , t 0.00981 η i H i ¯ Q i , t H Δ t )
λ hyd = 1 / 2 ( λ m + 1 / T t T λ t da )
H i ¯ = t = 1 T H i

3.4.5. Generation and Pumping Cost of the Pumped Storage Unit

The start-up cost of generation and pumping of power generation should be considered in the operating of pumped storage units.
C pm = t = 1 T k = 1 n k ( C pm , k , t + C gn , k , t )

3.4.6. Costs of Investment and Maintenance of the Integrated Generation System

The equivalent annual cost of investment and annual maintenance cost of the system are as follows,
C year = C hyd + C pg + C pv
C hyd = C hyd , dev + C hyd , on
C pg = C pg , dev + C pg , on
C pv = C pv , dev + C pv , on
The formula of equivalent annual cost of equipment is as follows:
C dev = C inv η ( 1 + η ) l ( 1 + η ) l 1

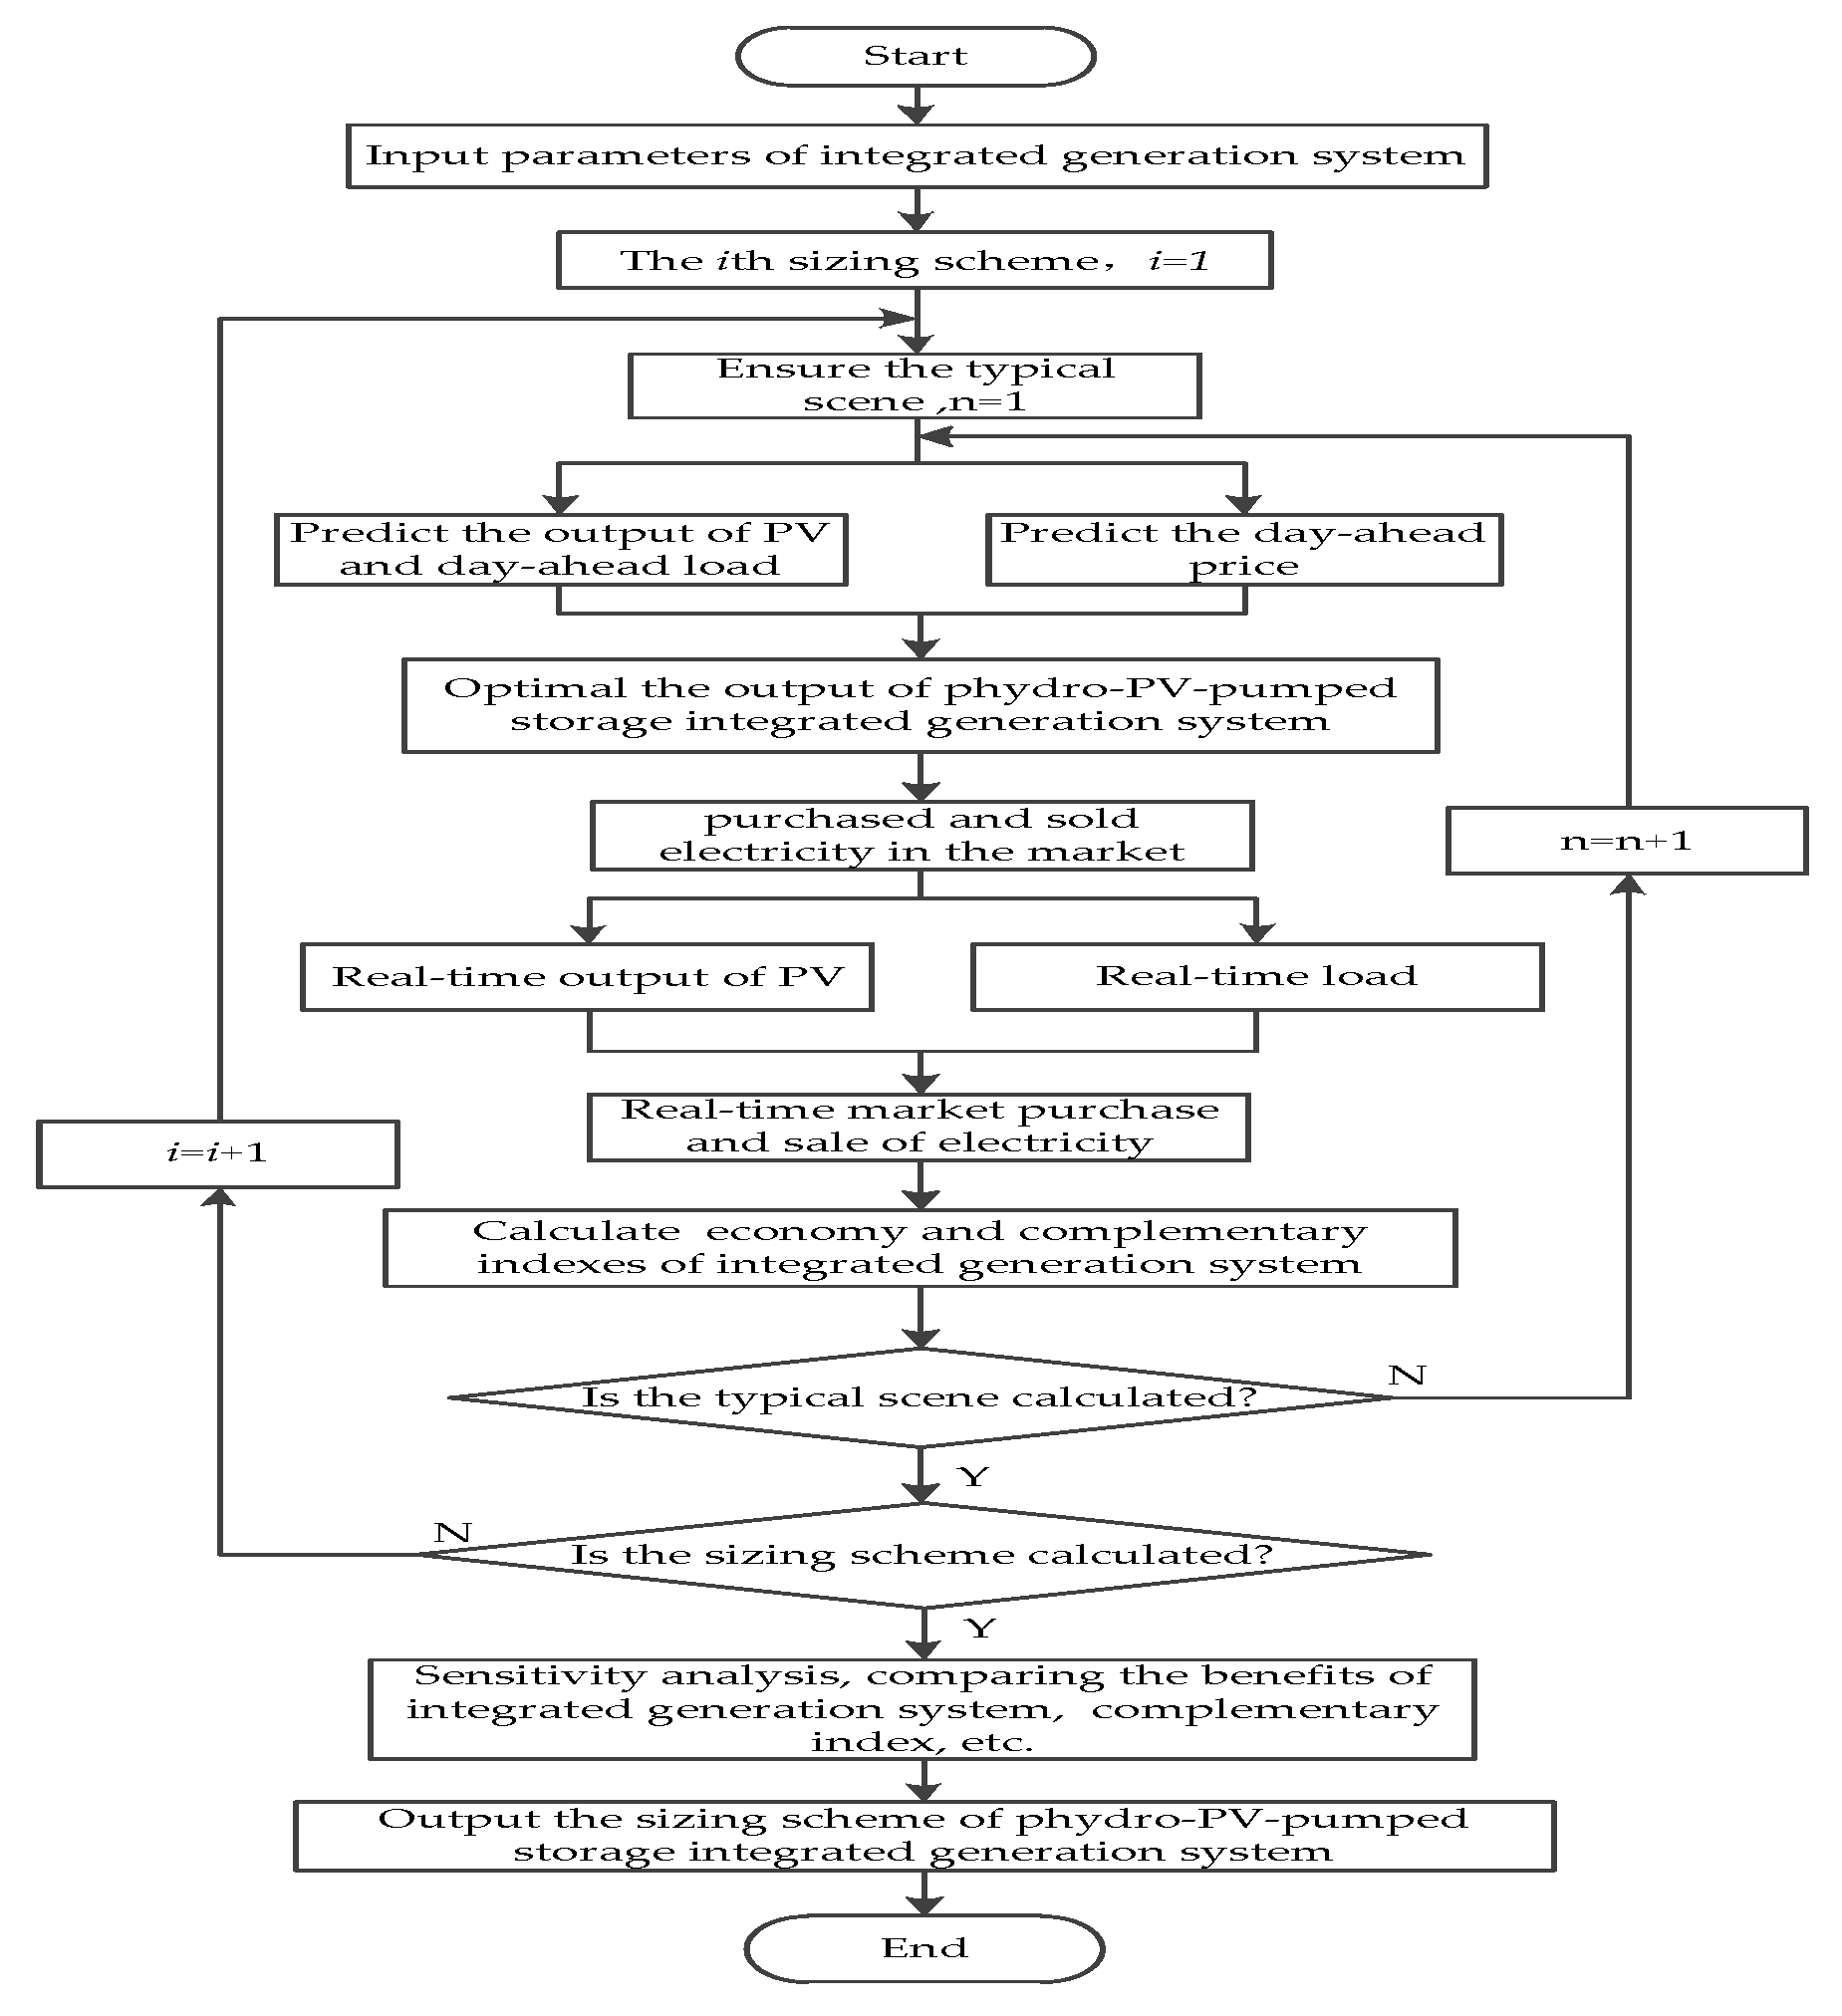
4. The Steps of Sizing of the Hydro-PV-Pumped Storage Generation System

The set of sizing schemes of the system was proposed based on meeting the local load demand. With using the above-mentioned the hydro-PV-pump storage integrated generation system model in Equations (1)–(21), based on the load tracking coefficient and complementary index of the system in Equations (22)–(27), the uncertainty model of spot price in Equations (28)–(31), the degree of matching between transaction’s curve and spot price in Equation (32) and the uncertainty analysis of the load (32)–(34), revenue of local load in Equation (37), day-ahead market in Equations (38)–(39), real-time market in Equations (40)–(41), abandoned water cost in Equations (42)–(44), generation and pumping cost of pumped storage unit in Equation (45) and cost of investment and maintenance of power generation system in Equations (46)–(50), the sizing model of the hydro-PV-pump storage integrated generation system was established with meeting maximum revenue in Equations (36)–(50).
Using the above models, the performance indices and annual revenue of different schemes were obtained. Trade-off consideration of various indices, the most suitable sizing scheme of the integrated generation system would be found in the set. The sizing flowchart is shown in Figure 2.
The specific steps of sizing of the system are as follows:
(1)
Input the raw data including parameters of hydropower stations, PV’s and the pumped storage unit, local load data and historical electricity price data.
(2)
Plan the sizing of the hydro-PV-pump storage integrated generation system. The sizing set of the power generation system is determined. The determined sizing scheme is selected, the corresponding equivalent annual cost and annual maintenance cost of the complementary power generation system are obtained, and the determined typical scenario is selected for analysis.
(3)
Local load, output of PV and spot price are predicted, on the basis of the above data, the output of the integrated generation system is optimized and the transaction’s curve is obtained. Based on real-time load’s curve and real-time output’s curve of PV, the predicted deviation between day-ahead and real-time is received, the purchase and sale of electricity is determined. The revenue from selling electricity and cost from purchasing electricity in a typical scenario is calculated. All the typical scenarios are calculated, the system benefits of the scheme can be obtained.
(4)
All the planning have been calculated, sensitivity analysis of the influence for some sensitive parameters is carried out, such as different complementary indices, sizing schemes and spot price uncertainty on the economy of power generation system.
(5)
The indices of the system of all schemes are compared, the sizing scheme of hydro-PV-pumped storage integrated generation system is proposed based on trade-off consideration of economics and complementary characteristics.

5. Case Study and Discussion

5.1. Case Description

The local load demand is provided by the integrated generation system or purchasing electricity in spot market, which is settled at a fixed price (yuan/350 MWh), on the other hand the rest of the electricity of the power generation system would be sold in the spot market. Considering the uncertainty of spot price, prediction bias of the local load demand and output of PV, the sizing scheme of hydro-PV-pumped storage integrated generation system with meeting complementary indices and optimal economy was proposed. The integrated generation system was composed of three cascade basin hydropower stations, distributed PV and a pumped storage power station. The parameters can be found in Table 1, Table 2 and Table 3. The sizing of the integrated generation system was obtained based on the optimized operation mode, which would include the capacity and output of hydropower and pumped storage, transaction’s curves, complementary indices, economic benefits, etc.
(1) Data of Local Load
The day-ahead load data is from a certain region in the project, there will be deviation between the real-time load and predicted day-ahead load, based on the uncertainty model of local load the load curves in each scenario are obtained. The load curves and the deviation between both of them can be seen in Figure 3.
(2) Prediction of the Spot Price
The spot price data in the Nordic electricity spot market was selected as the basic data, the day-ahead spot price was predicted by a robust model for uncertainty of the spot price based on ARIMA, the day-ahead spot price’s curves were obtained in different scenarios. Considering the price deviation between the day-ahead market and the real-time market, the corresponding real-time market price was obtained. The spot price curves are shown in Figure 4.
(3) Predicted Output of PV
The day-ahead PV’s output was from a certain region in the project, there was a deviation between the predicted day-ahead output and real-time output. The output curves of PV were obtained by the uncertainty model of PV in Figure 5.
(4) Characteristic Analysis of the Hydropower Station
Upstream and downstream water levels and the net power generation head all change over time. On the basis of relationship between upstream water level and water volume of reservoir data, the formulas for the relationship between upstream water level and water volume of reservoir and relationship between downstream water level and discharge flow were obtained as:
(1) Hydropower station 1:
Z 1 u p = 1.64 × 10 3 × V 1 3 + 9.8 × 10 2 × V 1 2 1.573 × V 1 + 2759
Z 1 d = 7.484 × 10 6 × Q 1 2 + 1.038 × 10 3 × Q 1 + 2609
(2) Hydropower station 2:
Z 2 u p = 1.77 × 10 4 × V 2 3 4.7 × 10 2 × V 2 2 + 3.99 × V 2 + 2454
Z 2 d = 6.182 × 10 6 × Q 2 2 +   1.68 × 10 3 × Q 2 + 2449
(3) Hydropower station 3:
Z 3 u p = 5.425 × 10 5 × V 3 3 1.23 × 10 2 × V 3 2 + 0.991 × V 3 + 2421
Z 3 d = 1.203 × 10 6 × Q 3 2 + 5.51 × 10 3 × Q 3 2 + 2289
The relationship between the downstream water level and discharge flow data, the reservoir characteristic curve and fitting situation such as hydropower station 3 were obtained in Figure 6 and Figure 7.

5.2. Case Simulation

(1) Optimal Operation of the Complementary System in the Electricity Spot Market
The optimal sizing of hydro-PV-pumped storage integrated generation system was obtained by the above sizing method proposed in this paper, hydropower was a total of 165 MW, PV was 100 MW and pumped storage was 50 MW, which could ensure the economy while meeting the complementary index.
In different seasons, there was an obvious difference of the complementary effect of hydropower and PV. The optimal operation of complementary system in a typical day of the wet season, the normal season and the dry season were analyzed in the case study. Analysis of the operation and benefit of hydro-PV-pumped storage integrated generation system were divided into two phases: Day-ahead and real-time.
In the day-ahead market, considering the maximum consumption of PV’s, the optimal output of the complementary system and operating results of the pumped storage in the different typical scenes are shown in Figure 8, Figure 9, Figure 10, Figure 11, Figure 12 and Figure 13.
It can be seen from the above Figures that the output curve of the integrated generation system and the transaction’s curve in the day-ahead market were similar to the shape of the day-ahead price’s curve in the typical scenarios, and the transacted electricity was more when the day-ahead price was higher, on the contrary, the less transacted electricity was sold at a lower price, it indicates that the matching degree between the trading curve and the spot price curve was higher, so the revenue in the day-head market would be higher.
As the output of the hydropower station was limited by water resources, the output of the system and the transacted electricity gradually decreased in the wet season, normal season to dry season, the revenue in the wet season would be more. In order to suppress the fluctuation of PV output better, pumped storage requires conversion between power generation and pumping, the operating conditions of pumped storage units at various periods are shown in Figure 9, Figure 11 and Figure 13. Power generation was above the horizontal axis, pumping power was below the horizontal axis. It can be seen that the output of the pumped storage in the wet season was larger than that in other seasons, pumping power was as well. Furthermore, the water level of the pumped storage station should be consistent at the beginning and end of the day, the number of generations and pumps in one day was basically the same, but pumping consumed more electricity than generating electricity, and pumped storage unit was idle state for more time in the dry season.
(2) Deviation Processing in the Real-Time Market
There was a certain deviation between the predicted day-ahead output and the real-time output of PV, the predicted day-ahead load and the real-time load was a little different, so the power deviation would exist in the real-time market. The output optimization of hydro-PV-pumped storage integrated generation system and the transacted electricity were obtained based on the predicted output of PV and the predicted local load in the day-ahead market, and would not be changed in the real-time market. The power deviation needs to be balanced in the real-time market. The power deviation’s curves in the wet season, normal season and dry season were obtained in Figure 14.
As seen from Figure 14, the fluctuation of the power deviation’s curve in the real-time market was large, the fluctuation at noon was more obvious and the fluctuation in the dry season was higher than that in the wet season, this part of the deviation was balanced by transactions in the real-time market. Electricity was sold in the real-time market when it had a positive deviation, electricity was purchased in the real-time market when it had a negative deviation. As for the large volatility of real-time prices, the benefits of integrated generation power generation systems would face more risk by larger deviation. It is very necessary to consider the uncertainty of the spot price, PV and load on sizing of the integrated generated system.
In the above optimization modes, data results of system optimization in different typical days with targeting maximum benefits of system are shown in Table 4. It can be seen from the below Table 4, the revenue of typical day in the wet season was higher than that in the normal season and dry season, but the cost of abandoned water in the wet season was significantly higher than that in the normal season and dry season. In the wet season, water resources were sufficient, as the output was constrained by complementary indices, which resulted in increased water abandonment, the economy would be affected.
The smaller the load tracking coefficient is, the smaller the value of complementary index is, the better the complementary effect will be. It can be seen from Table 4, the load tracking effect and complementary effect in the wet season were better than that in the normal season and dry season, the complementarity of the system was better, so, the transaction’s curve could be more stable, the correlation of spot price curve between the transaction’s curve would be affected. The Pearson correlation coefficients obtained in the three typical days were close to 1, which indicates that the correlation between the transaction’s curve and the spot price’s curve was strong.

5.3. Discussion

(1) Sensitivity Analysis and Sizing Indices of the Integrated Generation System in Different Modes
In order to analyze the correlation between the Pearson correlation coefficient, which means the connection relation between the transaction’s curve and spot price’s curve. In the case study, the complementary indices in different scenarios were changed several times, the corresponding spot price correlation coefficients were obtained. The relationship diagram shown in the following Figure 15 could be obtained.
In this case study, the smaller the value of the complementary index is, the smaller the volatility of the system is, the higher of complementary performance of the system is. The closer the Pearson correlation coefficient is to 1, the higher the correlation between the transaction’s curve and the spot price’s curve is, and more electricity will be sold at a higher spot price, while the economy of sizing of complementary systems will be improved.
It can be seen from Figure 15, the value of the complementary index was declining, which means the increase of the complementary indices of the system, the Pearson correlation coefficient was continuously decreasing, which means the matching degree between the transaction’s curve and the spot price’ curve was lower, the revenue of system would be reduced, as well as, the economy of sizing of the complementary system would be reduced. The economy of the system would be affected, there is a mutual constraint between the both. It also could be found that the relationship between the Pearson correlation coefficient and complementary index had some differences in different scenarios.
Several typical scenarios were analyzed in this paper, and the sizing scheme based on economics and complementary characteristics in different complementary modes and the corresponding annual revenue are obtained in Table 5. June–October was the wet season, May and November were the normal season and January–December and December were the dry season.
It can be seen from Table 5, in different complementary modes, complementary indexes, load tracking coefficients, spot price correlation coefficients and annual revenue of complementary systems in different scenarios were changed regularly, the data shows a monotonous decreasing trend. When the complementary indices in the various scenes were continuously improved, the volatility of the transaction’s curve was smaller, the corresponding load tracking coefficient was continuously decreasing, which indicates a better tracking effect, but the Pearson correlation coefficient gradually reduced, which means the match between the transaction’s curve and the spot price’s curve decreased, the annual revenue showed a downward trend, and then the economy of sizing of the system was significantly constrained. It also can be seen, the closer the Pearson correlation coefficient was to one, the better the correlation between spot price curve and transaction curve was, the better the economy was. The complementary indices and economics in the wet season were better than those in other seasons.
(2) Comparison and Analysis
Compared to existing researches, considering the uncertainty of load, PV and price, this study represented a sizing method of the hydro-PV-pumped storage integrated generation system combined market operation.
  • Considering the nonlinear characteristics of cascade hydropower, the operating conditions of pumped storage and uncertainty of PV, the output characteristic model hydro-PV-pumped storage integrated generation system was proposed.
  • The optimization of complementarity of hydropower and PV at the minute time scale was achieved, which ensured the smooth and stable total output. Full consumption of PV’s was achieved by using the energy storage characteristics of pumped storage.
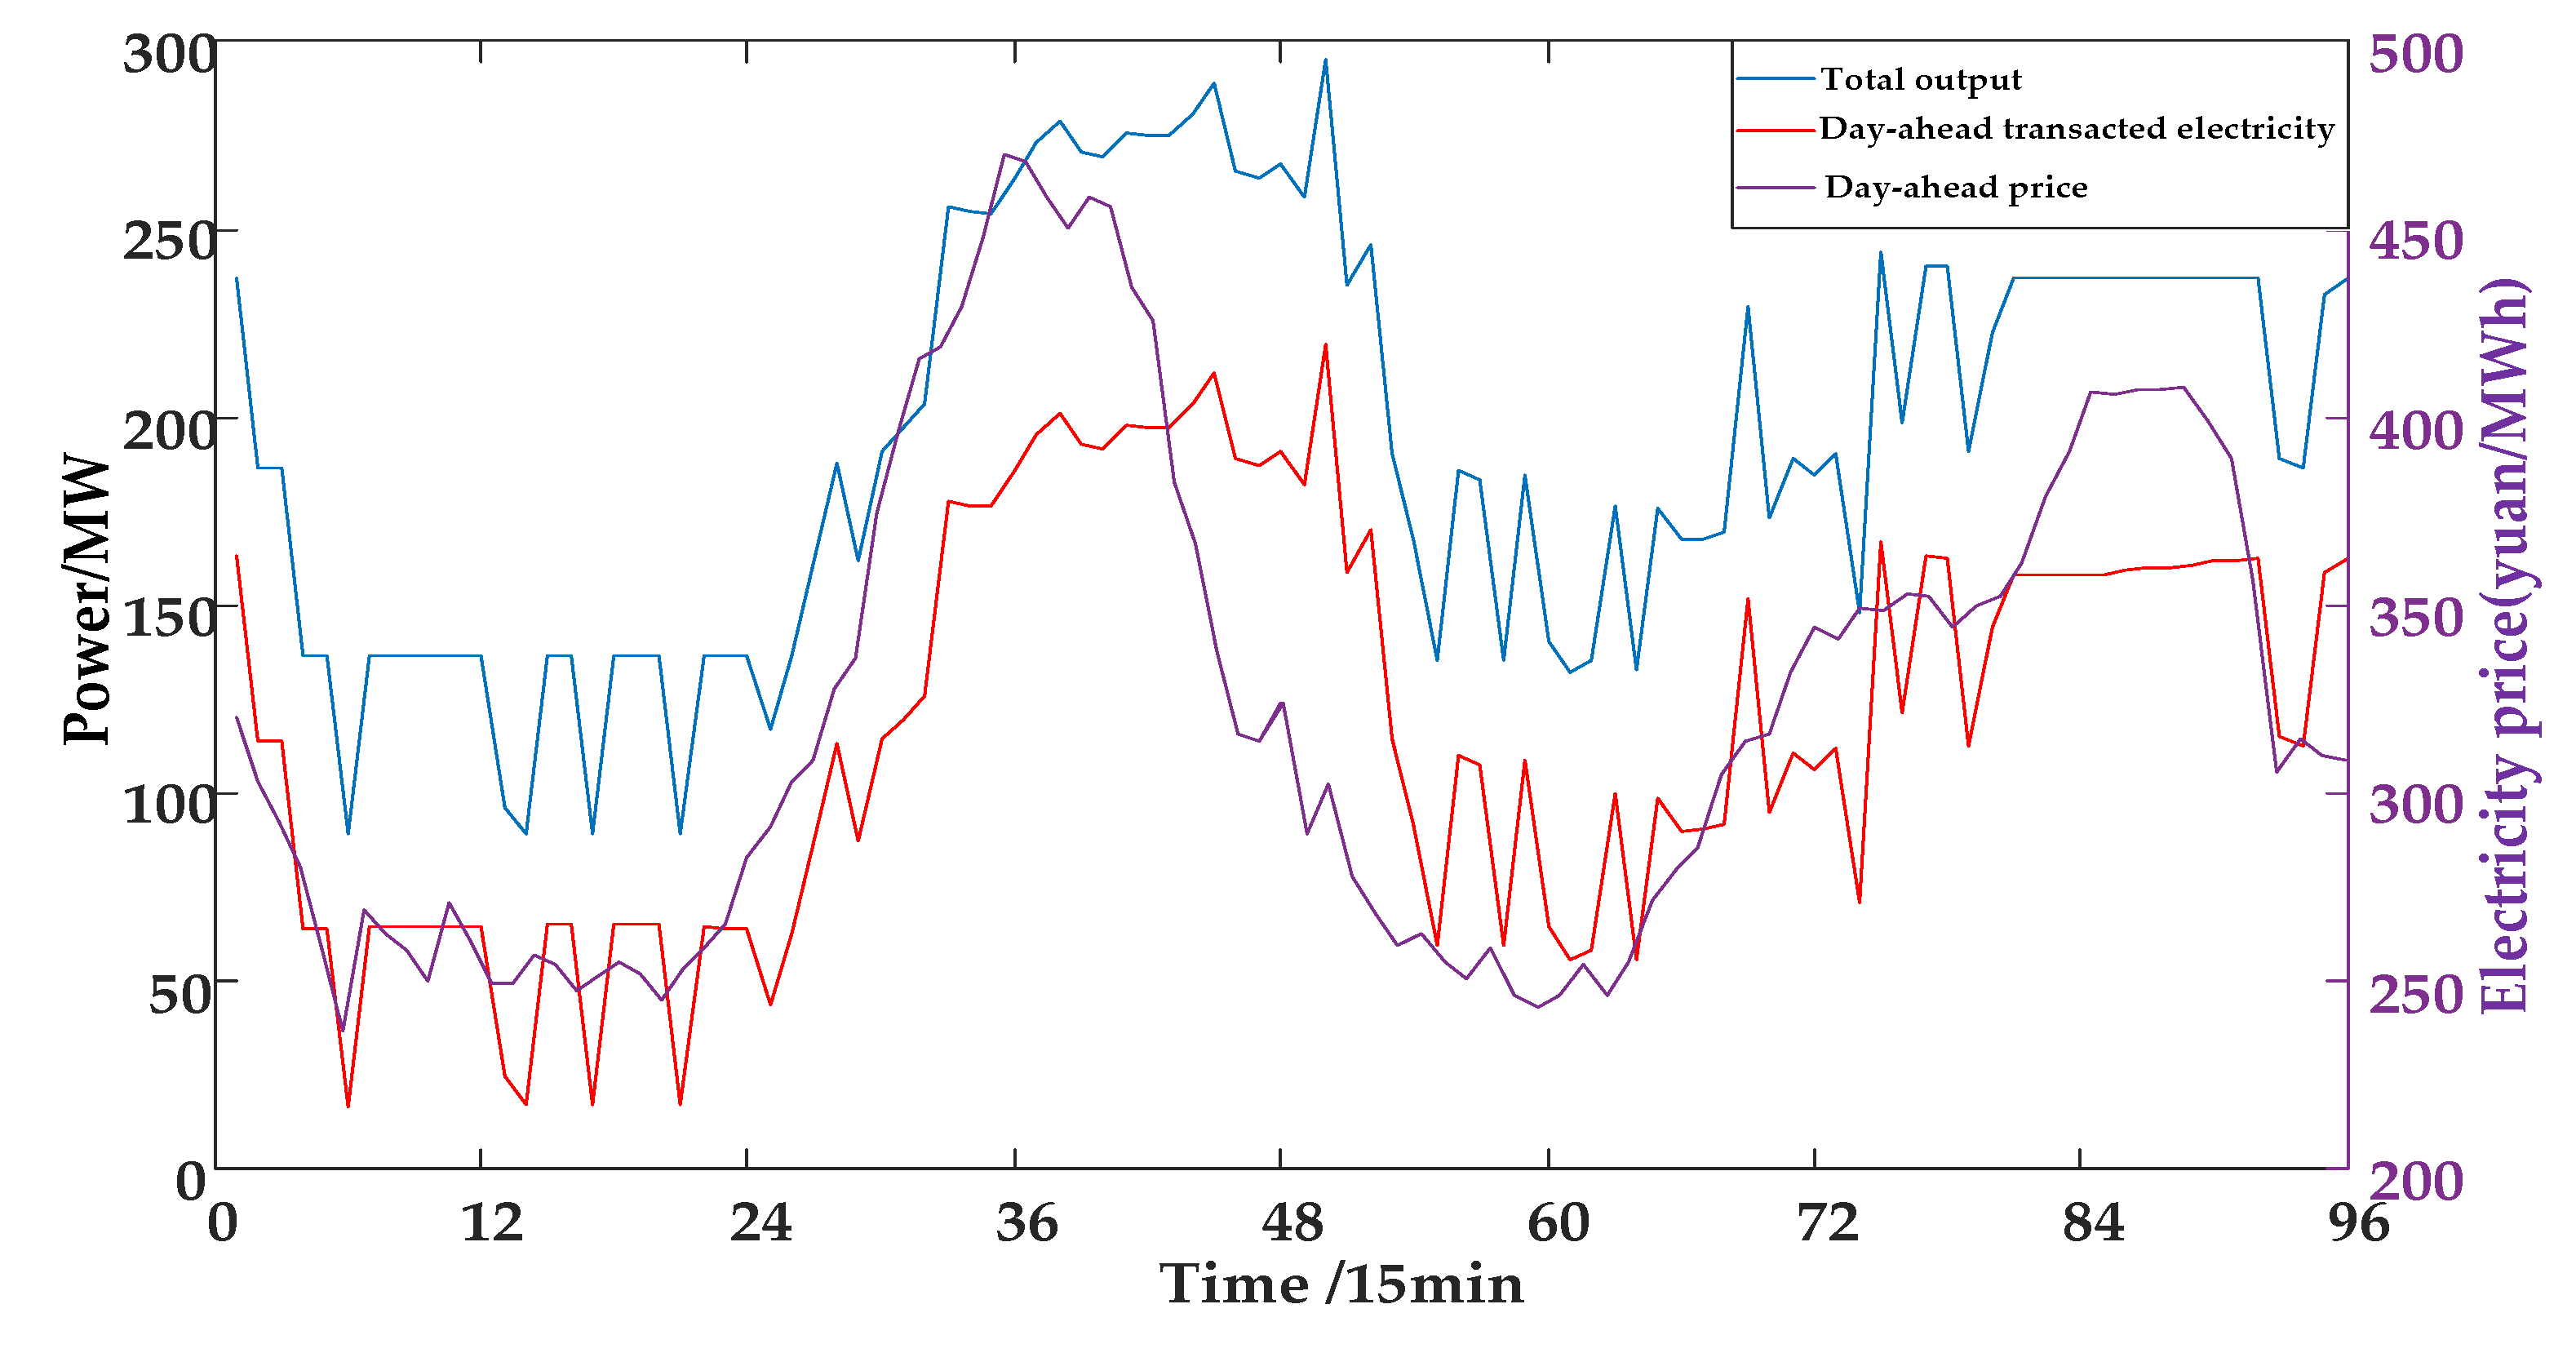
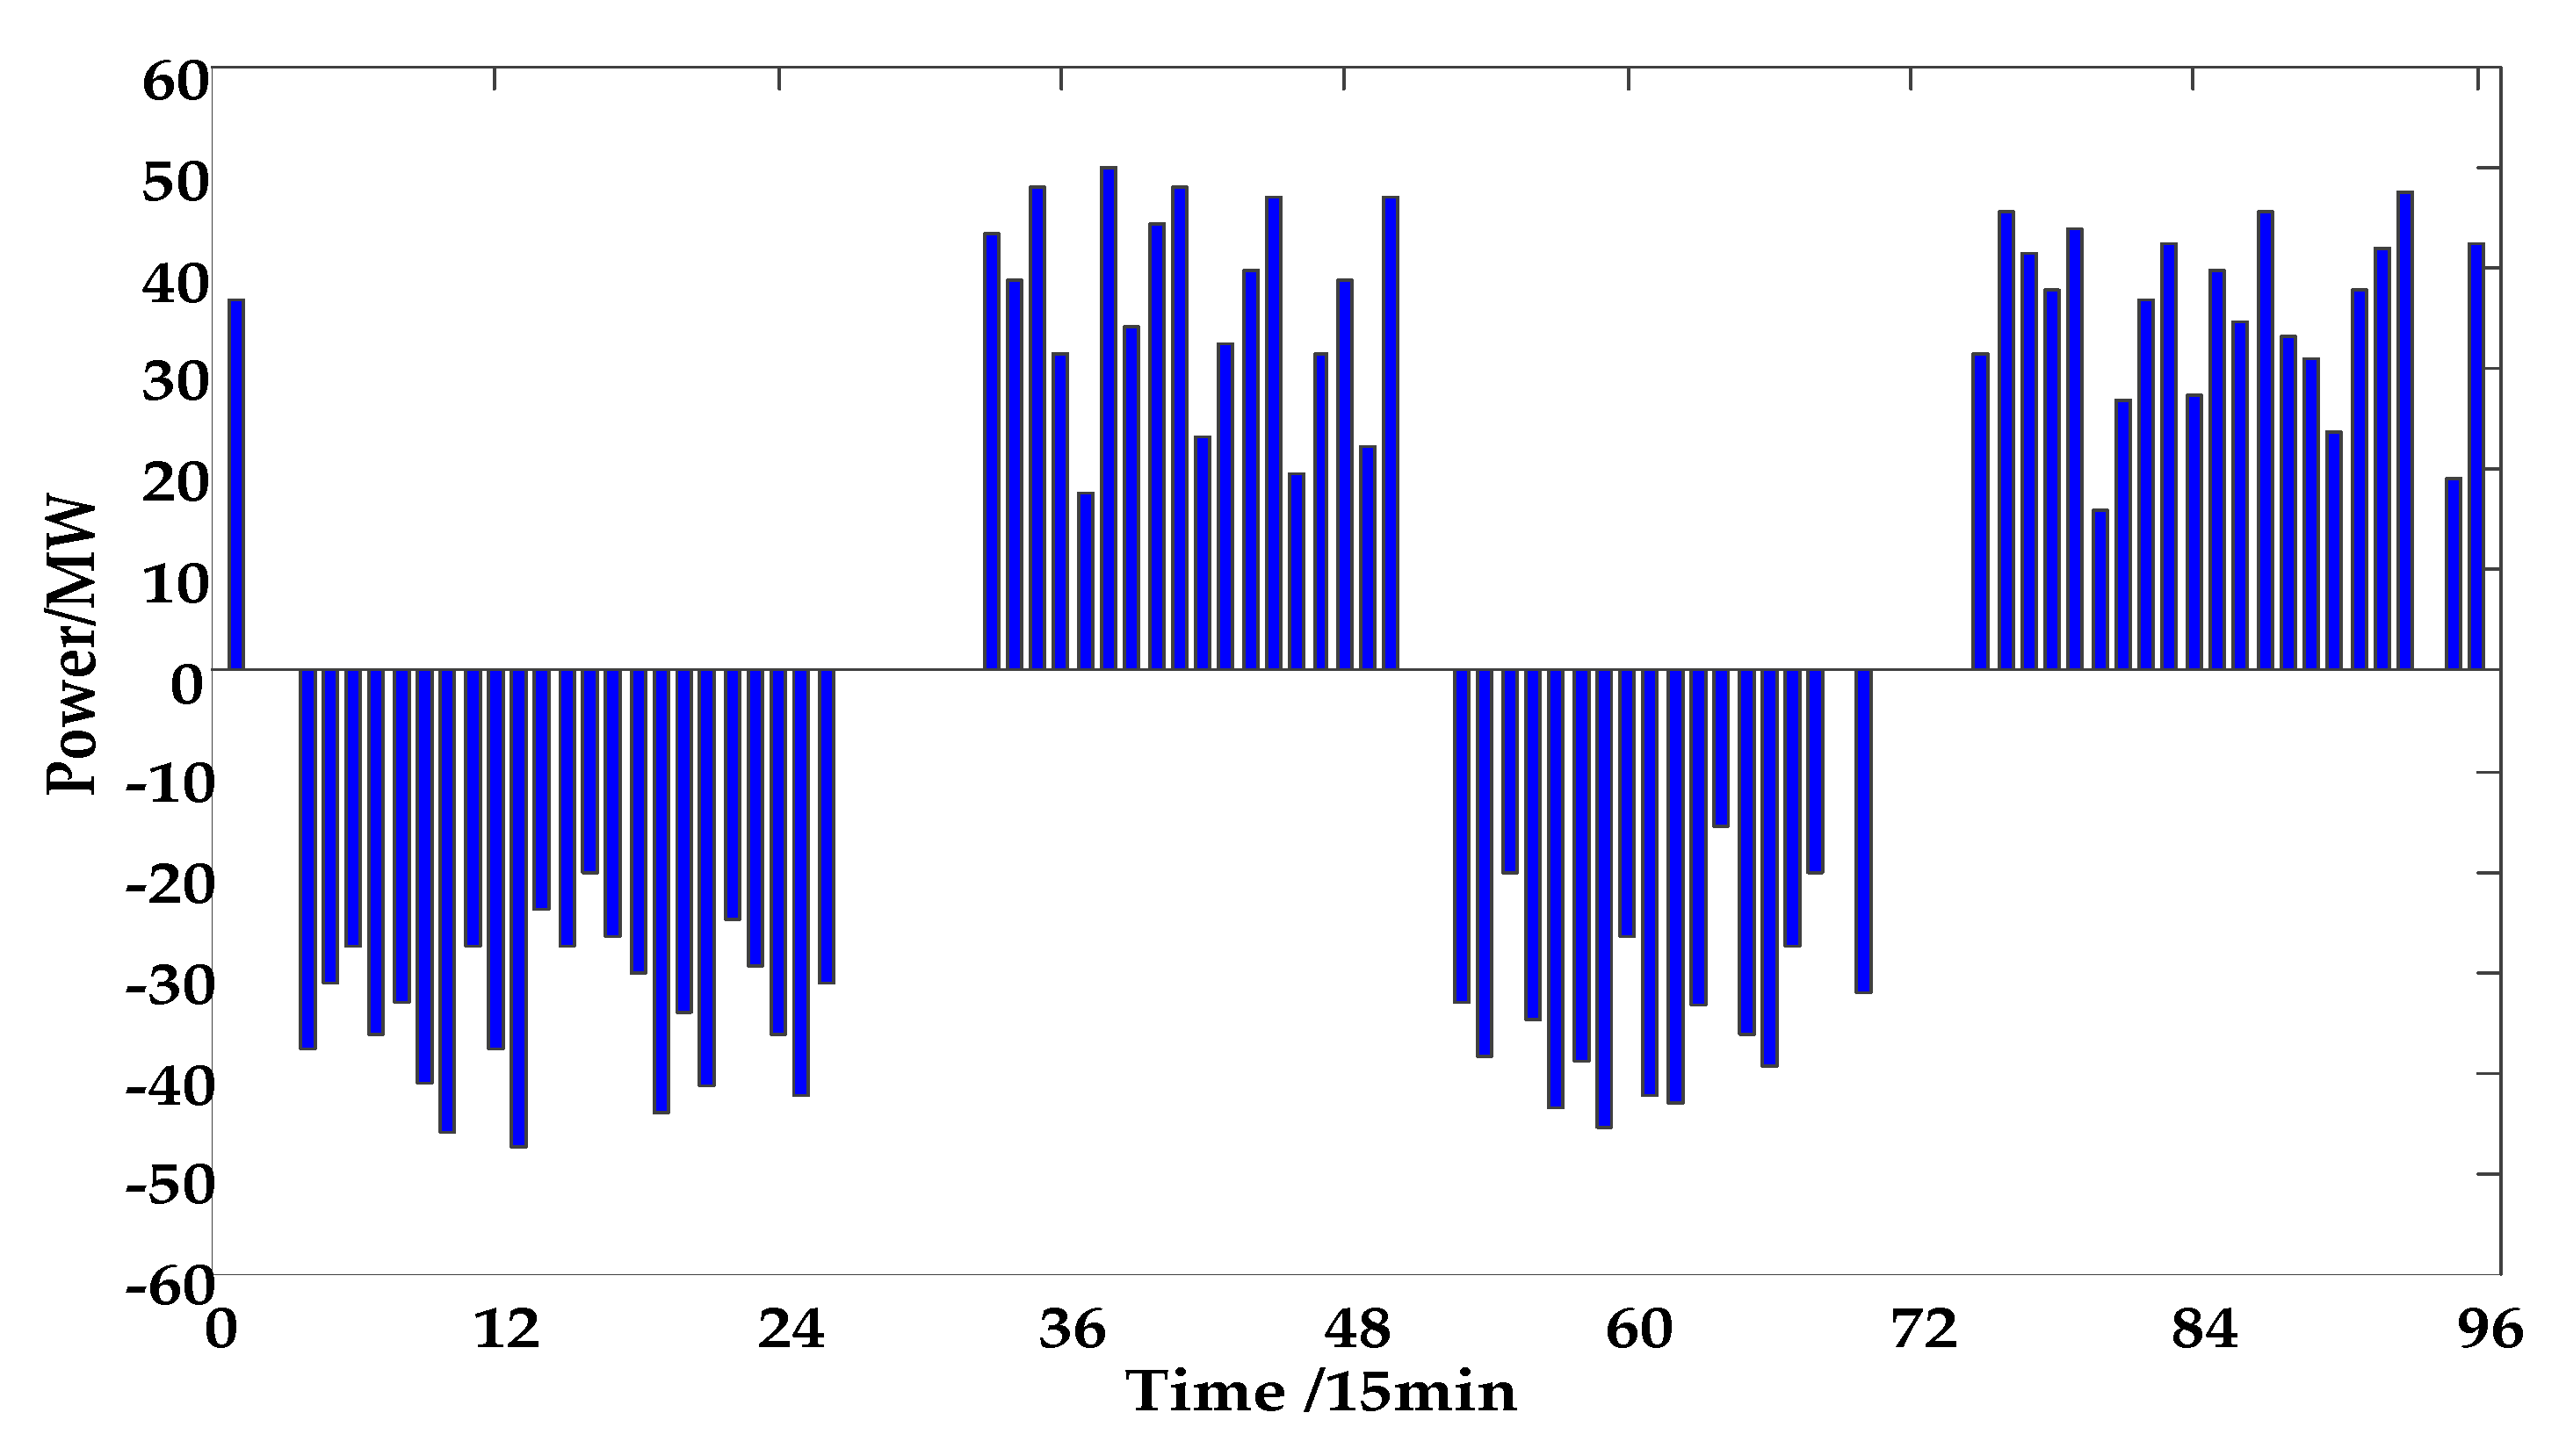
  • In the electricity market, the output of hydro-PV-pumped storage integrated generation system was optimized in the day-ahead market, the power deviation was balanced in the real-time market.
  • Complementary indices of the system were constructed, complementary indices and economy were mutually restrictive by the sensitivity analysis, this sizing method could maximize profits with meeting complementary indices.

6. Conclusions

In this paper, considering the uncertainty of output of PV, volatility of spot price and deviation between day-ahead load and real-time load, a model of hydro-PV-pumped storage integrated generation system was established based on the wide adjustment range of output of hydropower and rapid regulation ability of pumped storage. The impact of the complementary index, cost of abandoned water and Pearson correlation coefficient on economics and the complementarity of the system was analyzed, then the sizing method of the integrated generation system was proposed. The conclusions were obtained as follows.
  • With utilizing the output characteristics of various energy source, hydro-PV-pumped storage integrated generation system could improve the complementary performance and schedulability of the system, the fluctuation of output could suppress on a smaller time scale, and full consumption of PV’s was achieved by using the energy storage characteristics of pumped storage.
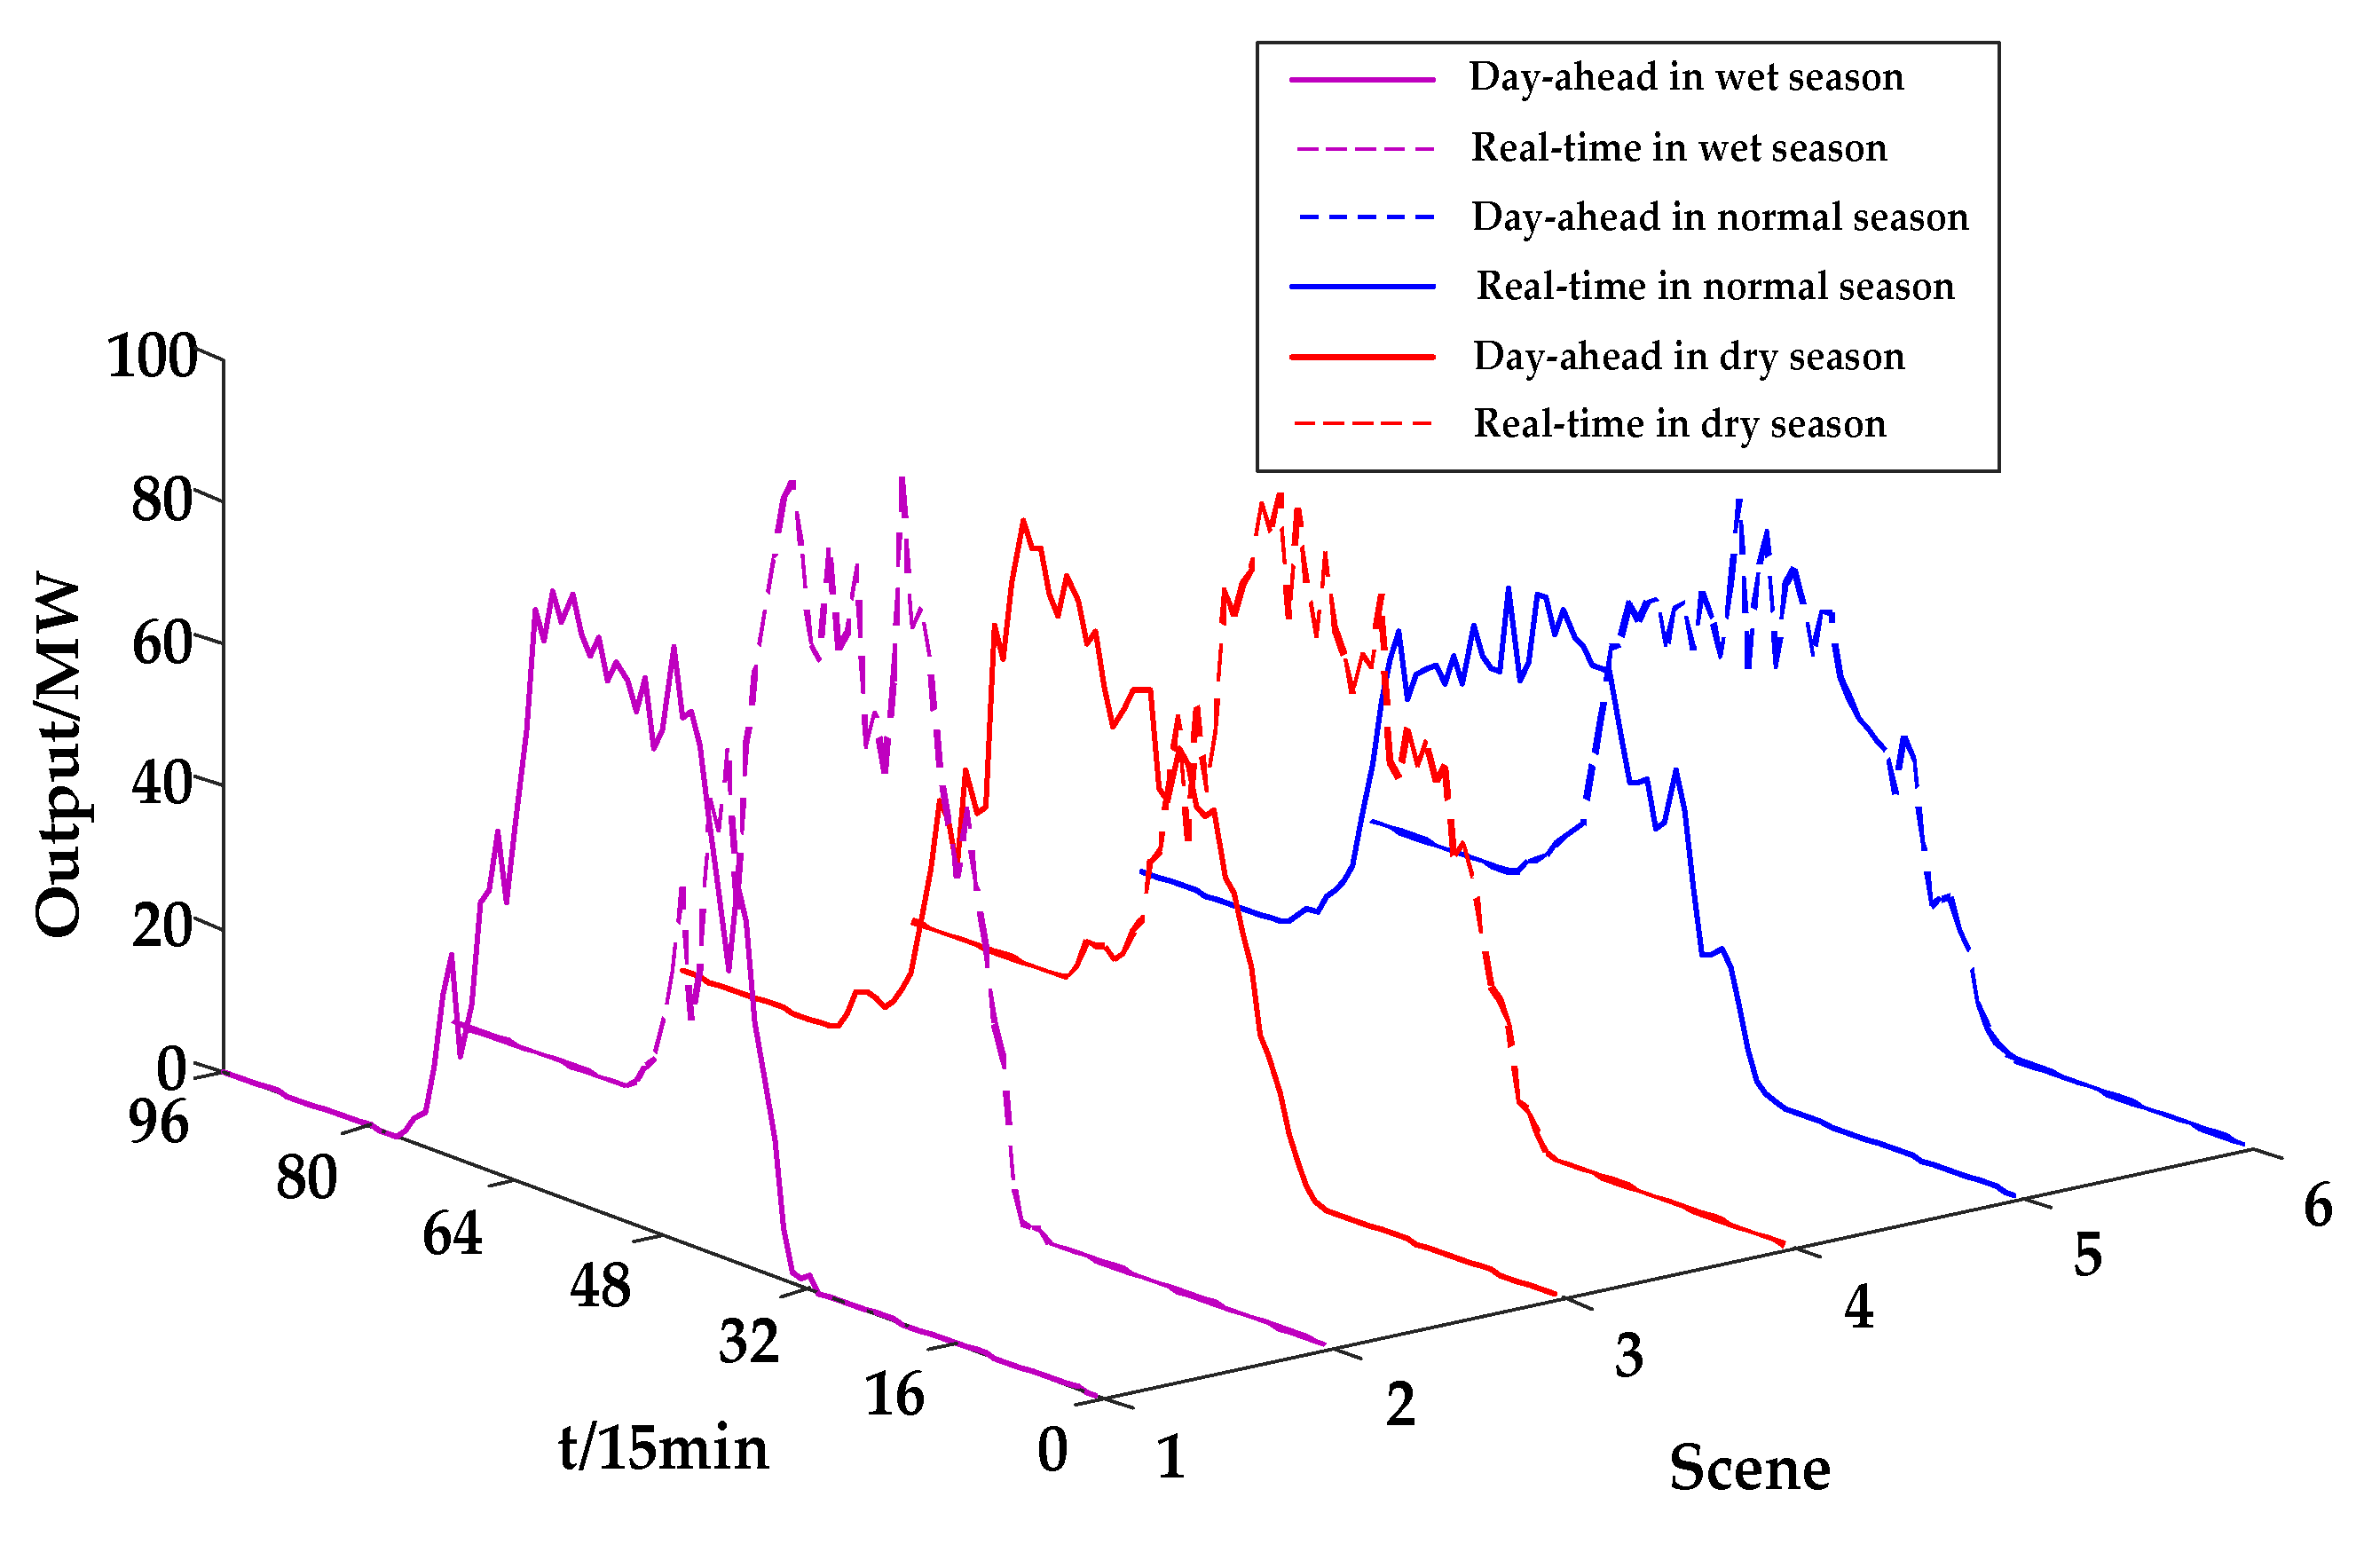
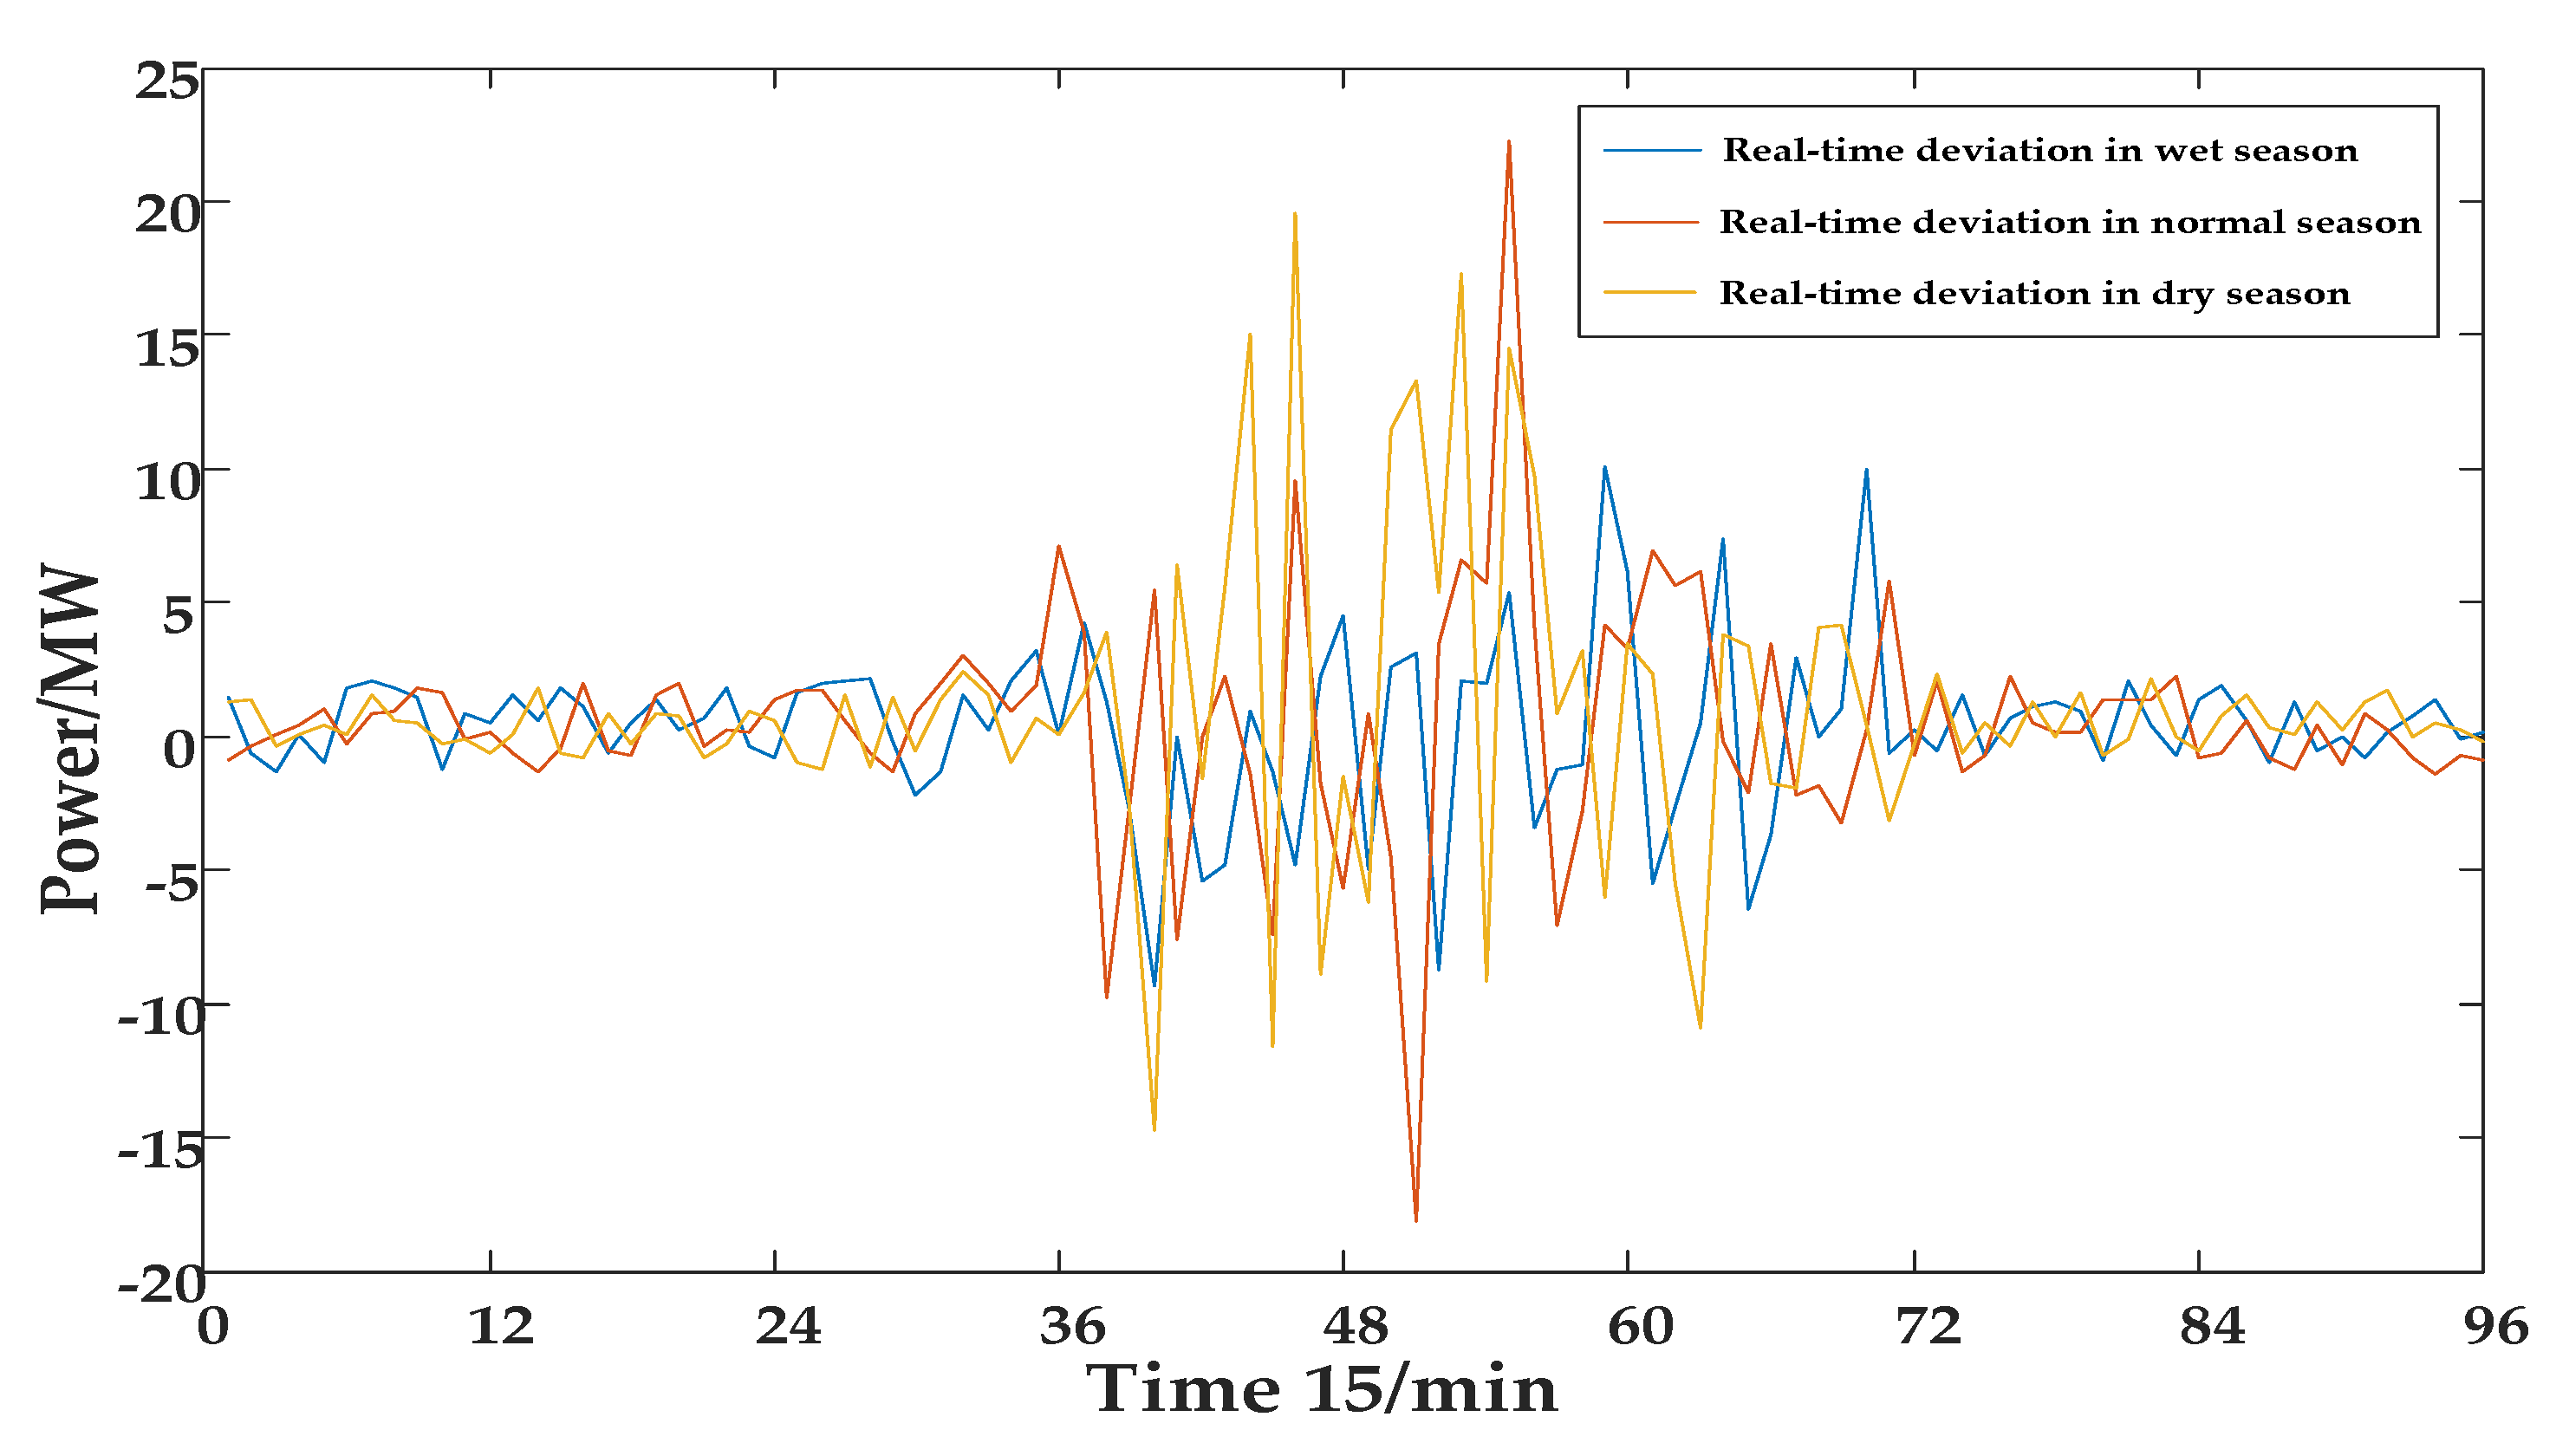
  • The complementary ability of the hydro-PV-pumped storage integrated generation system in different typical scenarios was an obvious difference. The complementary index in the flood season was obviously better than that in the normal and dry season, but the cost of abandoned water in the wet season was higher than that in the normal and dry season.
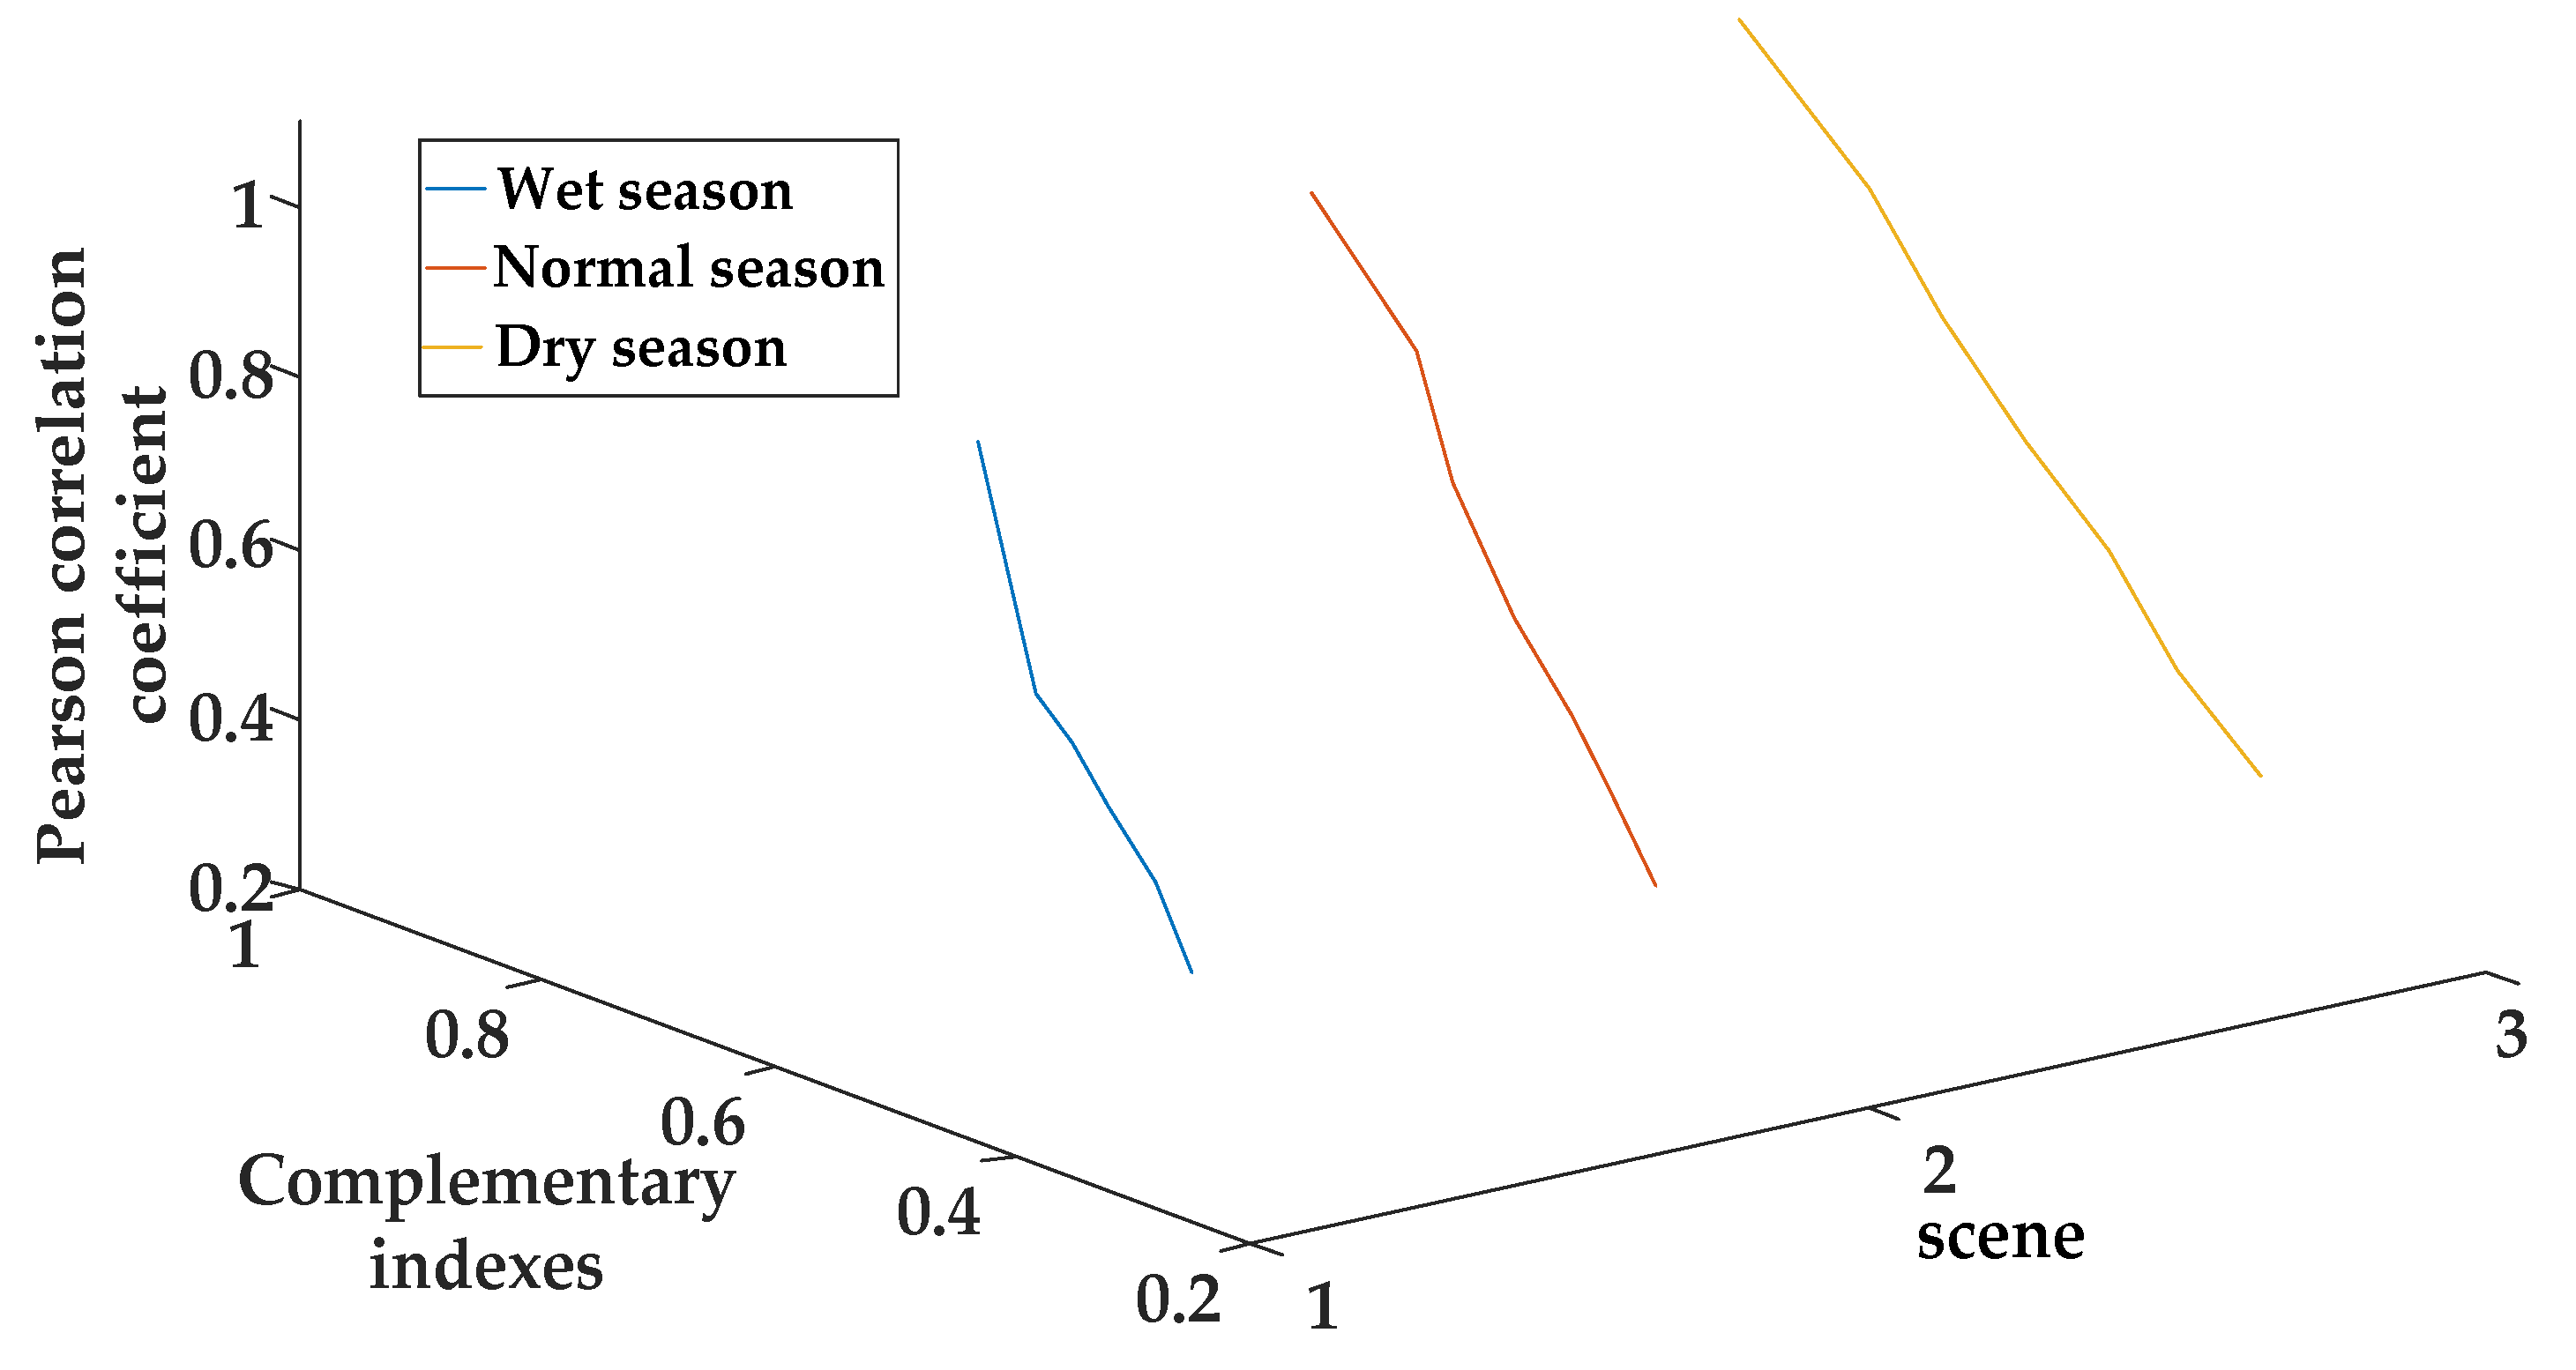
  • In different complementary modes, the complementary index, spot price correlation coefficient and system benefits of the system had certain regularity changes. There was a mutual constraint between the both, as the complementary index decreased, the volatility of the day-ahead transaction’s curve would be smaller, which would reduce the annual revenue and influence the economy of sizing of the system.
  • Considering the uncertainty of PV, spot price and load, the reasonable sizing scheme of the integrated generation system combined market operation mode proposed could improve the economy with meeting actual complementary indices in different typical scenes.

Author Contributions

Conceptualization, J.L. (Jichun Liu); Formal Analysis, J.L. (Jichun Liu), S.H. (Shuai Hu); Writing—Original Draft Preparation, J.L. (Jianhua Li); Writing—Review and Editing, Y.X. (Yue Xiang).

Funding

This work was founded by the National Key R&D Program of China (2018YFB0905200)—Research and application demonstration on complementary combined power generation technology for distributed PV and cascade hydropower.

Conflicts of Interest

The authors declare no conflict of interest.

Nomenclature

Symbols
a Q H , i b Q H , i Parameters of relational function of head loss—discharge volume of reservoir
a Z Q , i b Z Q , i c Z Q , i Parameters of relational function of downstream water level—discharge volume
a Z V , i b Z V , i c Z V , i d Z V , i Parameters of relational function of reservoir storage—upstream water level
C hyd d , n Abandoned water cost of hydropower station in the day d in the typical scene n
C pm d , n Generation cost of pumped storage in the day d in the typical scene n
C year Sum of the equivalent annual cost of investment and annual maintenance cost
C pm The start-up cost of the generation and pumping of pumped storage station
C pm , k , t Start-up cost of pumping of the pumped storage station k at the period of t
C gn , k , t Start-up cost power generation of the pumped storage station k at the period of t
C hyd Annual total cost of the hydropower station
C hyd , dev Equivalent annual cost of the hydropower station
C hyd , on Maintenance cost of the hydropower station
C pg Annual total cost of the pumped storage station
C pg , dev Equivalent annual cost of the pumped storage station
C pg , on Maintenance cost of the pumped storage station
C pv Annual total cost of the PV station
C pv , dev Equivalent annual cost of the PV station
C pv , on Maintenance cost of the PV station
C dev Equivalent annual cost of equipment
C inv Total cost of investment of equipment
D n The number of days for a typical scene n
H i ¯ Average value of net head of hydropower stations i in a day
H i , t Net power generation head of hydropower station i at the period of t
H i , t d Head loss of reservoir i at the period of t
I i , t Natural water of hydropower station i at the period of t
I T Coefficient of load tracking
K ch Maximum volatility ratio of power exchange to power grid
k T Power–temperature coefficient of PV
l Life-cycle of equipment
L AC , i , t Light intensity at the period of t
L stc Test light intensity
n hyd Number of hydropower stations, distributed PV and pumped storage station.
n pv Number of distributed PV stations
n gn Number of pumped storage stations
N Number of typical scenes
P ch , t Value of power exchange to power grid at the period of t
P ch max The most power exchange
P ch ¯ Average value of exchange power in a day
P hyd , i , t Output of hydroelectric hydropower station i at the period of t
P hyd , i min Minimum output of the hydropower station i
P hyd , i max Maximum output of the hydropower station i
P L max Maximum output of the integrated generation system
P pm , k , t Pumping power of the pumped storage station k at the period of t
P gn , k , t Power generation of the pumped storage station k at the period of t
P pm , k min Minimum pumping power of the pumped storage station k
P pm , k max Maximum pumping power of the pumped storage station k
P gn , k min Minimum power generation of the pumped storage station k
P gn , k max Maximum power generation of the pumped storage station k
P pv , t da Predictive output of PV at the period of t
P pv , t re Actual output of PV at the period of t
P pv , t m Maximum output of distributed PV in a standard test environment
Δ P pv , t Prediction deviation of PV at the period of t
P V , t Load value at the period of t
P V , t + 1 Load value at the period of t + 1
P V , t da Day-ahead predicted load and at the period of t
P V , t re Real-time load at the period of t
P ch , t da Transacted electricity in the day-ahead market at the period of t
P ch , t re Transacted electricity in the real-time market at the period of t
Q i , t Discharge volume of reservoir i at the period of t
Q i , t d Abandoned water hydropower station i at the period of t
Q i 1 , t d Abandoned water hydropower station i 1 at the period of t
Q i , t H Average power generation flow of hydropower station i at the period of t
Q i 1 , t H Average power generation flow of hydropower station i 1 at the period of t
Q i , min H Minimum power generation flow of the hydropower station i
Q i , max H Maximum power generation flow of the hydropower station i
Q i , t S Interval water of hydropower station i at the period of t
r P λ Pearson correlation coefficient
R V d , n Profit from local load in the day d in the typical scene n
R da d , n Profit from the day-ahead market in the day d in the typical scene n
R re d , n Profit from the real-time market in the day d in the typical scene n
R total Annual income of the integrated generation system
R V Profit from the local load
R d a Cost of purchasing electricity or profit from selling electricity in the day-ahead market
R r e Cost of purchasing electricity or profit from selling electricity in the real-time market
Δ t Optimized scheduling time period
T Total number of time period
T c , i , t Ambient temperature at the location of distributed PV i at the period of t
T r Reference temperature
V i , t Water volume of the reservoir i at the period of t
V i , t 1 Water volume of the reservoir i at the period of t 1
V i , min Minimum water quantity of the reservoir of the hydropower station i
V i , max Maximum water quantity of the reservoir of the hydropower station i
V i , 0 Initial water volume of the reservoir i during the scheduling period
V i , T Final water volume of the reservoir i during the scheduling period
Δ V i Amount of change of water volume of the reservoir i in a day,
V pm , k , t Water volume of the pumped storage station k at the period of t
V pm , k , t 1 Water volume of the pumped storage station k at the period of t 1 ,
V pm , k min Minimum water volume of the pumped storage station k
V pm , k max Maximum water volume of the pumped storage station k
V pm , k , 0 Initial the water volume of the pumped storage during the scheduling period.
V pm , k , T Final the water volume of the pumped storage during the scheduling period
y pm , k , t Pumping condition state variable of the pumped storage station k at the period of t
y gn , k , t Generation condition state variable of the pumped storage station k at the period of t
Z i , t up Upstream water level of the reservoir i at the period of t
Z i , t down Downstream water level of the reservoir i at the period of t
Z i , t 1 up Upstream water level of the reservoir i at the period of t 1
α L , t Change rate (p.u.) of total output
β % Proportional coefficient
β V , t Change rate (p.u.) of total output
σ pv Standard deviation
η Discount rate
η i Generation efficiency of the hydropower station i
η pm , k Electricity/water conversion coefficient at pumping condition
η gn , k Electricity/water conversion coefficient at generation condition
κ t Error factor between day-ahead load and real-time load at the period of t
λ ¯ Average value of spot price in a day
λ m Fixed electricity price
λ t re Real-time price at the period of t
λ hyd , t Penalty factor of abandoned water at the period of t
λ t da Day-ahead price at the period of t
Δ λ t Difference price between real-time price and day-ahead price at the period of t
λ t da , p Predicted day-ahead price at the period of t
λ max da , p Maximum predicted price
μ t da , p Prediction error factor of day-ahead price at the period of t
Γ Conservative degree of robust optimization of spot price

References

  1. Nehrir, M.H.; Wang, C.; Strunz, K. A Review of Hybrid Renewable/Alternative Energy Systems for Electric Power Generation: Configurations, Control, and Applications. IEEE Trans. Sustain. Energy 2011, 2, 392–403. [Google Scholar] [CrossRef]
  2. Garcia, P.; Garcia, C.; Fernandez, L.M. ANFIS-Based Control of a Grid-Connected Hybrid System Integrating Renewable Energies, Hydrogen and Batteries. IEEE Trans. Ind. Inform. 2014, 10, 1107–1117. [Google Scholar] [CrossRef]
  3. Yang, H.T.; Huang, C.M.; Huang, Y.C.; Pai, Y.S. A Weather-Based Hybrid Method for 1-Day Ahead Hourly Forecasting of PV Power Output. IEEE Trans. Sustain. Energy 2014, 5, 917–926. [Google Scholar] [CrossRef]
  4. Gao, Y.J.; Xue, F.S.; Yang, W.H.; Yang, Q.; Sun, Y.J.; Sun, Y.P.; Liang, H.F.; Li, P. Optimal operation modes of photovoltaic battery energy storage system based power plants considering typical scenarios. Prot. Control Mod. Power Syst. 2017, 2, 36. [Google Scholar] [CrossRef]
  5. Li, J.H.; Wang, S.; Ye, L.; Fang, J. A coordinated dispatch method with pumped-storage and battery-storage for compensating the variation of wind power. Prot. Control Mod. Power Syst. 2018, 3, 2. [Google Scholar] [CrossRef] [Green Version]
  6. Ming, B.; Huang, Q.; Wang, Y.M.; Fang, W.; Xie, X.P. The feasibility analysis of short-term scheduling for joint operation of hydropower and photoelectric. Acta Energiae Solaris Sinica 2015, 36, 2731–2737. (In Chinese) [Google Scholar] [CrossRef]
  7. Shang, Y.Z.; Xu, Y.; Shang, L.; Fan, Q.X.; Wang, Y.Y.; Liu, Z.W. A method of direct, real-time forecasting of downstream water levels via hydropower station reregulation: A case study from Ge zhou ba Hydropower Plant, China. J. Hydrol. 2019, 573, 895–907. [Google Scholar] [CrossRef]
  8. Guan, X.; Wu, J.; Gao, F.; Sun, G.J. Optimization-Based Generation Asset Allocation for Forward and Spot Markets. IEEE Trans. Power Syst. 2008, 23, 1796–1808. [Google Scholar] [CrossRef]
  9. Baillo, A.; Ventosa, M.; Rivier, M.; Ramos, A. Optimal offering strategies for generation companies operating in electricity spot markets. IEEE Trans. Power Syst. 2004, 19, 745–753. [Google Scholar] [CrossRef]
  10. Ming, B.; Liu, P.; Guo, S.L.; Zhang, X.Q.; Feng, M.Y.; Wang, X.X. Optimizing utility-scale photovoltaic power generation for integration into a hydropower reservoir by incorporating long-and short-term operational decisions. Appl. Energy 2017, 204, 432–445. [Google Scholar] [CrossRef]
  11. Sun, K.Q.; Li, K.J.; Pan, J.P.; Liu, Y.; Liu, Y.L. An optimal combined operation scheme for pumped storage and hybrid wind-photovoltaic complementary power generation system. Appl. Energy 2019, 242, 155–1163. [Google Scholar] [CrossRef]
  12. Zhang, H.X.; Lu, Z.X.; Hu, W.; Wang, Y.T.; Dong, L.; Zhang, J.T. Coordinated optimal operation of hydro–wind–solar integrated systems. Appl. Energy 2019, 242, 883–896. [Google Scholar] [CrossRef]
  13. Jurasz, J.; Ciapała, B. Solar–hydro hybrid power station as a way to smooth power output and increase water retention. Sol. Energy 2018, 173, 675–690. [Google Scholar] [CrossRef]
  14. Ioannis, K.; Sándor, S.; Fabio, M.F.; Thomas, H.; Katalin, B. A methodology for optimization of the complementarity between small-hydropower plants and solar PV systems. Renew. Energy 2016, 87, 1023–1030. [Google Scholar] [CrossRef]
  15. Feng, L.; Zhang, J.; Li, G.; Zhang, B. Cost reduction of a hybrid energy storage system considering correlation between wind and PV power. Prot. Control Mod. Power Syst. 2016, 1, 11. [Google Scholar] [CrossRef]
  16. Xu, B.; Chen, D.Y.; Kumar, M.V.; Xiao, Y.; Yue, Y.; Xing, Y.Q.; Li, P.Q. Modeling a pumped storage hydropower integrated to a hybrid power system with solar-wind power and its stability analysis. Appl. Energy 2019, 248, 446–462. [Google Scholar] [CrossRef]
  17. Xu, Y.; Singh, C. Adequacy and Economy Analysis of Distribution Systems Integrated with Electric Energy Storage and Renewable Energy Resources. IEEE Trans. Power Syst. 2012, 27, 2332–2341. [Google Scholar] [CrossRef]
  18. He, G.; Chen, Q.; Kang, C.; Xia, Q.; Poolla, K. Cooperation of Wind Power and Battery Storage to Provide Frequency Regulation in Power Markets. IEEE Trans. Power Syst. 2017, 32, 3559–3568. [Google Scholar] [CrossRef]
  19. Pérez-Díaz, J.I.; Wilhelmi, J.R.; Arévalo, L.A. Optimal short-term operation schedule of a hydropower plant in a competitive electricity marke. Energy Convers. Manag. 2010, 51, 2955–2966. [Google Scholar] [CrossRef]
  20. Koraki, D.; Strunz, K. Wind and Solar Power Integration in Electricity Markets and Distribution Networks Through Service-centric Virtual Power Plants. IEEE Trans. Power Syst. 2018, 33, 473–485. [Google Scholar] [CrossRef]
  21. Liu, F.; Zhang, L.Z. Long Term Optimal Operation of Cascade Hydropower Based on Multicore Cluster Parallel Computing and Large System Decomposition-coordination. Proc. CSEE 2017, 37, 2479–2490. (In Chinese) [Google Scholar] [CrossRef]
  22. Xia, P.; Deng, C.H.; Long, Z.J.; Yao, W.W.; Zhang, K.; Wang, W.Z. Robust Unit Commitment with Pumped Storage Units for Wind Power Accommodation. Autom. Electr. Power Syst. 2018, 42, 47–55. (In Chinese) [Google Scholar] [CrossRef]
  23. Wang, Y.F.; Fu, Y.C.; Sun, L.; Xue, H. Ultra-Short Term Prediction Model of Photovoltaic Output Power Based on Chaos-RBF Neural Network. Power Syst. Technol. 2018, 42, 1110–1116. (In Chinese) [Google Scholar] [CrossRef]
  24. Conejo, A.J.; Contreras, J.; Espínola, R.; Plazas, M.A. Forecasting electricity prices for a day-ahead pool-based electric energy market. Int. J. Forecast. 2005, 21, 435–462. [Google Scholar] [CrossRef]
  25. Zhang, X.D.; Wang, H.J.; Geng, W.; Zeng, M.; Zhou, X. Robust power-loss cost optimization model considering price uncertainty for active distribution network. Electr. Power Autom. Equip. 2017, 37, 131–138. (In Chinese) [Google Scholar] [CrossRef]
  26. Xu, W.; Chang, C.; Hung, Y.S.; Fung, P.C.W. Asymptotic Properties of Order Statistics Correlation Coefficient in the Normal Cases. IEEE Trans. Signal Process. 2008, 56, 2239–2248. [Google Scholar] [CrossRef] [Green Version]
  27. Ke, B.R.; Ku, T.T.; Ke, Y.L.; Chuang, C.Y.; Chen, H.Z. Sizing the Battery Energy Storage System on a University Campus with Prediction of Load and Photovoltaic Generation. IEEE Trans. Ind. Appl. 2016, 52, 1136–1147. [Google Scholar] [CrossRef]
Figure 1. Relationship among the power generation system, local load and power grid.
Energies 12 03001 g001
Figure 2. Steps of sizing of the integrated generation system.
Energies 12 03001 g002
Figure 3. Local load curve.
Energies 12 03001 g003
Figure 4. Spot price’s curve.
Energies 12 03001 g004
Figure 5. Output curve of PV.
Energies 12 03001 g005
Figure 6. The relationship between the upstream and the volume of the reservoir.
Energies 12 03001 g006
Figure 7. The relationship between the downstream and the volume of the reservoir.
Energies 12 03001 g007
Figure 8. Output of the power generation system in the wet season.
Energies 12 03001 g008
Figure 9. Generation/pumping power of the pumped storage in the wet season.
Energies 12 03001 g009
Figure 10. Output of the power generation system in the normal season.
Energies 12 03001 g010
Figure 11. Generation/pumping power of the pumped storage in the normal season.
Energies 12 03001 g011
Figure 12. Output of the power generation system in the dry season.
Energies 12 03001 g012
Figure 13. Generation/pumping power of the pumped storage in the dry season.
Energies 12 03001 g013
Figure 14. Real-time power deviation.
Energies 12 03001 g014
Figure 15. The relationship between the Pearson correlation coefficient and complementary index.
Energies 12 03001 g015
Table 1. Parameters of hydropower stations.
NumberNormal Upstream Water LevelLowest Water LevelNormal Downstream Water LevelMax Storage Capacity (104 m3)Min Storage Capacity (104 m3)Max Flow (m3/s)Min Flow (m3/s)Power Generation Efficiency
1275627522621.330.114.043.3211.30.80
22608.72606.72451.496.175.253.413.20.85
32449.82447.82294.385.459.847.112.60.85
Table 2. Parameters of pumped storage stations.
Initial Storage Capacity (104m3)Max Storage Capacity (104m3)Min Storage Capacity (104m3)Max Pumping/Generation Power (MW)Min Pumping/Generation Power (MW)Water/Electricity Conversion Coefficient in Generation State m3/(MWh)Water/Electricity Conversion Coefficient in Pumping State m3/(MWh)
1302102550510885
Table 3. Parameters of PV panels.
Reference Temperature (°C)Temperature CoefficientTest Light Intensity (W/m2)
25−0.5%1000
Table 4. The indices and revenue of the integrated generation system in typical days.
SceneLoad Tracking CoefficientComplementary IndexRevenue in Typical DaysPearson Correlation CoefficientCost of Abandoned Water
Wet0.06870.446,813,0271.0259135,011
Normal0.09350.596,465,0771.038451,468
Dry0.10520.626,136,6120.994648,456
Table 5. Annual revenue of sizing for the integrated generation system based on complementary and economy in different scenarios.
ModeComplementary IndexLoad Tracking CoefficientPearson Correlation CoefficientCost of Annual Investment and MaintenanceAnnual Revenue/Yuan
WetNormalDryWetNormalDryWetNormalDry
10.430.670.830.06860.09350.10521.021.030.994853213001845029176
20.400.580.720.06310.08740.09760.850.890.911741148292
30.380.550.660.05630.08160.08450.750.750.821632119713
40.350.500.590.04920.07350.07870.710.620.711498362824
50.320.450.520.04430.06520.06760.650.530.591359375705
60.280.420.460.03860.05750.05920.580.460.481243605618
70.250.380.390.03230.04730.04820.490.370.361124590215

