
Mitigating Land Degradation Through Sustainable Urban Landscapes Planning


Abstract
1. Introduction
How to Mitigate the Ecological Effects of Land-Take and Land Degradation Through Urban Planning
2. Materials and Methods
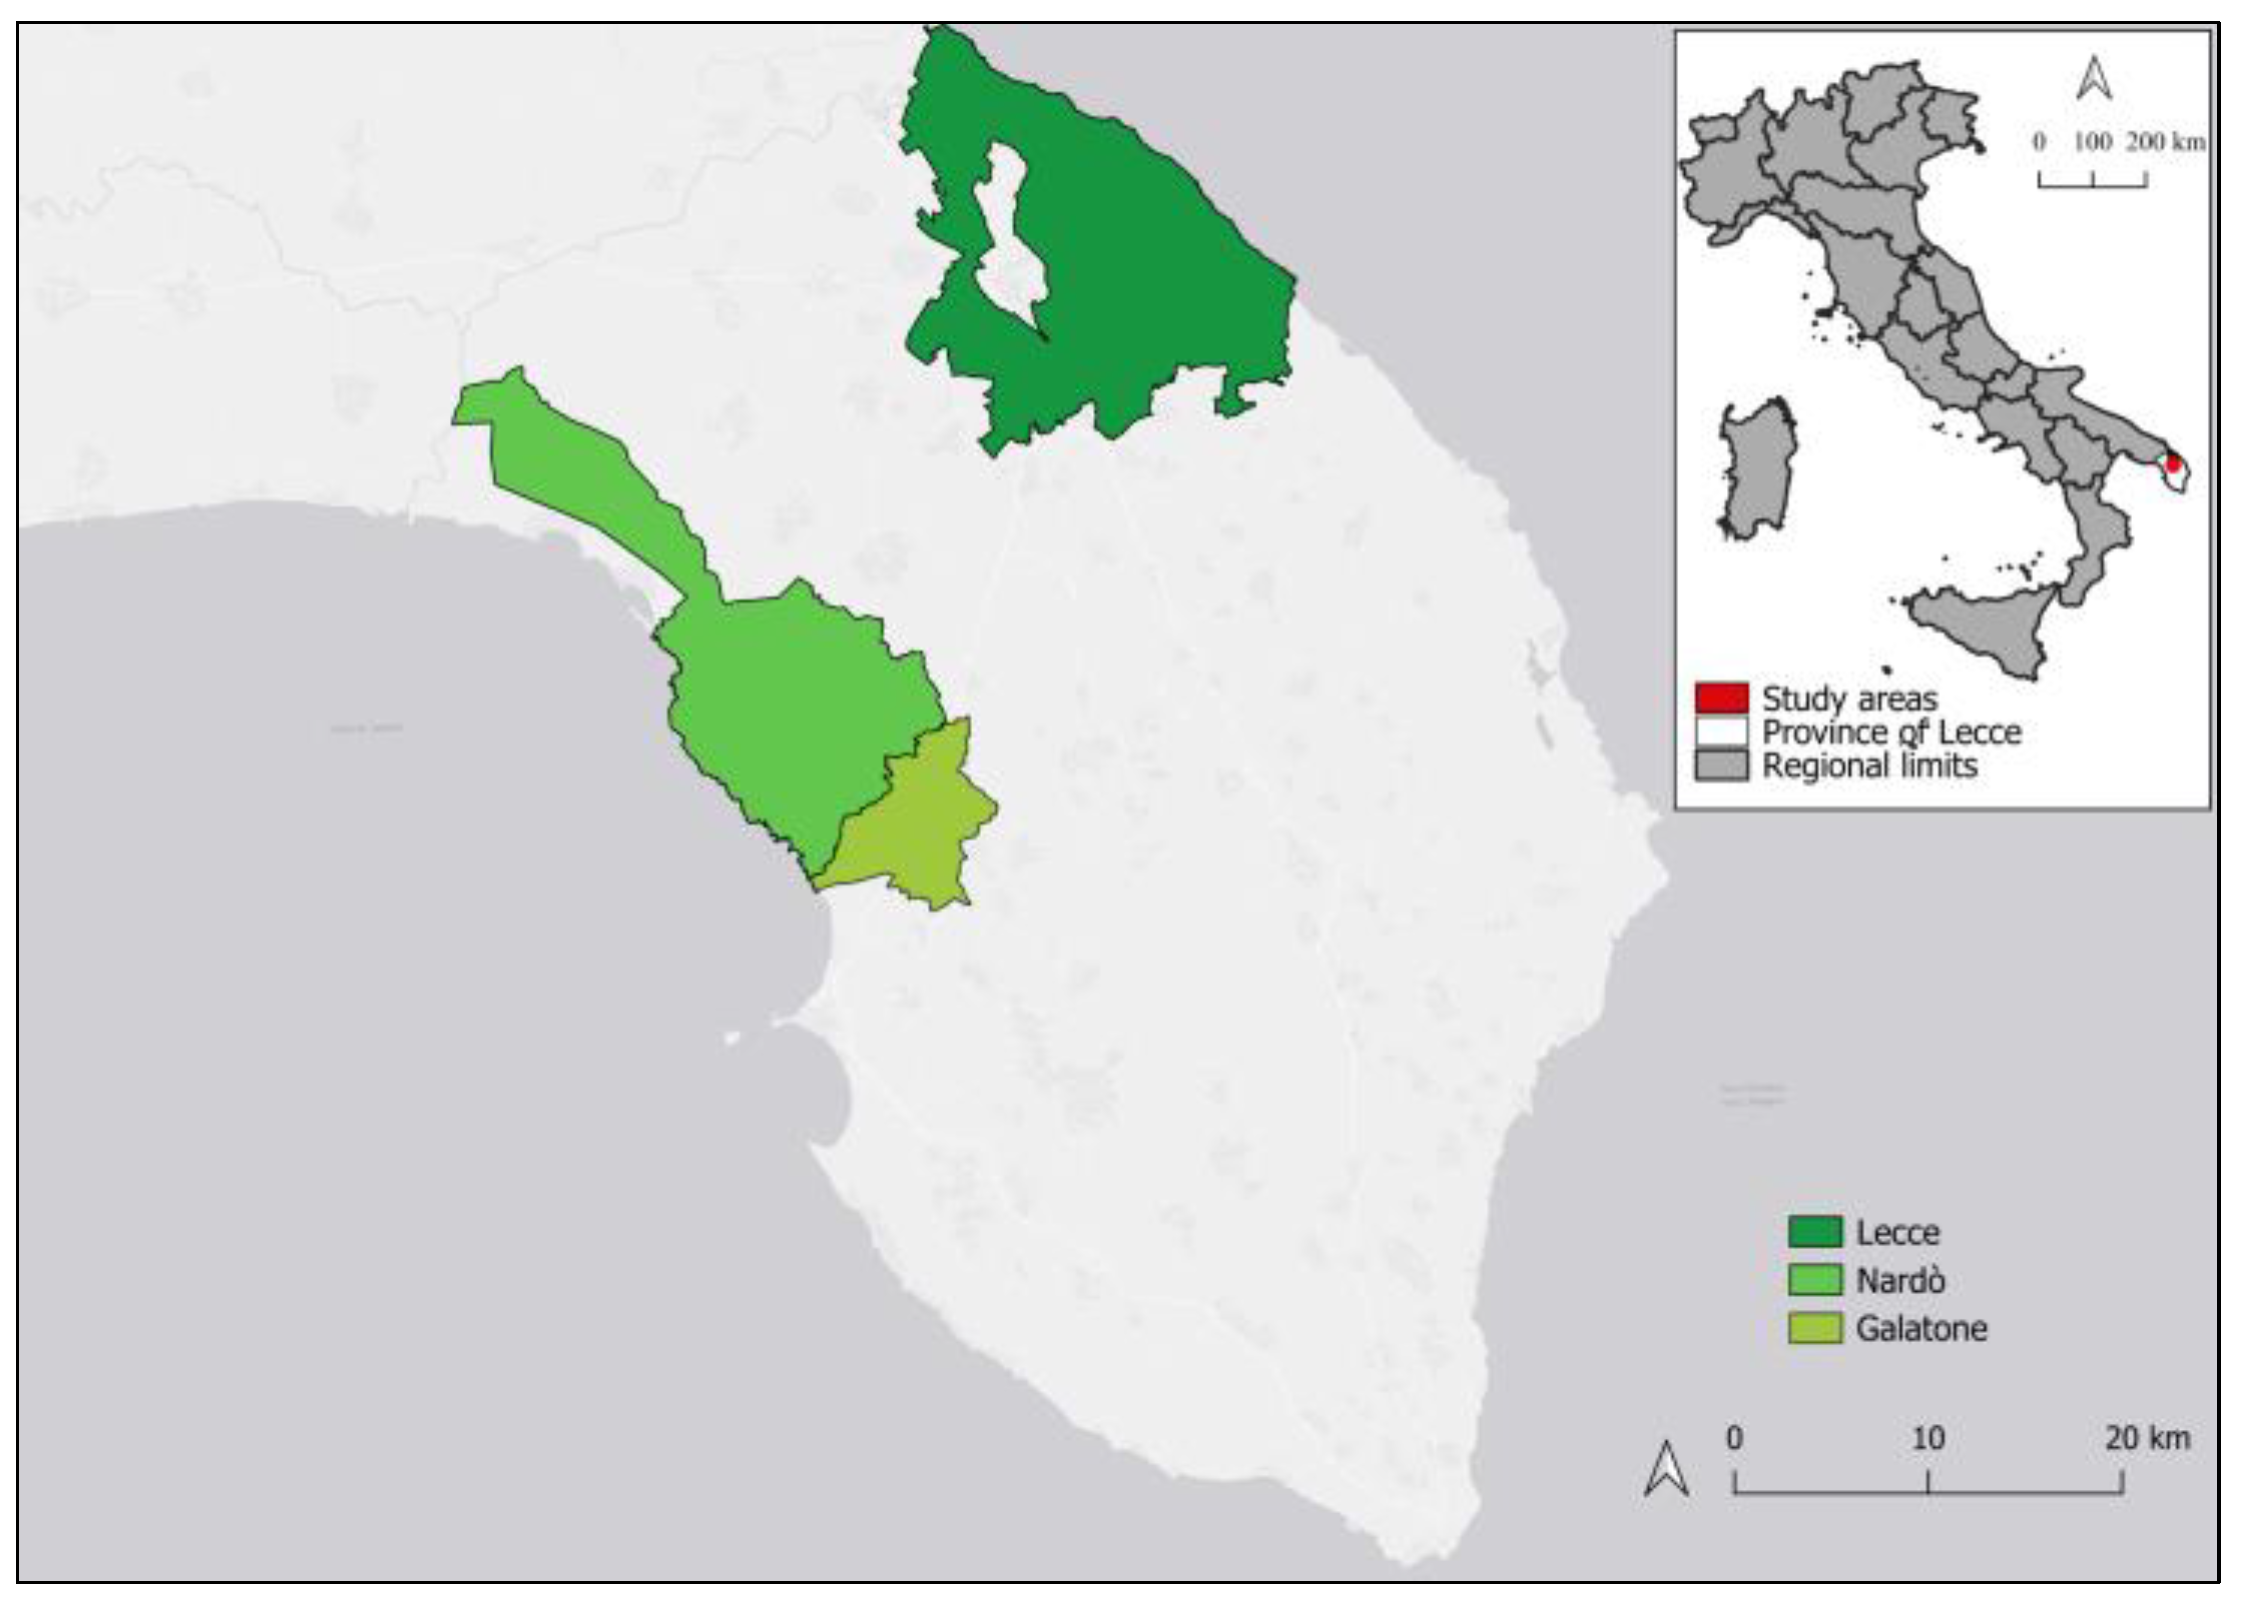
2.1. Study Areas
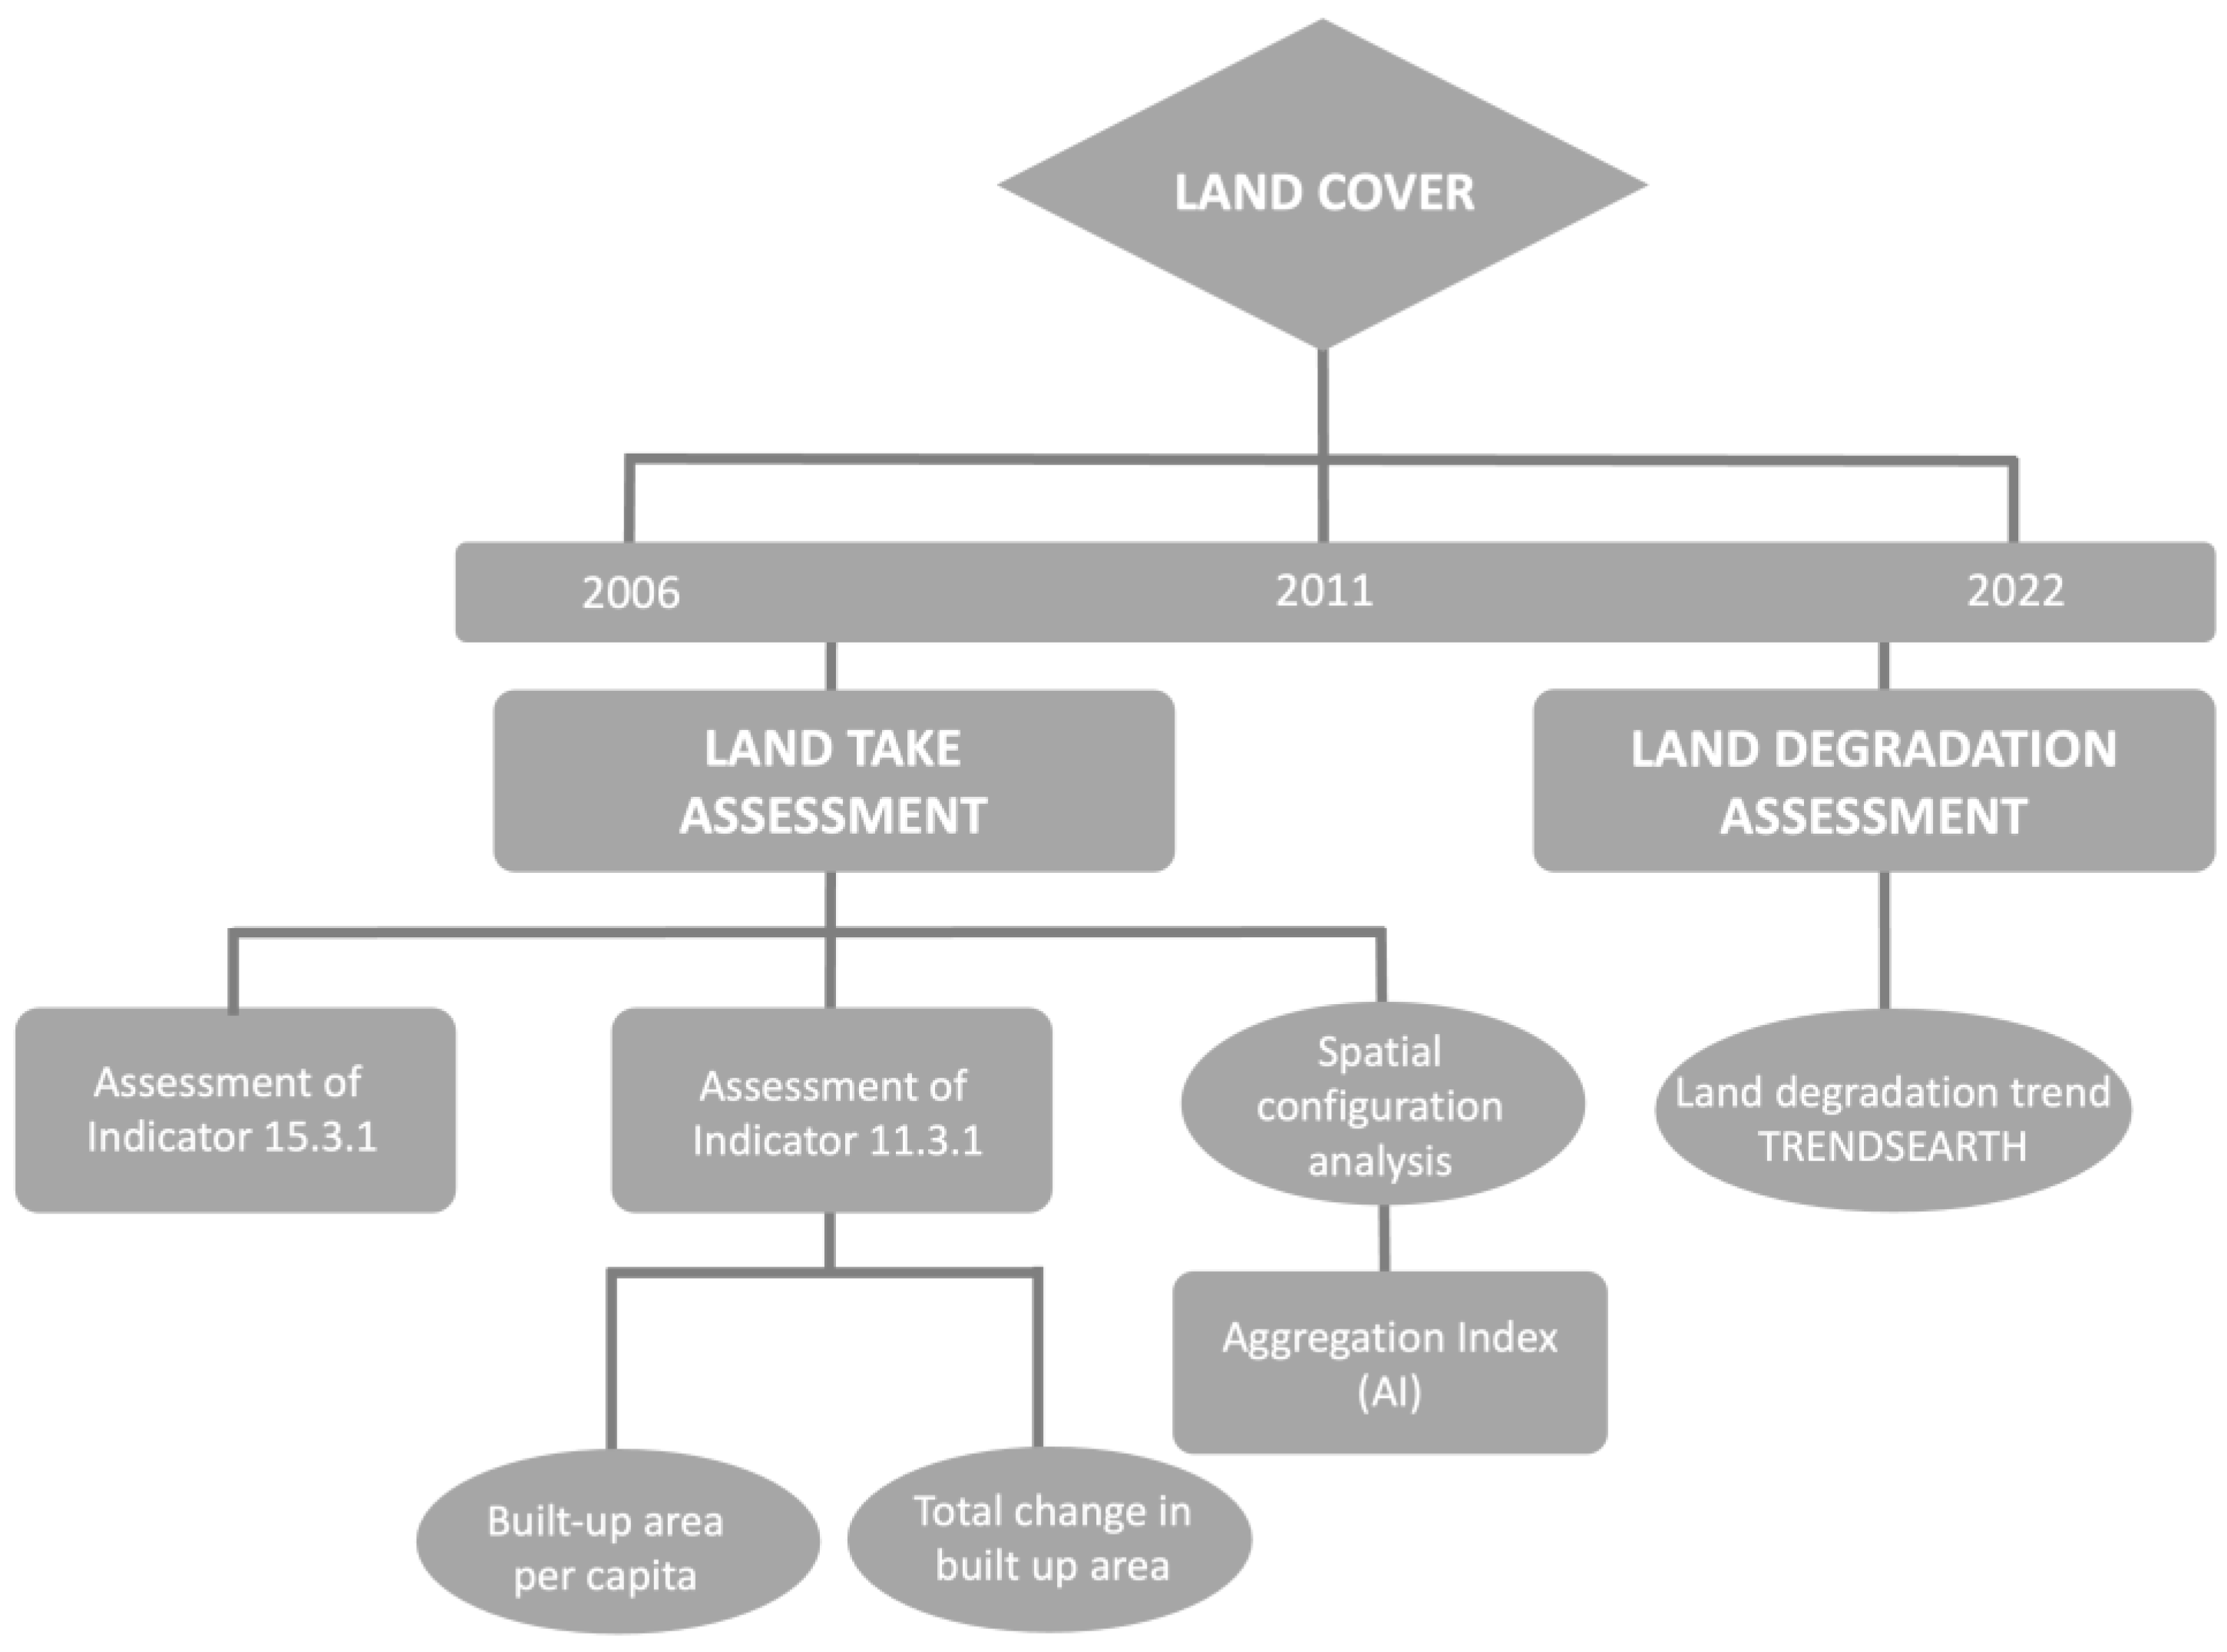
2.2. Methods
2.2.1. Land-Take Assessment
2.2.2. Land Degradation Assessment
3. Results
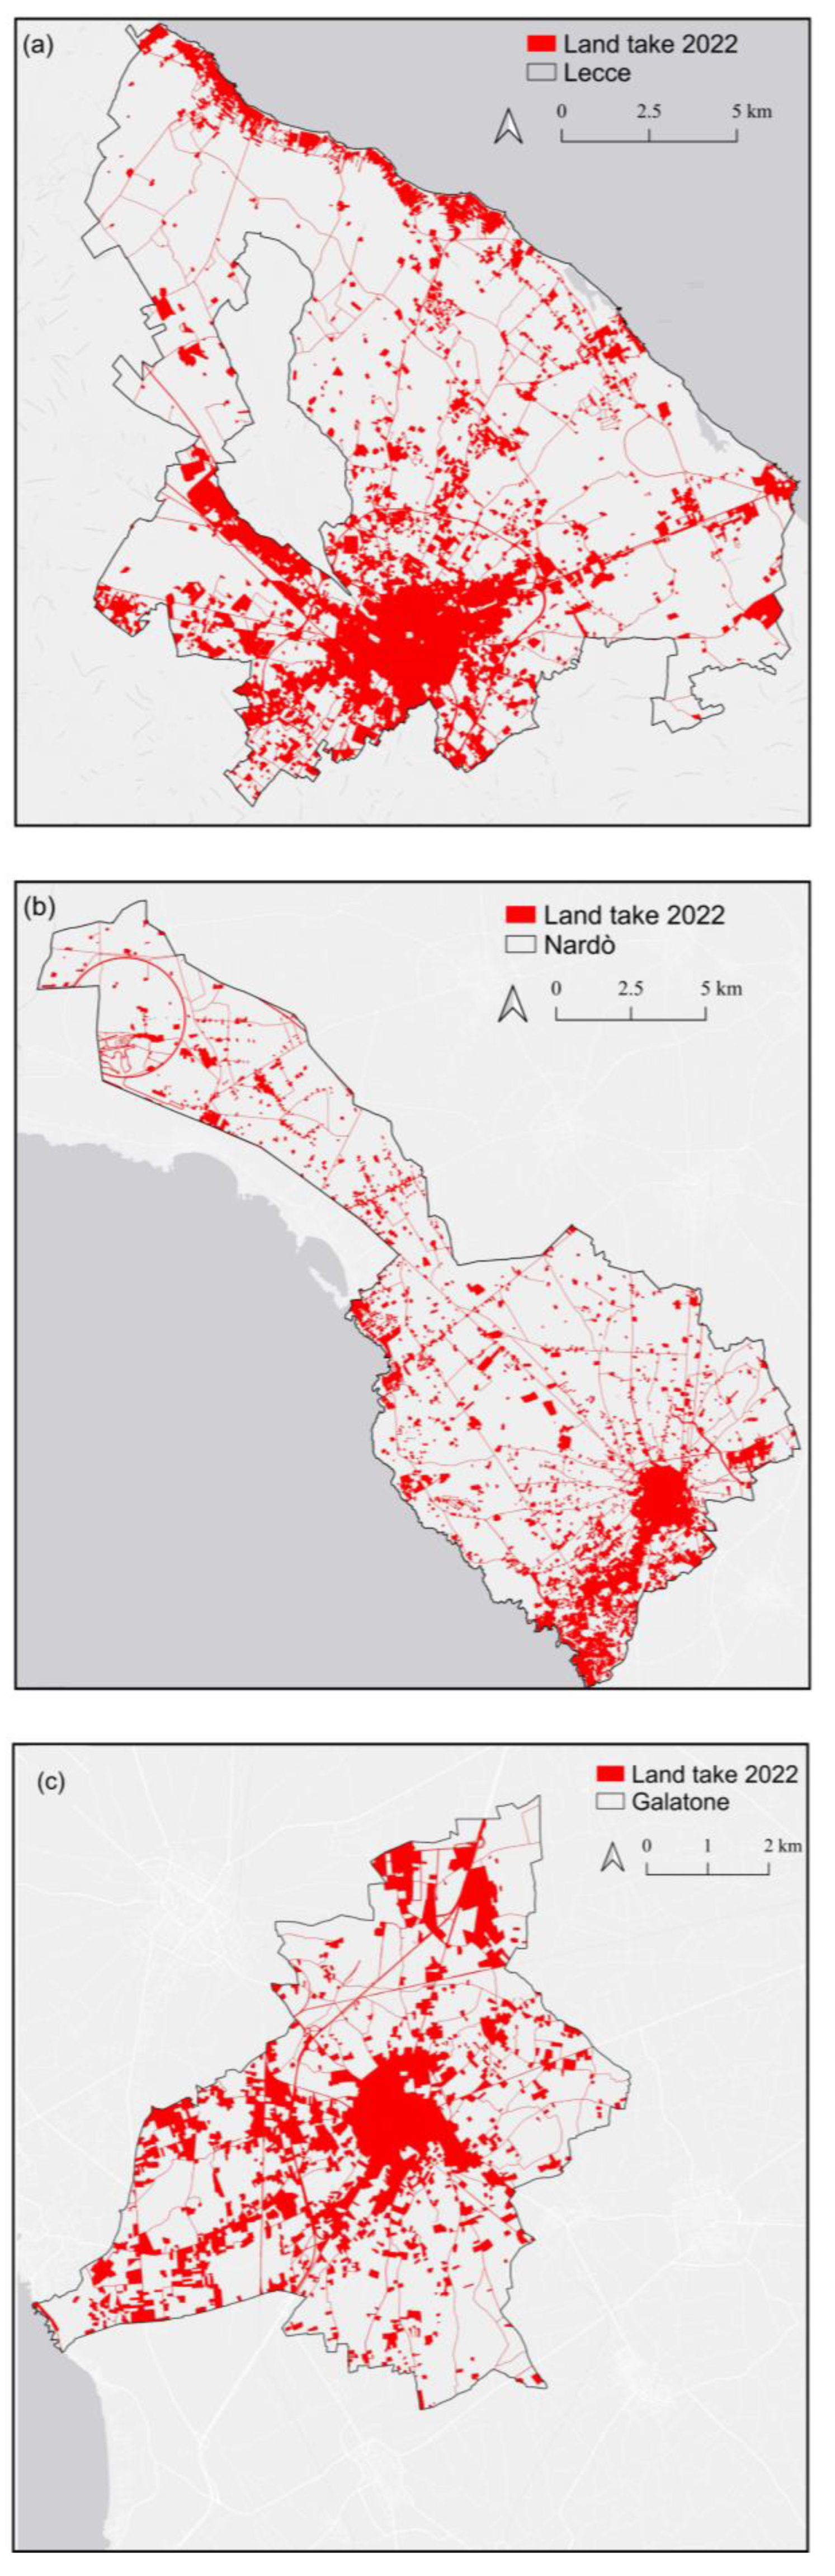
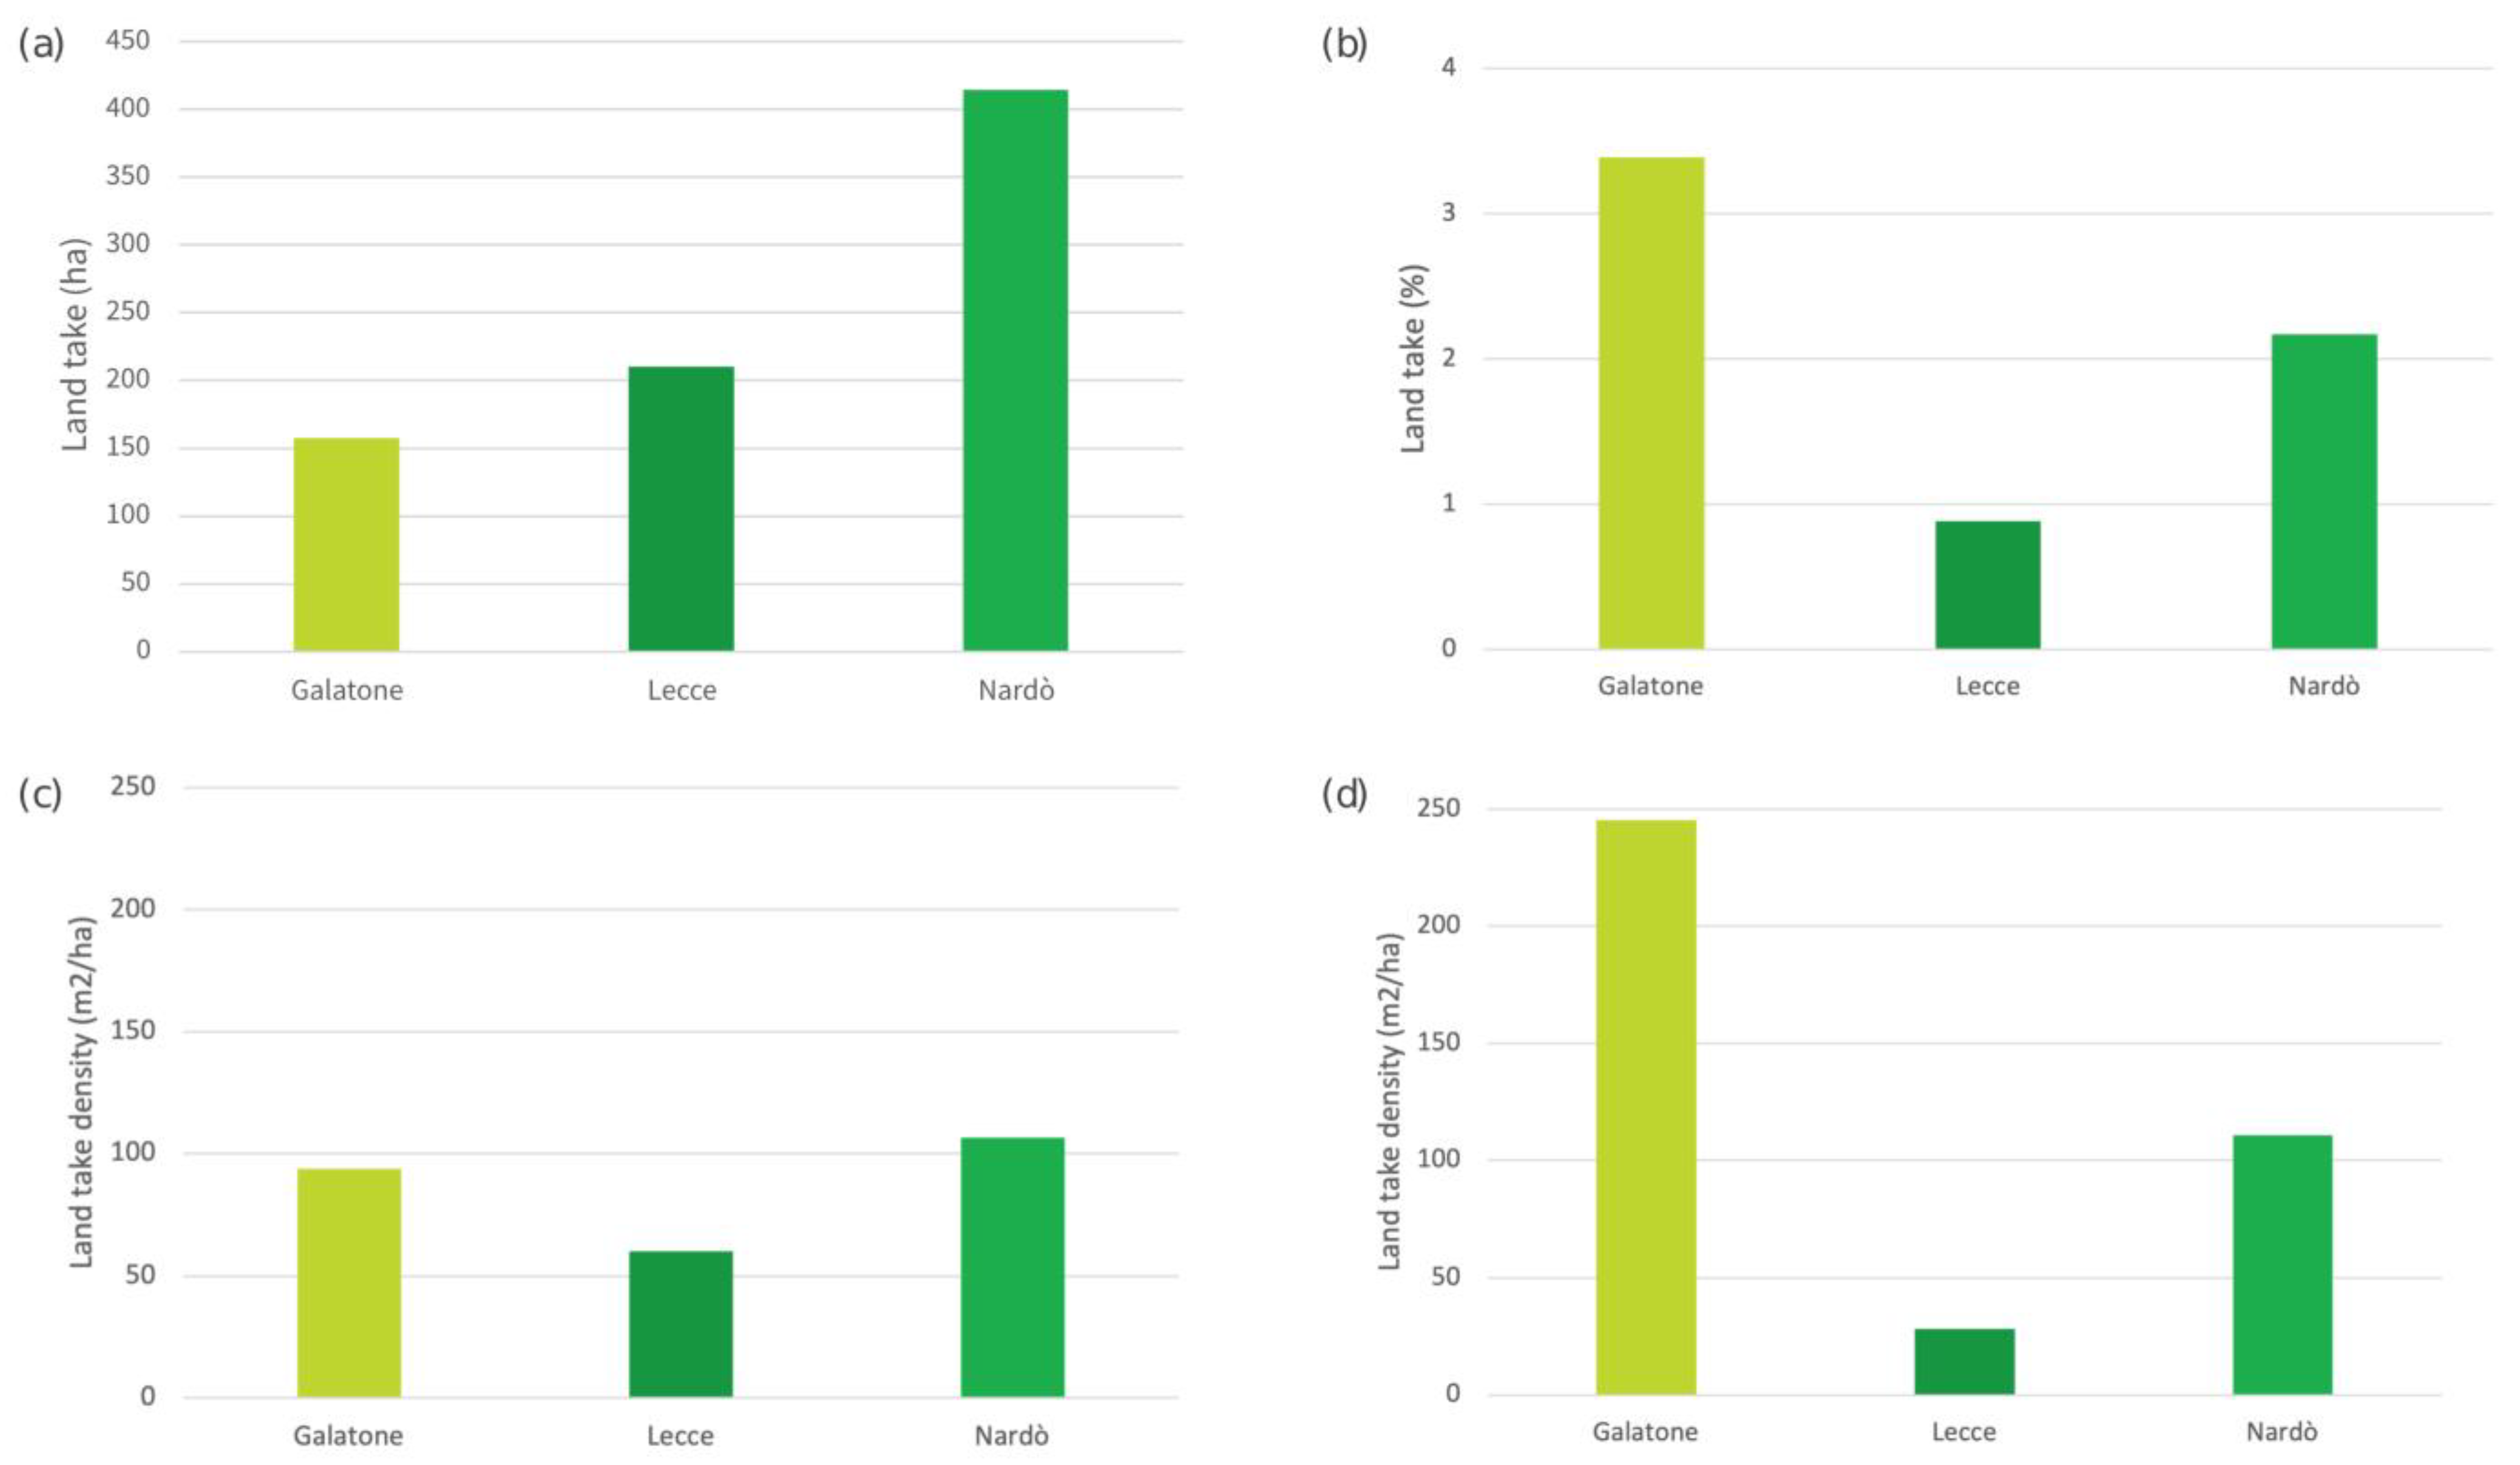
3.1. Assessment and Spatial Analysis of Land-Take
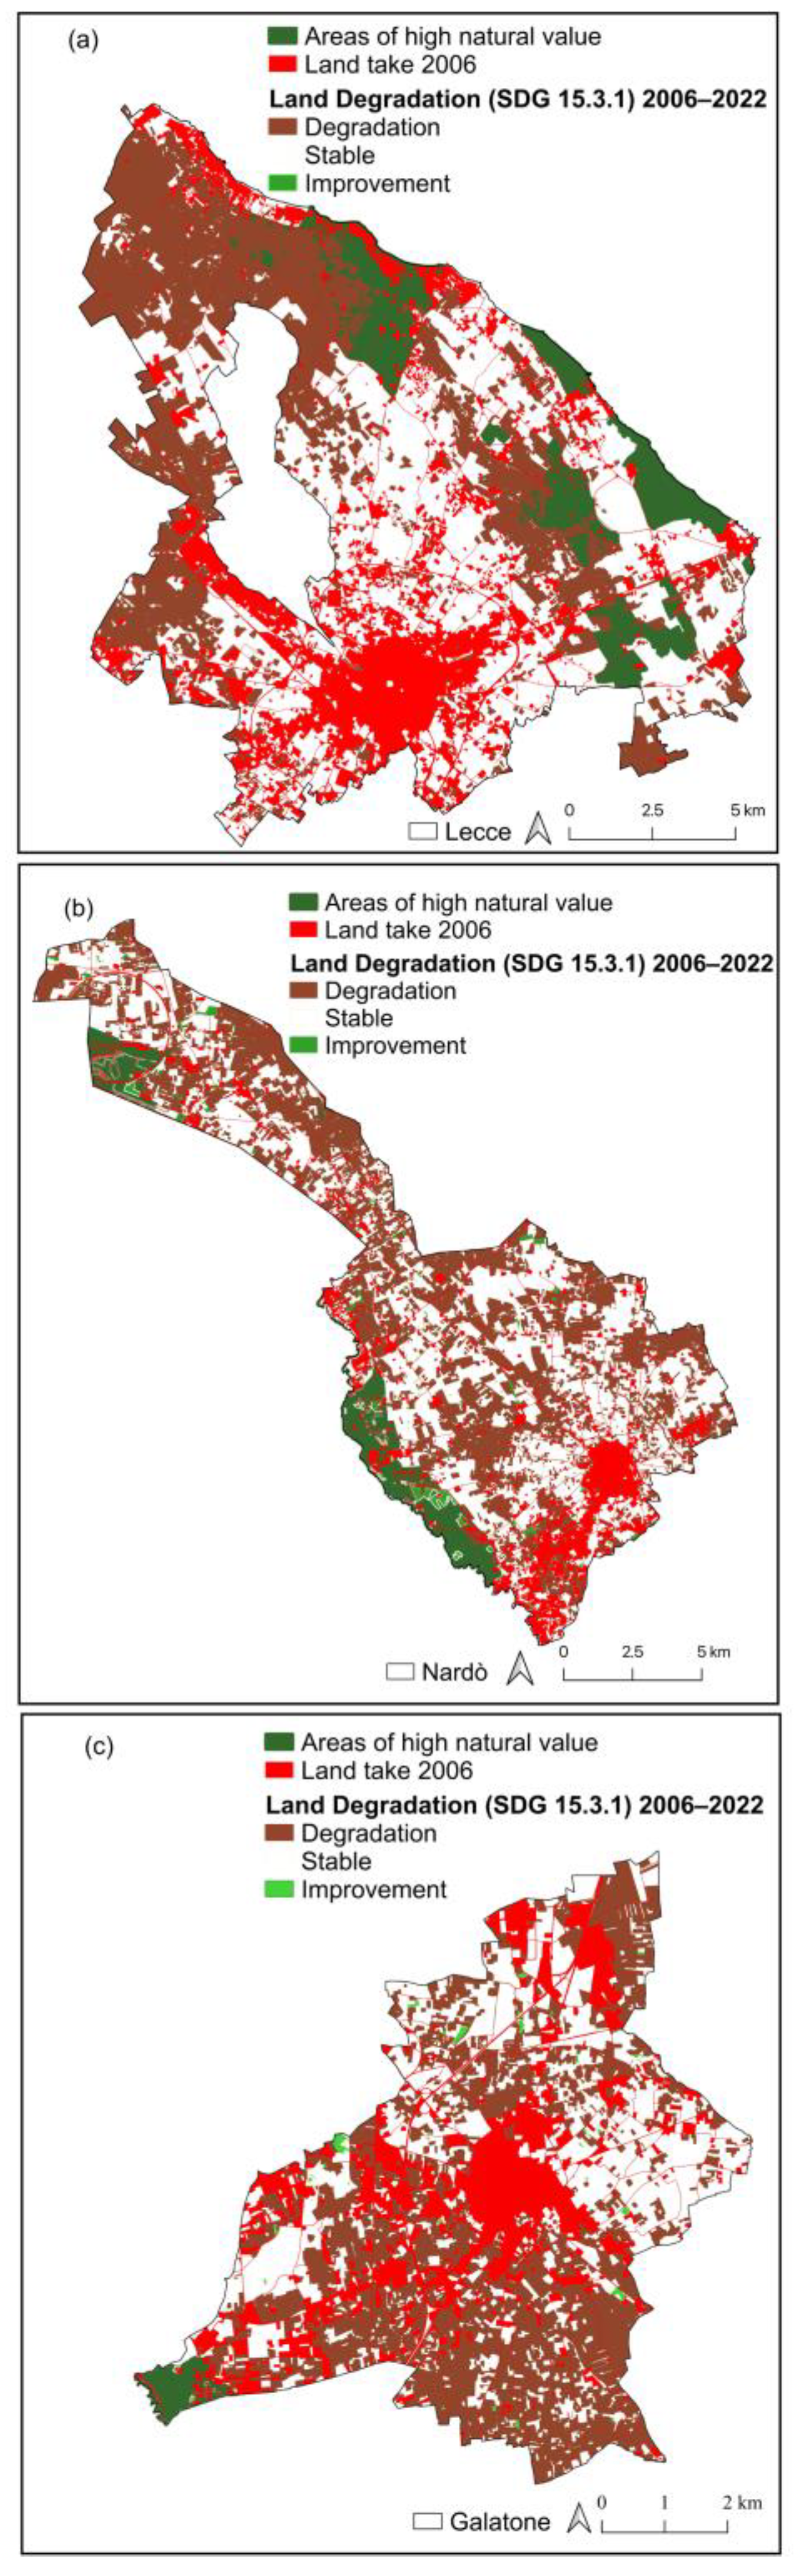
3.2. Assessment and Spatial Analysis of Land Degradation
3.3. Ecological Effects of Land-Take and Land Degradation on Areas of High Natural Value
4. Discussion
Possible Methodology Limitations and Implications for Sustainable Urban Planning
- (1)
- To avoid further land-take as far as possible.
- (2)
- When point (1) is not possible, to reuse already consumed land, by demolishing buildings or recovering the ecological functionality of lands.
- (3)
- When points (1) and (2) are not possible, then only land in poor condition (characterized by low ecological value) may be consumed.
- (4)
- In degraded areas, mitigation and compensation measures should be applied to minimize the loss of natural capital (e.g., urban green areas or rural agroforestry).
5. Conclusions
- −
- Where and how much to increase urban green space and urban tree cover, also considering the EU-level commitment of planting at least three billion additional trees by 2030;
- −
- How to restore natural landscape connectivity;
- −
- Where and how to recover land-covers that act in supporting some landscape processes, like pollination;
- −
- How to put into practice measures aimed at achieving a positive trend in biodiversity conservation in forest, agricultural, and urban landscapes.
Author Contributions
Funding
Institutional Review Board Statement
Informed Consent Statement
Data Availability Statement
Conflicts of Interest
References
- Richardson, B.F. Finance, Food, and Future Urban Zones: The Failure of Flexible Development in Auckland, New Zealand. Land Use Policy 2022, 119, 106203. [Google Scholar] [CrossRef]
- Elze, S.; Banzhaf, E. High-Precision Monitoring of Urban Structures to Understand Changes in Multiple Ecosystem Services. Urban Urban Green 2022, 73, 127616. [Google Scholar] [CrossRef]
- Pindral, S.; Kot, R.; Hulisz, P. The Influence of City Development on Urban Pedodiversity. Sci. Rep. 2022, 12, 6009. [Google Scholar] [CrossRef] [PubMed]
- Valencia Torres, A.; Tiwari, C.; Atkinson, S.F. Sustaining Human Nutrition in an Increasingly Urban World. Sustainability 2022, 14, 7607. [Google Scholar] [CrossRef]
- Medayese, S.; Magidimisha-Chipungu, H.H.; Chipungu, L. Spatial Matrices of Urban Expansion in Lafia, North-Central Nigeria. For. Geo. 2023, 37, 66–79. [Google Scholar] [CrossRef]
- Luo, Q.; Zhou, J.; Zhang, Y.; Yu, B.; Zhu, Z. What Is the Spatiotemporal Relationship between Urbanization and Ecosystem Services? A Case from 110 Cities in the Yangtze River Economic Belt, China. J. Environ. Manag. 2022, 321, 115709. [Google Scholar] [CrossRef]
- Patle, S.; Ghuge, V.V. Urban Fragmentation Approach for Assessing Thermal Environment Dynamics: A Case Study of Semi-Arid City from a Comfort Perspective. Urban Clim 2024, 53, 101784. [Google Scholar] [CrossRef]
- Nicolau, R.; David, J.; Caetano, M.; Pereira, J. Ratio of Land Consumption Rate to Population Growth Rate—Analysis of Different Formulations Applied to Mainland Portugal. ISPRS Int. J. Geo-Inf. 2018, 8, 10. [Google Scholar] [CrossRef]
- Salvati, L.; Tombolini, I.; Ippolito, A.; Carlucci, M. Land Quality and the City: Monitoring Urban Growth and Land Take in 76 Southern European Metropolitan Areas. Environ. Plan. B Urban Anal. City Sci. 2018, 45, 691–712. [Google Scholar] [CrossRef]
- European Environment Agency. Land Take and Land Degradation in Functional Urban Areas; European Environment Agency: Copenhagen, Denmark, 2022; p. 73. [Google Scholar] [CrossRef]
- European Commission. Directive of the European Parliament and of the Council on Soil Monitoring and Resilience (Soil Monitoring Law); European Commission: Brussels, Belgium, 2023. [Google Scholar]
- Hasan, S.S.; Zhen, L.; Miah, M.G.; Ahamed, T.; Samie, A. Impact of Land Use Change on Ecosystem Services: A Review. Environ. Dev. 2020, 34, 100527. [Google Scholar] [CrossRef]
- Termorshuizen, J.W.; Opdam, P. Landscape Services as a Bridge between Landscape Ecology and Sustainable Development. Landsc. Ecol. 2009, 24, 1037–1052. [Google Scholar] [CrossRef]
- Elliot, T.; Goldstein, B.; Gómez-Baggethun, E.; Proença, V.; Rugani, B. Ecosystem Service Deficits of European Cities. Sci. Total Environ. 2022, 837, 155875. [Google Scholar] [CrossRef] [PubMed]
- Lourdes, K.T.; Hamel, P.; Gibbins, C.N.; Sanusi, R.; Azhar, B.; Lechner, A.M. Planning for Green Infrastructure Using Multiple Urban Ecosystem Service Models and Multicriteria Analysis. Landsc. Urban Plan. 2022, 226, 104500. [Google Scholar] [CrossRef]
- Vallés-Planells, M.; Galiana, F.; Van Eetvelde, V. A Classification of Landscape Services to Support Local Landscape Planning. Ecol. Soc. 2014, 19, art44. [Google Scholar] [CrossRef]
- Sims, N.C.; Newnham, G.J.; England, J.R.; Guerschman, J.; Cox, S.J.D.; Roxburgh, S.H.; Viscarra Rossel, R.A.; Fritz, S.; Wheeler, I. Good Practice Guidance. SDG Indicator 15.3.1, Proportion of Land That Is Degraded Over Total Land Area. Version 2.0. 2021. Available online: https://www.unccd.int/sites/default/files/relevant-links/2021-03/Indicator_15.3.1_GPG_v2_29Mar_Advanced-version.pdf (accessed on 15 July 2024).
- Bobylev, N.; Syrbe, R.-U.; Wende, W. Geosystem Services in Urban Planning. Sustain. Cities Soc. 2022, 85, 104041. [Google Scholar] [CrossRef]
- Schatz, E.-M.; Bovet, J.; Lieder, S.; Schroeter-Schlaack, C.; Strunz, S.; Marquard, E. Land Take in Environmental Assessments: Recent Advances and Persisting Challenges in Selected EU Countries. Land Use Policy 2021, 111, 105730. [Google Scholar] [CrossRef]
- Luiza Petroni, M.; Siqueira-Gay, J.; Lucia Casteli Figueiredo Gallardo, A. Understanding Land Use Change Impacts on Ecosystem Services within Urban Protected Areas. Landsc. Urban Plan. 2022, 223, 104404. [Google Scholar] [CrossRef]
- Ellis, E.C.; Kaplan, J.O.; Fuller, D.Q.; Vavrus, S.; Klein Goldewijk, K.; Verburg, P.H. Used Planet: A Global History. Proc. Natl. Acad. Sci. USA 2013, 110, 7978–7985. [Google Scholar] [CrossRef]
- Fuchs, R.; Herold, M.; Verburg, P.H.; Clevers, J.G.P.W.; Eberle, J. Gross Changes in Reconstructions of Historic Land Cover/Use for Europe between 1900 and 2010. Glob. Change Biol. 2015, 21, 299–313. [Google Scholar] [CrossRef]
- Van Der Sluis, T.; Pedroli, B.; Kristensen, S.B.P.; Lavinia Cosor, G.; Pavlis, E. Changing Land Use Intensity in Europe—Recent Processes in Selected Case Studies. Land Use Policy 2016, 57, 777–785. [Google Scholar] [CrossRef]
- Levers, C.; Müller, D.; Erb, K.; Haberl, H.; Jepsen, M.R.; Metzger, M.J.; Meyfroidt, P.; Plieninger, T.; Plutzar, C.; Stürck, J.; et al. Archetypical Patterns and Trajectories of Land Systems in Europe. Reg. Environ. Change 2018, 18, 715–732. [Google Scholar] [CrossRef]
- Schulp, C.J.E.; Levers, C.; Kuemmerle, T.; Tieskens, K.F.; Verburg, P.H. Mapping and Modelling Past and Future Land Use Change in Europe’s Cultural Landscapes. Land Use Policy 2019, 80, 332–344. [Google Scholar] [CrossRef]
- García-Martín, M.; Quintas-Soriano, C.; Torralba, M.; Wolpert, F.; Plieninger, T. Landscape Change in Europe. In Sustainable Land Management in a European Context; Weith, T., Barkmann, T., Gaasch, N., Rogga, S., Strauß, C., Zscheischler, J., Eds.; Human-Environment Interactions; Springer International Publishing: Cham, Switzerland, 2021; Volume 8, pp. 17–37. ISBN 978-3-030-50840-1. [Google Scholar]
- Jaeger, J.A.G. Landscape Division, Splitting Index, and Effective Mesh Size: New Measures of Landscape Fragmentation. Landsc. Ecol. 2000, 15, 115–130. [Google Scholar] [CrossRef]
- Mitchell, M.G.E.; Bennett, E.M.; Gonzalez, A. Strong and Nonlinear Effects of Fragmentation on Ecosystem Service Provision at Multiple Scales. Environ. Res. Lett. 2015, 10, 094014. [Google Scholar] [CrossRef]
- McGarigal, K. FRAGSTATS Help; University of Massachusetts: Amherst, MA, USA, 2015. [Google Scholar]
- Ledda, A.; De Montis, A. Infrastructural Landscape Fragmentation versus Occlusion: A Sensitivity Analysis. Land Use Policy 2019, 83, 523–531. [Google Scholar] [CrossRef]
- Herbeck, L.S.; Krumme, U.; Andersen, T.J.; Jennerjahn, T.C. Decadal Trends in Mangrove and Pond Aquaculture Cover on Hainan (China) since 1966: Mangrove Loss, Fragmentation and Associated Biogeochemical Changes. Estuar. Coast. Shelf Sci. 2020, 233, 106531. [Google Scholar] [CrossRef]
- Newman, G.; Park, Y.; Bowman, A.O.M.; Lee, R.J. Vacant Urban Areas: Causes and Interconnected Factors. Cities 2018, 72, 421–429. [Google Scholar] [CrossRef]
- Yin, G.; Lin, Z.; Jiang, X.; Qiu, M.; Sun, J. How Do the Industrial Land Use Intensity and Dominant Industries Guide the Urban Land Use? Evidences from 19 Industrial Land Categories in Ten Cities of China. Sustain. Cities Soc. 2020, 53, 101978. [Google Scholar] [CrossRef]
- United Nations. Transforming Our World: The 2030 Agenda for Sustainable Development; United Nations: New York, NY, USA, 2015. [Google Scholar]
- European Commission. Communication from the Commission to the European Parliament, the Council, the European Economic and Social Committee and the Committee of the Regions EU—Biodiversity Strategy for 2030 Bringing Nature Back into Our Lives; European Commission: Brussels, Belgium, 2020. [Google Scholar]
- Mitincu, C.-G.; Ioja, I.-C.; Hossu, C.-A.; Artmann, M.; Nita, A.; Nita, M.-R. Licensing Sustainability Related Aspects in Strategic Environmental Assessment. Evidence from Romania’s Urban Areas. Land Use Policy 2021, 108, 105572. [Google Scholar] [CrossRef]
- Geneletti, D. Reasons and Options for Integrating Ecosystem Services in Strategic Environmental Assessment of Spatial Planning. Int. J. Biodivers. Sci. Ecosyst. Serv. Manag. 2011, 7, 143–149. [Google Scholar] [CrossRef]
- Carter, V.; Henríquez, C. Can Strategic Environmental Assessment (SEA) Contribute towards the Implementation of Biophilic Urbanism in Urban Planning? The Case of Chilean Municipal Regulatory Plans. Environ. Impact Assess. Rev. 2022, 95, 106765. [Google Scholar] [CrossRef]
- European Commission. Directive 2001/42/EC, of 27th June, on the Assessment of the Effects of Certain Plans and Programs on the Environment; European Commission: Brussels, Belgium, 2001. [Google Scholar]
- Tao, T.; Tan, Z.; He, X. Integrating Environment into Land-Use Planning through Strategic Environmental Assessment in China: Towards Legal Frameworks and Operational Procedures. Environ. Impact Assess. Rev. 2007, 27, 243–265. [Google Scholar] [CrossRef]
- Gutierrez, M.; Bekessy, S.A.; Gordon, A. Biodiversity and Ecosystem Services in Strategic Environmental Assessment: An Evaluation of Six Australian Cases. Environ. Impact Assess. Rev. 2021, 87, 106552. [Google Scholar] [CrossRef]
- González, A.; Gilmer, A.; Foley, R.; Sweeney, J.; Fry, J. Applying Geographic Information Systems to Support Strategic Environmental Assessment: Opportunities and Limitations in the Context of Irish Land-Use Plans. Environ. Impact Assess. Rev. 2011, 31, 368–381. [Google Scholar] [CrossRef]
- He, J.; Bao, C.-K.; Shu, T.-F.; Yun, X.-X.; Jiang, D.; Brown, L. Framework for Integration of Urban Planning, Strategic Environmental Assessment and Ecological Planning for Urban Sustainability within the Context of China. Environ. Impact Assess. Rev. 2011, 31, 549–560. [Google Scholar] [CrossRef]
- Turner, K.G.; Anderson, S.; Gonzales-Chang, M.; Costanza, R.; Courville, S.; Dalgaard, T.; Dominati, E.; Kubiszewski, I.; Ogilvy, S.; Porfirio, L.; et al. A Review of Methods, Data, and Models to Assess Changes in the Value of Ecosystem Services from Land Degradation and Restoration. Ecol. Model. 2016, 319, 190–207. [Google Scholar] [CrossRef]
- Abera, W.; Tamene, L.; Kassawmar, T.; Mulatu, K.; Kassa, H.; Verchot, L.; Quintero, M. Impacts of Land Use and Land Cover Dynamics on Ecosystem Services in the Yayo Coffee Forest Biosphere Reserve, Southwestern Ethiopia. Ecosyst. Serv. 2021, 50, 101338. [Google Scholar] [CrossRef]
- Peng, K.; Jiang, W.; Ling, Z.; Hou, P.; Deng, Y. Evaluating the Potential Impacts of Land Use Changes on Ecosystem Service Value under Multiple Scenarios in Support of SDG Reporting: A Case Study of the Wuhan Urban Agglomeration. J. Clean. Prod. 2021, 307, 127321. [Google Scholar] [CrossRef]
- Raviv, O.; Zemah-Shamir, S.; Izhaki, I.; Lotan, A. The Effect of Wildfire and Land-Cover Changes on the Economic Value of Ecosystem Services in Mount Carmel Biosphere Reserve, Israel. Ecosyst. Serv. 2021, 49, 101291. [Google Scholar] [CrossRef]
- Heinze, A.; Bongers, F.; Ramírez Marcial, N.; García Barrios, L.E.; Kuyper, T.W. Farm Diversity and Fine Scales Matter in the Assessment of Ecosystem Services and Land Use Scenarios. Agric. Syst. 2022, 196, 103329. [Google Scholar] [CrossRef]
- Haaland, C.; Van Den Bosch, C.K. Challenges and Strategies for Urban Green-Space Planning in Cities Undergoing Densification: A Review. Urban Urban Green 2015, 14, 760–771. [Google Scholar] [CrossRef]
- Haase, D.; Kabisch, S.; Haase, A.; Andersson, E.; Banzhaf, E.; Baró, F.; Brenck, M.; Fischer, L.K.; Frantzeskaki, N.; Kabisch, N.; et al. Greening Cities—To Be Socially Inclusive? About the Alleged Paradox of Society and Ecology in Cities. Habitat Int. 2017, 64, 41–48. [Google Scholar] [CrossRef]
- Hu, J.; Wang, Y.; Taubenböck, H.; Zhu, X.X. Land Consumption in Cities: A Comparative Study across the Globe. Cities 2021, 113, 103163. [Google Scholar] [CrossRef]
- Joorabian Shooshtari, S.; Silva, T.; Raheli Namin, B.; Shayesteh, K. Land Use and Cover Change Assessment and Dynamic Spatial Modeling in the Ghara-Su Basin, Northeastern Iran. J. Indian Soc. Remote Sens. 2020, 48, 81–95. [Google Scholar] [CrossRef]
- Mansour, S.; Al-Belushi, M.; Al-Awadhi, T. Monitoring Land Use and Land Cover Changes in the Mountainous Cities of Oman Using GIS and CA-Markov Modelling Techniques. Land Use Policy 2020, 91, 104414. [Google Scholar] [CrossRef]
- Upreti, M.; Kumar, A. Landscape Modeling for Urban Growth Characterization and Its Impact on Ecological Infrastructure in Delhi-NCR: An Approach to Achieve SDGs. Phys. Chem. Earth 2023, 131, 103444. [Google Scholar] [CrossRef]
- Baude, M.; Meyer, B.C. Changes in Landscape Structure and Ecosystem Services since 1850 Analyzed Using Landscape Metrics in Two German Municipalities. Ecol. Indic. 2023, 152, 110365. [Google Scholar] [CrossRef]
- McGarigal, K.; Cushman, S.; Ene, E. FRAGSTATS v4: Spatial Pattern Analysis Program for Categorical Maps; University of Massachusetts: Amherst, MA, USA, 2023. [Google Scholar]
- UN-Habitat (United Nations Human Settlements Programme). DG Indicator Metadata (Harmonized Metadata Template—Format Version 1.1). 2021. Available online: https://unstats.un.org/sdgs/metadata/files/Metadata-11-03-02.pdf (accessed on 15 July 2024).
- Cui, P.; Xv, D.; Tang, J.; Lu, J.; Wu, Y. Assessing the Effects of Urban Green Spaces Metrics and Spatial Structure on LST and Carbon Sinks in Harbin, a Cold Region City in China. Sustain. Cities Soc. 2024, 113, 105659. [Google Scholar] [CrossRef]
- Feng, F.; Wang, L.; Hou, W.; Yang, R.; Zhang, S.; Zhao, W. Analyzing the Dynamic Changes and Causes of Greenspace Landscape Patterns in Beijing Plains. Ecol. Indic. 2024, 158, 111556. [Google Scholar] [CrossRef]
- Wu, C.; Gao, P.; Xu, R.; Mu, X.; Sun, W. Influence of Landscape Pattern Changes on Water Conservation Capacity: A Case Study in an Arid/Semiarid Region of China. Ecol. Indic. 2024, 163, 112082. [Google Scholar] [CrossRef]
- Yin, C.; Zhao, W.; Pereira, P. Ecosystem Restoration along the “Pattern-Process-Service-Sustainability” Path for Achieving Land Degradation Neutrality. Landsc. Urban Plan. 2025, 253, 105227. [Google Scholar] [CrossRef]
- Valente, D.; Lovello, E.M.; Giannuzzi, C.G.; Scardia Scardia, A.M.; Marinelli, M.V.; Petrosillo, I. Towards Land Consumption Neutrality and Natural Capital Enhancement at Urban Landscape Scale. Land 2023, 12, 777. [Google Scholar] [CrossRef]
- Munafò, M. Consumo Di Suolo, Dinamiche Territoriali e Servizi Ecosistemici; Report di Sistema; SNPA: Rome, Italy, 2023. [Google Scholar]
- Valente, D.; Lovello, E.M.; Chirizzi, R.; Petrosillo, I. Multiscale Effects of Xylella Fastidiosa on Landscape Services. Land 2024, 13, 2087. [Google Scholar] [CrossRef]
- Csomós, G.; Szalai, Á.; Farkas, J.Z. A Sacrifice for the Greater Good? On the Main Drivers of Excessive Land Take and Land Use Change in Hungary. Land Use Policy 2024, 147, 107352. [Google Scholar] [CrossRef]
- Beele, E.; Aerts, R.; Reyniers, M.; Somers, B. Spatial Configuration of Green Space Matters: Associations between Urban Land Cover and Air Temperature. Landsc. Urban Plan. 2024, 249, 105121. [Google Scholar] [CrossRef]
- Antonio Chaparro Torres, R.; Wang, J.; Zhang, J.; Liu, L.; Lan, Y. Temporal Analysis of Land Degradation and Urban Expansion in Central Yunnan Province Using Remote Sensing for Supporting Sustainable Development Goals 11/15. Ecol. Indic. 2024, 163, 112058. [Google Scholar] [CrossRef]


| Municipality | Area (ha) | Inhabitants (N) | Implementation Phase of the General Urban Plan (GUP) |
|---|---|---|---|
| Lecce | 23,776.37 | 93,484 | GUP in the design phase |
| Nardò | 19,067.55 | 30,747 | GUP in the design phase |
| Galatone | 4654.73 | 15,145 | GUP adopted and implemented |
| CORINE Land-Cover Classes Used to Quantify Land-Take | |
|---|---|
| CORINE code | CORINE class name |
| 1.1.1 | Continuous urban fabrics |
| 1.1.2 | Discontinuous urban fabric |
| 1.2.1 | Industrial or commercial units |
| 1.2.2 | Road and rail networks and associated land |
| 1.2.3 | Port areas |
| 1.2.4 | Airports |
| 1.3.1 | Mineral extraction sites |
| 1.3.2 | Dump sites |
| 1.3.3 | Construction sites |
| 1.4.2 | Sport and leisure facilities |
| Municipality | Land-Take 2006 (ha) | Land-Take 2006 (%) | Land-Take 2011 (ha) | Land-Take 2011 (%) | Land-Take 2022 (ha) | Land-Take 2022 (%) | Land-Take 2006–2022 (%) |
|---|---|---|---|---|---|---|---|
| Lecce | 4666.51 | 19.63 | 4809.79 | 20.23 | 4876.72 | 20.51 | 0.88 |
| Nardò | 2232.29 | 11.71 | 2435.33 | 12.77 | 2646.42 | 13.88 | 2.17 |
| Galatone | 1042.14 | 22.39 | 1085.71 | 23.32 | 1199.92 | 25.78 | 3.39 |
| Indicator 11.3.1 | Secondary Indicators | ||||
|---|---|---|---|---|---|
| Municipality | LCRPGR | Built-Up Area Per Capita (m2/Inhabitant) | Total Change in Built-Up Area (%) | ||
| 2006–2022 | 2006 | 2011 | 2022 | 2006–2022 | |
| Lecce | 1.13 | 519.41 | 506.54 | 521.66 | 4.50 |
| Nardò | −12.88 | 715.64 | 757.11 | 860.71 | 18.55 |
| Galatone | −3.09 | 655.18 | 685.55 | 792.29 | 15.14 |
| AI | |||
|---|---|---|---|
| Years | Lecce | Nardò | Galatone |
| 2006 | 92.04 | 88.28 | 90.52 |
| 2011 | 92.20 | 88.58 | 90.86 |
| 2022 | 92.27 | 88.34 | 90.38 |
| Indicator 15.3.1 | ||||||
|---|---|---|---|---|---|---|
| Area in Degradation (ha) | Area in Degradation (%) | Stable Area (ha) | Stable Area (%) | Area in Improvement (ha) | Area in Improvement (%) | |
| Lecce | 11,267.12 | 47.39 | 12,486.09 | 52.51 | 23.17 | 0.10 |
| Nardò | 7981.74 | 41.86 | 10,342.82 | 54.23 | 743.00 | 3.90 |
| Galatone | 2809.88 | 60.37 | 1756.85 | 37.73 | 88.00 | 1.89 |
| High Natural Value Areas (ha) | Land Degradation in High Natural Value Areas (ha) | Land Degradation in High Natural Value Areas (%) | |
|---|---|---|---|
| Lecce | 3649.51 | 912.91 | 25.01 |
| Nardò | 2179.41 | 218.47 | 10.02 |
| Galatone | 85.85 | 19.72 | 22.97 |
| Land-Take in 2006 (in ha) | Land-Take in 2022 (in ha) | Land-Take 2006–2022 (in ha) | Land in Degradation 2006–2022 (in ha) | Stable Lands 2006–2022 (in ha) | Land in Improvement 2006–2022 (in ha) | |
|---|---|---|---|---|---|---|
| Lecce | 4666.51 | 4809.79 | 143.28 | 11,267.12 | 12,486.09 | 23.17 |
| Nardò | 2232.29 | 2435.33 | 203.04 | 7981.74 | 10,342.82 | 743.00 |
| Galatone | 1042.14 | 1085.71 | 43.57 | 2809.88 | 1756.85 | 88.00 |
Disclaimer/Publisher’s Note: The statements, opinions and data contained in all publications are solely those of the individual author(s) and contributor(s) and not of MDPI and/or the editor(s). MDPI and/or the editor(s) disclaim responsibility for any injury to people or property resulting from any ideas, methods, instructions or products referred to in the content. |
© 2025 by the authors. Licensee MDPI, Basel, Switzerland. This article is an open access article distributed under the terms and conditions of the Creative Commons Attribution (CC BY) license (https://creativecommons.org/licenses/by/4.0/).
Share and Cite
Lovello, E.M.; Valente, D.; Petrosillo, I. Mitigating Land Degradation Through Sustainable Urban Landscapes Planning. Sustainability 2025, 17, 967. https://doi.org/10.3390/su17030967
Lovello EM, Valente D, Petrosillo I. Mitigating Land Degradation Through Sustainable Urban Landscapes Planning. Sustainability. 2025; 17(3):967. https://doi.org/10.3390/su17030967
Chicago/Turabian StyleLovello, Erica Maria, Donatella Valente, and Irene Petrosillo. 2025. "Mitigating Land Degradation Through Sustainable Urban Landscapes Planning" Sustainability 17, no. 3: 967. https://doi.org/10.3390/su17030967
APA StyleLovello, E. M., Valente, D., & Petrosillo, I. (2025). Mitigating Land Degradation Through Sustainable Urban Landscapes Planning. Sustainability, 17(3), 967. https://doi.org/10.3390/su17030967