1. Introduction
Marine aquaculture, as an important part of modern fishery [
1,
2,
3,
4], plays an important role in ensuring food security [
5,
6,
7,
8], promoting economic development, and maintaining ecological balance [
9,
10,
11,
12]. Weihai City, located on the eastern coast of China, has a long coastline and rich marine resources, making it one of the important production bases for marine aquaculture in China. As a critical project in constructing the Shandong Peninsula Blue Special Economic Zone, mariculture has been an essential pillar of the blue economy in Weihai City. As of 2021, its mariculture output was 1.954 million tons, and it has long been ranked first in prefecture-level cities in China. The high-quality development of marine aquaculture has become the highlight in promoting maritime city construction projects. The “Weihai City Mariculture Waters and Beaches Planning” scientifically and reasonably lays out the exploitable sea space, clarifies the primary mariculture mode and density of the mariculture waters, sets the mariculture capacity, implements the concept of green mariculture development, and creates “a core leading, two wings extension, multi-park support” of the fishery industry. This spatial layout is supported by the implementation of the concept of green mariculture development and the creation of multi-park support [
13,
14,
15,
16,
17]. Innovative mariculture development models have also been adopted [
18,
19,
20].
In recent years, with the continuous expansion of the industrial project, the marine aquaculture industry in Weihai City has been facing problems of resource waste, environmental pollution, and ecological degradation while promoting the development of the local economy. How to increase the production of seawater aquaculture while improving ecological efficiency has become an important issue to be solved urgently for the sustainable development of marine aquaculture in Weihai City [
21,
22,
23].
As a key index to measure the coordination between production efficiency and the ecological environment, ecological efficiency is an important tool for evaluating industrial sustainability [
24,
25,
26]. The analysis of ecological efficiency can effectively reveal the relationship between resource utilization efficiency and environmental load in the production process [
27] and provide data support and a theoretical basis for formulating scientific and reasonable industrial policies. However, most of the literature focuses on traditional fisheries or a single economic benefit assessment, while the systematic analysis of the ecological efficiency of mariculture, especially the development trend prediction at the regional level, is still insufficient [
28].
Based on this, this study used a three-stage DEA model as an unexpected output model to comprehensively evaluate the ecological efficiency of Weihai City’s mariculture industry, used kernel density estimation to analyze the temporal dynamic evolution characteristics of the ecological efficiency of the Weihai mariculture industry, and combined with the gray prediction model GM (1, 1) to predict its future development trend. This study aims to explore the coordination mechanism between resource utilization and environmental protection of the marine aquaculture industry in Weihai City and to provide a theoretical basis and practical guidance for improving the ecological efficiency of the regional marine aquaculture industry and promoting the sustainable development of fisheries.
2. Materials and Methods
2.1. Model Settings: Unexpected Output Three-Stage Super SBM Model
2.1.1. Phase 1 Calculation
Using the unexpected output super efficiency SBM model, calculate the initial value of the ecological efficiency of marine aquaculture in Weihai City and the slack variables of its various indicators. Each year is treated as an independent decision unit DUM
, and each decision unit has
inputs
,
expected output
, and
unexpected outputs
. Set
,
, and
, where
are slack variables for input, expected output, and unexpected output, respectively. During the period
, the specific formula for constructing the model is as follows:
In Equation (1): Under the condition of constant return to scale (CRS), represents the ecological efficiency of marine aquaculture in the -th city of Weihai in year ; respectively represent the optimal solutions of input, expected output, and unexpected output variables for each decision unit; is a weight vector.
2.1.2. Phase 2: SFA Regression
Given that the initial efficiency value obtained in the first stage is often affected by environmental variables, management level, and random errors, which may not reflect its true efficiency, we introduce the Stochastic Frontier Model (SFA) to measure the redundant inputs and environmental variables in each city and adjust the original inputs accordingly to restore the true efficiency value. The model is set as follows:
In Equation (2): is the slack of the -th input indicator in the -th region; is an environment variable; is the parameter to be estimated for the environmental variable; The mixed error term is denoted by , and the statistical noise is . represents the role of managing the inefficiency term in the efficiency measurement process, with ~. and are independent of each other.
After using maximum likelihood estimation to estimate unknown parameters, adjust the original input as follows:
In Equation (3): represents the adjusted input variable; is the original input variable. After the above treatment, the ecological development of the marine aquaculture industry in Weihai City is now in the same external environment.
To eliminate the influence of random factors, the management inefficiency and random factor items are decomposed as follows:
In Equation (4): is the joint error term; ; ; ; and are the density function and distribution function of the standard normal distribution, respectively.
2.1.3. Phase 3 Calculation
Replace the original input with the adjusted input from the second stage and then use the global super efficiency SBM model with unexpected output to calculate the ecological efficiency of the marine aquaculture industry in order to reflect its true value as much as possible.
2.1.4. Kernel Density Estimation
Kernel density estimation is a commonly used non-parametric method for analyzing spatial non-equilibrium and dynamic evolution patterns. It is characterized by weak model dependence and strong robustness. Assuming the density function of the random variable
X is:
In this context,
N represents the number of observations,
Xi denotes independent and identically distributed observations,
x represents the mean,
K(·) represents the kernel density function, and
h denotes the bandwidth. A larger
h value results in a broader bandwidth, yielding a smoother estimated density function but lower estimation accuracy. Conversely, a smaller
h value increases the accuracy of the estimation. Kernel density functions generally satisfy the following conditions:
This study employs the Gaussian kernel density function for estimation, with the expression of its density function given as follows:
2.2. Data Sources
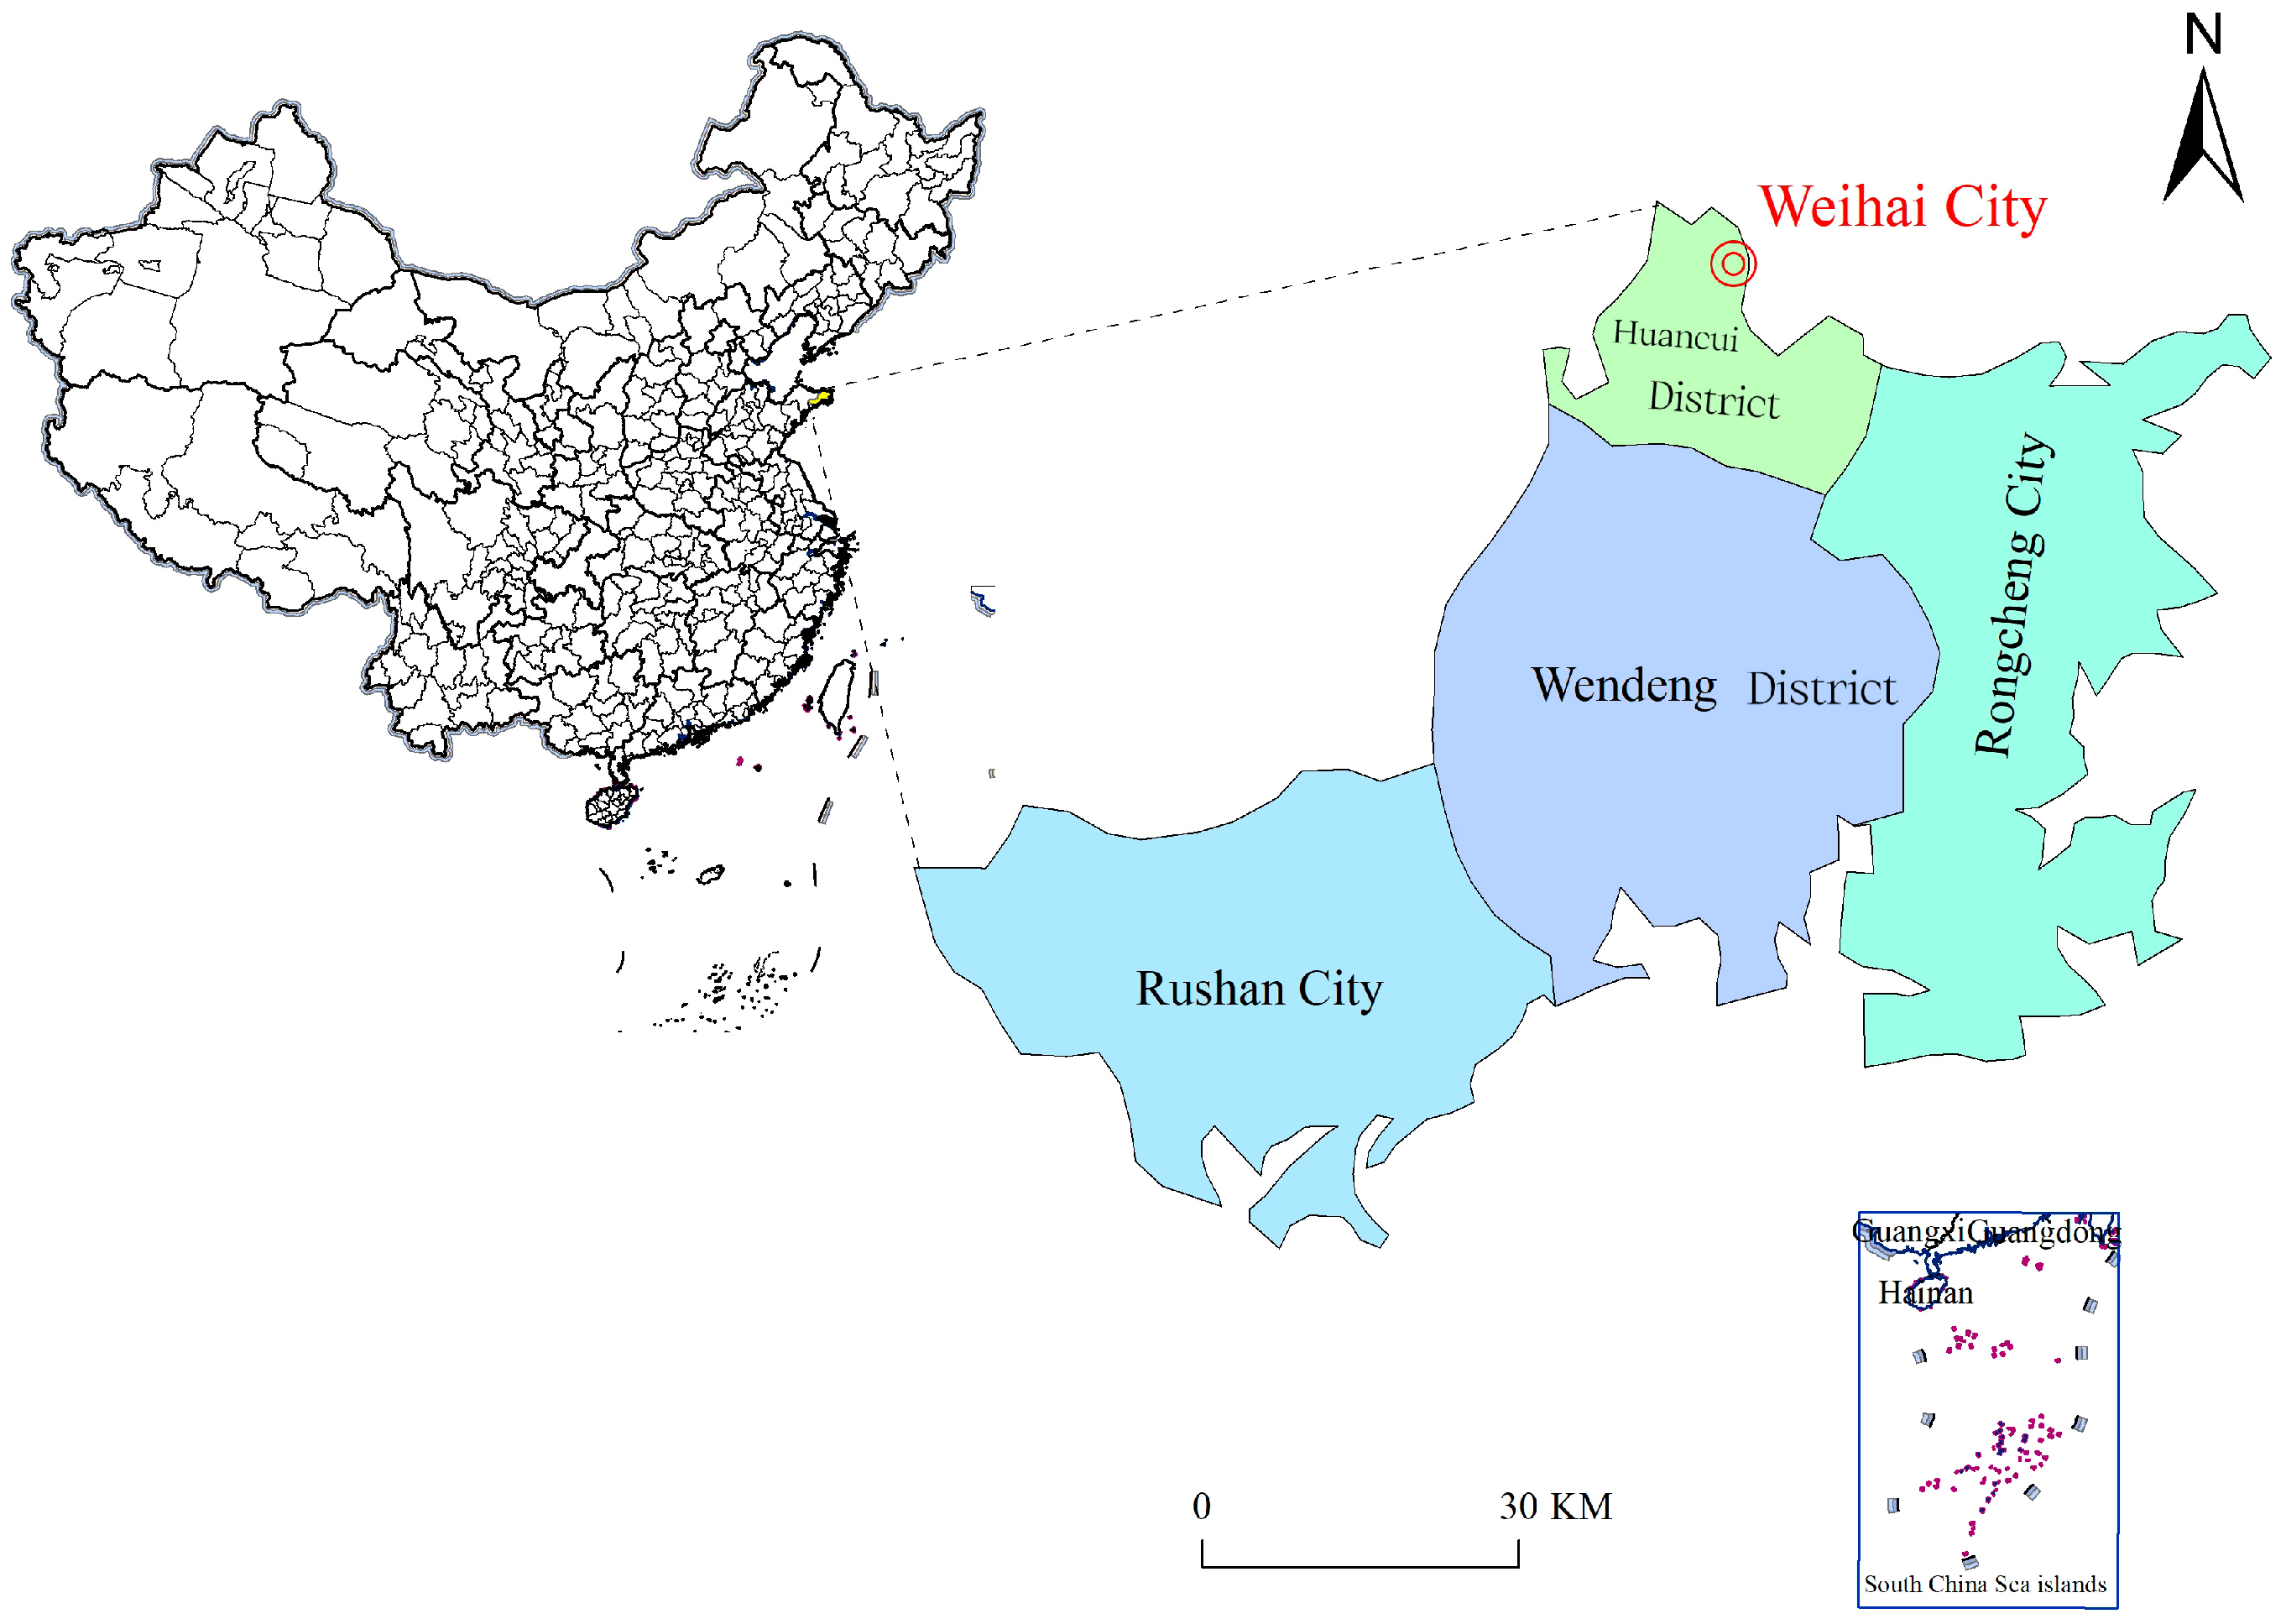
The city of Weihai was selected as the study area. Weihai is a traditional fishing city in the north of China, between 36°41′–37°35′ N latitude and 121°11′–122° 42′ E longitude, located at the easternmost tip of the Shandong Peninsula, adjacent to substantial fishing grounds in the Bohai and Yellow seas. Weihai City consists of 2 districts and 2 county-level cities. Weihai Municipality has jurisdiction over Huancui District, Wendeng District, Rongcheng City, and Rushan City (as shown in
Figure 1). The city relies on superior natural resource conditions, abundant fishery resources, and a sufficient supply of fishery products. Weihai has rich marine biological resources, with over 70 economically essential marine organisms in the offshore waters and 25 species of economically critical mariculture organisms [
29,
30]. Among them, the production of seaweed accounts for approximately 50% of the country, followed by the production of oysters, abalone, sea cucumbers, and other categories that are also among the top in the country, with favorable geographical location conditions, a vast shoreline and sea space, relatively rich marine resources, and a deep foundation of marine science and technology that are favorable for the development of fisheries in Weihai City, which has the relative advantage of being ahead of other coastal provinces and cities. However, the city is simultaneously aware of the difficulties and challenges faced, including the decline of marine resources, deterioration of the offshore environment, lack of transformation of marine science and technology, and the traditional navigational management system, which are serious constraints on its development into a strong fisheries city. Its geographical location determines the importance of the development of the maricultural industry [
31,
32,
33,
34].
2.3. Variables Description
Based on the literature collection of the keywords “mariculture” and “production efficiency”, many researchers have analyzed the indicators. On the basis of previous studies, this paper analyzes the input and output indicators in the existing studies.
It can be summarized and sorted out, as shown in
Table 1.
The above researchers’ analysis and exploration on the ecological efficiency of mariculture are representative to a certain extent and can be referred to later scholars. It was found that the most selected input indexes were seedling, food input, the number of breeding personnel, mariculture area, and the cost of marine environment management. The most selected output indicators are the total output of fishery aquaculture and water quality. Considering the relevance, accessibility, and scientific city of the indicators, this paper selected the mariculture area, the number of fishery employees, the cost of marine environmental pollutants control, and the input of fish fry and bait as the input indicators, and the total output of fish and crustaceans aquaculture and the proportion of grade I and II water quality as the output indicators. As shown in
Table 2.
2.3.1. Output Indicators
Many maricultural species are found in Weihai, including fish, algae, crustaceans, and snails. Therefore, in this study, the total outputs of fish farming and crustacean farming, the most representative mariculture industries in Weihai City, were chosen as output indicators. The current form of mariculture takes green and ecological aquaculture as its development trend [
40,
41,
42], which is a solution to the problems of environmental pollution from waves and water quality caused by mariculture. This can simultaneously help in the healthy breeding of mariculture species and play a positive role in promoting the establishment of marine ecological protection. Based on the theory of ecological economics, the aquaculture water environment is an indispensable factor in mariculture, and its quality is a key factor in assessing mariculture processes. “Criteria of Seawater Quality Of the P.C.C” on 1 August 1982, from the beginning of implementation. According to the different uses of seawater, water quality is divided into three categories: (1) Class I water quality: good water quality, suitable for the protection of marine biological resources, the establishment of marine nature reserves, and human security use. (2) Class II water quality: water quality is lightly polluted and suitable for establishing seawater bathing and scenic areas. (3) Class III water quality suits general industrial water, port waters, marine development operation areas, etc. Mariculture waters under Class I and II water quality were acceptable; below Class III, the water quality worsened, and thus the proportion of Class I and II water quality was chosen as the desired output indicator [
43,
44,
45].
2.3.2. Input Indicators
The mariculture area includes the sea, shallow seas, bays for fish, shrimp, shellfish, algae, and other marine animals, and plant aquaculture surface areas. It reflects the scale of fishery production and indicates the degree of utilization of water surface resources. Marine resources are an essential part of the mariculture development process, which largely determines the yield, quality, and economic returns of mariculture. Therefore, the area of mariculture is one of the crucial factors influencing mariculture inputs [
46,
47,
48].
The number of mariculture employees refers to the number of people who have participated in a certain amount of mariculture labor and are paid or operated to earn income. This was a comprehensive input factor selected as an indicator for evaluating the production efficiency of aquaculture in Weihai [
49].
Fish fry is the foundation of mariculture, and if the survival rate of fish fry is high, it will bring a high yield to the cultured species, thus bringing a high income to fishermen. Therefore, the input of fish fry and bait plays a vital role in the initial stage of mariculture; hence fish fry and bait are selected as input indicators.
Marine environmental pollutant treatment cost refers to the repair cost due to the pollution of the sea area and water quality within a certain period of time [
50,
51]. It is based on the price to be paid for the damage to the ecological environment of the sea area. With Class I and II water quality as the expected output variables, the cost of marine environmental pollutant treatment was selected as the input index.
2.3.3. Undesirable Output
In terms of undesirable output, human intervention in the process of mariculture causes changes in some links of the natural cycle of the aquaculture water environment. Except for algae culture, other mariculture organisms are mainly heterotrophic, and ammonia nitrogen and phosphate in the metabolic waste of their physiological activities are two of the main sources of mariculture pollution [
52]. It should be noted that algae have a certain absorption effect on organic pollutants containing N and P in seawater [
53], but the absorption effect of different algae and its realization conditions are not supported by detailed data, so it is impossible to accurately estimate. Therefore, this study only selected the N and P pollution output of heterotrophic mariculture products as the environmental impact accounting index of mariculture.
2.3.4. Selection of Environment Variables
Environmental variables need to be selected that have an impact on the ecological development of the mariculture industry but are not factors that decision-making units can control if they want to. In addition, considering the development characteristics of the mariculture industry, the following environmental variables are mainly selected in this paper: (1) government support. The government policies of Weihai City usually affect the production and development of the mariculture industry. In this study, the financial expenditure of the Weihai City mariculture industry (100 million yuan) is used to measure the government policies on the development of the mariculture industry. Fiscal expenditure reflects local government investment in public services, infrastructure construction, and environmental protection. For the mariculture industry, the financial expenditure of local governments will directly affect the investment in breeding environments, technical support, and disease prevention and control, and indirectly affect the ecological efficiency. (2) Urbanization level. The index is measured by the urbanization rate, which is the proportion of urban population to the total population. The improvement of urbanization level may lead to the reduction in aquaculture waters and the intensification of environmental pollution, but it may also promote the innovation of aquaculture technology and the expansion of market demand. (3) Regional economic development level. It is measured by GDP per capita. Regions with a high level of economic development are likely to have more advanced technologies and better infrastructure, thus contributing to the ecological efficiency of mariculture. At the same time, the level of economic development may also affect consumers’ consumption habits and market demand, which will have an impact on the mariculture industry.
2.3.5. Data Source
Official agencies such as the Weihai Fishery Statistical Yearbook, the Marine Development Bureau, and the Weihai Bureau of Statistics regularly release statistical data on the marine economy and mariculture. These data include the production, output value, aquaculture area, aquaculture species, etc., which provide basic data for the analysis of production efficiency.
Weihai Ecological Environment Bureau is the official agency responsible for environmental protection and management. Weihai Ecological Environment Bureau may release relevant information or reports on the treatment costs of marine environmental pollutants and water quality.
The unwanted output N and P pollution output cannot be directly obtained from the yearbook. In previous studies, only Chen Yibo et al. [
54] and Zong Humin et al. [
55] have estimated the pollution of Chinese mariculture. In this paper, the calculation of N and P pollution output refers to the research idea of Zong Humin [
55], and the mariculture organisms are divided into two types, feeding type and non-feeding type, for calculation, respectively. Among them, the N and P pollution emissions of feeding-type mariculture products were calculated according to the output of different aquaculture products and the corresponding pollution production coefficient of the most important aquaculture methods according to the China Fishery Statistical Yearbook and the Manual of Production and Pollutant Discharge Coefficient of Aquaculture Pollution Sources. The pollutant discharge of non-feeding (filter-feeding) mariculture products was calculated based on the pollution coefficient data estimated by Zong Humin [
55] and the yield data of each aquaculture species in the China Fishery Statistical Yearbook. The formula for N and P pollution output of each mariculture species is as follows:
Among them, is the pollution output of marine aquaculture organisms, is the pollution production coefficient of the aquaculture organism, and is the yield increase in the aquaculture organism.
3. Results
3.1. Empirical Analysis Based on the Three-Stage Unexpected Output SBM Model
3.1.1. Empirical Analysis in the First Stage
Based on the input and output data of the ecological development of the marine aquaculture industry in Weihai City from 2012 to 2023, the SBM model of unexpected output is used to measure the ecological efficiency and decomposition indicators of the marine aquaculture industry in Weihai City.
The ecological production index and decomposition of seawater aquaculture in Weihai City are presented in
Table 3. The results indicate that the annual average comprehensive production efficiency of Weihai’s aquaculture ecological development, considering the undesirable output from 2012 to 2022, is 0.914. The growth rate was relatively stable from 2012 to 2015, which may have been a period when Weihai City initially strengthened the promotion of ecological breeding technology and policy guidance. The efficiency improvement benefited from the optimization of resource allocation and the improvement of basic technology. In the survey year, only 2018 achieved a comprehensive production efficiency that reached a relatively effective state of aquaculture production, suggesting that under the current factor input and output conditions, the ecological development of mariculture was relatively effective. During this year, Weihai issued the “Weihai Aquaculture Water Mudflat Plan (2018–2030)” and the “Implementation Plan for the Green Development of Mariculture”, which resulted in certain developmental achievements. However, this does not imply that there is no potential for further improvement in the comprehensive production efficiency of mariculture. Rather, it reflects that efficiency optimization has been achieved within the current scope of mariculture production technology. In the remaining years, the comprehensive technical efficiency of Weihai was consistently below 1, signifying that the input-output ratio did not reach its optimal level in those years. This indicates substantial room for enhancement in the ecological efficiency of marine aquaculture in Weihai City.
In terms of pure technical efficiency, the ecological development of marine aquaculture in Weihai City reached an effective state in 2018, as well as in 2022–2023. This suggests that under the existing marine aquaculture production technology, the technical application of ecological production in Weihai has demonstrated strong stability and continuity, optimizing technical elements to achieve maximum output. Technological progress in ecological production is not only reflected in improvements in yield and quality but also in the adoption of more environmentally friendly and sustainable production methods [
56]. For instance, environmentally conscious breeding techniques [
57], energy-saving and emission-reducing equipment, and effective waste disposal technologies have been implemented to enhance the sustainability of ecological aquaculture [
58]. However, in other years, no significant technological progress was made, indicating that the technical application of marine aquaculture in Weihai has not yet reached full maturity. The marine aquaculture technology employed during these periods had certain limitations and failed to achieve a level capable of fully realizing efficient production [
59,
60].
In terms of scale efficiency, the ecological production of marine aquaculture in Weihai City reached an effective state in 2018 and 2021. This indicates that the scale of marine aquaculture in Weihai has been well-aligned with the available resource conditions, achieving an optimal state. Whether in terms of the utilization of aquaculture area or the allocation of other input factors such as labor and capital, the predetermined output is attained with the minimum use of resources (e.g., labor, feed, water quality management) under given technological conditions. This suggests that no technical inefficiencies occurred during this process, and the utilization of resources has been maximized. However, during the periods of 2012–2017, 2019–2020, and 2022–2023, the scale efficiency was not effective, indicating that resources may have been either underutilized or overutilized, which likely impacted the scale efficiency of ecological development.
3.1.2. Second Stage SFA Regression
The slack variables of each input variable of the eco-efficiency of marine aquaculture in Weihai City measured in the first stage were used as the explanatory variables, and the three environmental variables of government support, urbanization level and regional economic development level were used as the explanatory variables, which were substituted into the stochastic frontier model. The results are shown in
Table 4.
(1) Government Support
The impact of government support on the three slack variables—seawater aquaculture area, seawater aquaculture practitioners, and marine environmental pollutant treatment fees—was found to be statistically significant at the 5% level. However, the slack variable for fish fry feed input was not significant, and the coefficients for all slack variables were negative. As government financial investment in the marine aquaculture industry increases, both the aquaculture area and the number of practitioners in the sector are expected to improve, which, in turn, positively affects the ecological efficiency of marine aquaculture. This conclusion aligns with expectations, likely because increased fiscal investment can facilitate the development of infrastructure, optimize and upgrade the structure of the marine aquaculture industry, and enhance the expertise of fishery practitioners.
(2) Urbanization Level
The urbanization level has a significant impact on the slack variables of seawater aquaculture area and marine environmental pollutant treatment fees, with statistical significance at the 5% level. Its impact on the slack variable for seawater aquaculture practitioners is significant only at the 10% level, while it is not significant for the slack variables of fish fry and feed. Additionally, the coefficients for all slack variables are negative. As the level of urbanization improves, both the aquaculture area and environmental governance are enhanced, positively influencing the ecological efficiency of the marine aquaculture industry. This conclusion aligns with expectations, likely because urbanization leads to a higher utilization of input factors by fishermen. Furthermore, the rising costs associated with marine environmental pollutant control have encouraged greater participation by fishermen in marine aquaculture production activities.
(3) Regional economic development level
This variable has a significant impact on the area of marine aquaculture, the number of marine aquaculture practitioners, the cost of marine environmental pollutant control, and the slack variable of fish fry feed, all of which pass the test at a significance level of over 5%, and the coefficient values for each slack variable are negative. With the improvement of regional economic development level, the investment in marine aquaculture has been improved, which has a positive impact on the ecological efficiency of marine aquaculture.
From the above analysis, it can be concluded that the impact of exogenous environmental variables on the ecological efficiency of Weihai’s marine aquaculture industry cannot be ignored. It is necessary to use adjusted input-output data in the third stage to obtain more accurate ecological efficiency values for Weihai’s marine aquaculture industry.
3.1.3. Empirical Analysis in the Third Stage
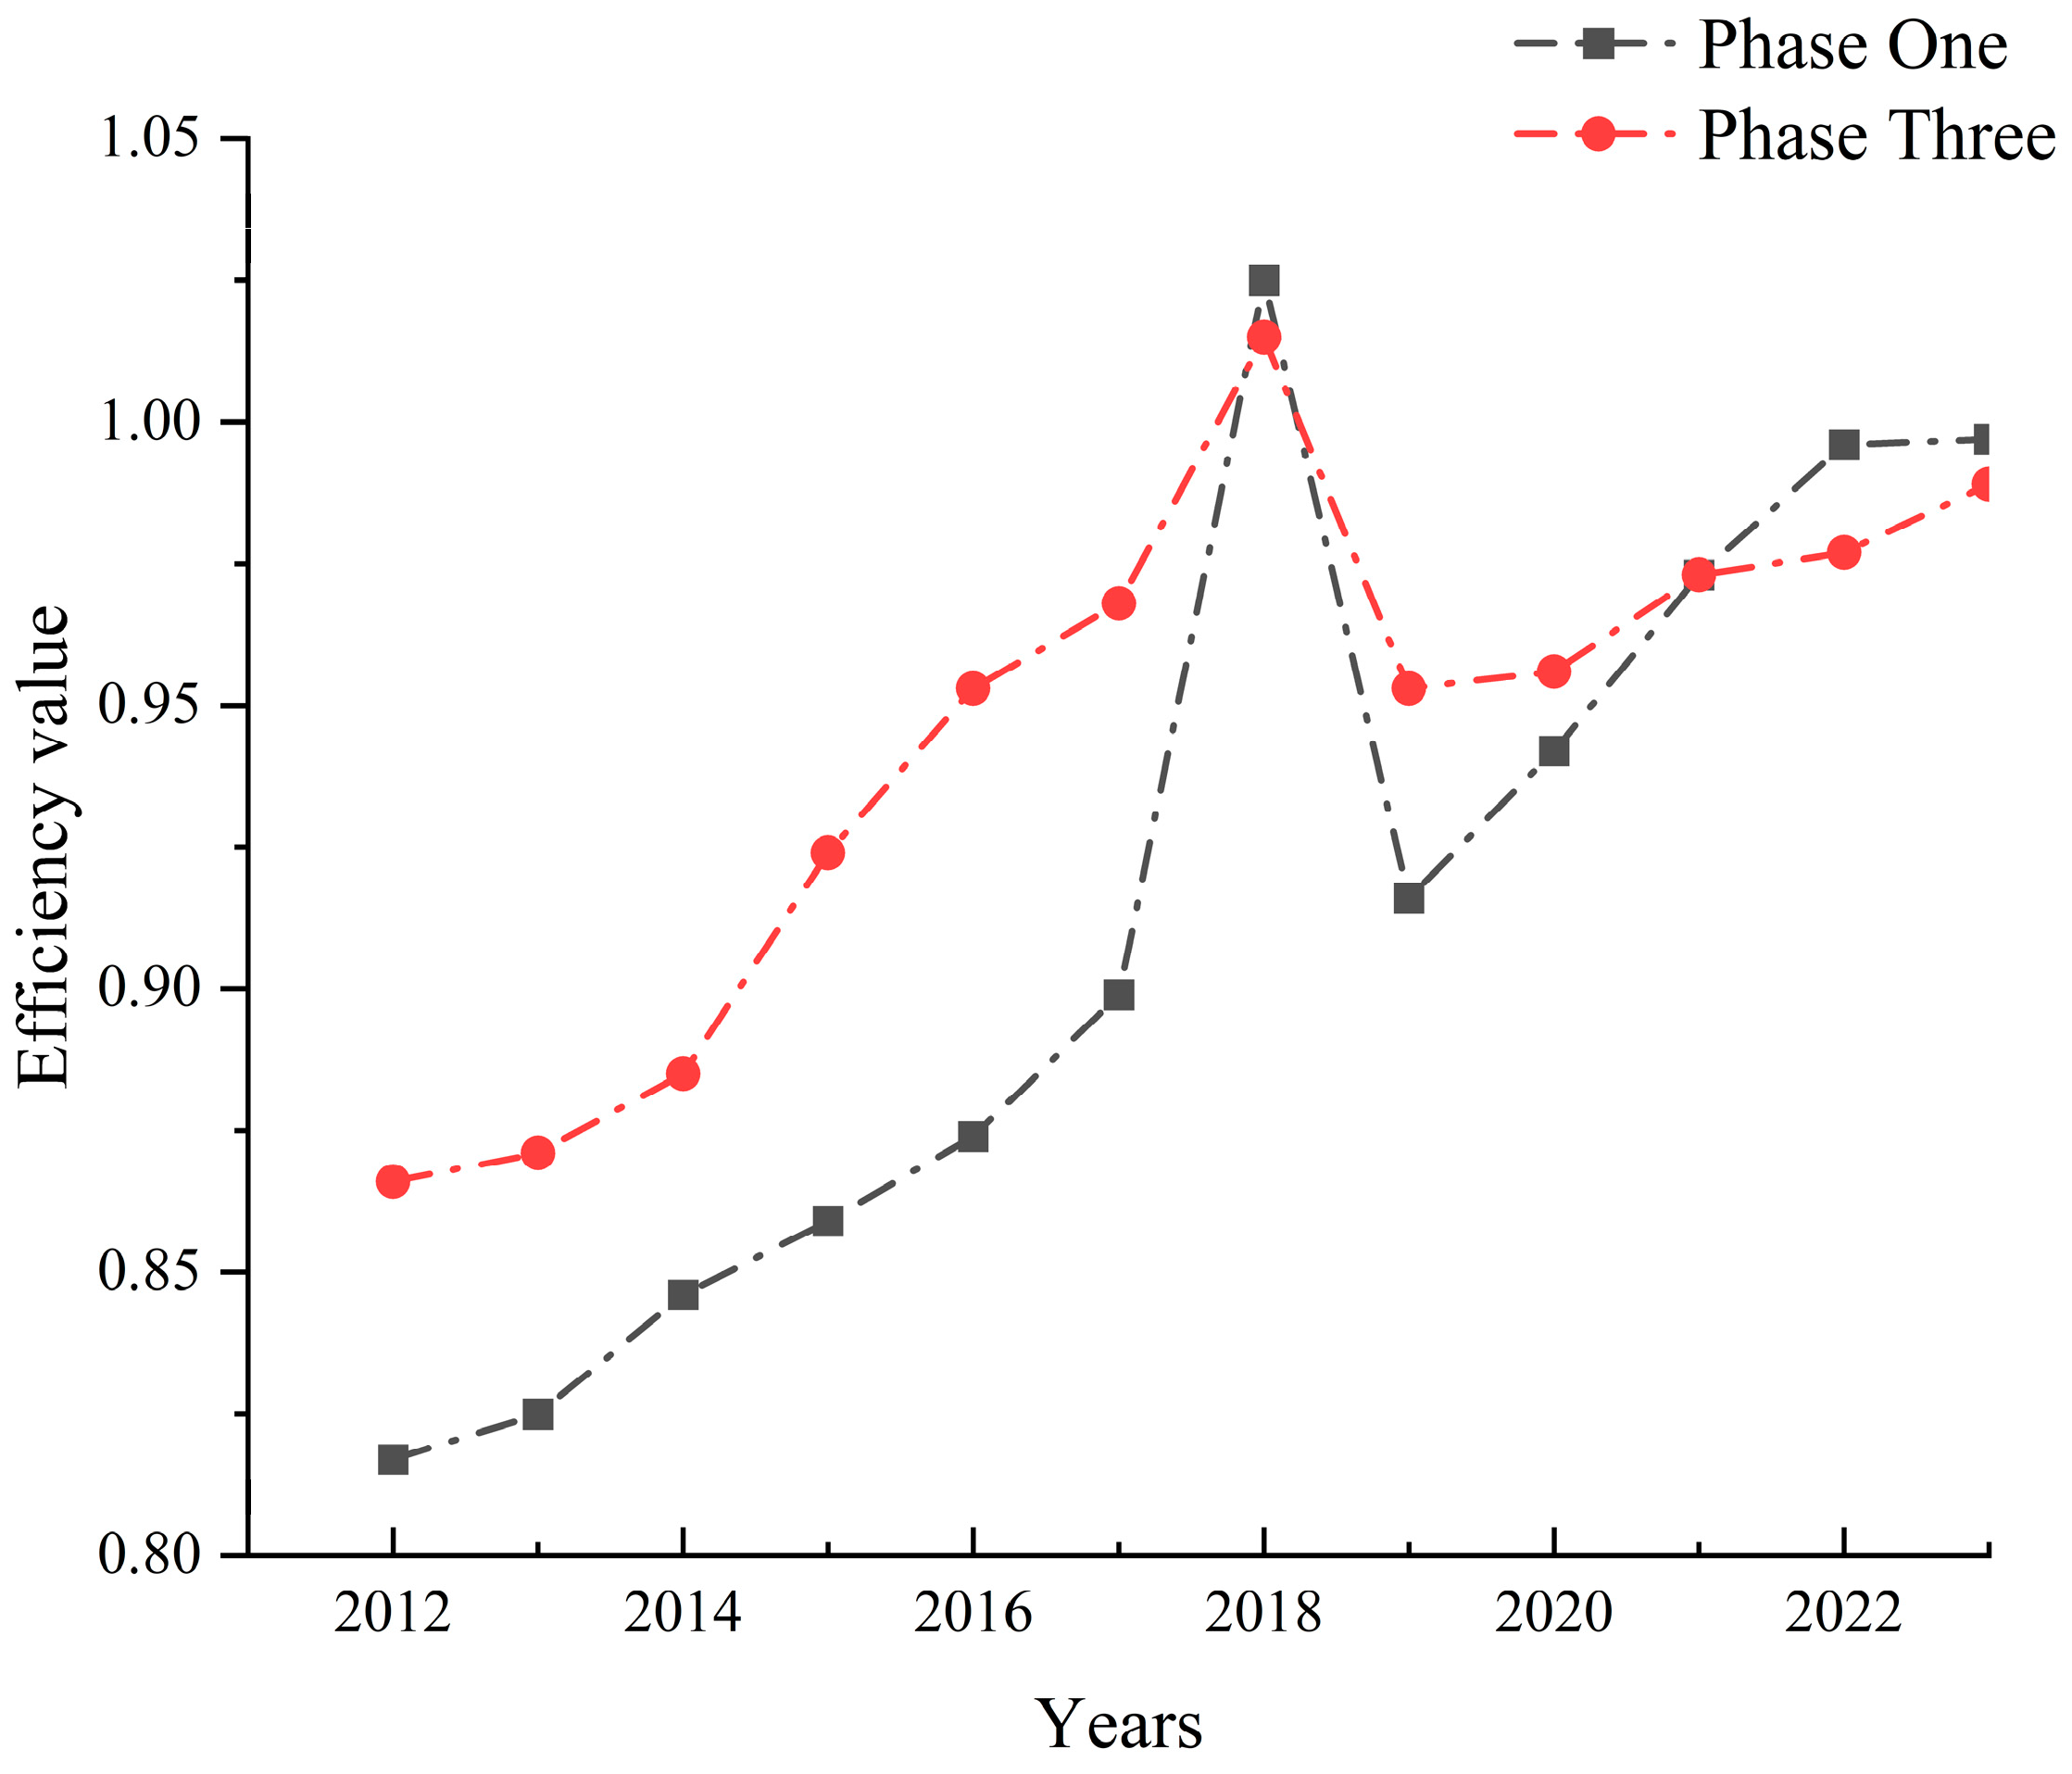
As shown in
Figure 2, the efficiency trend during the third stage is notably more stable compared to the first stage, indicating the necessity of applying the SFA (Stochastic Frontier Analysis) to separate the effects of environmental variables and random disturbances. This further validates the appropriateness of selecting the three-stage SBM (Slacks-Based Measure) model for this study. Efficiency values in the DEA (Data Envelopment Analysis) context are defined as the ratio of weighted outputs to weighted inputs. Specifically, a value of 1 indicates that a decision-making unit (DMU) is operating on the frontier, meaning it has reached optimal efficiency, while values less than 1 indicate inefficiency relative to the frontier. In the third stage, the efficiency values are adjusted by accounting for the influence of environmental factors and random disturbances, and this adjusted efficiency provides a more stable reflection of the underlying performance.
Overall, the annual average analysis demonstrates a positive trend in the ecological efficiency of the marine aquaculture industry in Weihai City. In terms of stage-based analysis, from 2012 to 2017 and from 2019 to 2020, the ecological efficiency in the third stage exceeded that of the first stage, suggesting that environmental factors and random disturbances negatively impacted the ecological efficiency of the marine aquaculture industry during these periods. However, between 2017 and 2018, the efficiency values of the first and third stages were nearly identical, indicating that the environmental factors and random disturbances had a negligible impact on efficiency during this period. Notably, in 2022–2023, the ecological efficiency of the first stage was higher than that of the third stage, indicating that during this period, the influence of environmental factors and random disturbances on the ecological efficiency was positive. The direction of the impact of environmental variables and random disturbances on the ecological efficiency of Weihai City’s marine aquaculture industry shifted from negative to positive, attributed to factors such as regional fiscal expenditures, urbanization levels, and the overall economic development of Weihai City.
3.2. Analysis of Kernel Density Estimation
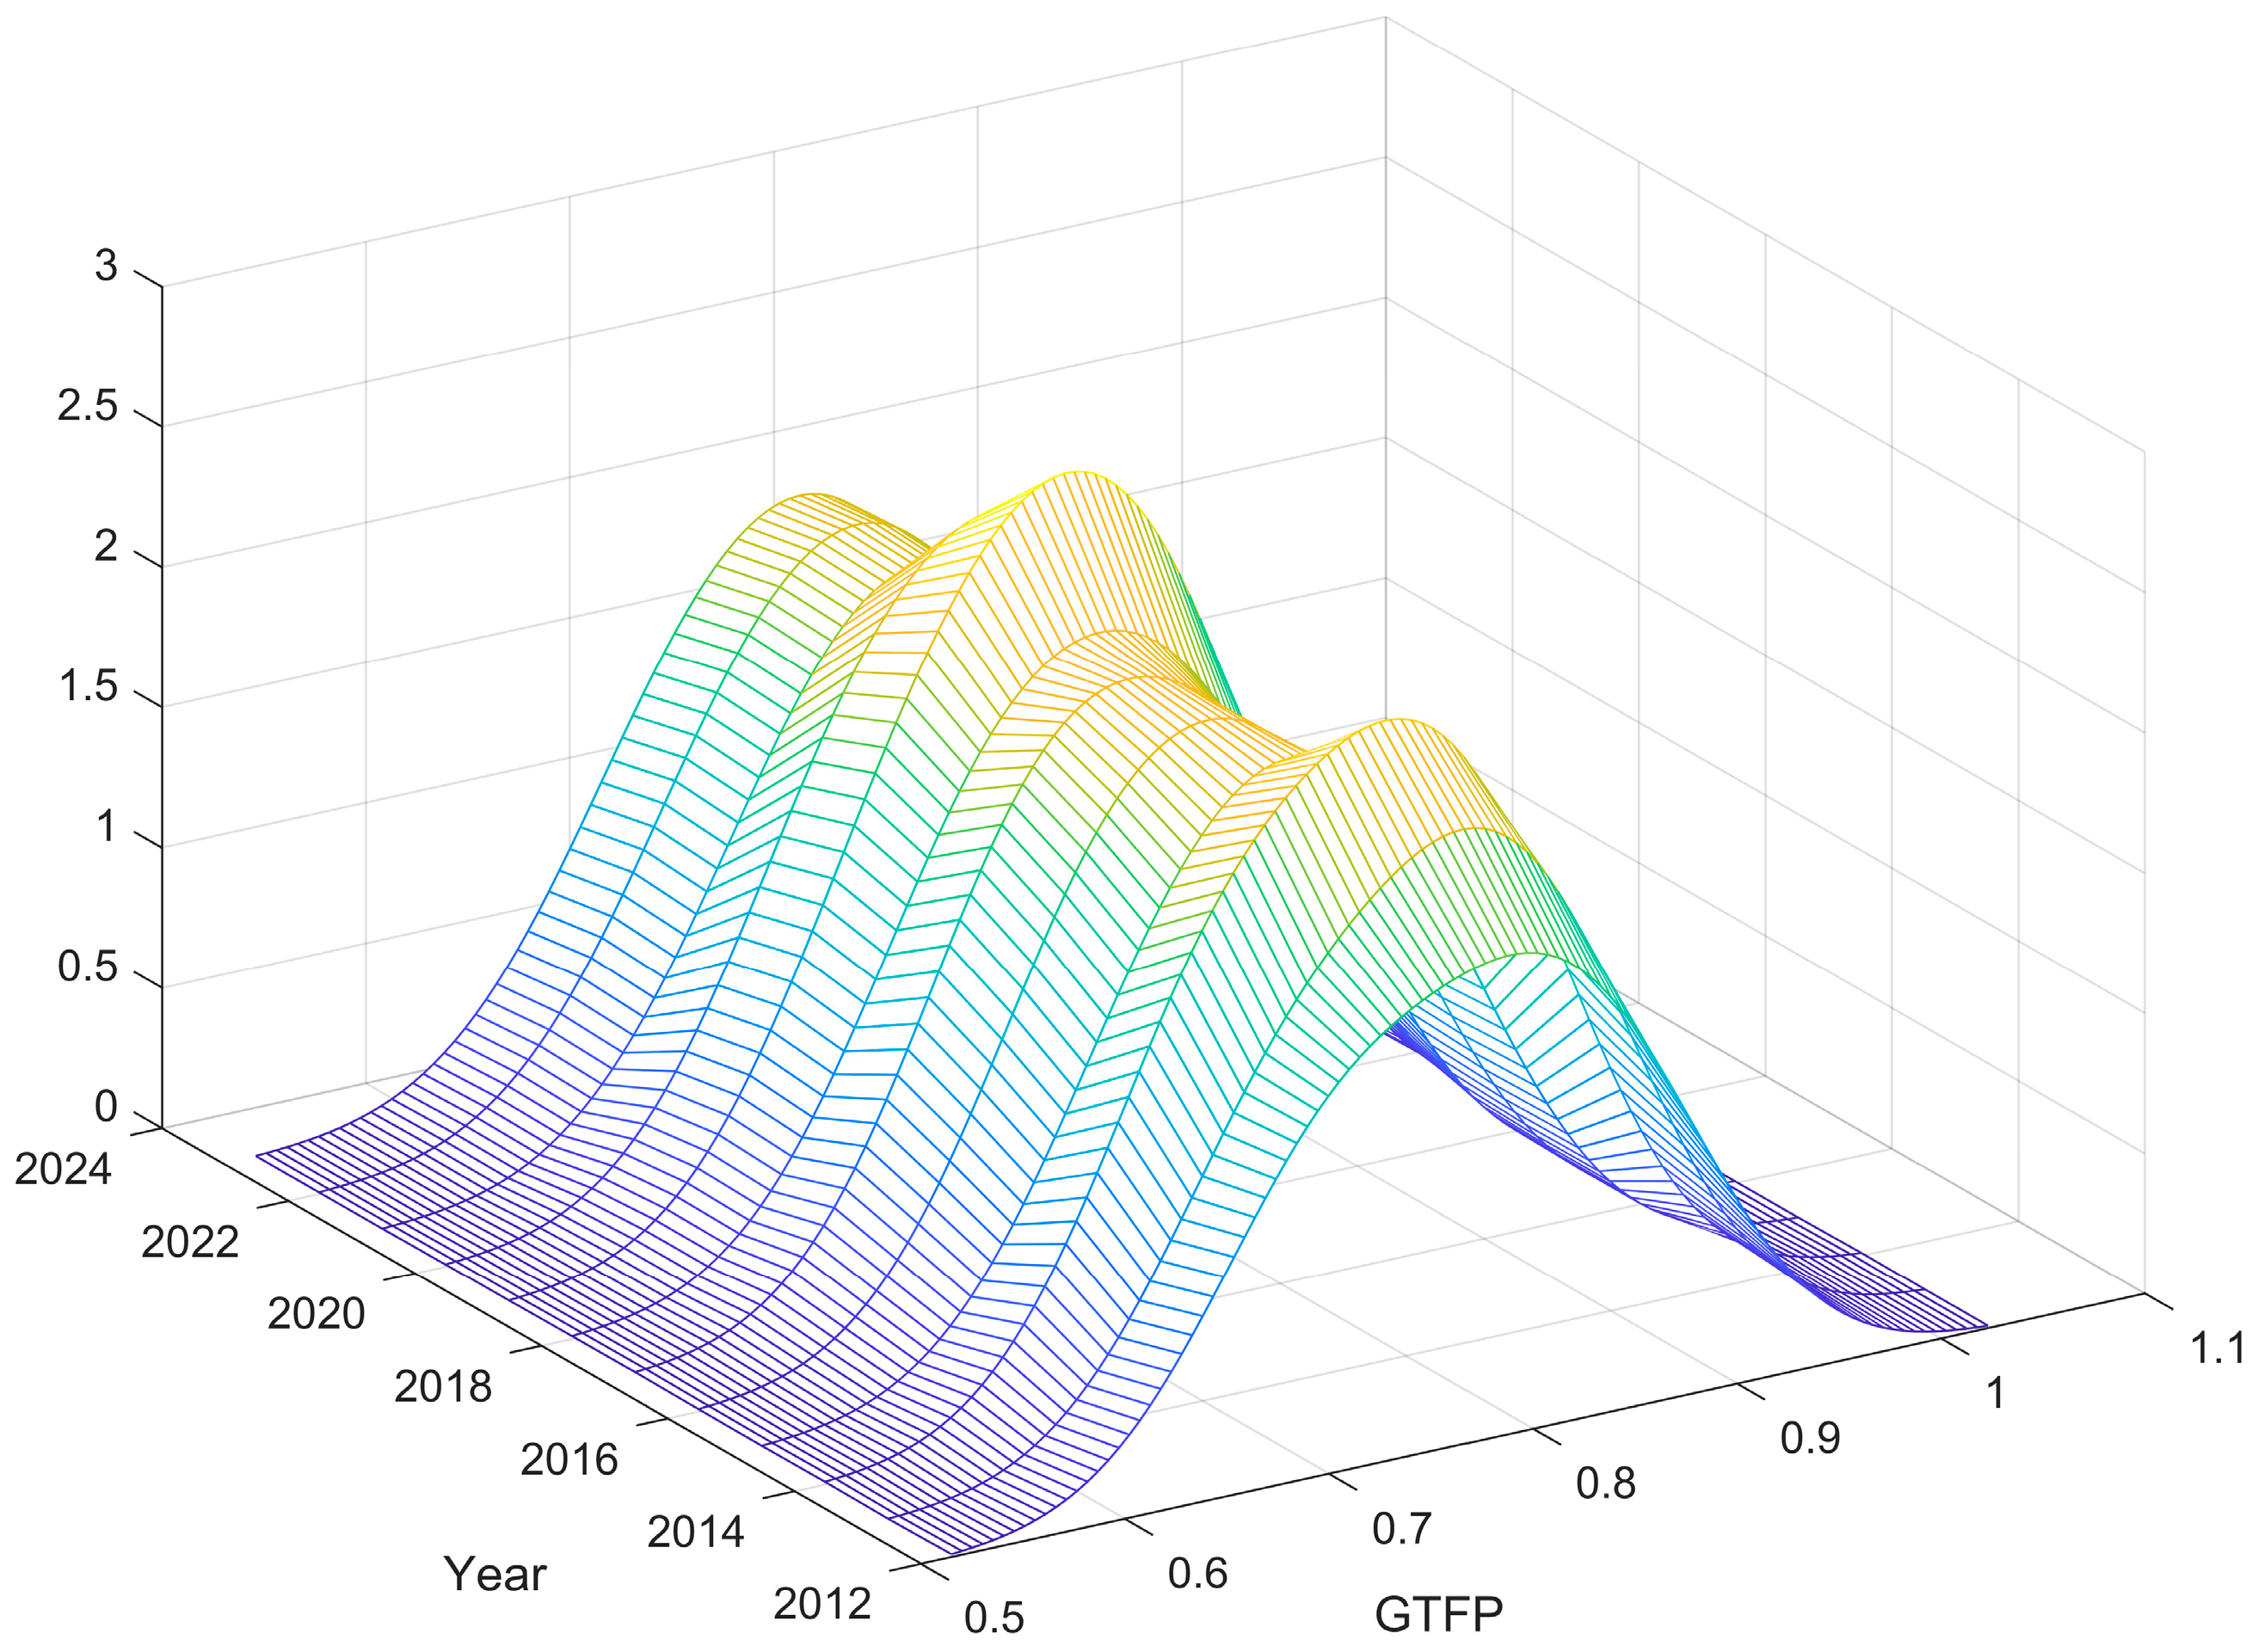
In order to more intuitively analyze the dynamic evolution trend of marine aquaculture ecological development in Weihai City in the time dimension, this paper uses the kernel density estimation method to estimate the nuclear density curve of marine aquaculture ecological development in Weihai City and describes the dynamic evolution pattern of marine aquaculture ecological development in Weihai City in the time dimension. Revealed the temporal dynamic evolution characteristics of the ecological efficiency development of Weihai’s marine aquaculture industry after adjustment. Using MATLAB R2018b software, a nuclear density estimation map of the comprehensive technical efficiency of the ecological development efficiency of marine aquaculture in Weihai City after the third stage adjustment was drawn, as shown in
Figure 3.
The nuclear density curve of the comprehensive technical efficiency of marine aquaculture ecological development in Weihai City shows a relatively obvious single peak shape. In 2018, the curve position was significantly higher than other curves, and the distribution of efficiency was more concentrated, indicating that the comprehensive technical applications, such as aquaculture timing, equipment, and management methods used in the marine aquaculture process during this year were efficient [
51,
52]. However, the lower position of the curve after 2018 indicates that there is a certain degree of interference in the comprehensive technical efficiency of marine aquaculture ecological development in Weihai City, resulting in suboptimal resource allocation and significant differences in comprehensive technical efficiency.
3.3. Trend Prediction of Ecological Efficiency Development in Marine Aquaculture Industry in Weihai City
The gray prediction model GM (1, 1) does not require a high sample size and is easy to test for accuracy, making it widely used for future trend prediction. For model accuracy verification, posterior difference ratio C and small error probability P are calculated. As shown in
Table 5, the C value represents the degree of concentration of the difference between predicted and actual values. The smaller the value, the better the degree of concentration of the difference between predicted and actual values. The
p-value is the difference between the residual and the mean residual, and the larger its value, the higher the model fitting accuracy.
Based on the gray dynamic model GM (1, 1), a multi-time series model was established for the comprehensive efficiency of the marine aquaculture industry in Weihai City, and the results were verified using the posterior difference test method, namely the C (posterior difference) and p (small error probability) tests. As shown in
Table 6, the verification results show that the small error probability
p-value of the comprehensive efficiency in each period is greater than 0.80, and the posterior difference ratio C value is less than 0.4. The accuracy level has reached the qualified level, indicating that the model prediction results are reliable and can predict the future development trend of ecological efficiency in the marine aquaculture industry in Weihai City.
The gray GM (1, 1) prediction model can capture the changing trend of ecological efficiency in the marine aquaculture industry in Weihai City. By processing and analyzing the historical ecological efficiency data of the marine aquaculture industry in Weihai City, based on the data from 2012 to 2023, the changing trend of ecological development in the marine aquaculture industry in Weihai City for the next five periods can be predicted.
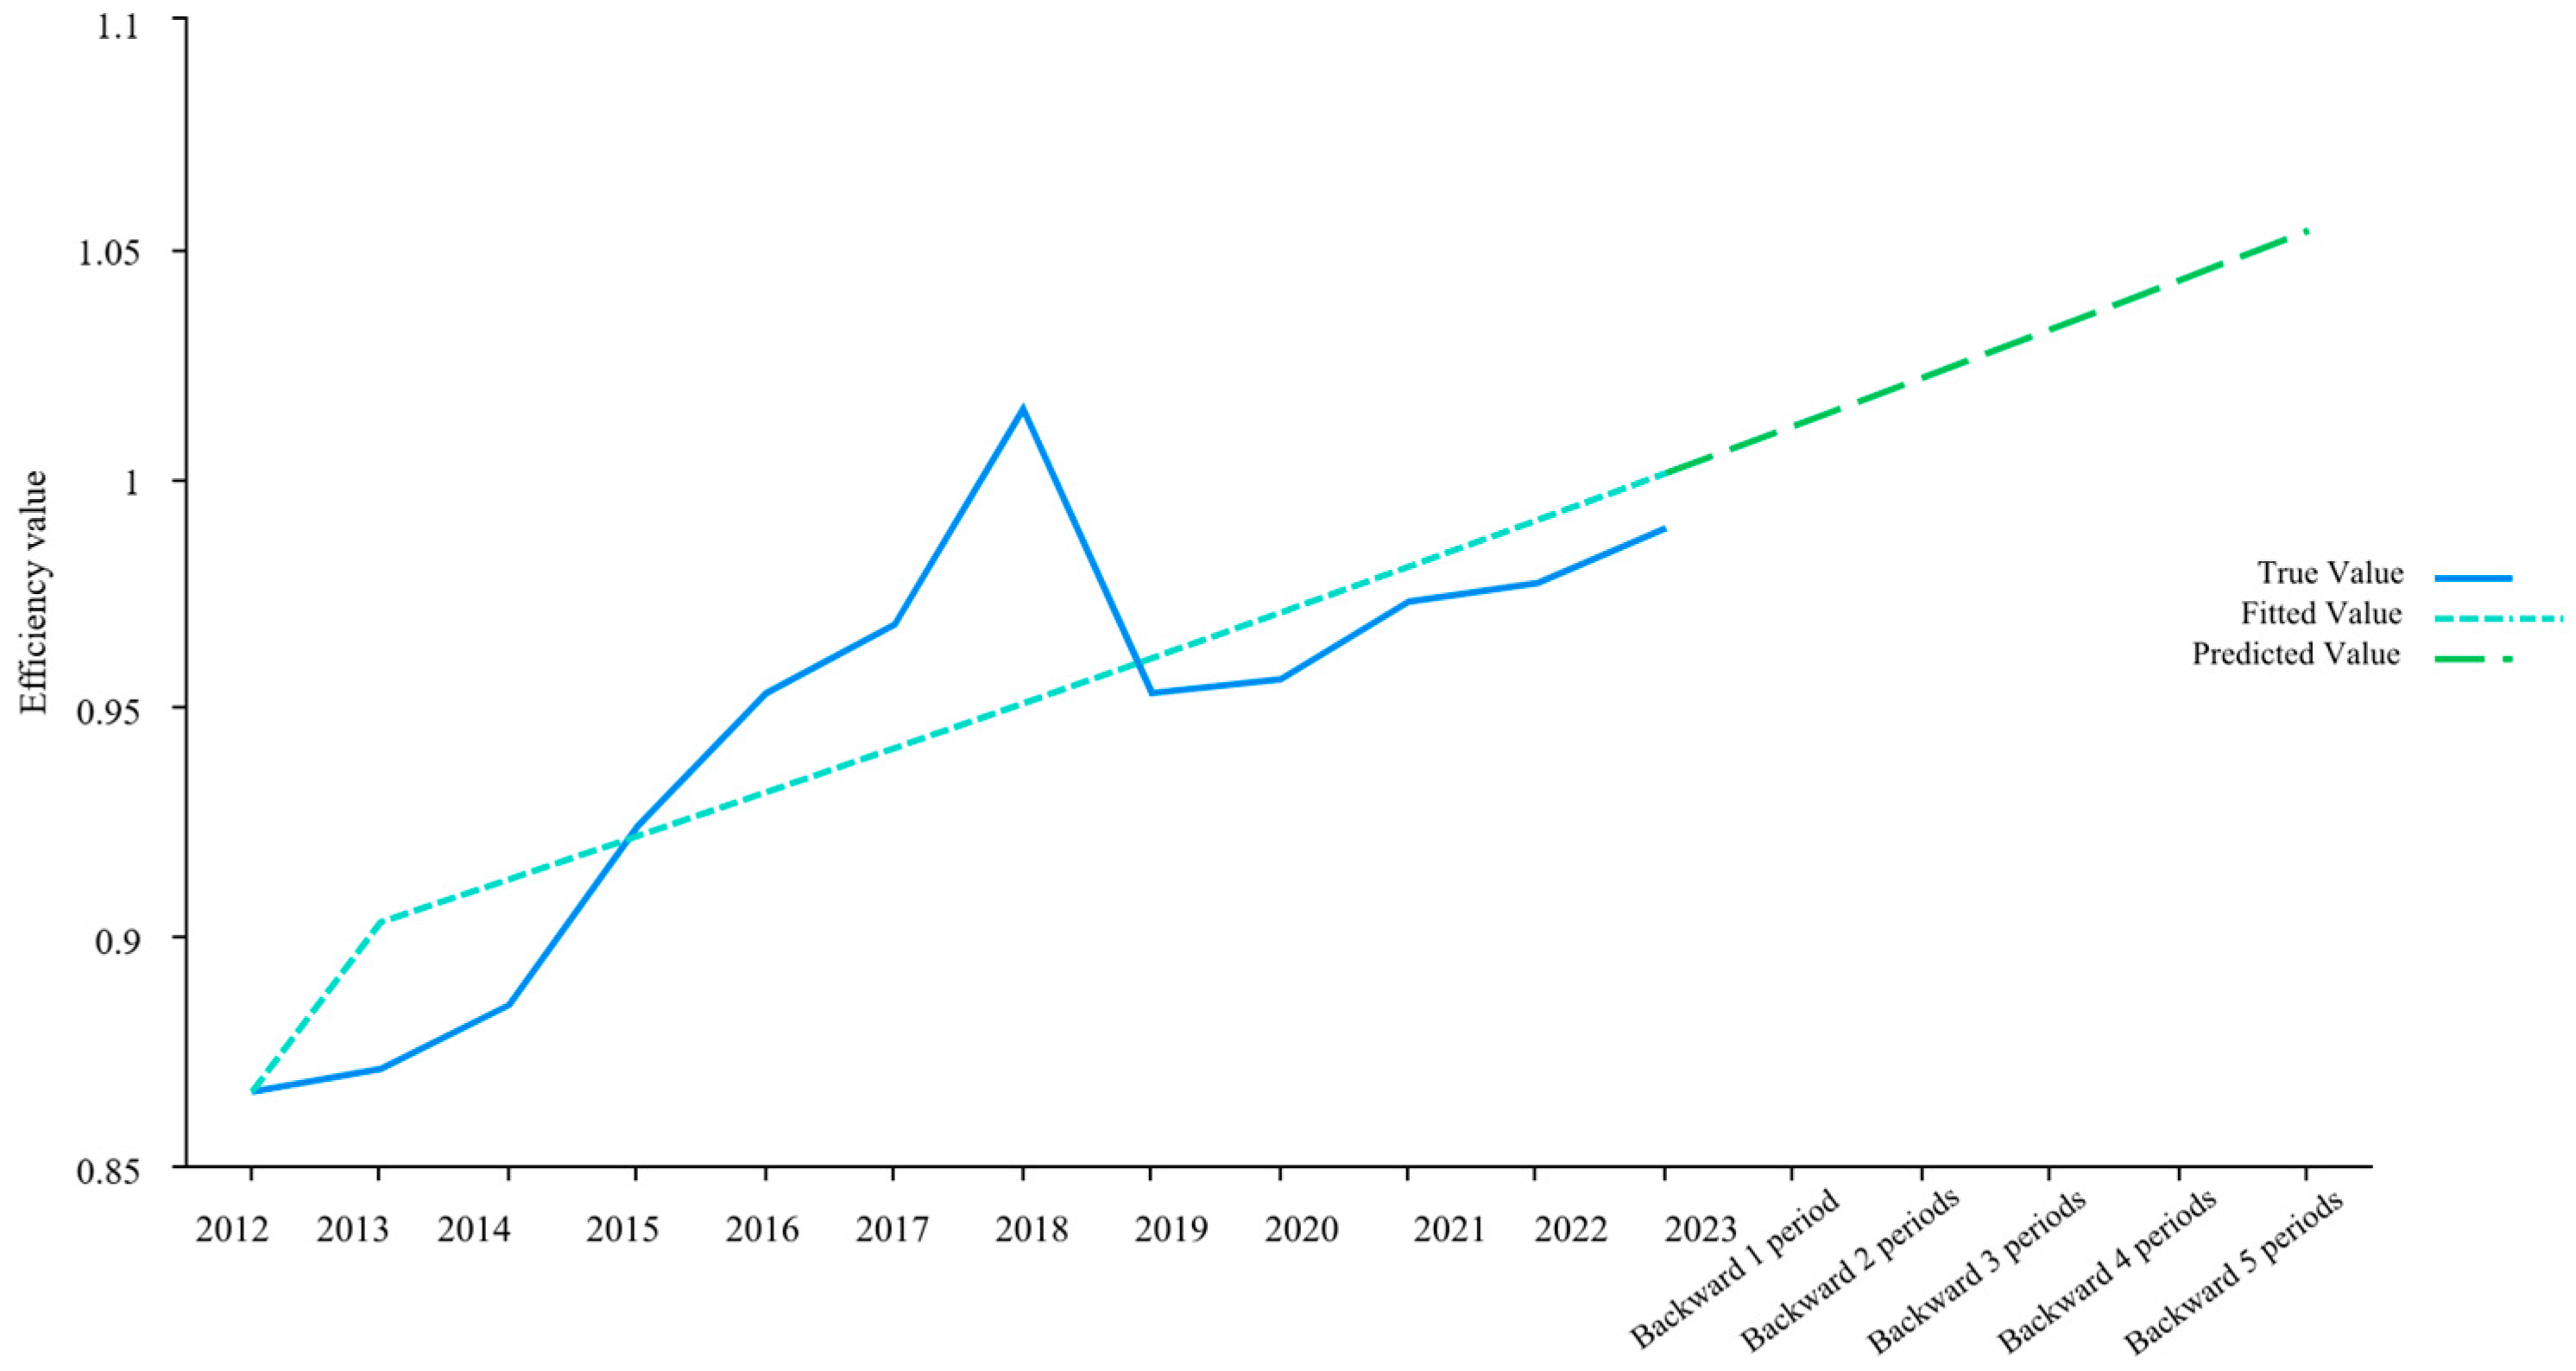
As shown in
Table 7 and
Figure 4, the model prediction results show that the ecological efficiency is on the rise, indicating that the marine aquaculture industry in Weihai City will make certain improvements in technological progress, management optimization, environmental protection measures, and other aspects and have made positive progress. However, the average annual growth rate from 2012 to 2023 is 1.3%, with a predicted lag of 5 periods and an average annual growth rate of 1.02%, indicating a slowdown in the efficiency increase in marine aquaculture ecological development.
The main reasons for the upward trend include:
(1) Technological progress and innovation: With the continuous development of technology, the marine aquaculture industry has made significant progress in aquaculture technology, feed formulation, disease prevention and control, and other aspects. The innovation and application of these technologies can help improve breeding efficiency and product quality, thereby promoting the improvement of ecological efficiency.
(2) Scale and intensive management: With the continuous development of marine aquaculture, scale and intensive management have gradually become mainstream. This business model helps to reduce production costs, improve resource utilization efficiency, and thus promote the improvement of ecological efficiency.
4. Discussion
This study on the productivity of mariculture in Weihai City may differ from previous studies in the following ways:
Analysis of geographical characteristics: Weihai is rich in marine biological resources, has excellent seawater quality, and has a well-developed mariculture industry. The geographical characteristics of the mariculture industry in Weihai, such as emissions of pollutants such as nitrogen and phosphorus and water quality, are analyzed to understand their impact on the culture industry, which has implications for other coastal cities in China.
Analysis of factors of production: Study the factors of production in the mariculture industry, including human resources, mariculture area, marine environmental pollutant treatment costs, fish fry and bait inputs, and other factors. Building a systematic theoretical framework for the development of economies of scale in mariculture and exploring their impact on production efficiency.
Based on the principle of the gray prediction model GM (1, 1), a prediction model applicable to the ecological efficiency of the marine aquaculture industry in Weihai City was constructed. By solving the model, one can predict the ecological efficiency for a certain period of time in the future. Analyze the prediction results and evaluate the accuracy and reliability of the model’s predictions. Applying the predicted results to the planning and management of Weihai’s marine aquaculture industry can provide a scientific basis and decision support for the sustainable development of Weihai’s marine aquaculture industry.
The limitations of the study include the difficulty in obtaining data for certain indicators due to limitations in data collection, which affects the completeness and accuracy of the data to a certain extent; the limitations of research methods and the ecological efficiency evaluation model used cannot fully cover all complex real-world factors, which may result in deviations from actual situations.
5. Conclusions
As an important marine aquaculture region in China, Weihai City has long been a leader in the domestic aquaculture industry due to its abundant marine resources and well-established industrial foundation. However, despite the rapid economic development in the region, challenges such as inefficient resource utilization and increasing ecological pressures have emerged, underscoring the need for a sustainable development path.
In this study, a three-stage DEA model, kernel density analysis, and a gray prediction model GM (1, 1) were applied to systematically evaluate and predict the ecological efficiency of marine aquaculture in Weihai City. The key conclusions are as follows:
(1) The overall ecological efficiency of marine aquaculture in Weihai City remains good, with pure technical efficiency being generally better than scale efficiency. From the perspective of environmental factors, the improvement of regional fiscal expenditure, urbanization level, and regional economic development level will have a positive impact on the ecological development of marine aquaculture in Weihai City. Comparing the efficiency values of the first and third stages, those of some years have increased or decreased to a certain extent, indicating that environmental variables and random disturbances have a certain degree of influence on the true level of poverty alleviation performance.
(2) The nuclear density curve of the comprehensive technical efficiency of marine aquaculture in Weihai City shows a clear unimodal distribution, indicating that the ecological efficiency of the industry has generally remained stable with minimal fluctuations over the years. The curve in 2018 stands out, with a notable peak, reflecting a period of relatively high efficiency and positive development. However, subsequent years show a decrease in efficiency, with the curve shifting downward, indicating that the ecological efficiency during these years was suboptimal, marked by inefficiencies and fluctuations in performance.
(3) Prediction of ecological efficiency and future projections: according to the gray prediction model, the ecological efficiency of marine aquaculture in Weihai is expected to maintain a steady growth trend in the coming years, albeit at a slower rate. This indicates that while the overall performance is improving, the pace of growth may plateau without further interventions. Policymakers should consider investing in cutting-edge technologies such as smart aquaculture systems or eco-friendly pollutant treatment solutions to accelerate this growth. In addition, targeted interventions should be prioritized for situations with high resource utilization or pollution levels.
Author Contributions
Conceptualization, Y.W. (Yinuo Wu); methodology, Y.W. (Yinuo Wu); software, C.Z.; validation, Y.W. (Yinuo Wu); formal analysis, C.Z.; investigation, Y.W. (Yinuo Wu); resources, Y.W. (Yinuo Wu); data curation, Y.W. (Yanyi Wu); writing—original draft preparation, Y.W. (Yinuo Wu); writing—review and editing, Y.W. (Yinuo Wu); visualization, Y.W. (Yanyi Wu).; supervision, C.Z.; project administration, C.Z.; funding acquisition, C.Z. All authors have read and agreed to the published version of the manuscript.
Funding
This research was funded by the National Social Science Major Bidding Project OF FUNDER, grant number 22&ZD111.
Data Availability Statement
The data presented in this study are available on request from the corresponding authors.
Conflicts of Interest
The authors declare no conflicts of interest.
References
- Yu, J.; Han, Q. Food security of mariculture in China: Evolution, future potential and policy. Mar. Policy 2020, 115, 103892. [Google Scholar] [CrossRef]
- Pan, K.H.; Li, D.H. Review and Reflection on the Growth Mode of China’s Marine Aquaculture Industry. In Proceedings of the 2007 China Fisheries Economic Experts Forum—Academic Seminar on Transformation of Fisheries Growth Mode, Beijing, China, 18 January 2007; Available online: https://cpfd.cnki.com.cn/Article/CPFDTOTAL-OPUI200701001011.htm (accessed on 1 December 2024).
- Feng, Y.Y.; Hou, L.C.; Ping, N.X.; Ling, T.D.; Kyo, C.I. Development of mariculture and its impacts in Chinese coastal waters. Rev. Fish Biol. Fish. 2004, 14, 1–10. [Google Scholar] [CrossRef]
- Wang, P.; Wang, J.; Liu, X.; Huang, J. A Google Earth Engine-Based Framework to Identify Patterns and Drivers of Mariculture Dynamics in an Intensive Aquaculture Bay in China. Remote Sens. 2023, 15, 763. [Google Scholar] [CrossRef]
- Han, H.; Jiang, Y. The Evolution of Mariculture Structures and Environmental Effects in China. J. Coast. Res. 2008, 83, 155–166. [Google Scholar] [CrossRef]
- Lin, C.Y.; Dai, G.L.; Liu, Y.; Zhang, M.Q.; Liu, Y.; Jiang, W.; Fu, X.-M.; Chen, H.-X. Ecological value of mariculture shellfish resources in China: Assessment and management. Mar. Policy 2023, 148, 105406. [Google Scholar] [CrossRef]
- Rahman, M.T.; Nielsen, R.; Khan, M.A.; Asmild, M. Efficiency and production environmental heterogeneity in aquaculture: A meta-frontier DEA approach. Aquaculture 2019, 509, 140–148. [Google Scholar] [CrossRef]
- Gao, J.J.; Shi, Q.H.; Lu, K. Study on technical efficiency evaluation of Chinese marine aquaculture. Agrotech. Econ 2018, 1, 132–144. [Google Scholar]
- Liu, W.; Chen, Y.; Zou, S. Total Factor Productivity Analysis of Agriculture in Hunan Province Based on Super Efficiency DEA and Malmquist Index. J. South China Univ. (Soc. Sci. Ed.) 2015, 16, 52–57. [Google Scholar]
- Zhang, Y.; Zhang, J.; Liang, Y.; Li, H.; Li, G.; Chen, X.; Zhao, P.; Jiang, Z.; Zou, D.; Liu, X.; et al. Carbon sequestration processes and mechanisms in coastal mariculture environments in China. Sci. China-Earth Sci. 2017, 60, 2097–2107. [Google Scholar] [CrossRef]
- Ren, W.; Zeng, Q. Is the green technological progress bias of mariculture suitable for its factor endowment? Empirical results from 10 coastal provinces and cities in China. Mar. Policy 2021, 124, 104338. [Google Scholar] [CrossRef]
- Ji, J.; Sun, Y.; Yin, X. Study on green output bias of China’s mariculture technological progress. Environ. Sci. Pollut. Res. 2022, 29, 60558. [Google Scholar] [CrossRef]
- Ji, J.; Liu, L.; Xu, Y.; Zhang, N. Spatio-Temporal Disparities of Mariculture Area Production Efficiency Considering Undesirable Output: A Case Study of China’s East Coast. Water 2022, 14, 324. [Google Scholar] [CrossRef]
- Jianyue, J.; Pingping, W. Research on China’s aquaculture efficiency evaluation and influencing factors with undesirable outputs. J. Ocean. Univ. China 2015, 14, 569–574. [Google Scholar] [CrossRef]
- Wang, X.; Cuthbertson, A.; Gualtieri, C.; Shao, D. A Review on Mariculture Effluent: Characterization and Management Tools. Water 2020, 12, 2991. [Google Scholar] [CrossRef]
- Zheng, L.; Liu, Q.; Liu, J.; Xiao, J.; Xu, G. Pollution Control of Industrial Mariculture Wastewater: A Mini-Review. Water 2022, 14, 1390. [Google Scholar] [CrossRef]
- Zhou, X.; Fang, J.; Shi, S.; Yang, L.; Xie, B.; Huang, L. Ecosystem Services of Ecosystem Approach to Mariculture: Providing an Unprecedented Opportunity for the Reform of China’s Sustainable Aquaculture. Front. Mar. Sci. 2022, 9, 909231. [Google Scholar] [CrossRef]
- Yu, J.; Yin, W. Exploring stakeholder engagement in mariculture development: Challenges and prospects for China. Mar. Policy 2019, 103, 84–90. [Google Scholar] [CrossRef]
- Bouwman, L.; Beusen, A.; Glibert, P.M.; Overbeek, C.; Pawlowski, M.; Herrera, J.; Mulsow, S.; Yu, R.; Zhou, M. Mariculture: Significant and expanding cause of coastal nutrient enrichment. Environ. Res. Lett. 2013, 8, 044026. [Google Scholar] [CrossRef]
- Liu, O.R.; Molina, R.; Wilson, M.; Halpern, B.S. Global opportunities for mariculture development to promote human nutrition. PeerJ 2018, 6, e4733. [Google Scholar] [CrossRef] [PubMed]
- Xu, J.; Han, L.; Yin, W. Research on the ecologicalization efficiency of mariculture industry in China and its influencing factors. Mar. Policy 2022, 137, 104935. [Google Scholar] [CrossRef]
- Chand, A. Mariculture boosts supply under climate change. Nat. Food 2022, 3, 304. [Google Scholar] [CrossRef]
- Del Valle, T.M.; Wu, J.; Xu, C.; Chen, Q.; Wu, Y.; Yang, W. Spatiotemporal dynamics and resource use efficiency in mariculture production: A case study in Southeastern China. J. Clean. Prod. 2022, 340, 130743. [Google Scholar] [CrossRef]
- Wu, J.; Del Valle, T.M.; Ruckelshaus, M.; He, G.; Fu, Y.; Deng, J.; Liu, J.; Yang, W. Dramatic mariculture expansion and associated driving factors in Southeastern China. Landsc. Urban Plan. 2021, 214, 104190. [Google Scholar] [CrossRef]
- Sun, Y.; Ji, J. Measurement and analysis of technological progress bias in China’s mariculture industry. J. World Aquac. Soc. 2022, 53, 60–76. [Google Scholar] [CrossRef]
- Armbrecht, J.; Skallerud, K. Attitudes and intentional reactions towards mariculture development-local residents’ perspective. Ocean. Coast. Manag. 2019, 174, 56–62. [Google Scholar] [CrossRef]
- Guo, L.; Lawrence, M.; Hu, X.M. Empirical study on the influence of environmental techonology innovation to eco-industrial management. Zhongguo Renkou Ziyuan Yu Huan Jing. China Popul. Resour. Environ. 2009, 19, 78–82. [Google Scholar]
- Liang, Y.X.; Cheng, X.W.; Zhu, H.; Shutes, B.; Yan, B.X.; Zhou, Q.W.; Yu, X.F. Historical Evolution of Mariculture in China During Past 40 Years and Its Impacts on Eco-environment. Chin. Geogr. Sci. 2018, 28, 363–373. [Google Scholar] [CrossRef]
- Wang, Z.S.; Yu, J.; Zhang, A.J.; Chen, Y.; You, F. Study on spatial-temporal evolution and site selection of seafood processing enterprises in Weihai City. Mar. Dev. Manag. 2023, 40, 67–71. [Google Scholar]
- Lin, Z.F. Analysis of the Current Situation and Countermeasures of Marine Aquaculture in Weihai. Rural. Econ. Technol. 2022, 33, 83–86. [Google Scholar]
- Su, M.; Yang, Y. Evolution of district marine policies in China: The case of Shandong Province. Mar. Policy 2018, 89, 124–131. [Google Scholar] [CrossRef]
- Leng, J.Y. Analysis and Countermeasures of the Current Situation of Marine Aquaculture Industry in Weihai City. Urban Rural. Soc. Obs. 2016, 27–38. Available online: https://xueshu.baidu.com/usercenter/paper/show?paperid=b0dfe0fcac3f45be54d2c24d7697774e&site=xueshu_se (accessed on 1 December 2024).
- Xiang, C.H.; Dong, J.J.; Hou, S.Y.; Dong, H.W.; Liu, Z.H. The Current Situation and Development Countermeasures of Carbon Sequestration Fishery in Weihai City. China Fish. 2017, 6, 42–44. [Google Scholar]
- Wang, Y.T. Efficiency Analysis of Marine Aquaculture in Weihai City. Rural. Econ. Technol. 2024, 35, 63–65+96. [Google Scholar]
- Qu, Y. A Brief Analysis on the Development Countermeasures of Seawater Aquaculture in Yantai City. Fish. Econ. 2015, 35, 83–88. [Google Scholar]
- Shen, X. An Empirical Analysis of the Production Efficiency of Seawater Aquaculture in Dalian Based on Malmquist Index. Fish. Res. 2016, 34, 98–103. [Google Scholar]
- Wang, J.; Jian, C.M. An Empirical Analysis of the Production Efficiency of Seawater Aquaculture in Coastal Cities Based on DEA Model. Agric. Econ. 2018, 34, 98–103. [Google Scholar]
- Zhang, T.H.; Liu, L.X.; Liu, J. Research on the Ecological Efficiency of Marine Fisheries Based on Three-stage DEA Model: A Case Study of Qingdao, Yantai and Weihai. Fish. Res. 2020, 42, 544–555. [Google Scholar] [CrossRef]
- Dong, E.H.; Li, C.W.; Liu, J.G.; Zhang, Y.; Chen, Y.Y.; Jiang, K.S. Evaluation Research on the Operating Efficiency of China’s West African Offshore Fisheries Based on DEA Model. Chin. Fish. Econ. 2021, 39, 110–118. [Google Scholar]
- Yu, J.; Yu, J. Evolution of Mariculture Insurance Policies in China: Review, Challenges, and Recommendations. Rev. Fish. Sci. Aquac. 2021, 29, 566–581. [Google Scholar] [CrossRef]
- O’Leary, B.C.; Smart, J.C.R.; Neale, F.C.; Hawkins, J.P.; Newman, S.; Milman, A.C.; Roberts, C.M. Fisheries mismanagement. Mar. Pollut. Bull. 2011, 62, 2642–2648. [Google Scholar] [CrossRef] [PubMed]
- Yu, L.; Zheng, S.; Gao, Q. Government environmental regulation strategy for new pollutants control in mariculture. Mar. Policy 2023, 150, 105545. [Google Scholar] [CrossRef]
- Yu, J.; Yin, W.; Liu, D. Evolution of mariculture policies in China: Experience and challenge. Mar. Policy 2020, 119, 104062. [Google Scholar] [CrossRef]
- Wang, Y.; Wang, N. The role of the marine industry in China’s national economy: An input-output analysis. Mar. Policy 2019, 99, 42–49. [Google Scholar] [CrossRef]
- Karp, M.A.; Link, J.S.; Grezlik, M.; Cadrin, S.; Fay, G.; Lynch, P.; Townsend, H.; Methot, R.D.; Adams, G.D.; Blackhart, K.; et al. Increasing the uptake of multispecies models in fisheries management. Ices J. Mar. Sci. 2023, 80, 243–257. [Google Scholar] [CrossRef]
- Ji, J.Y.; Xu, Y.; Li, Y.M. Efficiency measurement and influencing factors analysis of green technology in China’s aquaculture waters. Res. Technol. Manag. 2021, 41, 205–212. [Google Scholar]
- Tang, W.; Huang, L.; Jiang, Y.Y.; Fan, Y.M.; Liu, Y. Dynamic Evolution and Convergence Analysis of the Ecological Efficiency of China’s Fisheries. Fishes 2023, 8, 499. [Google Scholar] [CrossRef]
- Chen, Y.M.; Ye, M.; Yang, W.; Sun, Z.F.; Han, Y. How to improve fishery eco-efficiency by building marine ranch in China. Front. Sustain. Food Syst. 2024, 8, 1401842. [Google Scholar] [CrossRef]
- Zhu, W.D.; Sun, W.H.; LI, D.H.; Han, L.M. Spatial-Temporal Characteristics and Influencing Factors of Marine Fishery Eco-Efficiency in China: Evidence from Coastal Regions. Fishes 2023, 8, 438. [Google Scholar] [CrossRef]
- Zheng, L.; Wang, H.; LV, F. Study on the Measurement and Influencing Factors of Fishery Economic Efficiency in China-Environmental Perspective. J. Coast. Res. 2019, 94, 701–706. [Google Scholar] [CrossRef]
- Tanguan, H.; Sun, Z.; Wang, J. Decoupling Analysis of Net Carbon Emissions and Economic Growth of Marine Aquaculture. Sustainability 2022, 14, 5886. [Google Scholar] [CrossRef]
- Yuan, X.T.; Zhang, S.L. The self-pollution of the bottom sowing breeding area of Philippine clam in Zhuanghe Sea area. Chin. J. Appl. Ecol. 2011, 22, 785–792. [Google Scholar]
- Jiang, Z.B.; Zeng, J.N.; Chen, Q.Z. Bioremediation of macroalgae in eutrophic mariculture area. Mar. Dev. Manag. 2006, 7, 57–63. [Google Scholar]
- Chen, Y.B.; Song, G.B.; Zhao, W.X. Estimation of Pollution Load from Marine Aquaculture in China. Mar. Environ. Sci. 2016, 35, 1–6. [Google Scholar]
- Zong, H.M.; Yuan, X.T.; Wang, L.J. Preliminary assessment of nitrogen and phosphorus production in China’s marine aquaculture industry. Mar. Environ. Sci. 2017, 36, 336–342. [Google Scholar]
- Yang, D.; Wang, Q. Evaluation of China’s Marine Aquaculture Sector’s Green Development Level Using the Super-Efficiency Slacks-Based Measure and Global Malmquist-Luenberger Index Models. Sustainability 2024, 16, 3441. [Google Scholar] [CrossRef]
- Sun, L.Q.; Yang, Z.Y.; Wang, Q.; Peng, L.W.; Zhang, Z.Y.; Liu, D.; Li, S. Evaluation of the green development efficiency of marine fish culture in China. Front. Sustain. Food Syst. 2023, 7, 1274224. [Google Scholar] [CrossRef]
- Wang, W.; Mao, W.; Wu, R.H.; Zhu, J.Z.; Yang, Z.B. Research on Efficiency of Marine Green Aquaculture in China: Regional Disparity, Driving Factors, and Dynamic Evolution. Fishes 2024, 9, 11. [Google Scholar] [CrossRef]
- Wang, W.; Mao, W.; Wu, R.H.; Zhu, J.Z.; Yang, Z.B. Study on the Spatial Imbalance and Polarization of Marine Green Aquaculture Efficiency in China. Water 2024, 16, 273. [Google Scholar] [CrossRef]
- Ji, J.; Li, Y. The development of China’s fishery informatization and its impact on fishery economic efficiency. Mar. Policy 2021, 133, 104711. [Google Scholar] [CrossRef]
| Disclaimer/Publisher’s Note: The statements, opinions and data contained in all publications are solely those of the individual author(s) and contributor(s) and not of MDPI and/or the editor(s). MDPI and/or the editor(s) disclaim responsibility for any injury to people or property resulting from any ideas, methods, instructions or products referred to in the content. |
© 2025 by the authors. Licensee MDPI, Basel, Switzerland. This article is an open access article distributed under the terms and conditions of the Creative Commons Attribution (CC BY) license (https://creativecommons.org/licenses/by/4.0/).


