Abstract
With the energy transition, energy supply trends indicate more autonomy for the final consumer, with a more decentralized, intelligent, and low-carbon scenario. Multigeneration technologies offer substantial socioeconomic and environmental advantages by enhancing the efficient utilization of energy resources. The main objective of this study is to develop a flexible, easy-to-use tool for the optimization of multigeneration systems (configuration and operation), focused on obtaining minimal annual costs. C++ was used for the implementation of the optimization problem, which was solved using IBM’s ILOG CPLEX Optimization Studio solver. The case study is a residential consumer center, with energy demands encompassing electricity (including electric vehicles), sanitary hot water, and coolth (air conditioning). The optimal economic solution indicates the installation of 102 photovoltaic modules and the use of biomass to produce hot water. When compared with a conventional solution, where all energy demands are met conventionally (no renewables nor cogeneration), the optimal economic solution reduced annual costs by 27% despite presenting capital costs 42% higher.
1. Introduction
Discussions on energy transition and the use of renewables have advanced worldwide [1] and are associated with significant changes in the structure of the global primary energy matrix. The new energy supply scenario is a more decentralized, intelligent, low-carbon model offering the final consumer more autonomy. There has been growing interest in developing reliable and adaptable energy integration systems [2], while addressing the challenge of balancing power generation and consumption remains particularly complex when renewables are present [3].
In this energy transition context, the building sector is responsible for 30% of global final energy consumption and contributes to 27% of total energy-related emissions worldwide [4]. In Brazil, the building sector (comprised of residential, commercial, and public consumers) accounts for approximately 1/6 of energy and 50% of electricity consumption [5]. In the USA, these figures amount to 40% of total energy use, including 75% of national electricity consumption and 35% of emissions [6].
Considering technological innovations and the efficient use of energy resources, the development and application of high-performance multigeneration technologies (combined energy production) should be the focus of this new energy scenario. The transition to sustainable and more renewable energy alternatives is increasingly critical to address and mitigate the escalating environmental challenges [7]. Multigeneration can employ conventional (fossil-fuel-based) and renewable energy sources and supports hybridization [8].
Multigeneration technologies offer significant socioeconomic and environmental benefits by enabling the efficient utilization of energy resources [9]. Overall system efficiency can be substantially enhanced through the optimized system design and effective integration of subsystems. Furthermore, the utilization of alternative fuels can enhance resource efficiency through appropriate fuel switching or blending with conventional fuels [10]. Implementing multigeneration systems is still a complex problem and is often restricted to studies in academic environments or implementation in isolated systems. Although the optimization of the energy supply is frequently adopted when there is a wide variety of energy resources available, the possibility of energy conversion within the energy system creates the need to optimize the design while considering internal energy flows. The number of parameters, variables, and restrictions involved results in high computational complexity. Among the convex optimization methods available for optimization, Mixed-Integer Linear Programming (MILP) is the most widely utilized approach due to its simplicity, convex nature, and capability to handle diverse energy flow scenarios [11]. Wirtz et al. [12] reported that the lowest total annual costs were achieved using MILP models with part-load efficiencies (despite reaching the highest computation times).
Souza et al. [13] employed MILP within the synthesis and optimization of an energy supply system for a set of nine buildings in Italy. The optimization model considered the possibility of sharing energy flows between the buildings (self-produced and imported electricity from the grid, as well as heating and cooling). The optimal solution reduced 31.9% of the total annual costs. Algieri et al. [14] focused on synthesizing and operating a multigeneration energy system for a residential complex in northern Italy, including solar photovoltaic (PV) modules and thermal energy storage units. A MINLP (Mixed-Integer Nonlinear Programming Model) was formulated with a bi-objective function (economic and environmental). All suggested optimal multigeneration configurations reduced total costs and carbon emissions compared to a conventional energy system. In addition, primary energy savings of over 19.7% were achieved, with payback times between 3.8 and 8.1 years.
Pinto et al. [15] proposed an approach for the design of multigeneration systems for residential buildings based on a MILP model that considered different constraints that allowed the energy system to function as a microgrid. The substitution of batteries with alternative energy storage systems to achieve more cost-effective solutions was emphasized. Pina et al. [16] evaluated the influence of legal conditions on the integration of renewable energy technologies in multigeneration systems for buildings. The optimization model incorporated various regulatory conditions, such as energy exchange mechanisms, subsidies and surcharges on energy prices, and investment costs, as well as a complete prohibition on fossil fuel usage. The model was applied to a Brazilian hospital, taking into account the current net energy metering framework established by Brazilian legislation. Natural gas cogeneration emerged as an effective solution to meet the hospital’s energy requirements, both with and without an electricity export to the grid. It was verified that the compensation scheme adopted by Brazilian legislation, by itself, is not enough to guarantee the deployment of renewable energy.
Pinto and Amante [17] focused on optimizing a polygeneration system for a building energy system retrofit, using MILP and maximizing the Net Present Value of the system. Different technologies were available in the superstructure, with the optimal solution including 2nd-life Li-Ion batteries, PV panels, and cogeneration modules. Martin et al. [18] highlighted the versatility of MILP in addressing comprehensive optimization models that tackle complex retrofit challenges and used a MILP model with a French open database to optimize retrofit solutions for different buildings. The study stresses accelerating building renovations to meet progressively more stringent environmental goals.
The study presented herein develops a MILP in C++, using the CPLEX solver to optimize the annual cost of a generic multigeneration system installed in a residential building. The configuration with the lowest yearly costs is obtained based on commercially available technologies and resources. This study goes further than existing studies by presenting an interface, which the end users of multigeneration systems can operate. Solar PV panels and collectors are available to produce electricity and hot water. The energy system accommodates electricity demand for electric vehicles and informs the excess photovoltaic electricity produced. There is also the possibility of using a fuel cell to produce electricity. The system is analyzed within Law 14,300 [19], which establishes the legal framework for distributed microgeneration and minigeneration, the Electric Energy Compensation System, and the Social Renewable Energy Program in Brazil.
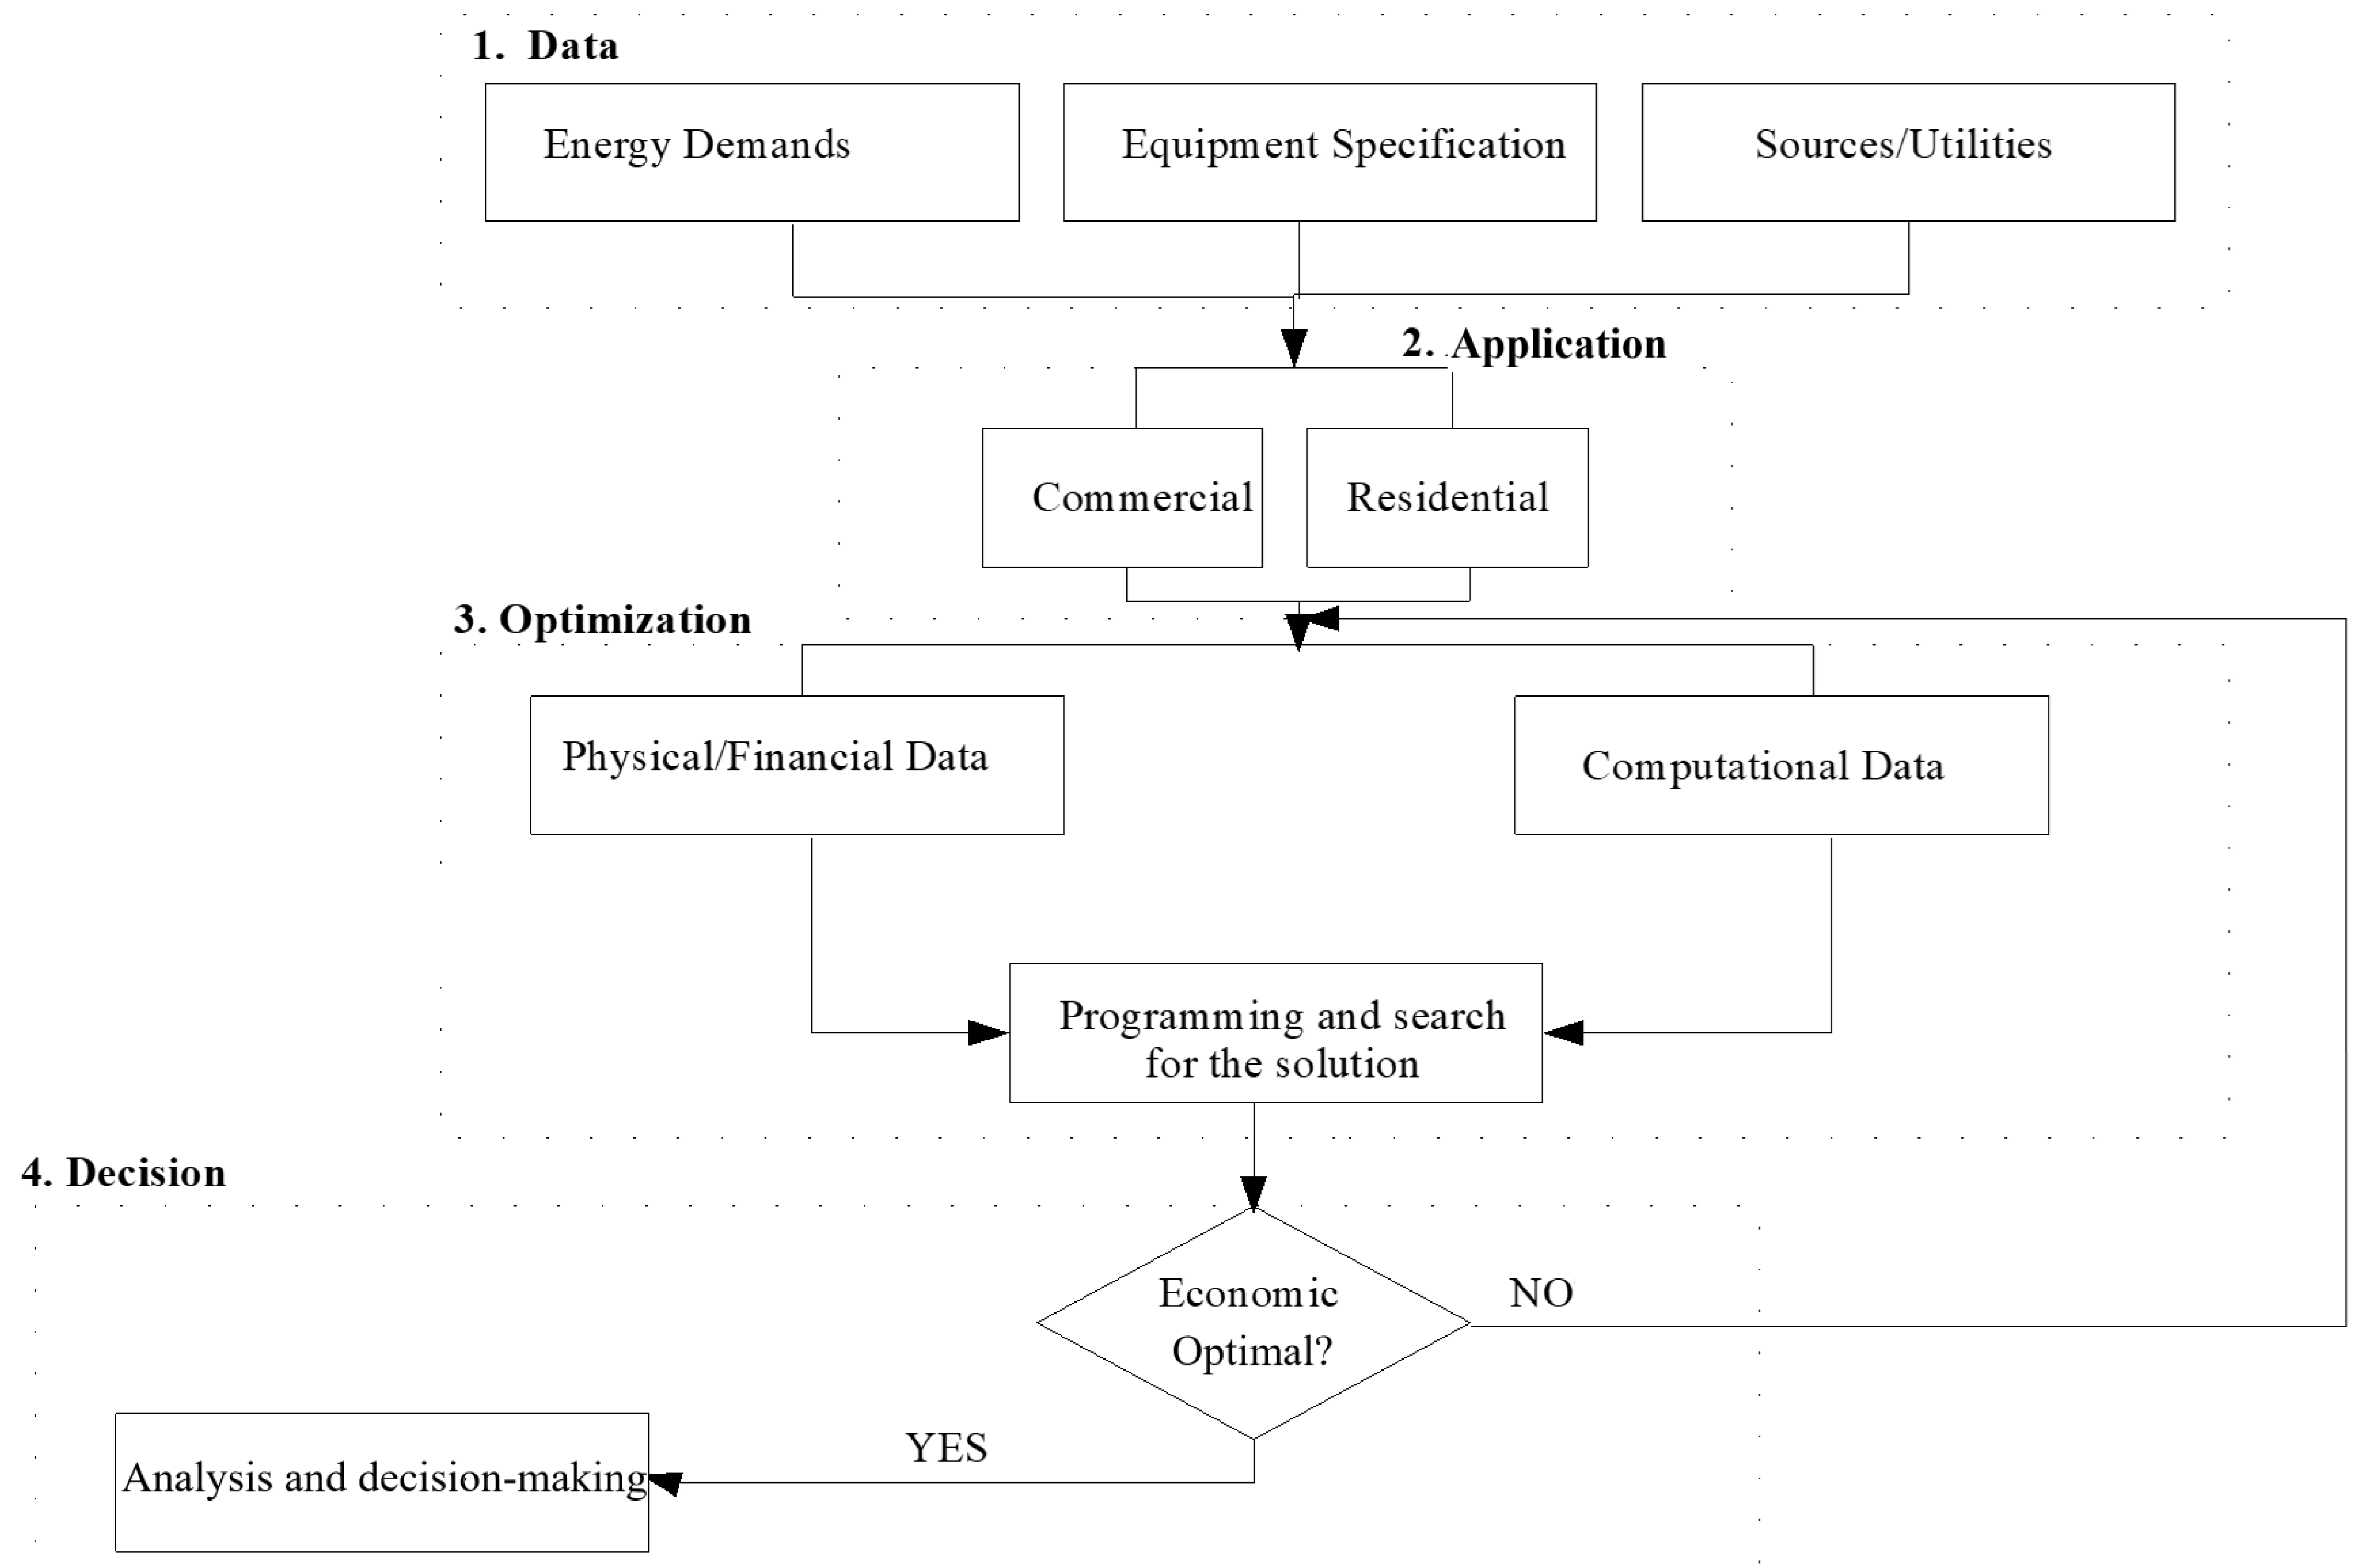
2. Material and Methods
2.1. Energy Demands
The case study focuses on a 30-story residential building located in João Pessoa, Northeast Brazil. The building’s energy demands include electricity, hot water, and cooling (air conditioning). The characterization of electricity demands was conducted following the Brazilian standard ABNT NBR 5410:2004 [20], which specifies lighting loads based on room area, electrical outlet dimensions based on the room perimeter, and active power requirements for equipment such as elevators, pool pumps, and water reservoirs. Demand factors were applied in accordance with the guidelines of the local electricity utility [21]. Hot water demands were determined based on the daily useful energy requirements (kWh/day), following Brazilian standard ABNT NBR 15569:2021 [22]. Cooling loads were estimated using the degree-day method [23], assuming daily air-conditioning usage in apartment units from 9 pm to 7 am (on both weekdays and weekends). The reception area (front desk) maintained 24 h air-conditioning operation, while the party room required cooling only between 4 p.m. and 10 p.m. on weekends. An electric vehicle charging station was also included in the analysis, operating 24 h a day with the capacity to charge two vehicles simultaneously, twice daily, at a rate of 22 kW per charge.
The analysis was conducted using two representative days per month: one for weekdays and one for weekends/holidays. Each day was divided into 24-hourly periods, resulting in a total of 576 hourly periods. The building’s annual energy demands were calculated as 747.74 MWh/year for electricity, 330.34 MWh/year for hot water, and 85.37 MWh/year for cooling.
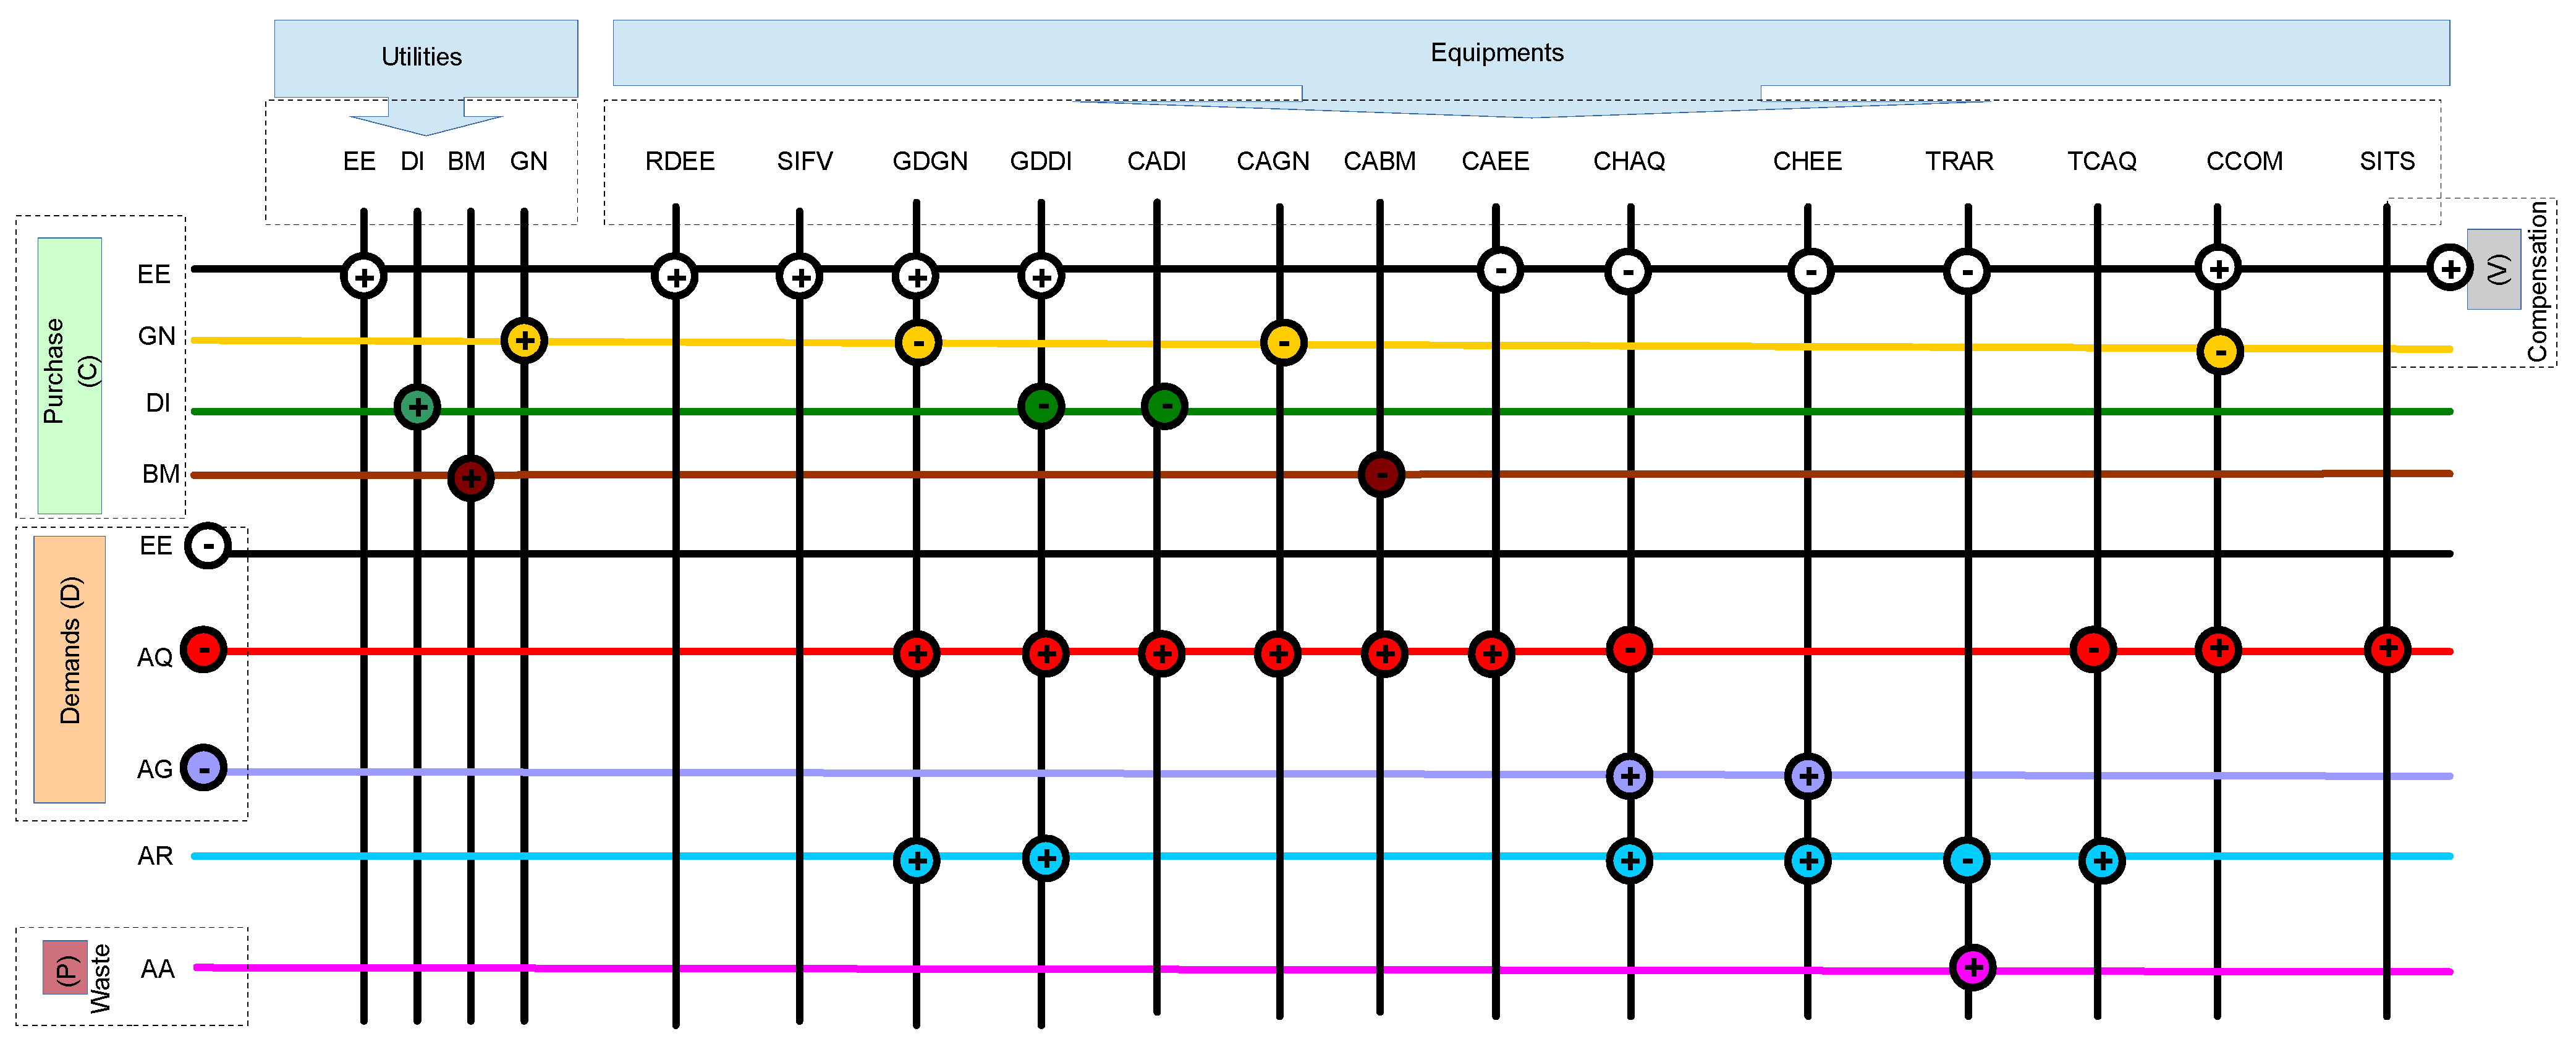
2.2. Superstructure and Equipment Specification
The superstructure includes all possible technologies, available energy resources, and their interactions. Equipment is included in the superstructure based on the energy demands of the residential building, considering commercially available technologies. Figure 1 illustrates the superstructure considered herein. A positive node indicates energy production (supply), and a negative node indicates consumption. Horizontal lines refer to physical distribution systems into which the equipment (the vertical lines) can supply or consume.
Figure 1.
Superstructure.
On the left side of Figure 1, the green box indicates the energy resources available for purchase. For example, EE is Electricity, which can be produced (+) or consumed (−) by equipment. Also, on the left side of Figure 1, the orange box indicates the energy demands of the building. The upper section of Figure 1 shows the available resources and equipment. Electricity generated by the PV system can be exported to the electric grid, following Brazilian law [19]. Table 1 and Table 2 summarize the utilities and technologies available on site.
Table 1.
Utilities and energy demands.
Table 2.
Technologies available.
Technical parameters of the equipment were obtained from equipment data sheets and are displayed in Table 3, along with costs. Appendix A presents detailed equipment data. Capital costs were obtained from consultation with manufacturers, and operation and maintenance (O&M) costs were obtained from the Brazilian National Research System on Civil Construction Costs and Indices [24].
Table 3.
Technical production coefficients and costs of equipment.
Direct price surveys were carried out to obtain the tariffs for the energy services. The location used as a reference for the case study was the city of João Pessoa. For biomass (sugarcane bagasse), the value of Delgado et al. [25] was used (BRL 78/MWh), and, for diesel, the value used was BRL 743.46/MWh [26].
The electricity tariff for the residential consumer unit is BRL 356.61/MWh, a conventional flat tariff throughout the day [27]. For natural gas, the tariff is BRL 451.38/MWh [28], which is also a flat tariff.
2.3. Modeling and Programming
The model was implemented using C++, a high-performance programming language chosen for its ability to handle complex calculations and large data volumes efficiently, as the proposed problem requires. In energy optimization, using C++ offers advantages such as enabling the development of customized algorithms and direct integration with optimization libraries like CPLEX, facilitating the resolution of highly complex problems.
The flowchart in Figure 2 presents the required steps and the sequence of the modeling of the multigeneration system, as well as the requirements for programming and optimization.
Figure 2.
Flowchart for modeling and optimization of the multigeneration system.
IBM® ILOG® CPLEX® Optimization Studio v20.1 [29] was employed, a decision optimization software for building and solving complex optimization models. The solution provides the results of an economic analysis, specifying the optimal configuration, including the type and quantity of equipment to install, as well as the operational strategy required to achieve minimal annual costs. All input data were organized into spreadsheets, with separate sheets for energy demand, a list of technical coefficients, investment, maintenance, and operational costs, and a third sheet for tariff information.
The economic objective function is the minimization of total annual costs (Ctotal), comprising fixed annual costs (Cfix, capital costs) and variable costs (Cvar), which include the costs of purchasing of energy resources and O&M costs, as shown in Equations (1)–(3).
The fixed costs consider the capital recovery factor (frc = 0.13) and an indirect cost factor (fci = 0.15). i refers to the capital cost and y to the number of installed equipment. t is the type of equipment. SisFV and SisTS refer to the capital costs of the solar PV and thermal systems.
Within the variable costs, m, r, and h refer to, respectively, month, representative day, and hour. ct refers to the cost of technology t in reais (Brazilian currency), and xmrht indicates the use of technology t during month m, day r, and hour h (measured in hours). is the cost of technology maintenance cost t in reais (Brazilian currency), and Qmrhnt is the excess of utility n used by technology i during month m, day r, and hour h (measured in hours).
The operational limits of the system are implemented as restrictions in production, capacity, and energy balance equations. For each time period, energy production is restricted to the installed capacity, and an energy balance must be followed for each utility n, as shown in Equation (4).
In Equation (4), S, P, E, C, D, and W represent Purchase, Production, Excess, Consumption, Demand, and Waste, respectively, for utility n in month m, day r, and time h.
The restriction expressed by Equation (5) guarantees that all energy demands are met because production must be greater than the sum of demand and consumption. indicates the production of utility n by technology t.
The restriction shown in Equation (6) indicates that the excess of a utility in a specific hour is the difference between the production and consumption of equipment.
Equation (7) guarantees that the total amount of an internally used utility (consumption and demand) cannot be higher than the excess produced. indicates the used excess of utility n in month m, day r, and hour h by technology i.
Equation (8) limits the excess used by a piece of equipment. is how much, proportionally, technology t uses of n.
Equation (9) indicates that the maximum number of equipment installed must be equal or higher than the amount of equipment used at any time. is the maximum amount of technology t used.
The restrictions shown in Equations (10)–(14) define the nature of the decision variables.
3. Results and Discussion
A reference system is defined to serve as a basis for comparison in which the optimization is restricted. No renewable energy sources or combined energy scheme can be installed in the reference system. The only technologies and utilities allowed are conventional: electric grid, natural gas and diesel boilers, heat exchangers, mechanical chiller, and cooling tower.
The optimal economic system is determined through unrestricted optimization, utilizing all the utilities and technologies available within the superstructure. The optimization results are presented in Table 4.
Table 4.
Economic optimization results for the residential building.
The reference system relies on purchasing electricity from the grid to directly meet the electricity demands. Hot water and cooling demands are also satisfied by grid electricity through the use of an electric boiler and mechanical chiller.
The optimal economic solution recommends the installation of 102 PV panels but excludes the use of thermosolar collectors for hot water. Additionally, fuel cells are not incorporated into the system. Biomass is purchased to produce hot water in a boiler due to its low cost.
Although the optimal system requires a higher initial investment in equipment (41.69% higher capital costs), it results in a 27.02% reduction in total annual costs compared to the reference system (which separately produces energy services). The installation of PV panels leads to a 22.27% reduction in electricity imported from the grid.
Considering that the overarching aim of the program was to provide flexibility and ease of use, the optimization model can also provide other information. It is possible to visualize the hourly and monthly operation of the system (which equipment operates, the consumption of utilities, O&M costs, etc.). The graph in Figure 3 presents the monthly costs associated with the purchase of utilities throughout one year for the reference and optimal systems of the residential building.
Figure 3.
Monthly utility costs for reference and optimal systems.
It is also possible for the user to know which pieces of equipment are operating and the hourly associated costs, as shown in the graphs of Figure 4 and Figure 5. This presentation enables a more specific analysis and helps to decide O&M conditions, such as the replacement of equipment or maintenance stops.
Figure 4.
Hourly configuration of equipment for the optimal system for the weekdays in January.
Figure 5.
Hourly system cost for weekdays throughout the year.
Figure 4 shows that the PV system does not fully meet the energy demands of the optimal economic solution. This is represented by the blue bars that only appear between 6 a.m. and 6 p.m., with a small contribution. Electricity must still be purchased from the electric grid (brown bars) throughout the day.
The graph in Figure 5 shows that from 5 p.m. to 10 p.m., the hourly cost of equipment and utilities is higher, coinciding with the peak of demand and the absence of PV solar energy generation after 6 p.m.
3.1. Sensitivity Analysis
Some uncertainties and external influences can affect the multigeneration system, which is subject, for example, to fluctuations in equipment and fuel prices, increases in the energy demands of the consumer center, and changes in the regulatory model.
In this context, sensitivity analyses can simulate scenarios where changes occur in the variables representing the uncertainties.
The sensitivity analyses verify the impacts of changes in electricity tariffs, fuel prices (natural gas, diesel, and biomass), and increases in energy demands.
3.1.1. Electricity Demands
This sensitivity analysis considered an increase in electricity demands. This analysis is based on the Brazilian ten-year energy expansion plan 2032 [30], which predicts an average annual growth of 3.2% between 2022 and 2032 for electricity consumption in the residential sector. Table 5 presents the optimization results for variations in the energy demand of the residential unit. It must be highlighted that the only parameter that changed in the optimization model was the electricity demand.
Table 5.
Optimization results for variations in residential electricity demands.
Considering the percentage predicted by the Brazilian ten-year energy expansion plan, the gradual and linear increase in electricity demand in the residential building did not significantly change the configuration of the optimal system. There is an increase of 21.27% in the total annual cost of the system due to the installation of additional PV panels.
3.1.2. Electricity Tariff
This analysis considers a −20% to +20% variation in the electricity tariff (originally BRL 356.61/MWh). The most sensitive parameters to changes in the energy tariff are the electricity imported from the grid and the annual cost of electricity. The equipment installed in the optimal system remained, except for the PV system that is not installed when the electricity tariff is BRL 338.78/MWh. Additional PV panels are also required.
The sensitivity of the system was similar to when electricity demands increased. PV generation is installed when the electricity tariff is higher, benefitting from its low O&M costs.
3.1.3. Natural Gas and Diesel Tariffs
According to the Brazilian Ten-Year Energy Expansion Plan [30], the diesel tariff should decrease throughout 2023/2024 but remain at high levels throughout the ten-year period. The natural gas price projections estimated in the study do not foresee a significant increase in the price of natural gas.
When varying the tariffs of natural gas and diesel between −20% and +20% around the base case, there were no changes in the optimal solutions. The model did not include gas or diesel technology and maintained the structure presented in the optimal solution with the original tariff.
3.1.4. Biomass Price
The biomass price varied between −20% and +20% around the base case. The optimal system for the residential building is not very sensitive to variations in the cost of biomass for the range of values considered. The base price of biomass led to the installation of a biomass boiler instead of the solar thermal system for water heating. When biomass price reached BRL 225.00/MWh, which is a 65.33% increase in its price, the optimal configuration changed, and 70 solar collectors were installed to produce hot water.
3.1.5. Change in Equipment
This section considers that the biomass boiler is no longer available. The results of the optimization are shown in Table 6.
Table 6.
Results of the optimization with and without the biomass boiler.
Table 6 shows that in the absence of the biomass boiler for hot water production, the economic optimization resulted in installing an electric boiler, a single-effect absorption chiller, and 70 solar collectors. In this configuration, the annual cost increases by 13.65%.
Comparing our results with those of Melo et al. [31], who did not consider renewable resources, it is observed that including commercially available equipment that uses renewable resources is interesting from an economic point of view. In [31], only traditional electrical equipment was installed, and herein the biomass hot water boiler and solar PV panels were installed to achieve an economic optimal solution. The system implemented by Melo et al. [31] did not allow new equipment and utilities to be inserted flexibly and dynamically.
Pinto et al. [15] addressed the synthesis and optimization of the operation of polygeneration systems for residential buildings in Spain, integrating renewable and thermal energy technologies and electricity storage. Given the critical conditions imposed by local regulations, economic and environmental aspects were the main objectives. A MILP model was explicitly developed to research these aspects, and thermoeconomic analysis was applied to analyze and uncover the synergies and interactions between the system components. The multi-objective optimization problem was solved by LINGO. Unlike the approach proposed herein, the analysis carried out focused on the economic viability of the multigeneration system as a microgrid functioning in two ways: connected to the conventional grid or autonomously. Legal and regulatory aspects were not considered herein.
The work of Mohammadi and Mohammadi [32] used MILP within MATLAB and considered different operating strategies, objective functions, and components. The optimization focused on technical and efficiency aspects. The results demonstrated that the optimal solution could reduce the total annual costs by up to 62.5%, with consequent reductions in emissions of 14. 9%, compared to separate conventional generation. The study did not include renewable resources, electric mobility demand, or analyses based on current regulatory models. Jeon and Bae [33] studied the integration of hybrid energy storage into renewable power systems in Korea. The authors used MILP to establish the optimal configuration and operation of the hybrid energy storage system while minimizing operation costs. The optimal solution achieved a reduction of at least 50% in operation costs, outperforming previous studies by the authors, particularly excelling in cost performance.
Considering that the model developed herein for the optimization problem aims to be more flexible than existing solutions, it was tested to generate other information with the optimal result to assist the end user in decision-making. For temporal analyses of the optimal conditions with a period of less than one year, the model enables the visualization of the hourly and monthly dynamics of the system (utility consumption, maintenance cost, equipment used, etc.).
Regarding the selection of CPLEX for optimization, although Gurobi is also a popular tool for solving optimization problems in energy systems, there are distinct advantages depending on the specific requirements of the task (e.g., computational performance, ease of use, or integration capabilities). CPLEX is renowned for its strong performance in Linear Programming (LP) and MILP problems, frequently employed in optimizing energy systems. CPLEX also provides a highly intuitive graphical interface that simplifies the model creation, debugging, and visualization of results. CPLEX offers seamless integration with the IBM Ecosystem, especially with IBM Decision Optimization. Finally, robust CPLEX licensing options exist for researchers and academic institutions, making it an attractive choice for academic energy system studies.
Some challenges arise in the search for the best way to use these multigeneration systems. In addition to the search for optimization, democratization and the intelligent use of data, given its complexity, are important parameters to consider.
In the energy transition process, although Brazil has a favorable energy matrix due to the wide availability of renewable resources, public policies have sought to encourage the use of more decarbonized sources, following a global trend. Some pillars that guide this transition are the sustainability of expansion, incentives for efficiency, and the search for the lowest overall cost [34]. In this context, multigeneration systems emerge to provide a versatile, efficient, and economical solution to meet the demands of different consumer centers.
4. Conclusions
The study presented herein focused on synthesizing and optimizing an energy supply system for a residential building in Northeast Brazil. The contribution of this study is the consideration of solar energy (PV panels and solar collectors), fuel cell, and biomass as available energy resources. Electricity demands for an electric vehicle were also present. Also, the optimization model was built as a stand-alone program that relies on spreadsheets.
The optimal economic system consumed electricity from the grid and installed 102 PV panels. A biomass boiler was also installed, along with a mechanical chiller. Compared with a conventional separate energy production, the optimal economic solution presented a reduction of 27.02% in the total annual cost. The capital costs were 41.69% higher, but 22.27% less electricity was imported from the grid in the optimal solution.
Regarding the sensitivity analyses, more PV panels were installed when the electricity tariff reached BRL 374.44/MWh. When the price of biomass skyrocketed to BRL 225.00/MWh, thermosolar collectors were finally installed to produce hot water. Changes in diesel and natural gas tariffs did not impact the optimal solution. Changes in energy demands (following predicted growth trends by the Brazilian government) did not significantly change the system’s configuration but caused an increase of 21.27% in the total annual cost of the system (in 2032) due to the installation of additional PV panels. When the biomass boiler was unavailable for installation, 70 thermosolar collectors and a single-effect absorption chiller were part of the optimal solution. In this configuration, the annual cost increases by 13.65%.
The optimization presented herein achieved a significant reduction in the system’s total cost, enabling the insertion of other technologies with renewable resources to meet the energy demands of the building. Suggestions for future work include considering energy storage technologies in the superstructure and formulating a scheme to accommodate the energy credits from surplus production, following Brazilian laws.
Author Contributions
Conceptualization, D.B.M.D.; methodology, D.B.M.D.; software, I.C.e.S.N.; validation, M.C.; formal analysis, I.C.e.S.N.; investigation, I.C.e.S.N.; data curation, D.B.M.D.; writing—original draft, D.B.M.D.; writing—review & editing, D.B.M.D. and M.C.; visualization, D.B.M.D.; supervision, M.C. All authors have read and agreed to the published version of the manuscript.
Funding
The authors thank the Brazilian National Council for Scientific and Technological Development (CNPq Productivity Grant 309452/2021-0 and project 424173/2021-2). Thanks are extended to the Foundation for the Support of Research in Paraíba State (FAPESQ) (project 3063/2021, call No. 09/2021 Universal Demand).
Institutional Review Board Statement
Not applicable.
Informed Consent Statement
Not applicable.
Data Availability Statement
The original contributions presented in this study are included in the article. Further inquiries can be directed to the corresponding author.
Acknowledgments
The authors wish to acknowledge the support of the Laboratory of Environmental and Energy Assessments (LAvAE) at the Federal University of Paraíba.
Conflicts of Interest
The authors declare no conflict of interest.
Nomenclature
| Atn | Production of utility n by technology t |
| AA | Ambient air |
| AG | Chilled water |
| AQ | Hot water |
| AR | Cooling water |
| BM | Biomass |
| Cfix | Capital cost |
| Cinv | Investment cost |
| Cmrhn | Consumption of utility n in month m, day r, and time h |
| cmt | Cost of technology maintenance cost t |
| Cvar | Variable cost |
| ct | Cost of technology t |
| Ctot | Total cost |
| CABM | Hot water boiler that consumes biomass |
| CADI | Hot water boiler that consumes diesel |
| CAEE | Hot water boiler that consumes electricity |
| CAGN | Hot water boiler that consumes natural gas |
| CCOM | Fuel cell |
| CHAQ | Single-effect absorption chiller |
| CHEE | Mechanical chiller |
| Dmrhn | Demand of utility n in month m, day r, and time h |
| DI | Diesel |
| Emrhn | Excess of utility n in month m, day r, and time h |
| EE | Electricity |
| fci | Factor of indirect costs |
| fcr | Capital recovery factor |
| GDGN | Natural gas generator |
| GDDI | Diesel generator |
| GN | Natural gas |
| h | Hour |
| i | Initial investment cost of technology |
| m | Month |
| n | Utility |
| O&M | Operation and maintenance |
| Pmrhn | Production of utility n in month m, day r, and time h |
| Qmrhnt | Excess of utility n used by technology i in month m, day r, and hour h |
| r | Representative day |
| RDEE | Electric grid |
| Smrhn | Purchase of utility n in month m, day r, and time h |
| SIFV | Photovoltaic system (panels and inverters) |
| SisFV | Capital cost of the solar PV system |
| SisTS | Capital cost of thermosolar system |
| SITS | Thermosolar system (solar collectors and boiler) |
| t | Type of equipment |
| TCAQ | Heat exchanger (hot water − cooling water) |
| TRAR | Cooling tower |
| Unt | How much, proportionally, technology t uses of n |
| Wmrhn | Waste of utility n in month m, day r, and time h |
| xmrht | Use of technology t during month m, day r, and hour h |
| y | Number of installed equipment |
| Yt | Maximum amount of technology t used |
Appendix A
Equipment available in the superstructure (complete details can be found in [35]).
| Equipment | Description |
| SIFV | Modeled according to Brazilian Standards NBR 16724, using Canadian Solar—CS3W 455MS, and inverter on-grid 25 kW with Wi-fi Fox ESS-T25 |
| GDGN | QT Series Home Backup Generator—GENERAC, 180 kVA |
| GDDI | NAGANO Diesel Triphase 165 kVA 220–380 V |
| CADI | ECAL VRI-500 |
| CAGN | ECAL VRI-500 |
| CABM | WECO HA300 |
| CAEE | ECAL PE-150 |
| CHAQ | CARRIER C16JLH003 |
| CHEE | CARRIER 160TR-30HRP |
| TRAR | ALPINA, model TSI-34/3-A19-II |
| TCAQ | Alfaengenharia, 400 kW |
| CCOM | PC25C, UTC Fuel Cells |
| SITS | Modeled according to Brazilian Standards NBR 17003, using HELIOTEK MC 2000TF20 solar collector |
References
- Kumar, K.; Kumar, M.; Soomro, A.M. To Design an off Gird PV System for un electrified area of District Tharparkar, Pakistan. Int. J. Green Energy 2021, 18, 920–932. [Google Scholar] [CrossRef]
- Sheikh, H.I.; Rathi, M.K.; Soomro, A.M. Optimal integration of battery energy-storage system with high penetration of renewable energy in radial distribution network. Clean Energy 2022, 6, 404–411. [Google Scholar] [CrossRef]
- Kumar, M.; Nallagownden, P.; Elamvazuthi, I. Multi-objective PSO based optimal placement of solar power DG in radial distribution system. J. Electr. Syst. 2017, 13, 322–331. [Google Scholar]
- IEA International Energy Agency. Tracking Buildings. 2023. Available online: https://www.iea.org/energy-system/buildings (accessed on 3 January 2025).
- EPE National Energy Balance 2022. Available online: https://www.epe.gov.br/sites-pt/publicacoes-dados-abertos/publicacoes/PublicacoesArquivos/publicacao-675/topico-638/BEN2022.pdf (accessed on 17 December 2024).
- National Renewable Energy Laboratory (NREL). NREL Researchers Reveal How Buildings Across United States Do—And Could—Use Energy. 2023. Available online: https://www.nrel.gov/news/features/2023/nrel-researchers-reveal-how-buildings-across-the-united-states-do-and-could-use-energy.html#:~:text=Buildings%20are%20responsible%20for%2040,of%20the%20nation’s%20carbon%20emissions (accessed on 3 January 2025).
- Yuksel, Y.E.; Ozturk, M.; Dincer, I. Development and assessment of a biomass-gasification based multigenerational plant for production of hydrogen and ammonia fuels. Fuel 2025, 380, 133187. [Google Scholar] [CrossRef]
- Dincer, I.; Bicer, Y. Integrated Energy Systems for Multigeneration; Elsevier: Amsterdam, The Netherlands, 2019. [Google Scholar]
- Di Fraia, S.; Shah, M.; Vanoli, L. Biomass Polygeneration Systems Integrated with Buildings: A Review. Sustainability 2024, 16, 1654. [Google Scholar] [CrossRef]
- Jana, K.; Ray, A.; Majoumerd, M.M.; Assadi, M.; De, S. Polygeneration as a Future Sustainable Energy Solution—A Comprehensive Review. Appl. Energy 2017, 202, 88–111. [Google Scholar] [CrossRef]
- Pedram, O.; Asadi, E.; Chenari, B.; Moura, P.; Gameiro da Silva, M. A review of methodologies for managing energy flexibility resources in buildings. Energies 2023, 16, 6111. [Google Scholar] [CrossRef]
- Wirtz, M.; Hahn, M.; Schreiber, T.; Müller, D. Design optimization of multi-energy systems using mixed-integer linear programming: Which model complexity and level of detail is sufficient? Energy Convers. Manag. 2021, 240, 114249. [Google Scholar] [CrossRef]
- Souza, R.J.; Reini, M.; Serra, L.M.; Lozano, M.A.; Nadalon, E.; Casisi, M. Multi-Objective Optimization of an Energy Community Powered by a Distributed Polygeneration System. Energies 2024, 17, 3085. [Google Scholar] [CrossRef]
- Algieri, A.; Beraldi, P.; Pagnotta, G.; Spadafora, I. The Optimal Design, Synthesis and Operation of Polygeneration Energy Systems: Balancing Life Cycle Environmental and Economic Priorities. Energy Convers. Manag. 2021, 243, 19. [Google Scholar] [CrossRef]
- Pinto, E.S.; Serra, L.M.; Lázaro, A. Energy Communities Approach Applied to Optimize Polygeneration Systems in Residential Buildings: Case Study in Zaragoza, Spain. Sustain. Cities Soc. 2022, 82, 17. [Google Scholar] [CrossRef]
- Pina, E.A.; Lozano, M.A.; Serra, L.M. Assessing the Influence of Legal Constraints on the Integration of Renewable Energy Technologies in Polygeneration Systems for Buildings. Renew. Sustain. Energy Rev. 2021, 149, 20. [Google Scholar] [CrossRef]
- Pinto, E.S.; Amante, B. Polygeneration system optimization for building energy system retrofit: A case of study for TR5 building of UPC-Terrassa. Energy Build. 2022, 273, 112375. [Google Scholar] [CrossRef]
- Martin, R.; Arthur, T.; Jonathan, V.; Mathieu, T.; Enora, G.; Robin, G. SHAPE: A temporal optimization model for residential buildings retrofit to discuss policy objectives. Appl. Energy 2024, 361, 122936. [Google Scholar] [CrossRef]
- Brazil. Law N°14,300, of 6 January 2022. Institutes the Legal Framework of Distributed Micro- and Mini-Generation of Electricity. Diário Oficial da União, Brasília, DF. 7 January 2022. Available online: https://www.planalto.gov.br/ccivil_03/_ato2019-2022/2022/lei/L14300.htm (accessed on 17 December 2024).
- ABNT 5410; Low Voltage Electrical Installations. Brazilian Association of Technical Standards: Rio de Janeiro, Brazil, 2004.
- ENERGISA Technical Standards: Basic Criteria for Preparing Urban Air Distribution Network Projects. Available online: https://www.energisa.com.br/Documents/Normas%20t%C3%A9cnicas/NDU%20006%20Crit%C3%A9rios%20B%C3%A1sicos%20para%20Elabora%C3%A7%C3%A3o%20de%20Projetos%20de%20Redes%20de%20Distribui%C3%A7%C3%A3o%20A%C3%A9reas%20Urbanas%20Vers%C3%A3o%206.0%20.pdf (accessed on 29 December 2024).
- ABNT NBR 15569; Direct Circuit Solar Water Heating System—Design and Installation Requirements. Brazilian Association of Technical Standards: Rio de Janeiro, Brazil, 2021.
- Erbs, G.D.; Kiein, A.S.; Beckman, A.W. Estimation of degree-days and ambient temperature bin data from monthly-average temperatures. ASHARE J. 1983, 25, 60–65. [Google Scholar]
- SINAPI CAIXA. Available online: https://www.caixa.gov.br/site/Paginas/downloads.aspx#categoria_652 (accessed on 17 December 2024).
- Delgado DD, M.; Carvalho, M.; Coelho Junior, L.M.; Chacartegui, R. Analysis of biomass-fired boilers in a polygeneration system for a hospital. Front. Manag. Res. 2018, 2, 1–13. [Google Scholar]
- PROCON Procon Paraíba. 2022. Available online: https://procon.pb.gov.br/pesquisas (accessed on 10 December 2022).
- ENERGISA Rate Types. 13 January 2023. Available online: https://www.energisa.com.br/Paginas/informacoes/taxas-prazos-e-normas/tipostarifas.aspx (accessed on 13 January 2023).
- PBGÁS Gas Company of Paraíba. 2022. Available online: https://pbgas.com.br/tarifas/ (accessed on 13 November 2022).
- IBM ILOG CPLEX Optimization Studio. Available online: https://www.ibm.com/products/ilog-cplex-optimization-studio (accessed on 16 December 2024).
- EPE Ten-Year Plan for the Expansion of Electricity 2032 in Brazil. Available online: https://www.epe.gov.br/pt/publicacoes-dados-abertos/publicacoes/plano-decenal-de-expansao-de-energia-2032 (accessed on 29 December 2024).
- Melo, F.M.; Pina, E.A.; Carvalho, M. Optimization and sensitivity analyses of a combined cooling, heat and power system for a residential building. Therm. Sci. 2021, 25, 3969–3986. [Google Scholar] [CrossRef]
- Mohammadi, M.; Mohammadi, H. Optimization of the microcombined heat and power systems considering objective functions, components andoperation strategies by an integrated approach. Energy Convers. Manag. 2020, 208, 17. [Google Scholar] [CrossRef]
- Jeon, S.; Bae, S. Integrated optimization for sizing, placement, and energy management of hybrid energy storage systems in renewable power systems. J. Energy Storage 2025, 106, 114793. [Google Scholar] [CrossRef]
- Queiroz, F.A.O.; Morte IB, B.; Borges, C.L.; Morgado, C.R.; de Medeiros, J.L. Beyond clean and affordable transition pathways: A review of issues and strategies to sustainable energy supply. Int. J. Electr. Power Energy Syst. 2024, 155, 109544. [Google Scholar]
- Delgado DB, M. Study of the Multigeneration Potential for Residential and Commercial Consumer Units in Brazil. Doctoral Thesis, . Graduate Program in mechanical Engineering, Federal University of Paraíba, 2023. Available online: https://repositorio.ufpb.br/jspui/bitstream/123456789/27982/1/DanielleBandeiraDeMelloDelgado_Tese.pdf (accessed on 29 December 2024).
Disclaimer/Publisher’s Note: The statements, opinions and data contained in all publications are solely those of the individual author(s) and contributor(s) and not of MDPI and/or the editor(s). MDPI and/or the editor(s) disclaim responsibility for any injury to people or property resulting from any ideas, methods, instructions or products referred to in the content. |
© 2025 by the authors. Licensee MDPI, Basel, Switzerland. This article is an open access article distributed under the terms and conditions of the Creative Commons Attribution (CC BY) license (https://creativecommons.org/licenses/by/4.0/).