Abstract
To explore the mechanism of consumers’ battery electric vehicle (BEV) purchase behavior in depth and address research gaps related to insufficient consideration of psychological latent variables and neglect of consumer heterogeneity in existing studies, this study constructs a latent class model (LCM) that integrates personal attributes, vehicle attributes, and six psychological latent variables: perceived usefulness, perceived ease of use, perceived risk, environmental awareness, purchase attitude, and purchase intention. Based on 1044 valid questionnaires collected from Urumqi, latent profile analysis (LPA) is used to classify consumers. The results indicate that BEV consumers can be divided into five distinct latent profiles with significant differences in purchase preferences: the risk-avoidance type, the moderate–low intention wait-and-see type, the utility-oriented and low environmental concern type, the high utility cognition and low-risk proactive type, and the all-dimensional high-intention core type. Socioeconomic and vehicle-related factors exert heterogeneous impacts on the psychological variables and purchase decisions of each profile. This study clarifies the intrinsic psychological mechanism of BEV purchase behavior, providing a theoretical basis and targeted strategy references for the government and enterprises to promote BEV adoption and advance sustainable transportation development.
1. Introduction
Recently, with the increasingly serious problems of environmental pollution and energy shortage, needs for development and promotion of new energy products are also becoming extremely urgent. Electric vehicles, with the significant features of environmental protection and energy conservation, have become the development direction of the automotive industry in countries around the world. According to statistics from the Ministry of Public Security of the People’s Republic of China (MPS), in 2023, 7.43 million new energy vehicles were registered, accounting for 30.25% of the total number of newly registered vehicles. Compared with 2022, this figure increased by 2.07 million, showing a growth of 38.76%. By 2024, the total number of new energy vehicles in China had reached 31.4 million, accounting for 8.90% of the total number of vehicles. Among them, the ownership of electric vehicles is 15.52 million; the proportion is 76.04% of the total number of new energy vehicles. It can be seen that with the continuous improvement in Chinese new energy vehicle technology and the intensive promotion of national policies, consumers’ acceptance of electric vehicles will also be increasing day by day. However, according to the statistics from MPS, even by June of 2025, electric vehicles still have a low proportion of 7.11% in the total number of vehicles. Therefore, exploring the influencing factors of consumers’ choice behavior of electric vehicles and formulating targeted and effective policies for promoting electric vehicles are of extremely important practical significance for implementing the country’s new energy vehicle development strategy.
Existing research on BEV purchase behavior has identified key influences such as socioeconomic attributes, vehicle technical features, and policy incentives, with some integrating psychological factors via frameworks like the theory of planned behavior (TPB) and Technology Acceptance Model (TAM). However, two critical limitations persist: insufficient integration of interconnected psychological latent variables, and overreliance on homogeneity assumptions in traditional models, as even mixed logit models face constraints from strict parameter distribution requirements [1].
Latent class models (LCMs) address these gaps by segmenting consumers into distinct groups with consistent decision-making patterns, avoiding restrictive distribution assumptions while enhancing heterogeneity capture. Though LCMs have been applied in vehicle purchase research, few studies have systematically integrated multiple psychological variables into the LCM framework for BEV analysis, leaving heterogeneous preferences of psychologically distinct consumer groups understudied [2].
To fill this void, this study constructs an LCM integrating personal attributes, vehicle attributes, and six core psychological latent variables (perceived usefulness, perceived ease of use, perceived risk, environmental awareness, purchase attitude, and purchase intention). Using 1044 valid questionnaires from Urumqi, latent profile analysis (LPA) is employed to classify consumers and explore heterogeneous factor impacts across groups.
This study’s theoretical contributions are threefold. First, it enriches BEV purchase behavior research by systematically embedding multiple psychological latent variables into the LCM, addressing the insufficiency of latent variable consideration in existing studies. Second, it advances understanding of consumer heterogeneity through refined latent class identification, supplementing the limitations of traditional models’ homogeneity assumptions. Third, it verifies an LCM’s applicability in BEV purchase intention analysis, expanding its application scope in new energy vehicle consumer behavior research.
2. Literature Review
It is necessary to explore consumers’ behavior in choosing electric vehicles in depth to introduce effective policies for promoting electric vehicles. At present, the common method for studying the characteristics of electric vehicle choice behavior is to construct discrete choice models to study the electric vehicle choice behavior of consumers. However, these models still have their shortcomings: First, insufficient consideration is given to variables that are difficult to observe directly, namely latent variables. Zhang et al. used three binary logistic models to determine the factors that contribute to consumers’ acceptance of electric vehicles, their purchase time and their purchase price; the variables included socioeconomic attributes, consumers’ acceptance of electric vehicles, and consumers’ awareness of related development measures for electric vehicles [3]. Helveston conducted an investigation into consumers’ behavior in choosing electric vehicles based on various vehicle attributes such as model, brand, price, fast-charging capacity, fuel price, and acceleration performance [4]. As the research progressed, some scholars began to explore that certain psychological factors that cannot be directly observed also influence consumers’ choice behaviors [5,6]. Schmalfuß et al. and Zhang et al. utilized the theory of planned behavior model (TPB) to introduce non-direct factors of subjective norms in the choice behavior of electric vehicles, and found that subjective norms had a significant impact on the adoption of electric vehicles [7,8]. Song and Adu-Gyamfi, respectively, explored the influence of perceived usefulness and perceived ease of use on the behavior of choosing electric vehicles [9,10]. Second, the assumption of homogeneity of the model is not in line with reality; a lot of studies assumed that individual consumers are homogeneous entities with the same physiological, psychological states and even the same decision-making rules. However, in reality, significant differences exist among individuals in terms of physiology, psychology and decision-making rules, indicating heterogeneity among individuals. Many choice models have also neglected that these exist among individuals [11,12,13]. With the development of choice models, more researchers treat the assumption of heterogeneity as an important research field [14,15,16,17,18]. Many models can disclose the heterogeneity of the research objects, such as the Probit model, the mixed logit model [19] (ML) and the latent class model (LCM), etc. The LCM divides the research samples into a limited number of latent classes, using the differences in parameters among the latent classes to represent the heterogeneity in the research samples. Compared with other models, the LCM has unique advantages: it not only can represent the heterogeneity at the group level, and has stronger explanatory power [20], but also does not require assumptions about the distribution of random parameters, thereby improving the computational efficiency of the model [21].
At first, scholars tended to emphasize the differences between factor analysis and latent structure analysis [22]. After that, researchers developed the LCM continuously on distinguishing the cases where there is prior evidence or theory, which leads people to expect there to be latent categories, namely, whether the classes existed in advance and how many there might be [23,24,25]. In recent decades, with the continuous improvement in model methodology and the rapid development of electric vehicles, the LCM has been utilized to study the heterogeneity of consumers during the decision-making process when choosing to purchase or lease a vehicle, as well as the choice behaviors of different types of consumers [6,26]. However, in the research on the choice behavior of electric vehicles, few studies have considered the psychological latent variables of consumers for modeling, and fewer studies have explored the choice preferences of consumers with different psychological characteristics. Therefore, this study will be based on psychological latent variables, focus on considering the psychological heterogeneity of consumers, construct a latent class model, and explore the preference of consumers for electric vehicle choice behavior.
3. Materials and Methods
This study employs a quantitative and descriptive–analytical research design, with attention paid to the heterogeneity of electric vehicle purchasers, which investigates how personal attributes, vehicle attributes and psychological attributes affect purchasers’ behavior. In order to achieve the goal, an analysis tool is deployed, namely, a latent class model. The design combines structured survey instruments to capture electric vehicle purchasers’ heterogeneity during electric vehicle choice.
3.1. Introduction to Latent Class Model
A latent class model is an effective method for studying heterogeneity whose essence lies in the semi-parametric specification within the utility function, which assumes that decision-makers are divided into multiple latent classes. The parameters of the utility function vary among different classes, but are the same within the same class. The latent class model can be expressed as follows:
where
In the model, each class has its own parameter vector βs. The probability that decision-maker n chooses option i is equal to the probability that this decision-maker belongs to category s multiplied by the probability that option i is chosen in category s.
The class membership probability πns is a function of the explanatory variable Zn, ηs is the parameter vector of a specific category, and δs is the constant term of a specific category:
In the model, choice behavior is judged based on the utility function:
where V(i) represents the fixed utility of option i, and ɛ(i) represents the random utility, which follows a certain probability distribution. When U(i) is greater than that of any other option, option i is chosen. Therefore, the selection probability P(i) of option i can be expressed as follows:
Substituting Equation (4) into Equation (3) yields the following:
where F(x) represents the probability distribution function, and fi(x) is the probability density function of the random variable x = ɛ(i). First, assuming that ɛ(i) is known, the probability distribution function value of ɛ(j) corresponding to scheme j can be obtained. Then, when the probability of ɛ(j) changes, is is multiplied by its probability density and integration is performed.
Assuming that ɛ(i) in the utility function are mutually independent and follow the Gumbel distribution, let x be the probability variable representing ɛ(i), and θ represent the parameters; the distribution function of the random term can be expressed as follows:
Substituting (6) into (5), we can obtain the probability that decision-maker n selects option i:
3.2. Questionnaire Investigation
This study adopts the method of field investigation and the location is selected as Urumqi, with a focus on randomly sampling surveys in the major commercial districts with high passenger flow in the city. A total of 1157 questionnaires are collected. After eliminating 113 incomplete or invalid questionnaires, a total of 1044 valid questionnaires are obtained, and the effective recovery rate of the questionnaires is 90.23%.
The questionnaire is divided into three parts. The first part is the scenario selection, the second part is the psychological condition survey, and the third part is the personal socioeconomic attribute survey. In the scenario selection, apart from setting the traditional fuel vehicle as the reference item, this study also sets the hybrid vehicle for comparative analysis. In this study, 3 types of vehicles are provided, including traditional fuel vehicles, pure electric vehicles, and hybrid vehicles. The vehicle attributes include purchase price, energy consumption per 100 km, range, charging/refueling time, and government policies. The psychological condition survey includes 6 latent variables: perceived usefulness, perceived ease of use, perceived risk, environmental awareness, purchase attitude, and purchase intention. These variables are measured using a Likert five-point scale. Personal socioeconomic attributes include gender, age, income level, education, family annual income, occupation, driving years, the number of family vehicles, and vehicle purchase price. The specific variables in the questionnaire are described in Table 1.

Table 1.
Variables.
After collecting 1044 valid questionnaires, SPSS 23.0 was used for data cleaning and descriptive statistical analysis. Descriptive statistical analysis was conducted on the collected valid samples, and the statistical results are shown in Table 2.
Table 2.
Survey sample statistics.
The proportion of males and females in the sample is 59.2% and 40.8%, respectively. Since the actual proportion of males purchasing vehicles is higher than that of females, the proportion of males is appropriately increased during sampling. The age group of 26–35 years old is the largest, followed by 35–60 years old, accounting for 66.2% in total. These two groups are the main vehicle-purchasing population and have strong representative significance. The number of people with an annual household income of over CNY 100,000 accounts for 61%. The number of people with a driving experience of 1–6 years is the largest, accounting for 41.2%. The number of people with one vehicle in the family accounts for 63.3%. The number of people who have purchased a vehicle with a price of CNY 100,000–200,000 is the largest, accounting for 48.0%. Meanwhile, the occupations involved in the survey are relatively comprehensive, and the survey sample has certain representative significance.
For the six psychological latent variables, AMOS 23.0 was employed to conduct confirmatory factor analysis for reliability and validity tests. This included verifying factor loading coefficients, composite reliability, and Cronbach’s α values to ensure the measurement model’s goodness of fit.
3.3. Latent Class Model Analysis
Given that the manifest variable data were treated as continuous variables, latent profile analysis was adopted to classify consumers. The LPA was implemented in SPSS 23.0 through customized procedures compatible with continuous data, with model fitting evaluated using indicators such as Akaike information criterion (AIC), Bayesian information criterion (BIC), adjusted BIC (aBIC), entropy, and the Lo–Mendell–Rubin test (LMR). This approach aligned with the latent class model (LCM) framework, enabling accurate identification of latent consumer profiles and estimation of heterogeneous impacts of influencing factors.
4. Results
4.1. Analysis of Latent Variable Relationships and Survey Results
In order to clarify the structural relationship between latent variables and manifest variables, this study obtains the loading coefficients between latent variables and manifest variables through measurement equations, and the result is shown in Table 3. As shown in Table 3, the loading coefficients are all greater than 0.5, indicating that there is a high degree of causal relationship between latent variables and manifest variables.
Table 3.
Test results of loading factors.
Perceived usefulness demonstrates a mean score of 3.473 ± 0.670. Respondents generally acknowledge the practical value of battery electric vehicles. Perceived ease of use yields a relatively lower mean of 3.228 ± 0.651, which indicates purchasers express moderate concerns regarding the operational convenience of battery electric vehicles. Perceived risk exhibits the lowest mean of 3.236 ± 0.539, indicating respondents perceive a relatively low level of risk associated with battery electric vehicles. Environmental awareness achieves the highest mean of 3.708 ± 0.582, which shows the sample population demonstrates strong environmental consciousness. Purchase attitude and purchase intention both present moderate-to-high means. Purchase attitude records a score of 3.586 ± 0.711, while purchase intention registers 3.558 ± 0.720; both metrics reflect positive inclinations toward battery electric vehicle purchases. Standard deviations across all variables range from 0.539 to 0.720. This range indicates moderate dispersion in responses and the absence of extreme opinion polarization.
All skewness values fall within the range of −0.427 to −0.034. These values are negative with absolute magnitudes below 1. The distributions of all manifest variables exhibit slight left skewness, with responses predominantly clustered toward higher score ranges. This distribution pattern aligns with the moderate-to-high mean scores observed.
The kurtosis values span from −0.034 to 0.789. All values are close to 0, the kurtosis benchmark for a normal distribution, with absolute magnitudes below 1. All variable distributions are approximately mesokurtic. They closely resemble the normal distribution without excessive peakedness or flatness. The data set contains no extreme outliers. This characteristic supports the reliability of subsequent statistical analyses, including latent class modeling.
The consistency and stability of the questionnaire measurement results are tested through Cronbach’s α value. When the Cronbach’s α value is greater than 0.7, it indicates that the measurement results have a high internal consistency, suggesting that the questionnaire has a high level of reliability. An α value between 0.5 and 0.7 is considered acceptable [27].
The validity of the measurement results is analyzed using composite reliability (CR). A CR value greater than 0.6 indicates that the measurement results of the questionnaire are valid and the questionnaire has high reliability [28]. The results show that the Cronbach’s α of each latent variable is greater than 0.6, and the CR values are all greater than 0.7, indicating that the reliability of the questionnaire is high.
4.2. Analysis of Model Results
4.2.1. Analysis of Latent Variable Classification Results
During the modeling process, when the variables in the latent class model are discrete (categorical) manifest variables and discrete latent variables, it is called latent class analysis (LCA). When the variables in the latent class model are discrete manifest variables and continuous latent variables, it is called latent trait analysis (LTA). In addition, when the variables are continuous manifest variables and discrete latent variables, it is called latent profile analysis (LPA). In this study, the manifest variable data collected using the Likert five-point scale can be regarded as continuous variables. Therefore, this study adopts LPA to construct the latent class model. The main test indicators for LPA include Akaike information criterion (AIC), Bayesian information criterion (BIC), adjusted Bayesian information criterion (aBIC), entropy criterion (Entropy), and the Lo–Mendell–Rubin test (LMR). Among these indicators, a smaller value indicates a better model fitting effect. When entropy is greater than or equal to 0.8, it indicates that the classification accuracy exceeds 90%. A significant p-value of LMR (p < 0.05) indicates that the fitting effect of the m profiles model is significantly better than that of the m-1 profiles model [23]. The fitting results of each model are shown in Table 4.
Table 4.
Classification results of the latent profile model.
As shown in Table 4, when variables are divided into five profiles, Entropy has the maximum value. When divided into six profiles, the p value of LMR is not significant, indicating that the model with six profiles is not superior to that with five profiles. Therefore, this study determines five profiles as the optimal number. Figure 1 shows the scores of each profile on different manifest variables when divided into five profiles.
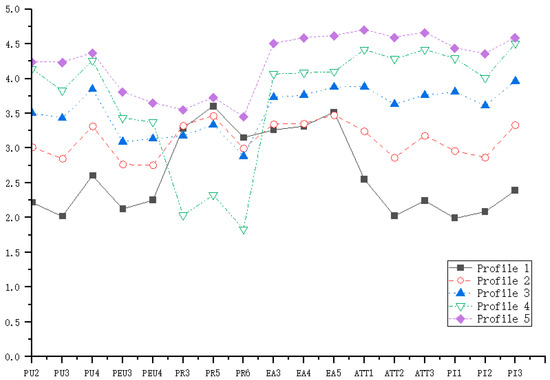
Figure 1.
Observed variable scores of five latent classes.
As shown in Figure 1, the points on the horizontal axis represent the manifest variables, and the vertical axis represents the score of this manifest variable. Based on the data comparison and analysis in Figure 1, it can be observed that individuals in Profile S1 have intermediate levels of perceived risk and environmental awareness, but exhibit the lowest scores for perceived usefulness, perceived ease of use, purchase intention, and purchase attitude. We have named this group the ‘risk-avoidance type’ because they hold high perceived risk and hesitate to purchase due to concerns about practicality and convenience, showing a tendency of risk avoidance.
The perceived ease of use, perceived usefulness, perceived risk and environmental awareness of Profile S2 are at a medium level among the five profiles, and their purchase intention and purchase attitude are relatively weak. They have no obvious preference or rejection towards electric vehicles and show weak purchase intention, and this group is named after the moderate–low intention wait-and-see type.
As for people of Profile S3, except for having a relatively weak environmental awareness, their scores in other latent variables are at an intermediate level, and they account for the largest proportion of the population. We term this group the utility-oriented and low environmental concern type.
People of Profile S4 have the poorest perceived risk and a medium level of perceived ease of use, but they have stronger environmental awareness, purchase intention and purchase attitude. In addition, the perceived usefulness of this group is the highest. So, this group are named the high utility cognition and low risk proactive type, because they highly recognize the practical value of electric vehicles and have minimal concerns about safety and convenience.
Last, people of Profile S5 have the strongest perceived usefulness, purchase intention and purchase attitude, and they also have the strongest environmental awareness, perceived risk and perceived ease of use. They are named the all-dimensional high-intention core type; although their perceived risk is slightly higher, it is completely offset by strong environmental awareness and high recognition of practicality. They have extremely strong purchase intention and are the core potential users for electric vehicle promotion.
Based on the scores of the manifest variables and the loading coefficients, the magnitude of the psychological latent variables of each profile can be further calculated. Through the analysis of variance shown in Table 5, the mean and variance in the psychological latent variables of each profile can be obtained. By further comparing the differences in the psychological latent variables of people of different profiles, it can be seen from the analysis of variance table that the people of Profile S1 have a higher perceived risk and lower environmental awareness. The people of Profile S5 have the highest perceived ease of use, perceived risk, environmental awareness, purchase attitude and purchase intention. People of Profile S4 have the strongest perceived usefulness, which is consistent with the analysis results in Figure 1. This further proves the existence of psychological heterogeneity among the population, and the significance results indicate that there are significant differences among the five groups of people in terms of latent variables such as perceived usefulness, perceived ease of use, perceived risk, environmental awareness, purchase attitude and purchase intention, indicating a good classification result.
Table 5.
Table of variance analysis.
4.2.2. Influencing Factors for the Classification of Electric Vehicle Purchasers
Taking Profile S1 as a benchmark, this study explores the influencing factors of purchasers profile classification. The results are shown in Table 6.
Table 6.
Influencing factors for the classification.
Table 6 presents the influencing factors of consumer profile classification, with Profile S1 (risk-avoidance type) as the reference group. The coefficients reflect the direction and intensity of the impact of socioeconomic attributes and vehicle-related factors on the probability of purchasers belonging to other profiles, and the significance level indicates the reliability of the impact. The specific interpretation is as detailed below.
For the moderate–low intention wait-and-see type (Profile S2), males are more likely to be classified into this group, while fewer family vehicles reduce this probability. This indicates males show greater attention to BEVs but remain hesitant, while urgent travel needs from insufficient family vehicles diminish wait-and-see attitudes.
As regards the utility-oriented and low environmental concern type (Profile S3), males and those with higher education are more prone to this profile. More family vehicles also increase membership likelihood, aligning with the group’s focus on practicality over environmental factors.
For the high utility cognition and low-risk proactive type (Profile S4), males, higher education, and higher purchase budgets are key drivers. Public institution employees and self-employed individuals account for a larger share of this group, while enterprise employees constitute a smaller proportion, reflecting strong recognition of BEV utility and low risk perception.
For the all-dimensional high-intention core type (Profile S5), males are significantly more likely to belong to this group. Their decision-making is more driven by internal psychological factors, with socioeconomic attributes exerting limited influence.
These results confirm that gender, education, family vehicle count, and occupation are critical for distinguishing consumer groups, providing empirical support for targeted marketing and policy design.
4.3. Analysis of Influencing Factors of Purchasers’ Choice Behavior
This part analyses the effects of each influencing factor on the perceived usefulness (PU), perceived ease of use (PEU), perceived risk (PR), environmental awareness (EA) and purchase intention (PI) of the five profiles.
4.3.1. Comparative Analysis of Influencing Factors of Purchase Intention
Table 7 indicates that gender and occupation have less influence on the purchase intention of five profiles of purchasers. Age and driving experience only have significant influence on the PI of Profile S1. Education background has a significant effect on the PI of Profiles S1 and S5. As for annual household income and the number of family vehicles, they influence the PI of Profiles S2 and S3 significantly. And vehicle purchasing price only influences the PI of Profile S4.
Table 7.
Influencing factors of purchase intention.
4.3.2. Comparative Analysis of the Influencing Factors of Purchase Attitude
As can be seen from Table 8, neither the annual household income nor driving experience have a significant influence on the purchase attitude of the five profiles. Occupation, the number of family vehicles, and the vehicle purchase price only have a significant influence on the PA of Profile S1; education has a significant influence on the PA of Profile S2, but not on the other profiles; gender only has a significant influence on the PA of the Profile S3; and only age has a significant influence on the PA of Profile S4.
Table 8.
Analysis of the influencing factors of purchase attitude.
4.3.3. Comparative Analysis of the Influencing Factors of Perceived Risk
Table 9 indicates that driving experience has little significant influence on the perceived risk of the five profiles. Gender and occupation only influence the PR of Profile S2 significantly. Gender and the number of family vehicles influence the PR of Profile S3. As for Profile S4, their PR is influenced greatly by gender and the vehicle purchase price. The PR of Profile S5 is only influenced by the annual household income.
Table 9.
Analysis of PR-influencing factors.
4.3.4. Comparative Analysis of the Influencing Factors of Environmental Awareness
It can be seen from Table 10 that gender, occupation, driving experience and the number of family vehicles do not influence the environmental awareness of Profile S5 significantly. The annual household income only influences that of Profile S4. Vehicle purchase price has a significant influence on the EA of Profile S3. The EA of Profiles S2, S3 and S5 is greatly influenced by age.
Table 10.
Analysis of EA-influencing factors.
4.3.5. Comparative Analysis of the Influencing Factors of Perceived Usefulness
As shown in Table 11, age, education background, annual household income and vehicle purchase price do not have a significant influence on the perceived usefulness of five profiles. Gender and driving experience only influence the PU of Profile S2. The number of family vehicles only has a significant influence on the PU of Profile S3.
Table 11.
Analysis of PU-influencing factors.
4.3.6. Comparative Analysis of the Influencing Factors of Perceived Ease of Use
Table 12 indicates that age, education background, occupation and vehicle purchase price have no significant influence on the perceived ease of use of all profiles. Age and driving experience only influence the PE of Profile S2. For Profile S3, the purchasers are only influenced greatly by the number of family vehicles.
Table 12.
Analysis of PEU-influencing factors.
5. Discussion
Battery electric vehicles are an important strategy for addressing greenhouse gas emissions. Major countries and regions around the world are accelerating the development of BEVs to accelerate the achievement of the goal of carbon neutrality. Similar to this study, some research has also used the LCM method to classify purchasers, but it can be seen that these classifications are often based on fewer psychological variables and result in fewer classification criteria. Moreover, these studies do not consider factors such as attitude, environmental awareness, and purchase intention. While studies that consider these factors adopted analytical methods such as the TPB, they are unable to conduct group segmentation of purchasers or formulate more detailed and targeted car purchase incentive policies.
This study conducted a comparative analysis with some previous studies without considering the methodologies; according to other studies related to BEVs, three cross-culturally universal drivers of EV purchase intention can be confirmed. First, psychological latent variables consistently influence intention across China, Southern Europe and Thailand. This study’s use of these variables as segmentation criteria aligns with Buhmann et al. and Prabpayak et al.’s emphasis on attitude and perceived behavioral control [29,30]. Second, price sensitivity is a critical moderator. Hu et al. highlight price incentives as pivotal, echoing this study’s finding that price sensitivity differentiates latent classes [31]. Third, purchasers’ preference heterogeneity exists universally. Latent class models in this study and Li et al.’s study show that one-size-fits-all strategies are ineffective, with consumers split into distinct groups across regions [2].
Regional specificities can also be found in this study. The first lies in climate-related risk perception; Urumqi’s cold winters raise concerns about battery range and charging efficiency, leading to a distinct risk-avoidance type, less prominent in warmer regions like Spain or Thailand. The second is low environmental concern among utility-focused groups. The utility-oriented and low environmental concern type is more prevalent in Urumqi than in Spain or first-tier Chinese cities where environmental awareness is higher. The last one is gender and education dynamics; males in Urumqi are more likely to be of the high utility cognition and low-risk proactive type, aligning with Thailand’s male-dominated BEV purchaser base but contrasting with Spain’s gender-neutral model.
In summary, according to the analysis of LPA method, for purchasers of different profiles, this study recommends adopting differentiated sales strategies to enhance purchase intention.
The core characteristics of Profile S1 are high perceived risk, weak perceived usefulness and ease of use, and strong concerns about the practicality and safety of vehicles, and their purchase attitude and perceived risk are significantly influenced by factors such as education background, annual household income, occupation, and vehicle purchase price. In response to their risk-averse nature, sales strategies should focus on alleviating the risk perception of the group and emphasizing the safety and practical aspects of electric vehicles.
Profile S2 represents a group with moderate–low purchase intention, characterized by average levels of psychological variables, no clear preferences or aversions, and weak purchase intention. Age, education background, gender, and driving experience significantly influence their environmental awareness and perceived usefulness. This group is classified as a convertible wait-and-see group. For this group, sales strategies should focus on awakening their needs, developing experiential scenarios, and offering purchasing discount.
The purchasers of Profile S3 value utility and have weak environmental concerns, making up the highest proportion (46.1%). Their core characteristics include prioritizing vehicle practicality and having low environmental awareness. The number of family vehicles and the vehicle purchase price significantly influence their perceived usefulness and ease of use. This group is considered the core group for scale conversion, and sales strategies should emphasize the practical attributes and cost advantages of electric vehicles.
The characteristics of purchasers belong to Profile S4 are the highest perceived usefulness, low perceived risk, and strong environmental awareness. The vehicle purchase price and gender significantly influence their purchase intention. This group is considered an easily convertible proactive group, and it is crucial to meet their quality and personalized needs.
Purchasers of Profile S5 are the core potential user of electric vehicles, characterized by the strongest purchase intention and attitude, high environmental awareness, significant influence of age and education background on purchase intention, low sensitivity to price, and a need to focus on ensuring the purchase experience of this group of purchasers and continuously enhancing their brand recognition.
While this study provides valuable insights into Urumqi’s BEV market, its local focus overlooks three critical dimensions: the shaping role of living environments, the impact of mandatory policies like the EU’s combustion engine ban, and global heterogeneous market solutions. Addressing these gaps enhances this research’s generalizability and policy relevance.
Living environments exert a profound influence on purchaser preferences through climate, infrastructure, and cultural values. Urumqi’s cold winters contribute to the distinct risk avoidance type (Profile S1), as purchasers worry about battery performance, a concern shared by high latitude regions like Northern Europe but less prominent in warmer areas such as Spain or Thailand. Infrastructure density also matters; European countries with extensive charging networks report higher perceived ease of use scores than regions with underdeveloped facilities, directly affecting purchase intention. Additionally, cultural differences in environmental awareness, which is stronger in EU countries due to carbon neutrality narratives versus policy-driven awareness in China’s west, shape the distribution of utility oriented (Profile S3) and all-dimensional high-intention (Profile S5) purchasers.
The EU’s 2035 ban on new combustion engine vehicles represents a paradigm shift from Chinese-incentive-based policies. This mandatory regulation compels purchasers to shift from whether to buy BEVs to when to buy, accelerating the conversion of the moderate–low intention wait-and-see type (Profile S2) to proactive adopters. Unlike subsidies that target perceived utility, the ban enhances purchase intention by eliminating future fuel vehicle options, a dynamic not captured in Urumqi’s market.
Global market solutions further illustrate regional diversity. Southeast Asia’s battery leasing models reduce perceived risk for cost-sensitive purchasers, offering a viable alternative to subsidies for risk-avoidance-type groups [32]. Norway’s comprehensive support, including tax exemptions and priority access, has elevated core type purchasers to 25% of the market, demonstrating the efficacy of combined mandatory and incentive policies [33].
These cross-regional comparisons complement this study’s local findings, suggesting that BEV promotion requires tailored approaches: high-latitude regions should prioritize cold-resistant technology, mandatory policy environments need to supplement technical education, and cost-sensitive markets may benefit from innovative ownership models.
6. Conclusions
This study exhibits strong scenario adaptability to mid-tier and western Chinese cities, validating cross-cultural universal drivers of BEV adoption while uncovering regional specific psychological heterogeneity. It delivers clear innovative findings, theoretical advancements and practical guidance to promote BEV adoption in resource-constrained and climate-challenged regions.
This study identifies five distinct latent purchaser classes, with the all-dimensional high-intention core type standing out as a unique group. It integrates strong environmental awareness, high utility cognition and low risk perception, serving as a critical reference for identifying opinion leaders in emerging BEV markets. Additionally, it reveals significant interaction effects of gender, education and occupation. Males with higher education and stable occupations are more likely to be proactive adopters, offering a more nuanced demographic profile than previous studies that found no significant profile moderation. Unlike research advocating universal subsidies, this study demonstrates differentiated policy effectiveness; that is, free parking policies most effectively motivate the wait-and-see group, while tax refunds resonate more with the utility-oriented group.
As for theoretical contributions, this study has expanded LCM application. Most latent class model studies focus on developed regions, but this study validates its effectiveness in mid-tier western Chinese cities, enhancing the model’s generalizability to resource-constrained contexts. By combining the Technology Acceptance Model, risk theory and the theory of planned behavior, this study develops a more comprehensive segmentation framework than TPB-focused or motivator-focused research. This study also fills the research gaps, as the five-class segmentation supplements the literature on purchaser behavior in Chinese western regions, complementing existing studies on first-tier cities and eastern provinces.
Overall, this study fills the gap in understanding purchaser behavior in Chinese western BEV markets, offering a complementary perspective to studies on developed regions and other emerging markets. Its findings provide actionable, data-backed guidance for stakeholders to advance sustainable transportation in similar contexts worldwide.
Supplementary Materials
The following supporting information can be downloaded at: https://www.mdpi.com/article/10.3390/su172411382/s1.
Author Contributions
Conceptualization, Z.Z. and L.W.; methodology, Z.Z. and Y.Y.; software, Z.Z.; validation, Z.Z., L.W. and Y.Y.; formal analysis, Z.Z. and L.W.; investigation, L.W. and Z.Z.; resources, L.W.; data curation, Z.Z.; writing—original draft preparation, Z.Z. and L.W.; writing—review and editing, Z.Z.; visualization, Z.Z.; supervision, L.W.; project administration, Z.Z., L.W. and Y.Y.; funding acquisition, Z.Z. and L.W. All authors have read and agreed to the published version of the manuscript.
Funding
This research was funded by the Science Foundation of Education Department of Liaoning Province (grant number LJKZ1326), the Doctoral Research Startup Fund of Liaoning University of International Business and Economics (grant number 2022XJLXBSJJ01), the National Natural Science Foundation of China (grant number 71861032) and the Natural Science Foundation of Xinjiang Uygur Autonomous Region of China (grant number 2022D01C395).
Informed Consent Statement
Informed consent was obtained from all subjects involved in this study.
Data Availability Statement
Data will be made available on request from the author.
Conflicts of Interest
The authors declare no conflicts of interest.
Abbreviations
The following abbreviations are used in this manuscript:
| BEV | Battery electric vehicle |
| MPS | Ministry of Public Security |
| TAM | Technology Acceptance Model |
| TPB | Theory of planned behavior model |
| LCM | Latent class model |
| ML | Mixed logit |
| PU | Perceived usefulness |
| PEU | Perceived ease of use |
| PR | Perceived risk |
| EA | Environmental awareness |
| ATT | Purchase attitude |
| PI | Purchase intention |
| CR | Composite reliability |
| LTA | Latent trait analysis |
| LPA | Latent profile analysis |
| AIC | Akaike information criterion |
| BIC | Bayesian information criterion |
| aBIC | Adjusted Bayesian information criterion |
| LMR | Lo–Mendell–Rubin test |
References
- Cabeza-Ramírez, L.J.; Rosales-Tristancho, A.; Sánchez-Cañizares, S.M.; Palacios-Florencio, B. Rational and normative determinants in electric vehicle adoption: Willingness to pay and moderating variables. Technol. Soc. 2025, 81, 102842. [Google Scholar] [CrossRef]
- Li, W.; Cui, K.; Wu, L.; Zheng, B. Users’ Perceived Value of Electric Vehicles in China: A Latent Class Model-Based Analysis. World Electr. Veh. J. 2025, 16, 461. [Google Scholar] [CrossRef]
- Zhang, Y.; Yu, Y.F.; Zou, B. Analyzing public awareness and acceptance of alternative fuel vehicles in China: The case of EV. Energy Policy 2011, 39, 7015–7024. [Google Scholar] [CrossRef]
- Helveston, J.P.; Liu, Y.M.; Feit, E.M.; Fuchs, E.; Klampfl, E.; Michalek, J.J. Will subsidies drive electric vehicle adoption? Measuring consumer preferences in the U.S. and China. Transp. Res. A 2015, 73, 96–112. [Google Scholar] [CrossRef]
- Jensen, A.F.; Cherchi, E.; Mabit, S.L. On the stability of preferences and attitudes before and after experiencing an electric vehicle. Transp. Res. D 2013, 25, 24–32. [Google Scholar] [CrossRef]
- Kim, J.; Rasouli, S.; Timmermans, H. Expanding scope of hybrid choice models allowing for mixture of social influences and latent attitudes: Application to intended purchase of electric cars. Transp. Res. A 2014, 69, 71–85. [Google Scholar] [CrossRef]
- Schmalfuß, F.; Mühl, K.; Krems, J.F. Direct experience with battery electric vehicles (BEVs) matters when evaluating vehicle attributes, attitude and purchase intention. Transp. Res. F 2017, 46, 47–69. [Google Scholar] [CrossRef]
- Zhang, X.; Bai, X.; Shang, J. Is subsidized electric vehicles adoption sustainable: Consumers’ perceptions and motivation toward incentive policies, environmental benefits, and risks. J. Clean. Prod. 2018, 192, 71–79. [Google Scholar] [CrossRef]
- Song, Y.K. An empirical study on the influencing factors of consumers’ willingness to use pure electric vehicle based on TAM model. In Proceedings of the 2020 16th Date Fortune China Forum and Chinese High-Educational Management Annual Academic Conference (DFHMC), Zhengzhou, China, 4–6 December 2020; pp. 289–292. [Google Scholar] [CrossRef]
- Gyamfi, G.A.; Song, H.M.; Obuobi, B.; Nketiah, E.; Wang, H.; Cudjoe, D. Who will adopt? Investigating the adoption intention for battery swap technology for electric vehicles. Renew. Sustain. Energy Rev. 2022, 156, 111979. [Google Scholar] [CrossRef]
- Singh, G.; Misra, S.C.; Daultani, Y.; Singh, S. Electric vehicle adoption and sustainability: Insights from the bibliometric analysis, cluster analysis, and morphology analysis. Oper. Manag. Res. 2024, 17, 635–659. [Google Scholar] [CrossRef]
- Duives, D.; Mahmassani, H. Exit choice decisions during pedestrian evacuations of buildings. Transp. Res. Rec. 2013, 2012, 84–94. [Google Scholar] [CrossRef]
- Sun, C.W.; Obrenovic, B.; Li, H.T. Influence of virtual CSR co-creation on the purchase intention of green products under the heterogeneity of experience value. Sustainability 2022, 14, 13617. [Google Scholar] [CrossRef]
- Wang, R.B.; Wan, X.; Mao, P.; Li, D.Z.; Wang, X. Relevance study between unsafe behaviors of passengers and metro accidents based on fsQCA. China Saf. Sci. J. 2020, 30, 152–158. [Google Scholar] [CrossRef]
- Román, C.; Arencibia, A.I.; Feo-Valero, M. A latent class model with attribute cut-offs to analyze modal choice for freight transport. Transp. Res. A 2017, 102, 212–227. [Google Scholar] [CrossRef]
- Motoaki, Y.; Daziano, R.A. A hybrid-choice latent-class model for the analysis of the effects of weather on cycling demand. Transp. Res. A 2015, 75, 217–230. [Google Scholar] [CrossRef]
- Araghi, Y.; Kroesen, M.; Molin, E.; Van Wee, B. Revealing heterogeneity in air travelers’ responses to passenger-oriented environmental policies: A discrete-choice latent class model. Int. J. Sustain. Transp. 2016, 10, 765–772. [Google Scholar] [CrossRef]
- Alenazi, S.A. Sustainability awareness, price sensitivity, and willingness to pay for eco-friendly packaging: A discrete choice and valuation study in the Saudi retail sector. Sustainability 2025, 17, 7287. [Google Scholar] [CrossRef]
- Hensher, D.A.; Greene, W.H. The mixed logit model: The state of practice. Transportation 2003, 30, 133–176. [Google Scholar] [CrossRef]
- Boxall, P.C.; Adamowicz, W.L. Understanding heterogeneous preferences in random utility models: A latent class approach. Environ. Resour. Econ. 2002, 23, 421–446. [Google Scholar] [CrossRef]
- Greene, W.H.; Hensher, D.A. A latent class model for discrete choice analysis: Contrasts with mixed logit. Transp. Res. B 2003, 37, 681–698. [Google Scholar] [CrossRef]
- Lazarsfeld, P.F. Qualitative Analysis: Historical and Critical Essays, 1st ed.; Allyn and Bacon: Boston, MA, USA, 1972; pp. 47–51. [Google Scholar]
- Everitt, B.S. An Introduction to Latent Variable Models, 1st ed.; Chapman & Hall: New York, NY, USA, 1984; pp. 63–70. [Google Scholar]
- Macready, G.B.; Dayton, C.M. The use of probabilistic models in the assessment of mastery. J. Educ. Stat. 1977, 2, 99–120. [Google Scholar] [CrossRef]
- Pickering, R.M.; Forbes, J.F. A classification of Scottish infants using latent class analysis. Stat. Med. 1984, 3, 249–259. [Google Scholar] [CrossRef]
- Hidrue, M.K.; Parsons, G.R.; Kempton, W.; Gardner, M.P. Willingness to pay for electric vehicles and their attributes. Resour. Energy Econ. 2011, 33, 686–705. [Google Scholar] [CrossRef]
- Cronbach, L.J. Coefficient alpha and the internal structure of tests. Psychometrika 1951, 48, 99–111. [Google Scholar] [CrossRef]
- Bagozzi, R.P.; Fornell, C.; Larcker, D.F. Canonical correlation analysis as a special case of a structural relations model. Multivar. Behav. Res. 1981, 16, 437–454. [Google Scholar] [CrossRef] [PubMed]
- Buhmann, K.M.; Rialp-Criado, J.; Rialp-Criado, A. Predicting consumer intention to adopt battery electric vehicles: Extending the theory of planned behavior. Sustainability 2024, 16, 1284. [Google Scholar] [CrossRef]
- Prabpayak, C.; Boonchoo, T.; Jingjit, S. Motivators and environmental awareness for electric vehicle adoption in Thailand. World Electr. Veh. J. 2025, 16, 132. [Google Scholar] [CrossRef]
- Hu, X.; Yusof, R.N.R.; Mansor, Z.D. Consumers’ purchase intentions towards new energy vehicles based on the theory of planned behaviour on perceived value: An empirical survey of China. World Electr. Veh. J. 2025, 16, 120. [Google Scholar] [CrossRef]
- Chaniago, S.F.; Sutopo, W.; Ma’aram, A. Battery capacity or charging infrastructure? Cost modeling study to evaluate investments of electric motorcycles and supporting infrastructure in Malaysia. World Electr. Veh. J. 2025, 16, 93. [Google Scholar] [CrossRef]
- Szumska, E.M. Electric vehicle charging infrastructure along highways in the EU. Energies 2023, 16, 895. [Google Scholar] [CrossRef]

Disclaimer/Publisher’s Note: The statements, opinions and data contained in all publications are solely those of the individual author(s) and contributor(s) and not of MDPI and/or the editor(s). MDPI and/or the editor(s) disclaim responsibility for any injury to people or property resulting from any ideas, methods, instructions or products referred to in the content. |
© 2025 by the authors. Licensee MDPI, Basel, Switzerland. This article is an open access article distributed under the terms and conditions of the Creative Commons Attribution (CC BY) license (https://creativecommons.org/licenses/by/4.0/).