Abstract
Urban lakes are essential for ecological balance and urban development. This study developed a comprehensive framework to evaluate the ecosystem health of urban lakes in China. Nineteen representative lakes from four lake zones were examined using three decades of remote-sensing data combined with hydrological, water-quality, and aquatic–biological investigations. An extended DPSIR model guided the selection of 52 indicators, and a hierarchical weighting scheme was used: the analytic hierarchy process determined criterion-level weights, while principal component analysis with Softmax normalization was used for indicator-level weights. The established index system was applied to Xuanwu Lake and Erhai Lake, and an obstacle-degree model was used to identify key ecological constraints from 2010 to 2020. Results showed that urban lakes in the Yunnan–Guizhou Plateau and Eastern Plain zones were mainly constrained by eutrophication and intensive urbanization, with state- and impact-related indicators contributing most to the health index. The framework captured the decline of Xuanwu Lake, driven by poor water exchange and external nutrient loading, and its subsequent improvement following governance interventions, as well as the post-2014 degradation of Erhai Lake driven by climate-induced hydrological stress and non-point source pollution, providing a practical tool for diagnosing constraints and supporting adaptive, region-specific lake management.
1. Introduction
Lakes act as indicators and modulators of climate variability and change and are integral to the global environment [1,2]. As a combination of the urban artificial environment and the natural environment, urban lakes provide many functions, such as flood control, drainage, climate regulation, and maintaining ecological balance, in addition to recreational uses for humans. As a scarce environmental element, urban lakes have always been the focus of urban development, making them highly susceptible freshwater ecosystems on a global scale [3]. In fact, accelerated population expansion and economic growth have intensified the use and extraction of lake resources, while the protection of urban lake environments has received insufficient attention. It is already clear how global warming and intense human activities are causing many problems in lakes, such as shrinkage, salinization, siltation, deterioration of water quality, and structural changes in aquatic ecosystems. These problems have affected the hydrological and ecological services of urban lakes to a large extent [4]. For instance, rapid lake contraction and weakened connectivity with river networks exacerbate urban flooding and waterlogging; urban water pollution undermines the function of lakes as sources of drinking water sources; and biodiversity loss driven by severe lake degradation diminishes landscape value and constrains urban sustainability [5].
Lake health is inherently multidimensional, so credible diagnosis relies on a holistic yet balanced indicator architecture. In urban lakes, current evaluation methods can be categorized into three main types: the first is water-quality evaluations that quantify nutrients, organic loads, metals, etc., often synthesized with composite metrics such as trophic level index to benchmark eutrophication and enable spatiotemporal comparison [6,7]; the second is biological assessments that summarize communities of algae, plankton, macrophytes, fish, and particularly benthic macroinvertebrates using integrity-, diversity-, or biomarker-based indices to reflect ecological conditions [8]; and the third is integrated evaluations that fuse physical, chemical, and biological indicators within multi-criteria or modeling frameworks, including fuzzy comprehensive evaluation, pressure–state–response logic, system dynamics, and machine learning [9,10,11]. Overall, multi-metric designs that jointly capture ecosystem structure, composition, and function generally distinguish conditions more effectively and exhibit lower variability than single-indicator approaches because they track multiple stress pathways and interactions [12]. At the same time, unchecked indicator expansion increases data burdens and embeds redundancy, so selection and weighting should be selective and guided by theory.
Although the scientific significance and application value of lake ecosystem health assessment have been recognized by scholars and lake management departments, there has not been a unified lake ecosystem health assessment system due to the vagueness of its concept, and the diversity of evaluation objects and evaluation methods. First of all, China has a vast territory and a rich variety of lakes of different types, which are of different geographical characteristics and natural climates [13]. Meanwhile, due to disparities in economic development between regions in China, the relative contributions of industrial, urban, and agricultural activities to aquatic pollution differ among lake ecoregions [14], leading to great differences in the pollutant sources, water quality, and ecological functions of urban lakes. Accordingly, the construction of current lake health evaluation systems is often targeted at specific lakes, resulting in different evaluation systems and incomparable evaluation results. Secondly, research has traditionally emphasized natural or semi-natural lakes, whereas urban lakes have received comparatively limited attention. In recent years, several comprehensive assessment methods and models have been developed for natural lakes [15], while the indicator systems of natural lakes generally overlook social factors, resulting in poor applicability to urban lakes.
This research endeavor is of paramount importance precisely because it aligns closely with a series of updated national and local policies in China, such as the National Water Network Construction Planning Outline and the Opinions on the Full Implementation of the River Chief System, which underscore the urgency of safeguarding water resources and ensuring the health of rivers and lakes [16]. In this context, more attention has been paid to the study of lake ecosystem health in recent years. The evaluation and study of lake ecosystem health have put forward new concepts and methods for solving environmental problems. By evaluating lake ecosystem health, previous studies have identified the drivers of structural and functional degradation [17,18], assessed trajectories of ecosystem change [19], and provided evidence-based guidance for lake management [20]. Integrating these policy directives with lake health research both responds to pressing environmental challenges and supports policy implementation by supplying scientific insights and actionable strategies for the sustainable management and protection of urban lake ecosystems.
To enable real-time monitoring of lake ecological status, improve lake management policies, and achieve integrated management, it is essential to quantitatively assess lake ecosystem health. This study aims to (1) analyze hydrology, water quality, eutrophication, and their causes in urban lakes across different ecoregions, summarizing key driving factors, pollutant sources, and ecological issues; (2) develop a health assessment index system aligned with the concept of urban lake ecosystem health, addressing major ecological problems and meeting governmental protection requirements; (3) establish a hybrid weighting strategy combining AHP and PCA-Softmax methods to assign region-specific weights; and (4) apply this system to two representative urban lakes from distinct lake zones to identify critical constraints to lake health using an integrated obstacle degree diagnosis model.
2. Materials and Methods
2.1. Data Sources
2.1.1. Urban Lake Data
China covers an extensive geographic area and exhibits pronounced spatial heterogeneity in climate, geological settings, and hydrological regimes [21,22]. According to the above differences, China can be partitioned into five lake ecoregions, including the Northeast Plain and Mountain Lake Zone (NPML), the Inner Mongolia–Xinjiang Plateau Lake Zone (MXPL), the Chuan–YunGui Plateau Lake Zone (YGPL), the Eastern Plain Lake Zone (EPL) and Tibetan Plateau Lake Zone (TPLZ) (Figure 1). However, the Tibetan Plateau Lake Zone is not discussed in this study due to the small number of urban lakes and lack of data.
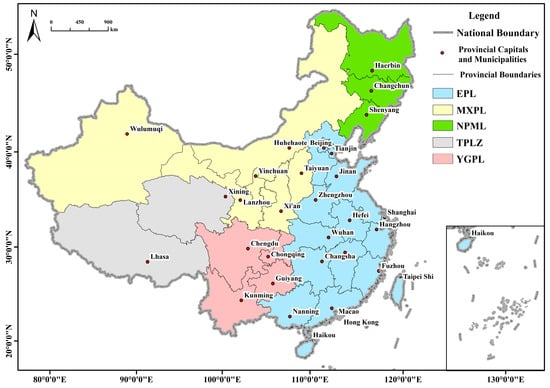
Figure 1.
Lake distribution in China (NPML—Northeast Plain and Mountain Lake Zone; MXPL—Inner Mongolia–Xinjiang Plateau Lake Zone; TPLZ—Tibetan Plateau Lake Zone; YGPL—Chuan–YunGui Plateau Lake Zone; EPL—Eastern Plain Lake Zone).
The foundational data for this study were obtained from a publicly released dataset of urban lakes in China. Using cloud-free Sentinel-2 images from 2019 to 2021, high-quality composite images were generated through median synthesis. Technical details can be found in the work of Song et al. [23]. This study extracted lakes located within urban boundaries, as well as those intersecting with urban boundaries, from the dataset for analysis. Large lakes adjacent to urban areas, such as Lake Taihu and Lake Dianchi, were excluded because only a small proportion of their shoreline and water surface is directly influenced by cities, and their hydrological regime, watershed land use, and management objectives are dominated by regional rather than local urban factors. Including these lakes would markedly skew the size distribution of the sample and mask the characteristics of typical urban lakes; therefore, our analysis focused on medium- and small-sized urban lakes. The dataset is publicly available at https://figshare.com/articles/dataset/UrbanLake_finalData_zip/20583558 (accessed on 6 October 2023). Spatial overlay of lake polygons with urban administrative boundaries and lake ecoregions, as well as cartographic visualization, were conducted in ArcGIS 10.8. In addition, all available Landsat data from 1988 to 2020 on the Google Earth Engine (GEE) platform were utilized to extract long-term time series of the spatial extent of 19 representative urban lakes [24], defined here as well-known urban lakes with high recreational and tourism value that are closely linked to residents’ daily lives. These data were systematically analyzed to investigate the characteristics of lake area changes over time, providing a foundation for exploring the relationships between long-term urban lake dynamics, climate change, and human activities.
2.1.2. Key Geographic Elements Data
Robust and accurate data are fundamental for assessing the health of urban lake ecosystems. At the same time, constructing an index system for urban lake ecosystem health requires compiling large and diverse datasets, because such ecosystems form a complex socio-ecological system that integrates natural, economic, and social components [25]. Therefore, when selecting evaluation indicators, it is necessary to ensure that the specific value of indicators can be found from statistical yearbook, statistical bulletin, environmental quality bulletins, the literature, and scientific research institutions, as such data collection methods are the fastest and most accurate.
Data on annual average temperature and precipitation for the lakes examined in this study were obtained from the China Meteorological Data Service Center (https://data.cma.cn/ (accessed on 17 March 2024)). Information on average lake depth was sourced from the China Lake Records (https://www.data.ac.cn/table/tba21 (accessed on 21 May 2024)). Urban built-up area data from 2002 to 2019 and total population and GDP from 1988 to 2019 were collected from the statistical yearbooks of individual cities and the China Urban Construction Statistical Yearbook (https://www.stats.gov.cn/sj/ndsj/ (accessed on 26 March 2024)). All non-remote sensing data were digitized and processed in Microsoft Excel, and all figures were generated using Origin 2021. Pearson correlation coefficients between lake area variations and climatic or socio-economic variables, together with their significance levels (p-values), were calculated in Python 3.4, as detailed in Appendix A.1.
Lake water quality data were derived from two sources. Data for 2011 were obtained from the national survey on regional differences in lake eutrophication [26]. To extend the temporal coverage, we also used routine water quality-monitoring data collected independently by municipal environmental authorities between 2012 and 2018. For each urban lake, all available measurements of key water quality indicators for the period 2011–2018 were compiled and used in the ecosystem health assessment. Although the specific monitoring dates differ among lakes, all observations fall within a relatively narrow and recent time window and are therefore considered comparable for regional analysis. Other environmental data, including sediment characteristics and aquatic ecological indicators, were sourced from the Bulletin on the State of China’s Ecological Environment (https://www.mee.gov.cn/hjzl/sthjzk/ (accessed on 1 July 2024)), China Lake Records [27], China Lake Environment [28], China Lake Water Resources (http://www.mwr.gov.cn/sj/tjgb/szygb/ (accessed on 1 July 2024)), statistical yearbooks (e.g., Nanjing: https://tjj.nanjing.gov.cn/bmfw/njsj/ (accessed on 27 February 2025); Yunnan: https://stats.yn.gov.cn/List22.aspx (accessed on 27 February 2025)), environmental quality reports (https://www.mee.gov.cn/hjzl/sthjzk/ (accessed on 10 September 2024)), specifications for ecological river and lake status assessment (local standards).
2.2. Methods
2.2.1. Urban Ecosystem Health Assessment Model
The concept of Drivers–Pressure–State–Impact–Responses (DPSIRs) model was first proposed by the Organization of Economic Co-operation and Development in the 1990s [29]. Hence, the DPSIR framework has been widely adopted as a tool for systematically organizing and representing cause–effect relationships between human activities and environmental components [30]. With continued application and refinement, the DPSIR model has increasingly been used to construct evaluation index frameworks, primarily for ecosystem health and ecological security assessments that are relevant to managers and policy makers. The DPSIR concept can be viewed as a causal chain in which “drivers” generate “pressures” on the ecosystem, leading to changes in its “state,” which in turn produce specific “impacts” on human society and elicit corresponding “responses” from relevant institutions [31]. In this study, the DPSIR framework provides the overall conceptual structure for the urban lake ecosystem health index system. The construction of the indicator system followed four principles: systematic integrity, local adaptability, standardization, and independence. Indicator selection focused on both the natural and socio-economic attributes of the lakes. Finally, each indicator was assigned to one of the D, P, S, I, or R components according to its dominant role in the DPSIR causal chain.
2.2.2. Quantitative Assessment Method for the Value of Urban Lake Resources
Compared to indicators such as point source pollution, lake area changes, and water quality variation—which have clearly defined data sources and established calculation methods—the comprehensive impact of lake ecosystem status on regional economic development and human well-being remains insufficiently quantified and systematically assessed. This study applied a dynamic valuation approach to estimate lake ecosystem service values based on per-unit-area equivalent value coefficients [32]. Specifically, the value of ecosystem services was obtained by multiplying the equivalent value coefficient per unit lake area by the total lake surface area. One standard equivalent factor represents the economic value of the annual natural grain yield per hectare of cropland at the national mean level.
Using grain yield data from the National Bureau of Statistics, the grain yield per unit area was calculated for each lake region. Based on the average grain price for the corresponding year, the economic value of a single unit of ecosystem service equivalent was defined as one-seventh of the national average market value of grain yield per hectare. This approach enabled the estimation of the food production value per hectare of farmland and, by extension, the per-unit-area ecosystem service value of urban lakes for each region and year. The value of each ecosystem service type was computed as follows:
where is the n-th type of service value of urban lake resources, S denotes the total surface area of the urban lake, and p represents the corresponding per-unit-area service value.
2.2.3. Membership Degree of Evaluation Index
It is difficult to perform comparisons in multi-indicator comprehensive evaluation due to the dimensional differences in indicators and the lack of unified metric standards between each one [33]. Accordingly, fuzzy comprehensive evaluation (FCE) has become a widely adopted tool for health evaluation in recent years as it is a method that can solve fuzzy evaluations with fuzzy mathematics principles [34]. In FCE, the membership vector is the main carrier of information. Before the FCE, the membership degree of each factor according to different standards should be determined first, followed by establishing the fuzzy relation matrix.
Referring to the two types of piecewise functions of membership proposed by Hou et al. [35], the index value was transformed into memberships. The calculation formula of positive indicators is as follows:
while the formula of negative indicators is as follows:
where is the membership; is the index value; is the upper limit value; is the lower limit value; and is the fiducial value.
2.2.4. Index Weight Determination
In this study, a hybrid weighting strategy was employed to determine the index weights, tailored to the hierarchical structure and characteristics of the evaluation index system. Specifically, the analytic hierarchy process (AHP) was utilized to determine weights for the upper-level indices, while a combination of principal component analysis (PCA) and the Softmax regression model was utilized to infer data-driven weights for lower-level indicators.
AHP is a multi-objective decision analysis method that integrates qualitative judgments with quantitative analysis [36]. Its central idea is to construct a judgment matrix reflecting the relative importance of indicators and then derive indicator weights from the maximum eigenvalue and associated eigenvector of this matrix. In this study, the 1–9 scale was used to build the judgment matrix, and Yaahp software V10.3 was used to perform the calculation.
PCA is a multivariate statistical technique that transforms multiple correlated indicators into a smaller set of uncorrelated composite components, which can then be grouped according to specified rules. This method reduces dimensionality, condenses information, and simplifies complex problems, thereby enabling more intuitive and effective analysis. Consequently, PCA has been widely applied in environmental studies, including assessments of water eutrophication [37]. In this study, we innovatively integrate PCA with the Softmax function to construct an indicator weighting model.
PCA first extracts high-loading indicators (|loading| > 0.7) within each criterion layer, with cumulative variance explanation > 85%.
Contribution scores are then calculated based on absolute loadings and variance explanation rates:
where is the absolute value of the loading of the i-th original indicator on the principal component in the PCA; is the variance explained by the principal component on which Li is located.
Softmax transforms these scores into normalized weights:
This integrated approach maintains the advantage of PCA in eliminating indicator correlations while leveraging Softmax’s exponential characteristic to amplify the influence of key indicators, which significantly enhances assessment accuracy.
2.2.5. Calculation and Classification of Urban Lake Ecosystem Health Index
When the index weight is determined and the index value is converted into membership degree, the index of each criterion layer can be calculated as follows:
where is the exponential calculation result of the ith criterion layer (including driving force, pressure, state, impact and response); is the weight assigned to the j-th indicator within the i-th criterion level; and is the membership degree of that indicator. Thus, the comprehensive index of ecological health of urban lakes can be expressed as
where denotes the weight of the ith criterion layer. Combined with the development process of the health status of the lake ecosystem and relevant research [38], the health status of urban lake ecosystems was divided into five levels comprehensively summarizing the health status of urban lake ecosystems. The specific characteristics of each level are shown in Table A1 in the Appendix A.3.
2.2.6. Obstacle Factor Diagnosis Model
Following the assessment of urban lake ecosystem health, it is crucial to identify the key factors impeding ecological improvement to enable more targeted policy interventions. To this end, this study introduced the obstacle degree diagnosis model—a quantitative analytical framework derived from comprehensive evaluation models. The model is calculated using the following formula:
where represents the obstacle degree, indicating the extent to which the j-th indicator constrains lake ecosystem health; is the weight of the indicator; and is the membership degree.
For ease of understanding, the overall workflow—from lake selection and multi-source data integration to the construction of the DPSIR-based ecosystem health assessment system and its application to the representative lakes—is summarized in Appendix A.2 (Figure A1).
3. Results
3.1. Characteristics of Urban Lakes in Different Lakes Ecoregions
The urban lake ecosystem is a stable yet complex system formed by long-term interaction, mutual influence, and the combined development of the lake, surrounding environment, and human society. Compared with natural lakes, urban lakes are relatively static and closed, with thick sediment, high organic matter and nutrients content, and often eutrophic conditions. Nineteen representative urban lakes were selected from the four lake zones, as shown in Figure 2.
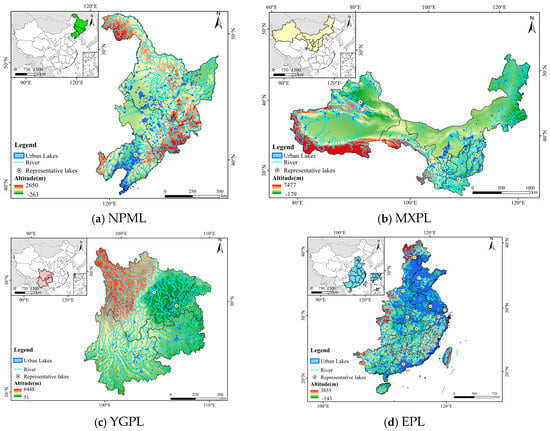
Figure 2.
Maps of the four lake ecoregions in China showing elevation, rivers, and urban lakes. Blue areas show lakes, blue lines show rivers, and yellow circles mark the representative urban lakes. (a) Northeast Plain and Mountain Lake Zone (NPML); (b) Inner Mongolia–Xinjiang Plateau Lake Zone (MXPL); (c) Chuan–YunGui Plateau Lake Zone (YGPL); (d) Eastern Plain Lake Zone (EPL).
This study employed remote sensing data to monitor the dynamic changes in representative urban lakes over the past three decades (Figure 3). Through investigation of the hydrology, water quality, sediment, and aquatic biological characteristics of the lakes, it revealed the regional differentiation trends of urban lakes (Table 1 and Table 2), forming the basis for the scientific selection of lake health evaluation indices and the determination of their weights.
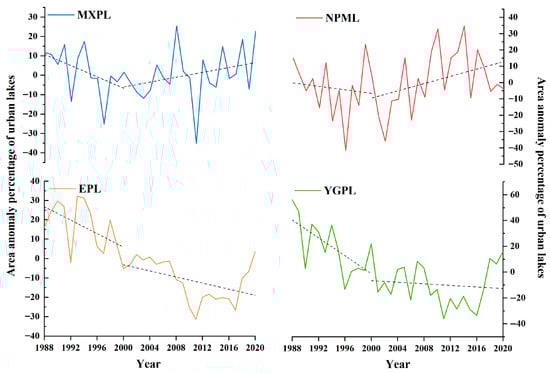
Figure 3.
Annual anomaly percentage of urban lake area from 1988 to 2020 in the four lake ecoregions of China. Solid lines show yearly anomaly percentage and dashed lines show linear trends. (NPML—Northeast Plain and Mountain Lake Zone; MXPL—Inner Mongolia–Xinjiang Plateau Lake Zone; YGPL—Chuan–YunGui Plateau Lake Zone; EPL—Eastern Plain Lake Zone).

Table 1.
Annual mean value of chemical and biological monitoring indicators in different lake ecoregions from 2011 to 2018.
Table 2.
Hydrology, water quality, sediment, aquatic biological characteristics and the main control measures of the representative urban lakes in different lake zones.
(1) Northeast Plain and Mountain Lake Zone (NPML)
From 1988 to 2020, the change in the area of lakes in the NPML fluctuated greatly, but it has shown a slightly increasing trend overall in the past three decades (Table 2). Quantitatively, the mean annual urban lake area averaged 16.674 km2, representing a net increase of 4.181% in the past three decades (Figure 3). Pearson correlation analysis revealed that this increase in lake area increase was partially attributable to government planning interventions, while the significant interannual fluctuations showed statistically significant correlations with precipitation variability (r = 0.34, p < 0.05) and temperature anomalies (r = −0.487, p < 0.05). Meanwhile, urban lake areas demonstrated weak correlations with total population (r = 0.191) and GDP (r = 0.394). Hence, the change in urban lakes in the NPML had a strong correlation with climate factors, and was also affected by human activities, although at a smaller magnitude [39].
In terms of water quality, the eutrophication level in the NPML over the past decade was between middle nutrition and mild eutrophication over the past decade, and some of the lakes in this zone were in danger of becoming eutrophic (Table 1). As the largest Chinese commodity grain base, northeast China contributes substantial agricultural nutrient loads to lakes, and reports of intensified eutrophication and harmful algal blooms have become more frequent in recent years [40]. Deterioration in water quality was not only due to the inflow of agricultural and domestic sewage, but also the thawing period of lakes in this area. During the thawing period, a large number of exogenous nutrients entered the water with the melting ice. The resulting disruption to the water body then accelerates the release of nitrogen and phosphorus from the sediment [41]. Additionally, the water supply in northern China was limited, resulting in a lack of ecological water demand, which was reported to be another important cause of cyanobacterial bloom in the water.
Above all, in the evaluation of urban lake ecosystem health in NPML, more attention should be paid to the influence of climate change, followed by, the impact of primary industry and tourism. The water quality was mainly affected by non-point source and sediment pollution (especially in the melting period), and the main problems were ecological water shortage, eutrophication and blooms outbreaks. Therefore, attention should be paid to the overall ecological water level, the degree of eutrophication, the nutrient content of sediment, and the quantity of cyanobacteria.
(2) Inner Mongolia–Xinjiang Plateau Lake Zone (MXPL)
The annual average total lake area in major cities within the MXPL exhibited relatively stable fluctuations, with area anomaly percentages generally maintained at approximately 10% or below in most years, and an average absolute value of 8.75% (Figure 3). On the whole, the area of urban lakes in the MXPL was relatively stable, and some of these lakes had a slight upward trend (Table 2), which was mainly related to the increase in precipitation (r = 0.436, p < 0.05).
In terms of water quality, the eutrophication level in the MXPL was between mild eutrophication and moderate eutrophication (Table 1), and fluctuated with the seasons. This is due to the fact that this zone is located in a representative cold and arid area of China, where lakes freeze in winter. Lake freezing aggravates the eutrophication of the water body, as the formation of an ice layer and changes in hydrodynamic conditions stop the exchange of substances between the lake and the outside [42].
Furthermore, a rapid increase in lake salinity and a marked trend of salinization have been observed in these regions, driven by an arid climate, increasing drought events, and diversion-based irrigation practices [43]. Salinity strongly affects the nutrient status of lake water, as the concentration of organic matter and pH increases with the increase in salinity, which has a significant effect on promoting the primary productivity of the lake. Therefore, chemical oxygen demand (COD) also became the main pollutant in the lake zone (Table 1). Studies have shown that total dissolved solid is a key factor controlling the primary productivity of MXPL, and has a good correlation with the nutrient reference indices [44]. Accordingly, it is crucial to incorporate mineralization into the nutrient reference indices for MXPL lakes to guide effective restoration measures in this area.
In summary, in the evaluation of urban lake ecosystem health in MXPL, more attention should be paid to the impacts of climate change and primary and secondary industry. The water quality was mainly affected by non-point source and sediment pollution, and the main problems were high organic pollution, high salinity, high eutrophication and fragile aquatic plants (Table 1). Consequently, more attention should be paid to COD and total dissolved solid contents, the degree of eutrophication, the nutrient content of sediment, and aquatic plant coverage.
(3) Yunnan–Guizhou Plateau Lake Zone (YGPL)
The annual average percentage anomaly of total lake area in major cities of YGPL fluctuated between −36.4% and 56.0%, with the average annual change in total lake area per city ranging from 0 to 8.628 km2 (Figure 3). The lake area of YGPL showed a decreasing trend, which was negatively correlated with the urban built-up area (r = −0.737, p < 0.05), the total population (r = −0.810, p < 0.01), and GDP (r = −0.785, p < 0.01).
Meanwhile, this lake zone exhibited severe eutrophication, with nitrogen and phosphorus concentrations significantly exceeding those observed in other regions (Table 1). Xu. et al. [45] found that the urban non-point source pollution load increased in response to the expansion of built-up areas during 1988 and 2014, accompanied by substantial surface runoff carrying high nutrient concentrations. These findings indicated that the phenomenon of eutrophication was the direct after-effects of the intensity of human economic activities in this lake zone during the investigated period. Thus, eutrophication in this lake zone manifested as a direct consequence of intensive human economic activity. In addition, lakes in this zone had deeper water depths than others (Table 2), resulting in longer water exchange cycles and more fragile ecosystems, which posed difficulties for absorbing and regulating nutrient inputs, and eventually indirectly aggravated water pollution. Furthermore, when comparing meteorological conditions between zones, the temperature difference in YGPL was not obvious; for instance, the average water temperatures in Lake Dianchi (YGPL) were approximately 5 °C higher than those in Lake Taihu (EPL) during winter and spring [46], which is strongly favorable for the formation of algae [47,48].
To sum up, based on the evaluation of urban lake ecosystem health in YGPL, greater emphasis should be placed on the impact of human activities, followed by primary industry and tourism. The water quality in this area was mainly affected by non-point source pollution, and the main problems were a long water exchange cycle, low coverage of aquatic plants, a high degree of eutrophication, and a large number of cyanobacteria.
(4) Eastern Plain Lake Zone (EPL)
From 1988 to 2020, the annual mean percentage anomaly of total lake surface area in major cities of the EPL fluctuated between −31.261% and 32.763%, with annual areal changes ranging from 0 to 48.439 km2 (Figure 3). During 2008–2011, the mean total lake area decreased annually by 16.586–46.219 km2/yr. Following a growth period (2013–2017), the lake areas maintained relative stability until another reduction occurred in 2018. Over the past three decades, accelerated urbanization has progressively intensified anthropogenic pressures on lacustrine ecosystems (Table 2). As the economic and population center, nearly all lakes in this zone have been affected by human interventions, including dam construction, water withdrawal and diversions, and, in particular, the conversion of lakes into croplands and urban lands. Statistical analyses also revealed strong negative correlations between variations in urban lake area and three socioeconomic indicators: urban built-up area (r = −0.897, p < 0.05), total population (r = −0.969, p < 0.01), and GDP (r = −0.937, p < 0.01).
Meanwhile, most of the lakes in this zone had experienced varying degrees of eutrophication (Table 2), among which the middle and lower reaches of the Yangtze River were the most severely affected in China, and cyanobacterial blooms occurred frequently [49]. According to the survey, in addition to the impact of domestic sewage, the primary causes of the poor water quality were the substandard water quality of replenishment and the frequent disturbance to lake sediments caused by cruise ships.
Above all, in the evaluation of urban lake ecosystem health in EPL, priority should be given to assessing the impact of human activities, followed by tourism. Water quality was chiefly affected by the condition of inflowing rivers and replenishment water, as well as municipal wastewater, while the dominant problems were shrinking lake area and recurrent algal blooms. Accordingly, more attention should be paid to the lake area, the degree of eutrophication, and the quantity of cyanobacteria.
3.2. DPSIR Model
According to the extended DPSIR model, the candidate evaluation indices were selected from five aspects of human social and economic influence and natural factors (driving force, pressure), water ecological health (state), service function (influence), and management regulation (response) to reflect the new changes in river–lake relationships, social and economic development, water resource protection, and ecological environment protection.
Driving force (D): Based on the results presented in Section 3.1, climate changes and human factors are the causes of lake degradation. In this study, the climate impact was summarized in terms of ‘pressure’, as ‘driving force’ was usually defined as the potential cause of changes to the ecological environment. In this sense, driving-force indicators could be identified as human needs responsible for pressures on the ecosystem, which refer to social and economic development in the process of urbanization as well as the corresponding changes in lifestyle, consumption patterns, and production modes [50]. Therefore, indicators used to reflect factors such as urban economic and social development that drive environmental problems were selected in this layer and were further differentiated as population and economy. The specific indicators are shown in Figure 4.
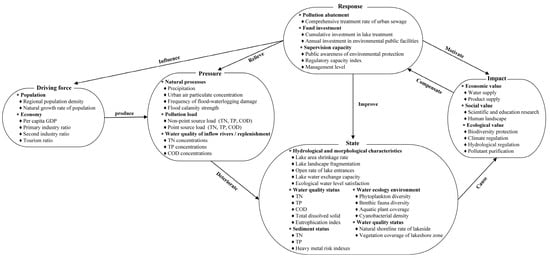
Figure 4.
DPSIR-based conceptual framework for assessing urban lake ecosystem health. Driving-force indicators (population and economy) generate environmental pressures (natural processes, pollution load, and water quality of inflow rivers/replenishment), which in turn alter the ecosystem state (hydrological and morphological characteristics, water quality status, sediment status, water ecology environment, and lakeside landscape). Changes in state affect impacts on human well-being and development (economic, social, and ecological values), while management responses (pollution abatement, fund investment, and supervision capacity) act to relieve pressures and improve ecosystem state. Arrows indicate the main cause–effect relationships and feedbacks among DPSIR components. (DPSIR—Drivers–Pressure–State–Impact–Response; GDP—gross domestic product; TN—total nitrogen; TP—total phosphorus; COD—chemical oxygen demand).
Pressure (P): Pressure indicators describe the stresses imposed on the environment by natural processes and human activities. For lakes, climate-related pressure is mainly seen in rainfall changes, which affect lake area and are linked to rising nutrient wet deposition in China [51]. The ecological consequences of atmospheric nitrogen and phosphorus deposition on urban lakes is expected to grow, especially as point and non-point pollution becomes controlled—yet it is often overlooked in evaluations [52]. Thus, rainfall and urban air quality were considered natural pressure indicators in this study. Additionally, under the combined effects of global warming and rapid urbanization, urban flooding in China is worsening, emphasizing the need to recognize the flood storage function of urban lakes. Therefore, flood frequency and severity were also included as key natural pressure factors. The specific indicators are shown in Figure 4.
State (S): Status indicators mainly include the status quo of ecosystems and the natural environment, which reflect the changes in environmental elements and the ultimate goals of environmental policies. The selection of indicators mainly considered the biological, physical, and chemical properties and ecological functions of the environment or ecosystem, including hydrological and morphological characteristics, water quality status, sediment status, water ecology, and lakeside landscape. Based on the characteristics of urban lakes and following the principles of representativeness, availability, and comparability, candidate indicators were identified with reference to the “river and lake health assessment indicators, standards and methods” published by the Ministry of Water Resources. Details are presented in Figure 4.
Impact (I): Impact refers to the effects of the current ecosystem status on economic development and human well-being. From the perspective of urban lake resource beneficiaries, this study selected indicators encompassing three dimensions: economic, social, and ecological value. The specific indicators are shown in Figure 4. The equivalence values for various ecosystem services were determined based on the calculation method in Section 2.2.2, as shown in Table 3. Taking 2018 as an example, the table also presents the per-unit-area ecosystem service values of urban lakes across different lake regions.
Table 3.
Per-unit-area equivalence and ecosystem service value of urban lakes in different lakes ecoregions in 2018.
Response (R): The response indicators reflect the measures implemented by the government, society, and mass organizations to promote the healthy development of urban ecosystems, mainly reflected in environmental governance and economic and departmental policies. Details are presented in Figure 4.
3.3. Affirmation of the Target Weight
In this study, a preliminary urban lake ecosystem health evaluation index system was established, comprising one target layer, five criterion layers, sixteen factor layers, and fifty-two indicator layers.
The weights of each layer were determined using a hierarchical methodology. First, the AHP was applied to conduct pairwise comparisons at the criterion layer level, leading to the construction of a judgment matrix and the calculation of corresponding weights. The results indicated a maximum eigenvalue of λmax = 5.214, a consistency index (CI) of 0.0535, a random consistency index (RI) of 1.12, and a consistency ratio (CR) of 0.0478 < 0.1, thereby satisfying the consistency requirement. Consequently, the criterion layer weights were determined as Wi (D, P, S, I, R) = (0.0481, 0.1082, 0.4482, 0.2330, 0.1625).
For the indicator layer, historical data from 19 lakes collected between 2011 and 2017 were used. The mean values of each indicator across lake districts were calculated and standardized. PCA was then conducted within each criterion layer to identify key high-loading indicators (Table 4). Contribution scores were derived by integrating both loading intensity and explained variance. These scores were then normalized using the Softmax function to generate differentiated weights. This approach not only retains the advantage of PCA in eliminating multicollinearity among indicators but also emphasizes the importance of dominant indicators through Softmax normalization. Consequently, a weighting system that reflects regional characteristics was established, and 36 indicators were selected accordingly. The results are shown in Figure 5 and Table A2.
Table 4.
Principal component analysis (PCA) results for indicators in each DPSIR criterion layer of the urban lake ecosystem health evaluation system.
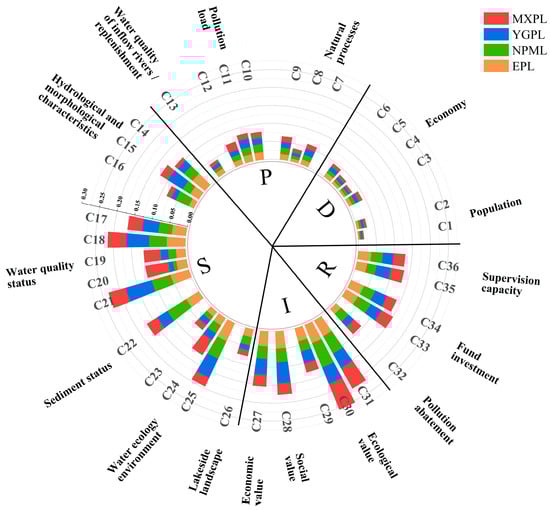
Figure 5.
Normalized weights of the 36 indicators (C1–C36) in the DPSIR-based urban lake ecosystem health evaluation system within different lake ecoregions. Bars show indicator weights for MXPL (red), YGPL (blue), NPML (green) and EPL (orange). Indicators are grouped by criterion layer: driving force (D), pressure (P), state (S), impact (I), and response (R). The full names of indicators C1–C36 are given in Table A2. MXPL—Inner Mongolia–Xinjiang Plateau Lake Zone; YGPL—Chuan–YunGui Plateau Lake Zone; NPML—Northeast Plain and Mountain Lake Zone; EPL—Eastern Plain Lake Zone.
3.4. Ecosystem Health Analysis of Typical Urban Lakes in Different Lake Ecoregions
Based on the established urban lake ecosystem health assessment system, the changing trends of the health of Xuanwu Lake in the Eastern Plain Lake Zone and Erhai Lake in the Chuan–YunGui Plateau Lake Zone from 2010 to 2020 were analyzed, respectively. Xuanwu Lake, located in Jiangsu Province, is a typical shallow urban lake. It is the largest urban park in Jiangnan area and the largest royal garden lake in China. Erhai Lake, located in Yunnan Province, is one of the nine plateau lakes. It serves not only as the most important scenic attraction in Dali and a key driver of local socio-economic development, but also as the primary water source for domestic and productive uses in the surrounding areas.
In the calculation of the membership degree of evaluation indicators, the variation range of the values of each indicator within 10 years was arranged from small to large, and then divided into five sections on average [33,35]. The values of the segment nodes in the first, second, fourth, and fifth sections were taken as the lower limit value (L) and the upper limit value (U), respectively, and the midpoint value of L and U was taken as the fiducial value (B). The specific values and final calculation results of each indicator are shown in Table A3.
Based on the established lake ecological health evaluation index system and the corresponding index weights for each lake zone (Table A2), the ecosystem health indices of Xuanwu Lake and Erhai Lake from 2010 to 2020 were calculated, with the trends illustrated in Figure 6. Furthermore, the obstacle degree diagnosis model was employed to identify the key factors impeding the ecological health of urban lakes in the two cities. Factors with an obstacle degree greater than 0.05 were considered the main constraints (Table 5 and Table 6).
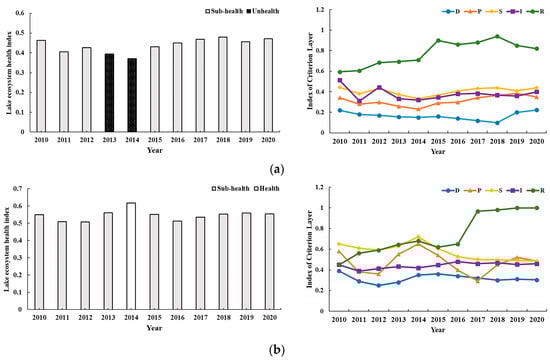
Figure 6.
Interannual changes in lake ecological ecosystem health index and criterion layer index in Xuanwu Lake and Erhai Lake from 2010 to 2020. (a) Xuanwu Lake; (b) Erhai Lake. For each lake, the left panel shows the comprehensive lake ecosystem health index, with bar shading indicating the health status class (healthy, sub-healthy, or unhealthy; see Table A1). The right panel shows the indices of the five DPSIR criterion layers: driving force (D), pressure (P), state (S), impact (I), and response (R).
Table 5.
Ranking of obstacle degrees for ecosystem health indicators in Xuanwu Lake.
Table 6.
Ranking of obstacle degrees for ecosystem health indicators in Erhai Lake.
The ecosystem health index of Xuanwu Lake experienced a downward trend followed by an upward trend, among which only 2013 and 2014 were classed as unhealthy, and the remaining years showed a sub-healthy status (Figure 6a). At this stage, the main constraints on the ecological health of the lake arose from the pressure and state layers (Table 5). The lake had limited water exchange capacity, and the inflowing channels exhibited poor water quality. Rainfall-induced runoff contained high concentrations of TN, reaching up to 2.55 mg/L, leading to lake TN levels that exceeded the standard by 1.08 to 2.1 times. In addition, sediment released approximately 2.094 t/a of phosphorus, sustaining an average TP concentration of 0.101 mg/L, indicative of a eutrophic state. In 2015, the implementation of dredging, water diversion, and aquatic vegetation planting at inflow points and within the lake (Figure 7) contributed to a positive trend in the response layer index of Xuanwu Lake. Consequently, the state layer index improved continuously after 2015, indicating that the status of the water ecological environment has gradually improved.
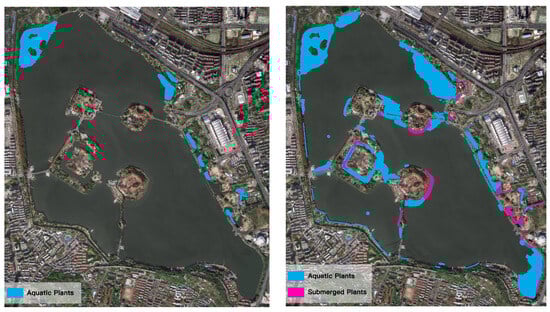
Figure 7.
Spatial distribution and area changes in aquatic vegetation in Xuanwu Lake before (in 2016) and after ecological restoration (in 2018).
As for Erhai Lake, the state layer was better than that of Xuanwu Lake, which has maintained a medium-quality nutrition level for a long time. However, since 2014, the state layer index has shown a downward trend, closely related to the decrease in the inflow water caused by the continuous increase in temperature and the decrease in precipitation after 2009 (Table 6). The decline trend slowed down significantly after 2017, indicating that the rescue protection works in Erhai Lake that started in 2016 were effective in slowing down the evolution process of eutrophication (Figure 6b). In addition, the calculations indicated that pollution to the water environment in Erhai Lake Basin originated predominantly from non-point source inputs, among which the pollution emissions of livestock and poultry breeding accounted for more than half on average, with the peak value occurring in 2016 (Table 6). Therefore, the adjustment of agricultural production structure and scientific standardization of livestock and poultry breeding are essential for managing the water environment at Erhai Lake.
4. Discussion
The spatial and temporal patterns identified across the four lake ecoregions indicate that urban lake ecosystem health is jointly controlled by climatic forcing, watershed disturbance, and the intrinsic resilience of lake ecosystems. Lakes in the Yunnan–Guizhou Plateau and Eastern Plain zones generally exhibited poorer health, with eutrophication and intensive urbanization emerging as dominant constraints, whereas lakes in the Northeast Plain–Mountain and Inner Mongolia–Xinjiang Plateau zones were more strongly influenced by climate variability, freeze–thaw processes, and salinity. These findings are consistent with previous studies reporting that lowland urban lakes in densely populated regions are primarily affected by nutrient enrichment, shoreline modification, and land-use change [53], while lakes in plateaus and cold regions are particularly sensitive to hydrological and thermal changes driven by climate and water management [54]. Xuanwu Lake and Erhai Lake served as typical examples: Xuanwu Lake reflects the trajectory of shallow urban plain lakes under combined external and internal nutrient loading, whereas Erhai Lake illustrates how highland lakes with long residence times respond to the compound effects of climate-induced hydrological stress and non-point source pollution [55,56].
Placing these results within the DPSIR framework helps to clarify how drivers, pressures, state, impacts, and responses interact in urban lake systems. Long-term land-use change, population growth, and economic development act as driving forces that intensify pressures such as nutrient loading, lakeshore hardening, hydrological regulation, and atmospheric deposition. The ecosystem state—captured here by eutrophication level, nutrient and organic matter concentrations, hydromorphology, and biological communities—responds non-linearly to these pressures, with degradation accelerating beyond certain thresholds. Governance responses, including engineering interventions and ecological restoration measures, then feed back into the system by modifying both pressures (e.g., pollutant interception, reduction in internal loading) and state variables (e.g., macrophyte recovery, improved water clarity). This logic is broadly consistent with earlier DPSIR-based assessments of lakes and rivers [57,58], but the present work extends the referential framework by embedding DPSIR in a regionally differentiated indicator system and by explicitly linking long-term “pressure–state–response” trajectories to lake ecoregions, rather than treating all urban lakes as a single homogeneous class.
Several limitations of this study should be acknowledged when interpreting the findings. First, the assessment relies on remote sensing products combined with a finite number of in situ hydrological, water quality, and biological surveys; uncertainties associated with sensor characteristics, retrieval algorithms, and temporal mismatches between satellite overpasses and field campaigns inevitably propagate into the indicator values and health scores [59,60]. Second, although the indicator system covers key physical, chemical, and ecological attributes, some dimensions of ecosystem services and social context—such as cultural and recreational values or stakeholder perceptions—remain under-represented, despite their growing importance in urban water governance [61]. Finally, the hybrid weighting scheme yields static weights within each ecoregion and period and does not explicitly account for shifts in management priorities or emerging stressors (e.g., microplastics and novel contaminants) [62].
Notwithstanding these limitations, the results underscore the practical significance of a regionally differentiated, DPSIR-based health assessment framework grounded in long-term, multi-source data. More generally, the framework provides a structured way to connect ecological diagnosis with policy design at the lake ecoregion scale, and it offers a basis for developing adaptive monitoring and assessment systems that can track how urban lake ecosystems respond to ongoing urbanization and climate change.
5. Conclusions
This study set out to develop a regionally adaptive framework for assessing the ecosystem health of urban lakes in China, using an extended DPSIR model as the organizing concept. The main contribution of the work is the move from single-region, water quality-centered assessments toward a multi-ecoregion, multi-component diagnostic framework that explicitly links socio-economic drivers, climatic and anthropogenic pressures, ecological state, ecosystem services, and management responses within a single indicator system.
Methodologically, the study contributes in three key ways. First, it operationalizes an extended DPSIR framework for urban lakes at a national scale, integrating three decades of remote sensing data with hydrological, water quality, sediment, and ecological information for 19 representative lakes. Second, it introduces a hierarchical weighting strategy that combined expert-based AHP at the criterion level with PCA–Softmax-based weights at the indicator level, allowing the importance of indicators to reflect both ecological understanding and region-specific data structure. Third, by coupling the health index with an obstacle degree diagnosis model, the framework goes beyond simple grading to identify and rank the main constraints on lake health in different ecoregions, thereby offering a direct basis for prioritizing management actions.
The findings suggest that effective urban lake management must be differentiated by ecoregion and centered on those indicators that most strongly influence ecosystem state and services. For plateau and Eastern Plain lakes, this implied a focus on controlling eutrophication, managing non-point source pollution, and limiting ecologically damaging urban expansion, whereas for lakes in northern and arid regions, it pointed to the importance of maintaining ecological water supply, managing salinity, and accounting for freeze–thaw dynamics. In general, the results strengthened the idea that DPSIR-based, data-informed health assessment frameworks could serve as practical tools for linking ecological diagnosis with policy design and evaluation.
Future research should build on this work in several directions. A natural progression is to develop procedures for periodically updating indicator sets and weights as new monitoring technologies and management priorities emerge, thereby turning the current framework into an adaptive decision support tool. Further applications to a larger number and wider range of urban lakes would help to test the robustness and transferability of the approach. Finally, coupling the DPSIR-based health assessment with hydrodynamic–biogeochemical models and socio-economic scenarios would enable exploration of alternative restoration and development pathways, and support the design of resilient, region-specific strategies for urban lake management under ongoing urbanization and climate change.
Author Contributions
Conceptualization, X.W.; Data curation, X.T. and H.Z.; Formal analysis, X.T.; Funding acquisition, H.S.; Investigation, X.W. and W.Z.; Methodology, X.W. and D.G.; Project administration, H.S.; Software, X.W. and T.Z.; Supervision, R.S. and H.S.; Visualization, X.W. and T.Z.; Writing—original draft, X.W. and D.G.; Writing—review and editing, W.Z., T.Z. and M.G. All authors have read and agreed to the published version of the manuscript.
Funding
This research was funded by 2025 Special Project of Sichuan Academy of Eco-Environmental Sciences (ZX-2025106) and the National Natural Science Foundation of China (General Program), 42477089.
Institutional Review Board Statement
Not applicable.
Informed Consent Statement
Not applicable.
Data Availability Statement
The datasets generated and/or analyzed during the current study are not publicly available because part of the data comes from government agencies, but they are available from the corresponding author on reasonable request.
Acknowledgments
The authors sincerely thank the anonymous reviewers and academic editor for their constructive comments and suggestions.
Conflicts of Interest
The authors declare no conflicts of interest.
Appendix A
Appendix A.1. Pearson Correlation Analysis
Pearson correlation analysis was used to quantify the linear relationships between annual lake-area anomalies and climatic (e.g., precipitation, temperature) and socio-economic variables (e.g., urban built-up area, population, GDP). The Pearson correlation coefficient r between two variables X = (x1,…xn) and Y = (y1,…yn) is defined as:
where and are the sample means of X and Y, respectively.
Appendix A.2. Overall Research Framework for the Regionalized Assessment of Urban Lake Ecosystem Health in China
The framework started from the selection of 19 representative urban lakes distributed across four lake ecoregions in China (NPML, EPL, MXPL, and YGPL). For these lakes, multi-source datasets were compiled, including remote-sensing products, records from the China Meteorological Data Service Center, and statistical yearbooks, covering lake-area dynamics, hydrology, water quality, aquatic biology. Based on these data, the characteristics of urban lake ecosystems in different ecoregions were analyzed. An evaluation index system was then developed using an extended DPSIR model, in which candidate indicators were assigned to the driving force (D), pressure (P), state (S), impact (I), and response (R) components. Index weights were determined hierarchically: criterion-level weights were obtained with the Analytic Hierarchy Process (AHP) and indicator-level weights were derived from a combination of principal component analysis (PCA) and a Softmax regression model. Finally, the DPSIR-based index system and weights were applied to Xuanwu Lake and Erhai Lake. The obstacle-factor diagnosis model was used to identify the key ecological constraints. The overall workflow is illustrated in Figure A1.

Figure A1.
Overall research framework for the regionalized assessment of urban lake ecosystem health in China.
Appendix A.3. Construction of the Assessment Framework for Urban Lake Ecosystem Health
Table A1.
Description of health level characteristics of urban lake ecosystem.
Table A1.
Description of health level characteristics of urban lake ecosystem.
| State | Range | Characteristics |
|---|---|---|
| Ideal | >0.8~1.0 | The structure of lake ecosystem is highly coordinated and has energy input and output with the surrounding ecosystem. The strong anti-interference ability allows for the stability of its structure and function. In this sense, it can achieve harmony with human society and create social wealth for human beings. |
| Health | >0.6~0.8 | The structure of lake ecosystem is relatively complete, and the external pressure on the whole is small. The structure of lake ecosystem is in a stable and sustainable state. |
| Sub-health | >0.4~0.6 | The health degree of the lake ecosystem is in a critical state. The structure and function of the ecosystem are not stable, and the external pressure is large. There are certain problems in the ecosystem, and the ecosystem is in a state that can be basically maintained. |
| Unhealth | >0.2~0.4 | The external pressure on the lake ecosystem is large, and the structure and function of the ecosystem have been degraded, and its structure has great defects. |
| Sickness | 0~0.2 | The lake ecosystem is facing serious threats. The lake structure is disordered, cyanobacteria blooms occur frequently, biodiversity such as fish is seriously lost, and the ecological service functions such as drinking water, fishery production, tourism and entertainment are seriously damaged. |
Table A2.
Urban lake ecosystem health assessment system and the weight value of evaluation indicators.
Table A2.
Urban lake ecosystem health assessment system and the weight value of evaluation indicators.
| Target Layer | Criterion Layer | Criterion Layer Weight Value | Factor Layer | Index Layer | Index Weight of Each Lake Ecoregion | |||
|---|---|---|---|---|---|---|---|---|
| EPL | NPML | YGPL | MXPL | |||||
| Urban lake ecosystem health assessment system | Driving force | 0.0481 | Population | Regional population density (C1) | 0.084 | 0.086 | 0.084 | 0.090 |
| Natural growth rate of population (C2) | 0.145 | 0.150 | 0.146 | 0.157 | ||||
| Economy | Per capital GDP (C3) | 0.210 | 0.217 | 0.212 | 0.228 | |||
| Primary industry ratio (C4) | 0.127 | 0.178 | 0.129 | 0.138 | ||||
| Second industry ratio (C5) | 0.165 | 0.171 | 0.167 | 0.179 | ||||
| Tourism ratio (C6) | 0.269 | 0.198 | 0.262 | 0.208 | ||||
| Pressure | 0.1082 | Natural processes | Precipitation (C7) | 0.129 | 0.128 | 0.168 | 0.130 | |
| Urban air particulate concentration (particle size ≤ 10 μm) (C8) | 0.077 | 0.078 | 0.077 | 0.110 | ||||
| Frequency of flood-waterlogging damage (C9) | 0.145 | 0.173 | 0.146 | 0.147 | ||||
| Pollution load | Non-point source of TN load (C10) | 0.198 | 0.205 | 0.159 | 0.160 | |||
| Non-point source of TP load (C11) | 0.186 | 0.192 | 0.224 | 0.150 | ||||
| Point source of COD load (C12) | 0.135 | 0.135 | 0.136 | 0.212 | ||||
| Water quality of inflow rivers/replenishment | TN concentrations in river/replenishment (C13) | 0.130 | 0.089 | 0.090 | 0.091 | |||
| State | 0.4482 | Hydrological and morphological characteristics | Lake area shrinkage rate (C14) | 0.099 | 0.068 | 0.05 | 0.025 | |
| Lake water exchange capacity (C15) | 0.063 | 0.055 | 0.108 | 0.056 | ||||
| Ecological water level satisfaction (C16) | 0.035 | 0.088 | 0.032 | 0.031 | ||||
| Water quality status | TN (C17) | 0.089 | 0.084 | 0.102 | 0.09 | |||
| TP (C18) | 0.116 | 0.11 | 0.142 | 0.114 | ||||
| COD (C19) | 0.059 | 0.049 | 0.047 | 0.105 | ||||
| Total dissolved solid (C20) | 0.065 | 0.022 | 0.028 | 0.145 | ||||
| Eutrophication index (C21) | 0.118 | 0.122 | 0.169 | 0.11 | ||||
| Sediment status | TP (C22) | 0.092 | 0.138 | 0.075 | 0.076 | |||
| Water ecology environment | Phytoplankton diversity (C23) | 0.037 | 0.03 | 0.038 | 0.04 | |||
| Aquatic plant coverage (C24) | 0.055 | 0.059 | 0.046 | 0.112 | ||||
| Cyanobacterial density (C25) | 0.123 | 0.122 | 0.131 | 0.059 | ||||
| Lakeside landscape | Natural shoreline rate of lakeside (C26) | 0.049 | 0.053 | 0.032 | 0.037 | |||
| Impact | 0.2330 | Economic value | Water supply (C27) | 0.180 | 0.152 | 0.190 | 0.141 | |
| Social value | Human landscape (C28) | 0.208 | 0.165 | 0.250 | 0.138 | |||
| Ecological value | Biodiversity protection (C29) | 0.161 | 0.128 | 0.150 | 0.109 | |||
| Hydrological regulation (C30) | 0.235 | 0.315 | 0.212 | 0.332 | ||||
| Pollutant purification (C31) | 0.216 | 0.240 | 0.198 | 0.280 | ||||
| Response | 0.1625 | Pollution abatement | Comprehensive treatment rate of urban sewage (C32) | 0.114 | 0.175 | 0.128 | 0.167 | |
| Fund investment | Cumulative investment in lake treatment (C33) | 0.235 | 0.255 | 0.215 | 0.224 | |||
| Annual investment in environmental public facilities (C34) | 0.245 | 0.206 | 0.222 | 0.180 | ||||
| Supervision capacity | Public awareness of environmental protection (C35) | 0.180 | 0.165 | 0.250 | 0.230 | |||
| Regulatory capacity index (C36) | 0.226 | 0.199 | 0.185 | 0.199 | ||||
Appendix A.4. Assessment of Ecosystem Health in Representative Urban Lakes
For the index values of water quality, the L, B and U values were selected from the standard limits of type I, type III and type V corresponding to Environmental quality standard for surface water (GB 3838-2002) [63]. Likewise, the urban air particulate concentration was divided into two categories, where the value of L and U were selected from the standard level-I and level-II Ambient air quality standards (GB3095-2012) [64]. The pollution load calculation of point and non-point sources was based on the environmental capacity of lake and combined with emission proportions. The open rate of lake entrances, lake water exchange capacity and ecological water level satisfaction were determined with reference to the local standards. The specific values are shown in Table A3.
Table A3.
Evaluation index standard of ecosystem health in Lake Xuanwu and Erhai Lake.
Table A3.
Evaluation index standard of ecosystem health in Lake Xuanwu and Erhai Lake.
| Criterion Layer | Index Layer | Lower Limit Value (L) | Fiducial Value (B) | Upper Limit Value (U) | Lower Limit Value (L) | Fiducial Value (B) | Upper Limit Value (U) |
|---|---|---|---|---|---|---|---|
| Xuanwu Lake | Erhai Lake | ||||||
| Driving force | Regional population density (people/km2) | 960.1 | 1243.02 | 1624.42 | 272.90 | 335.28 | 360.88 |
| Natural growth rate of population (‰) | 0.89 | 4.09 | 6.81 | 3.15 | 4.9 | 6.87 | |
| Per capita GDP (yuan) | 64,037 | 124,600 | 165,681 | 13,500 | 25,500 | 40,900 | |
| Primary industry ratio (%) | 2.01 | 2.4 | 2.8 | 13.2 | 15 | 16.8 | |
| Second industry ratio (%) | 34.98 | 40.29 | 45.4 | 39.6 | 42 | 44.4 | |
| Tourism ratio (%) | 51.9 | 57.32 | 63.05 | 38.8 | 43 | 47.2 | |
| Pressure | Precipitation (mm) | 723 | 1243 | 1807 | 757.6 | 822.2 | 875.4 |
| Urban air particulate concentration (particle size ≤ 10 μm) (μg/m3) | 40 | 70 | 40 | 70 | |||
| Frequency of flood-waterlogging damage (time/year) | 0.05 | 0.2 | 0.3 | 0.05 | 0.2 | 0.3 | |
| Non-point source of TN load (kg/a) | 66.45 | 1.35 × 10⁶ | |||||
| Non-point source of TP load (kg/a) | 3.28 | 6.79 × 10⁴ | |||||
| Point source of COD load (kg/a) | 0.62 | 1.03 × 10⁶ | |||||
| TN concentration in river/replenishment (mg/L) | 0.2 | 1.0 | 2.0 | 0.2 | 1.0 | 2.0 | |
| State | Lake area shrinkage rate (%) | 0 | 8 | 16 | 0 | 1 | 2 |
| Lake water exchange capacity (%) | 0 | 50 | 150 | 0 | 50 | 150 | |
| Ecological water level satisfaction (%) | 0 | 50 | 100 | 0 | 50 | 100 | |
| TN in water (mg/L) | 0.2 | 1 | 2 | 0.2 | 0.25 | 0.5 | |
| TP in water (mg/L) | 0.01 | 0.05 | 0.2 | 0.01 | 0.02 | 0.025 | |
| COD in water (mg/L) | 15 | 20 | 40 | 15 | 15 | 15 | |
| Total dissolved solid (mg/L) | 200 | 250 | 350 | 150 | 180 | 220 | |
| Eutrophication index | 30 | 50 | 70 | 30 | 50 | 70 | |
| TP in sediment (mg/kg) | 730 | 1100 | 1500 | 730 | 1100 | 1500 | |
| Phytoplankton diversity | 0 | 1.5 | 3 | 0 | 1.5 | 3 | |
| Aquatic plant coverage (%) | 0 | 50 | 100 | 0 | 50 | 100 | |
| Cyanobacterial density (104 cells/L) | 300 | 2600 | 8000 | 300 | 2600 | 8000 | |
| Natural shoreline rate of lakeside (%) | 80 | 90 | 100 | 80 | 90 | 100 | |
| Impact | Water supply (104 yuan) | 66.2 | 84.9 | 103.6 | 3666 | 4701 | 5735 |
| Human landscape (104 yuan) | 121.5 | 155.8 | 190.0 | 6726 | 8626 | 10,523 | |
| Biodiversity protection (104 yuan) | 163.9 | 210.2 | 256.4 | 9075 | 11,638 | 14,198 | |
| Hydrological regulation (104 yuan) | 6569.9 | 8424.5 | 10,279.0 | 363,856 | 466,623 | 569,251 | |
| Pollutant purification (104 yuan) | 361.1 | 463.1 | 565.0 | 20,001 | 25,650 | 31,291 | |
| Response | Comprehensive treatment rate of urban sewage (%) | 88.8 | 96.4 | 97.9 | 71 | 80 | 89 |
| Cumulative investment in lake treatment (108 yuan) | 24 | 42 | 69 | 26 | 51 | 75 | |
| Annual investment in environmental public facilities (108 yuan) | 104 | 201 | 301 | 122 | 222 | 322 | |
| Public awareness of environmental protection (%) | 0 | 5 | 10 | 0 | 5 | 10 | |
| Regulatory capacity index (score) | 0 | 5 | 10 | 0 | 5 | 10 | |
References
- Weng, X.; Jiang, C.; Yuan, M.; Zhang, M.; Zeng, T.; Jin, C. An ecologically dispatch strategy using environmental flows for a cascade multi-sluice system: A case study of the Yongjiang River Basin, China. Ecol. Indic. 2021, 121, 107053. [Google Scholar] [CrossRef]
- Meng, F.; Hu, A.; Wu, H.; Jang, K.-S.; Liu, B.; Gao, T.; Wu, Q.; Wang, J. Organic carbon sink dynamics and carbon sink-source balance in global lakes during the Anthropocene. Fundam. Res. 2024. [Google Scholar] [CrossRef]
- Birch, S.; McCaskie, J. Shallow urban lakes: A challenge for lake management. Hydrobiologia 1999, 395, 365–378. [Google Scholar] [CrossRef]
- Xie, C.; Huang, X.; Mu, H.; Yin, W. Impacts of Land-Use Changes on the Lakes across the Yangtze Floodplain in China. Environ. Sci. Technol. 2017, 51, 3669–3677. [Google Scholar] [CrossRef]
- Xie, C.; Huang, X.; Wang, L.; Fang, X.; Liao, W. Spatiotemporal change patterns of urban lakes in China’s major cities between 1990 and 2015. Int. J. Digit. Earth 2017, 11, 1085–1102. [Google Scholar] [CrossRef]
- Bhateria, R.; Jain, D. Water quality assessment of lake water: A review. Sustain. Water Resour. Manag. 2016, 2, 161–173. [Google Scholar] [CrossRef]
- Wu, X.; Yu, J.; Yang, S.; Zhang, Y.; Hu, Q.; Xu, X.; Wang, Y.; Wang, Y.; Luo, H.; Xie, Z. Hydrogeochemistry, Water Quality, and Health Risk Analysis of Phreatic Groundwater in the Urban Area of Yibin City, Southwestern China. Water 2024, 16, 3599. [Google Scholar] [CrossRef]
- Wang, Y.; Guo, Y.; Zhao, Y.; Wang, L.; Chen, Y.; Yang, L. Spatiotemporal heterogeneities and driving factors of water quality and trophic state of a typical urban shallow lake (Taihu, China). Environ. Sci. Pollut. Res. 2022, 29, 53831–53843. [Google Scholar] [CrossRef]
- Liu, H.; Benoit, G.; Liu, T.; Liu, Y.; Guo, H. An integrated system dynamics model developed for managing lake water quality at the watershed scale. J. Environ. Manag. 2015, 155, 11–23. [Google Scholar] [CrossRef]
- Xu, S.; Cui, Y.; Yang, C.; Wei, S.; Dong, W.; Huang, L.; Liu, C.; Ren, Z.; Wang, W. The fuzzy comprehensive evaluation (FCE) and the principal component analysis (PCA) model simulation and its applications in water quality assessment of Nansi Lake Basin, China. Environ. Eng. Res. 2021, 26, 200022. [Google Scholar] [CrossRef]
- Wang, X.; Cheng, Y. Urban Lake Health Assessment Based on the Synergistic Perspective of Water Environment and Social Service Functions. Glob. Chall. 2024, 8, 2400144. [Google Scholar] [CrossRef] [PubMed]
- Han, Y.; Zhang, K.; Lin, Q.; Huang, S.; Yang, X. Assessing lake ecosystem health from disturbed anthropogenic landscapes: Spatial patterns and driving mechanisms. Ecol. Indic. 2023, 147, 110007. [Google Scholar] [CrossRef]
- Chen, T.; Song, C.; Fan, C.; Cheng, J.; Duan, X.; Wang, L.; Liu, K.; Deng, S.; Che, Y. A comprehensive data set of physical and human-dimensional attributes for China’s lake basins. Sci. Data 2022, 9, 519. [Google Scholar] [CrossRef] [PubMed]
- Xu, Y.; Dai, Q.-Y.; Zou, B.; Xu, M.; Feng, Y.-X. Tracing climatic and human disturbance in diverse vegetation zones in China: Over 20 years of NDVI observations. Ecol. Indic. 2023, 156, 111170. [Google Scholar] [CrossRef]
- Tian, J.; Wang, L.; Tian, Q.; Yang, H.; Tian, Y.; Guo, L.; Luo, W. Prediction and Analysis of Spatiotemporal Evolution Trends of Water Quality in Lake Chaohu Based on the WOA-Informer Model. Sustainability 2025, 17, 9521. [Google Scholar] [CrossRef]
- Jun, X.I.A.; Jin, C.; Dunxian, S.H.E.; Wenguang, L.U.O. Opportunities and challenges of national water network construction under changing environment. Acta Geogr. Sin. 2023, 78, 1608–1617, (In Chinese with English abstract). [Google Scholar]
- Yao, P.; Yu, X.; Wang, Y.; Feng, Y.; Gao, H. Spatiotemporal Changes and Driving Analysis of Ecological Environmental Quality in the Qinghai Lake Basin. Sustainability 2025, 17, 3421. [Google Scholar] [CrossRef]
- Wang, Y.; Gao, G.; Li, M.; Mao, K.; Geng, S.; Song, H.; Zhang, T.; Wang, X.; An, H. Study on the Spatio-Temporal Differentiation and Driving Mechanism of Ecological Security in Dongping Lake Basin, Shandong Province, China. Water 2025, 17, 2355. [Google Scholar] [CrossRef]
- Bai, T.; Yang, J.; Wang, X.; Su, R.; Cushman, S.A.; Lawson, G.; Liu, M.; Wang, G.; Li, D.; Wang, J.; et al. Multi-Source Data-Driven Spatiotemporal Study on Integrated Ecosystem Service Value for Sustainable Ecosystem Management in Lake Dianchi Basin. Sustainability 2025, 17, 3832. [Google Scholar] [CrossRef]
- Zhang, H.; Ahmed, Z.; Han, W.; Sun, G. Ecosystem Service Changes and Water Management in the Manas River Basin. Water 2024, 16, 3585. [Google Scholar] [CrossRef]
- Huo, S.; Ma, C.; Xi, B.; Gao, R.; Deng, X.; Jiang, T.; He, Z.; Su, J.; Wu, F.; Liu, H. Lake ecoregions and nutrient criteria development in China. Ecol. Indic. 2014, 46, 1–10. [Google Scholar] [CrossRef]
- Cao, J.; Chu, Z.; Jia, H.; Zheng, B. Succession of algae population and blooms with their driving factors in China’s lakes. J. Environ. Sci. 2026, 160, 13–26. [Google Scholar] [CrossRef] [PubMed]
- Song, C.; Jiang, X.; Fan, C.; Li, L. High-resolution circa-2020 map of urban lakes in China. Sci. Data 2022, 9, 747. [Google Scholar] [CrossRef] [PubMed]
- Wang, Y.; Li, Z.; Zeng, C.; Xia, G.S.; Shen, H. An Urban Water Extraction Method Combining Deep Learning and Google Earth Engine. IEEE J. Sel. Top. Appl. Earth Obs. Remote Sens. 2020, 13, 769–782. [Google Scholar] [CrossRef]
- Chen, W.G. Study on Urban Lake Ecosystem Health Assessment. Appl. Mech. Mater. 2012, 178–181, 304–308. [Google Scholar] [CrossRef]
- Li, N.; Li, J.; Li, G.; Li, Y.; Xi, B.; Wu, Y.; Li, C.; Li, W.; Zhang, L. The eutrophication and its regional heterogeneity in typical lakes of China. Acta Hydrobiol. Sin. 2018, 42, 854–864, (In Chinese with English abstract). [Google Scholar]
- Wang, S.; Dou, H. China Lake Records; China Science Publishing & Media Ltd.: Beijing, China, 1998. (In Chinese) [Google Scholar]
- Jin, X.; Liu, S.; Zhang, Z. China Lake Environment; Ocean Press: Beijing, China, 1995; Volume 1. (In Chinese) [Google Scholar]
- Wharfe, J. Hazardous Chemicals in Complex Mixtures—A Role for Direct Toxicity Assessment. Ecotoxicology 2004, 13, 413–421. [Google Scholar] [CrossRef]
- Zhou, J.-R.; Li, X.-Q.; Yu, X.; Zhao, T.-C.; Ruan, W.-X. Exploring the ecological security evaluation of water resources in the Yangtze River Basin under the background of ecological sustainable development. Sci. Rep. 2024, 14, 15475. [Google Scholar] [CrossRef]
- Quevedo, J.M.D.; Uchiyama, Y.; Kohsaka, R. A blue carbon ecosystems qualitative assessment applying the DPSIR framework: Local perspective of global benefits and contributions. Mar. Policy 2021, 128, 104462. [Google Scholar] [CrossRef]
- Xie, G.; Zhang, C.; Zhang, L.; Chen, W.; Li, S. Improvement of the evaluation method for ecosystem service value based on per unit area. J. Nat. Resour. 2015, 30, 1243–1254, (In Chinese with English abstract). [Google Scholar]
- Wang, H.; Zhang, M.; Cui, L.; Guo, Z.; Wang, D. Evaluation of Ecological Environment Quality of Hengshui Lake Wetlands based on DPSIR Model. Wetl. Sci. 2019, 17, 193–198, (In Chinese with English abstract). [Google Scholar]
- Cao, L.; Li, P.; Li, S.; Li, H.; Qin, G. Application of fuzzy comprehensive evaluation and grey cluster analysis in river health evaluation. Environ. Eng. 2018, 36, 4, (In Chinese with English abstract). [Google Scholar]
- Hou, L.; Lu, J.; Liang, Q.; Wang, C. Evaluation of lake ecological security in Yunnan Province based on the DPSIR model. J. Agric. Resour. Environ. 2021, 38, 12, (In Chinese with English abstract). [Google Scholar]
- Balasubramaniyan, G.; Ganesan, D.A.; Murugesan, B.; Swaminathan, B.; Karuppannan, S.; Duraisamy, K. AHP and Geospatial technology-based assessment of groundwater potential zones in Natham taluk, Tamil nadu, India. Sci. Rep. 2025, 15, 28045. [Google Scholar] [CrossRef] [PubMed]
- Arıman, S.; Soydan-Oksal, N.G.; Beden, N.; Ahmadzai, H. Assessment of Groundwater Quality through Hydrochemistry Using Principal Components Analysis (PCA) and Water Quality Index (WQI) in Kızılırmak Delta, Turkey. Water 2024, 16, 1570. [Google Scholar] [CrossRef]
- Zhang, J.; Gao, J. Lake ecological security assessment based on SSWSSC framework from 2005 to 2013 in an interior lake basin, China. Environ. Earth Sci. 2016, 75, 888. [Google Scholar] [CrossRef]
- Liu, X.; Zhang, Y.; Dong, G.; Hou, G.; Jiang, M. Landscape Pattern Changes in the Xingkai Lake Area, Northeast China. Int. J. Environ. Res. Public Health 2019, 16, 3820. [Google Scholar] [CrossRef]
- Fang, C.; Song, K.; Li, L.; Wen, Z.; Liu, G.; Du, J.; Shang, Y.; Zhao, Y. Spatial variability and temporal dynamics of HABs in Northeast China. Ecol. Indic. 2018, 90, 280–294. [Google Scholar] [CrossRef]
- Song, K.; Wen, Z.; Jacinthe, P.-A.; Zhao, Y.; Du, J. Dissolved carbon and CDOM in lake ice and underlying waters along a salinity gradient in shallow lakes of Northeast China. J. Hydrol. 2019, 571, 545–558. [Google Scholar] [CrossRef]
- Silvonen, S.; Niemistö, J.; Jilbert, T.; Horppila, J. Wintertime diffusion of sedimentary phosphorus—Implications for under-ice phosphorus removal from eutrophic lakes. J. Soils Sediments 2024, 24, 2522–2534. [Google Scholar] [CrossRef]
- Xie, C.; Zhang, X.; Zhuang, L.; Zhu, R.; Guo, J. Analysis of surface temperature variation of lakes in China using MODIS land surface temperature data. Sci. Rep. 2022, 12, 2415. [Google Scholar] [CrossRef] [PubMed]
- Xi, B.; Zhang, Y.; Xu, Q. Possibility of Total Dissolved Solid as one of Nutrient Baselines in Inner Mongolia-Xinjiang Plateau. Environ. Sci. 2012, 33, 3308–3313, (In Chinese with English abstract). [Google Scholar]
- Xu, X.; Wu, X.; He, J.; Wang, L.; Zhang, Y.; Yang, Y.; Chen, Y.; Ye, H. Research on the pollution characteristics of Dianchi watershed (1988–2014) and identification of countermeasures. J. Lake Sci. 2016, 28, 476–484. [Google Scholar]
- Wang, J.H.; Yang, C.; He, L.Q.; Dao, G.H.; Du, J.S.; Han, Y.P.; Wu, G.X.; Wu, Q.Y.; Hu, H.Y. Meteorological factors and water quality changes of Plateau Lake Dianchi in China (1990–2015) and their joint influences on cyanobacterial blooms. Sci. Total Environ. 2019, 665, 406–418. [Google Scholar] [CrossRef]
- Zhou, Q.; Zhang, Y.; Lin, D.; Shan, K.; Luo, Y.; Zhao, L.; Tan, Z.; Song, L. The relationships of meteorological factors and nutrient levels with phytoplankton biomass in a shallow eutrophic lake dominated by cyanobacteria, Lake Dianchi from 1991 to 2013. Environ. Sci. Pollut. Res. Int. 2016, 23, 15616–15626. [Google Scholar] [CrossRef]
- Liu, Y.; Wang, Z.; Guo, H.; Yu, S.; Sheng, H. Modelling the Effect of Weather Conditions on Cyanobacterial Bloom Outbreaks in Lake Dianchi: A Rough Decision-Adjusted Logistic Regression Model. Environ. Model. Assess. 2013, 18, 199–207. [Google Scholar] [CrossRef]
- Chen, X.; Chuai, X.; Yang, L. Status quo, historical evolution and causes of eutrophication in lakes in typical lake regions of China. J. Ecol. Rural Environ. 2014, 30, 6, (In Chinese with English abstract). [Google Scholar]
- Gebremedhin, S.; Getahun, A.; Anteneh, W.; Bruneel, S.; Goethals, P. A Drivers-Pressure-State-Impact-Responses Framework to Support the Sustainability of Fish and Fisheries in Lake Tana, Ethiopia. Sustainability 2018, 10, 2957. [Google Scholar] [CrossRef]
- Shi, C.; Guo, H.; Qiao, X.; Gao, J.; Chen, Y.; Zhang, H. Meteorological effects on sources and future projection of nitrogen deposition to lakes in China. J. Environ. Sci. 2025, 151, 100–112. [Google Scholar] [CrossRef]
- Catalan, J.; Monteoliva, A.P.; Vega, J.C.; Domínguez, A.; Negro, A.I.; Alonso, R.; Garcés, B.V.; Batalla, M.; García-Gómez, H.; Leira, M.; et al. Reduced precipitation can induce ecosystem regime shifts in lakes by increasing internal nutrient recycling. Sci. Rep. 2024, 14, 12408. [Google Scholar] [CrossRef]
- Hu, M.; Ma, R.; Xiong, J.; Wang, M.; Cao, Z.; Xue, K. Eutrophication state in the Eastern China based on Landsat 35-year observations. Remote Sens. Environ. 2022, 277, 113057. [Google Scholar] [CrossRef]
- Duan, Z.; Gao, W.; Liu, C.; Du, Z.; Chang, X. Varying hydrological response to climate change in three neighborhood plateau lake basins: Localized climate change feature matters. Ecol. Indic. 2023, 147, 110015. [Google Scholar] [CrossRef]
- Wu, Y.; Wang, X.; Kollányi, L.; Zhang, J.; Bai, T. Analyzing and forecasting water-land dynamics for sustainable urban developments: A multi-source case study of Lake Dianchi’s environmental challenges (China). Ecol. Indic. 2024, 166, 112335. [Google Scholar] [CrossRef]
- Li, Y.; Tao, J.; Zhang, Y.; Shi, K.; Chang, J.; Pan, M.; Song, L.; Jeppesen, E.; Zhou, Q. Urbanization shifts long-term phenology and severity of phytoplankton blooms in an urban lake through different pathways. Glob. Change Biol. 2023, 29, 4983–4999. [Google Scholar] [CrossRef]
- Dybiec, J.M.; Albert, D.A.; Danz, N.P.; Wilcox, D.A.; Uzarski, D.G. Development of a preliminary vegetation-based indicator of ecosystem health for coastal wetlands of the Laurentian Great Lakes. Ecol. Indic. 2020, 119, 106768. [Google Scholar] [CrossRef]
- Grizzetti, B.; Liquete, C.; Pistocchi, A.; Vigiak, O.; Zulian, G.; Bouraoui, F.; De Roo, A.; Cardoso, A.C. Relationship between ecological condition and ecosystem services in European rivers, lakes and coastal waters. Sci. Total Environ. 2019, 671, 452–465. [Google Scholar] [CrossRef]
- Si, W.; Chen, Z.; Jim, C.Y.; Tan, M.L.; Liu, D.; Yao, Y.; Wei, L.; Xu, S.; Zhang, F. Resolving inherent constraints in eutrophication monitoring of small lakes using multi-source satellites and machine learning. npj Clean Water 2025, 8, 99. [Google Scholar] [CrossRef]
- Dawn, A.; Hinge, G.; Kumar, A.; Nikoo, M.R.; Hamouda, M.A. Assessment of Water Quality in Urban Lakes Using Multi-Source Data and Modeling Techniques. Sustainability 2025, 17, 7258. [Google Scholar] [CrossRef]
- Schirpke, U.; Scolozzi, R.; Tappeiner, U. Not too small to benefit society: Insights into perceived cultural ecosystem services of mountain lakes in the European Alps. Ecol. Soc. 2022, 27, 6. [Google Scholar] [CrossRef]
- Dong, H.; Zhang, R.; Wang, X.; Zeng, J.; Chai, L.; Niu, X.; Xu, L.; Zhou, Y.; Gong, P.; Yin, Q. Geographical features and management strategies for microplastic loads in freshwater lakes. npj Clean Water 2025, 8, 29. [Google Scholar] [CrossRef]
- GB 3838-2002; The Surface Water Environmental Quality Standard. China Environmental Science Press: Beijing, China, 2002. (In Chinese)
- GB 3095-2012; Ambient Air Quality Standard. China Environmental Science Press: Beijing, China, 2012. (In Chinese)
Disclaimer/Publisher’s Note: The statements, opinions and data contained in all publications are solely those of the individual author(s) and contributor(s) and not of MDPI and/or the editor(s). MDPI and/or the editor(s) disclaim responsibility for any injury to people or property resulting from any ideas, methods, instructions or products referred to in the content. |
© 2025 by the authors. Licensee MDPI, Basel, Switzerland. This article is an open access article distributed under the terms and conditions of the Creative Commons Attribution (CC BY) license (https://creativecommons.org/licenses/by/4.0/).