Abstract
This study investigates the complex interactions between operational and financial variables that influence infrastructure investment in Romania’s wastewater sector, a serious area for environmental sustainability and compliance with European environmental standards. Using a comprehensive dataset covering all regional water service operators, accounting for over 90% of the country’s population, across the period 2012–2022, the analysis employs dynamic panel data methods to examine how treated wastewater volumes, operating expenditures, revenues, tariffs and the number of connected users shape investment decisions and the modernization of wastewater infrastructure. The results reveal strong links between operational performance and investment behavior, indicating that revenues from wastewater services and efficiency in organic pollutant removal (CBO5) are key determinants of capital investment. The findings further show that an expanding user base generates substantial investment needs, supporting the extension and upgrading of wastewater treatment networks. By combining a dynamic econometric framework with a comprehensive national sample, the study makes an original contribution to the literature by providing robust empirical evidence on the interaction between financial performance, operational efficiency and sustainability objectives in the wastewater sector. The results underscore the importance of good financial planning, strategic management and sustainable investment policies, and offer relevant insights for policymakers, utility operators and researchers concerned with improving wastewater infrastructure performance under current economic and environmental challenges.
Keywords:
sustainability; investment; infrastructure; wastewater; development; performance; panel data 1. Introduction
The implementation of European Union (EU) regulations, in particular Directive 2000/60/EC [1] (Water Framework Directive—WFD), established a comprehensive framework for European water policy, emphasizing the protection of surface water, groundwater, and aquatic ecosystems. The directive promotes the prevention of water deterioration, sustainable water use, and the integration of environmental objectives into water resource management, forming a key reference point for environmental economics and sustainability evaluation.
Complementing this framework, Directive 91/271/EEC [2] on urban wastewater treatment sets clear requirements for the collection, treatment, and discharge of wastewater, aiming to reduce environmental pressures and protect public health. Together, these directives create a regulatory environment that directly influences planning strategies and investment decisions in wastewater infrastructure across Member States.
Within this European regulatory context, the present study examines the determinants of investment in wastewater infrastructure in Romania, a country characterized by substantial infrastructure needs and strong reliance on public and European funding.
The main objective of the research is to assess how operational and financial performance indicators, such as wastewater volumes, operating costs, revenues, tariffs, and treatment efficiency, shape infrastructure investment decisions taken by regional water service operators, addressing a gap in the literature where empirical evidence from transition economies remains limited.
Methodologically, the study employs a dynamic panel data approach applied to an unbalanced panel of Romanian regional water operators over the period 2012–2022, enabling the identification of persistence effects and delayed adjustments that are typical of capital-intensive, regulated infrastructure sectors. By linking performance-based indicators to investment behavior, the analysis provides policy-relevant insights into the efficient allocation of financial resources and supports the design of performance-oriented investment frameworks. Although focused on Romania, the findings offer relevant implications for other EU countries facing similar regulatory constraints and convergence challenges, thereby contributing to the broader literature on sustainable infrastructure investment and wastewater management.
2. Literature Review and Hypotheses Development
Recent literature highlights that the relationships between operational performance, financial sustainability, and investment behavior in wastewater infrastructure are deeply influenced by the regulatory framework, the architecture of financing mechanisms, and regional development differences. Studies conducted at European level emphasize that there is no universal solution applicable to all Member States, and that approaches adapted to the institutional, economic, and technological conditions specific to each national or regional context are necessary.
In this regard, the experiences of some regions in the Iberian Peninsula, such as Algarve or La Rioja, indicate a close relationship between the financial stability of operators and high levels of operational efficiency, results associated with good governance practices and the integration of resource recovery technologies [3]. In contrast, the literature on Portugal shows that inefficiencies in the water services sector are amplified by non-transparent subsidy policies that are poorly correlated with performance, which has led to explicit recommendations for a transition to results-based financing mechanisms [4]. These findings are relevant for Romania, which follows a similar pattern to other countries in Central and Eastern Europe, characterized by significant dependence on public and European funds and a relatively low level of performance incentives through financial instruments.
From an investment behavior perspective, international comparisons show that the level and structure of investments in wastewater infrastructure are closely linked to institutional capacity and regulatory quality. In Italy, for example, the role of the national regulatory authority (ARERA) is essential in guiding investment in regulated sectors, also in the context of the Next Generation EU program [5]. Similarly, the experience of the Danube region in implementing the Urban Wastewater Treatment Directive highlights that substantial investments have led to significant improvements in water quality but have also highlighted challenges related to tariff affordability and the need for institutional reforms [6]. The same tensions can be observed in Romania, where the imperatives of compliance with European requirements coexist with financial constraints at the level of final users.
Comparative analyses at European level also reveal significant disparities in resource efficiency and water service performance, driven by marked technological heterogeneity between Member States [7]. Pan-European assessments suggest that, although progress towards convergence is evident, the regions of Central and Eastern Europe continue to underperform compared to those in Northern and Western Europe [8]. This context places Romania in an intermediate position, with high potential for recovery, but also with structural limitations that slow down the convergence process.
Overall, comparison with other EU countries and regions shows that Romania’s results are consistent with patterns identified in economies undergoing institutional and infrastructural transition. At the same time, the lack of standardized indicators and a unified performance assessment framework, particularly in the field of wastewater, limits the direct comparability of results between countries [9]. Addressing these gaps through harmonized methodologies and performance-based financing mechanisms may contribute to improved external validity and generalizability of results, as well as to more effective public policies in the field of sustainable investment in wastewater infrastructure.
The existing literature highlights that investment decisions in wastewater infrastructure are influenced by a complex interplay between operational performance, financial capacity, regulatory pressures, and sustainability objectives. Previous studies emphasize that both technical efficiency and financial soundness play an important role in shaping investment behavior in water and wastewater utilities [10,11]. Non-parametric and efficiency-based analyses reveal persistent trade-offs between cost containment, service quality, and environmental compliance, reinforcing the strategic and multidimensional nature of investment planning in this sector [10].
Recent research has further emphasized the role of governance and financing mechanisms, showing that public–private partnerships, benchmarking frameworks, and composite sustainability indicators significantly affect environmental outcomes and the allocation of investment resources [12,13,14]. Advanced analytical approaches, including data envelopment analysis, gray relational analysis, and dynamic efficiency assessments, have been increasingly applied to evaluate both short-term operational performance and long-term investment needs in wastewater systems [15,16]. In the context of growing environmental pressures and the transition toward a circular economy, several studies focus on investments in green technologies, resource recovery, and energy-efficient treatment solutions, highlighting the potential for infrastructure modernization to simultaneously enhance environmental performance and economic efficiency [17,18].
Empirical evidence from various regions indicates that investment dynamics are closely linked to institutional arrangements, demographic trends, and pricing policies. Studies covering water utilities in Europe, the United Kingdom, Italy, Chile, and other regions underline the importance of revenue stability, economies of scale, and regulatory incentives in supporting sustainable infrastructure investments [19,20,21,22,23,24,25,26]. More recent contributions extend this perspective by integrating considerations related to water security, urban resilience, spatial planning, and digital technologies into wastewater management strategies [27,28,29,30,31,32].
Recent contributions in the literature broaden the perspective on urban water infrastructure by explicitly linking water consumption dynamics, energy efficiency and investment planning. Kapanski et al. (2025) identify easily accessible demand-side factors that influence energy-efficient management of pumping stations, emphasizing the role of water consumption patterns in shaping operational and investment decisions [33]. Similarly, Puschnigg et al. (2025) show that digitalization and hydropower integration in water supply systems can significantly enhance efficiency, resilience and energy recovery, reinforcing the importance of technologically integrated approaches to infrastructure planning [34].
Although these studies focus primarily on water supply systems rather than wastewater services, they highlight the growing relevance of integrated analyses across the urban water cycle. In this context, wastewater infrastructure investment remains a critical and complementary component, as decisions regarding treatment capacity, environmental compliance and network expansion are directly influenced by demand-side dynamics and long-term sustainability objectives. Building on these insights, the present study concentrates on wastewater infrastructure investment, while explicitly acknowledging that future research could extend the framework to jointly address water supply, energy efficiency and wastewater systems.
Considering the relationships discussed in the literature and the specific context of wastewater infrastructure, the following hypotheses are advanced:
H1.
Changes in the volume of treated wastewater are significantly associated with investment in wastewater infrastructure.
Variations in treated wastewater volumes reflect changes in service demand and operational pressure, which are expected to influence investment decisions related to capacity expansion, system modernization and technological upgrading, particularly under increasingly stringent environmental requirements [35,36,37,38].
H2.
Total wastewater operating expenditure is a significant determinant of infrastructure investment.
Operating expenditures capture the intensity of maintenance activities, compliance efforts and system operation and are therefore expected to be closely linked to investment decisions, either by signaling infrastructure needs or by affecting the financial resources available for long-term capital investment strategies [23,35].
H3.
Higher wastewater tariffs are positively associated with investment in wastewater infrastructure.
Tariffs constitute a fundamental financing mechanism for wastewater operators, supporting cost recovery, regulatory compliance and the capacity to fund modernization and expansion projects, while balancing financial sustainability and social equity considerations [39,40,41].
H4.
Total operating revenues from wastewater services significantly influence infrastructure investment.
Stronger and more stable revenue streams enhance financial autonomy, improve access to external financing and facilitate long-term strategic investment planning, particularly for advanced wastewater treatment solutions and environmentally sustainable infrastructure [42,43].
H5.
The number of inhabitants connected to sewerage services is positively related to investment in wastewater infrastructure.
An expanding connected population increases service demand and system pressure, requiring network extension, capacity upgrading and modernization to ensure environmental protection, public health and service continuity [44].
H6.
Environmental performance, as reflected by organic pollutant removal efficiency (CBO5), is significantly linked to wastewater infrastructure investment.
Higher efficiency in organic pollutant removal reflects regulatory compliance and technological advancement and is often associated with substantial investments in modern treatment technologies and sustainable operational practices, particularly in response to evolving environmental standards [44,45,46,47].
In line with these theoretical contributions and the hypotheses formulated (H1–H6), the study aims to investigate, for the case of Romania, the mechanisms through which operational performance, financial sustainability, and environmental efficiency are reflected in investment decisions in wastewater infrastructure. Figure 1 summarizes the research framework of this article, highlighting the links between the research objective, the set of variables analyzed, the associated hypotheses, and the econometric strategies used. Based on this framework, the following section describes in detail the database, the construction of variables, and the methodology for estimating dynamic panel data models.
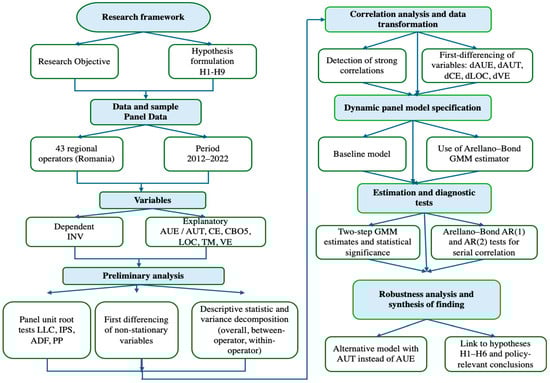
Figure 1.
The research framework.
3. Data and Methodology
3.1. Data and Variable Construction
This study uses panel data for all regional public operators that provide wastewater services in Romania. The information was extracted from the Benchmarking Exercise Reports published annually for each operator and covers the period 2012–2022. The final database combines a cross-sectional dimension of 43 regional operators with a time dimension of eleven years, thus generating a balanced panel that is well suited for dynamic econometric modelling.
The benchmarking database is compiled by the national regulator at the level of each regional operator and year, aggregating information from all local service areas belonging to the operator. For each year, indicators such as investment, operating expenses, tariffs, volumes and environmental performance are reported on a consolidated basis, after internal consistency checks performed by the regulator. Changes in service areas and occasional mergers between operators are treated according to the official statistical protocol: when a local utility is incorporated into a regional operator, the reported values refer to the enlarged service area for that year, while the historical series of the absorbed utility are discontinued. As a result, each cross-sectional unit in the panel corresponds to a stable operator code defined by the regulator, and the indicators used in this study are already aggregated at the operator level, which makes the construction of a separate instrumentation base unnecessary.
The dependent variable is total investment in wastewater infrastructure, denoted by INV and measured in Romanian lei per year (RON/year). INV represents the annual value of all investments related to wastewater services undertaken by each operator. It includes the amounts paid to contractors from European Union grants, the state budget, local budgets and co-financing loans. In the econometric framework, INV is treated as an endogenous variable because investment decisions in infrastructure are cumulative, path-dependent and strongly influenced by past outcomes and expectations.
The explanatory variables describe the operational activity of the operators, their environmental performance and their financial situation. The first group of indicators captures the physical scale of wastewater services. Treated wastewater, denoted by AUE and measured in cubic meter per year (m3/year), reflects the volume of wastewater processed in treatment facilities under the responsibility of each operator during the reference year. Wastewater transported to the sewerage network, denoted by AUT and expressed in m3/year, measures the quantity of wastewater collected from households, economic agents and public institutions and conveyed through the sewerage system during the assessment period. The environmental dimension is represented by CBO5, defined as the average daily amount of biochemical oxygen demand removed at operator level, expressed in kilograms per day (kg/day). This indicator summarizes the efficiency of treatment processes in reducing organic pollution loads.
To capture forward-looking investment behavior, the analysis additionally uses a dynamic environmental indicator defined as the expected change in pollutant removal efficiency between year (t) and year (t + 1). Formally, this variable is constructed as:
where CBO5i,t represents the average daily amount of biochemical oxygen demand removed by operator (i) in year (t). In practice, wastewater operators prepare their annual investment plans based on technical studies and demand forecasts that anticipate future pollution loads. The lead of ∆ CBO5i,t+1 therefore proxies operators’ expectations regarding future environmental compliance requirements and is interpreted in the econometric model as a forward-looking driver of current investment decisions.
The second group of variables characterizes the size of the customer base and the intensity of service use. The number of inhabitants connected to sewerage services, denoted by LOC and measured as persons, aggregates all residents served by each operator across all localities. LOC provides a proxy for market size and for the potential demand for wastewater services, influencing both operating needs and investment requirements.
The financial conditions of the operators are captured by three additional indicators. Total wastewater operating expenses, denoted by CE and measured in RON/year, include all operation and maintenance costs as well as internal labor costs associated with the provision of sewerage services in the evaluated year. The tariff variable, TM, is defined as the average tariff per cubic meter of wastewater collected, excluding value added tax, and is expressed in RON per m3; it refers to the price charged for sewerage services to domestic, industrial and other categories of consumers. Total operating revenues from wastewater, denoted by VE and measured in RON/year, represent all revenues generated from wastewater activities in the respective year.
Taken together, INV, AUE, AUT, CBO5, LOC, CE, TM and VE offer a coherent representation of the technical, environmental and financial conditions under which regional operators’ function. The joint observation of these indicators over time and across operators allows the analysis to investigate how changes in operational scale, cost structures, tariffs and environmental performance are transmitted to investment decisions in wastewater infrastructure.
3.2. Time Series Properties and Descriptive Analysis
Before estimating the econometric models, an assessment of the stochastic properties of the data was performed. Given the panel structure and the relatively short time dimension, both common unit root tests and individual unit root tests were applied. This step is essential in dynamic panel analysis, as the presence of non-stationary variables may lead to spurious regression results if not properly addressed.
The results of the panel unit root tests are reported in Table 1. The findings indicate that treated wastewater, wastewater transported to the sewerage network, CBO5 removed and total investment are stationary in levels. In contrast, operating expenditures, tariffs and operating revenues exhibit non-stationary behavior in levels but become stationary after first differencing. The series describing the number of connected inhabitants presents mixed evidence; however, based on individual process tests, it is treated as integrated of order one. Importantly, all variables are at most I(1), fulfilling the necessary conditions for estimation using the Arellano–Bond methodology.

Table 1.
Unit Root tests in panel for analyzed variables.
The mixed evidence obtained for the series describing the number of connected inhabitants illustrates a more general issue in short panels, namely that different unit root tests may yield divergent classifications for borderline processes. In this study, whenever the Levin–Lin–Chu and Im–Pesaran–Shin statistics reject the unit root while the PP–Fisher statistic does not, we adopt a conservative approach and treat the series as integrated of order one, to avoid under-differencing. The fact that all variables are at most (I(1)) is fully compatible with the use of the Arellano–Bond estimator, which is robust to combinations of stationary and first-differenced regressors and relies on internal instruments derived from lagged levels rather than on an external instrumentation base. This choice ensures that the dynamic specification remains well defined even in the presence of moderate uncertainty regarding the exact order of integration of some variables.
To provide a preliminary characterization of the data, Table 2 presents descriptive statistics and a variance decomposition for all variables. Beyond reporting means and total variances, the table presents a decomposition into between-operator variance and within-operator variance over time. This decomposition is particularly relevant in panel data settings, as it helps identify whether variability is driven primarily by structural differences between operators or by temporal dynamics within each operator.
Table 2.
Descriptive analysis.
The formulas used are the following:
Overall mean:
Between variance (variation between individuals):
Within variance (variation within individuals, over time):
Overall variance (variation over time and individuals):
For this reason, to compute the percentage contributions reported in Table 2, the overall variance was approximated as by .
For most operational variables, such as wastewater volumes and connected population, the results show that variation is dominated by differences between operators. This indicates that structural characteristics, rather than short-term fluctuations, explain most of the observed dispersion. In contrast, investment displays a substantial within-component, highlighting the dynamic nature of investment processes and the importance of analyzing their evolution over time. For variables identified as non-stationary in levels, descriptive statistics are reported for completeness, but their interpretation is treated with caution due to the presence of trends.
3.3. Econometric Methodology
The empirical strategy is based on a dynamic-panel data model designed to capture persistence in investment decisions and to account for unobserved heterogeneity across operators. In this framework, current investment depends not only on contemporaneous operational and financial conditions, but also on past investment levels. This specification reflects the inherently dynamic nature of infrastructure development, where investment decisions are typically spread over multiple periods and influenced by previously initiated projects.
The baseline model includes lagged values of the dependent variable, a set of explanatory variables, operator-specific effects and an idiosyncratic error term. However, the inclusion of lagged investment introduces endogeneity, as past investment is correlated with unobserved individual effects [48]. Under these circumstances, standard estimation methods such as ordinary least squares or fixed effects estimators are biased and inconsistent.
To overcome this limitation, the study employs the Generalized Method of Moments estimator developed by Arellano and Bond [49]. This approach removes individual-specific effects through first differencing and uses lagged levels of the endogenous variables as instruments. The estimator provides consistent results under the assumption that the idiosyncratic errors are not serially correlated beyond the first order. An additional advantage of this methodology is its applicability to variables that are non-stationary in levels but stationary in first differences, a condition satisfied by the data used in this study.
3.4. Correlation Analysis and Model Specification Strategy
Prior to model estimation, potential multicollinearity among explanatory variables was examined by calculating Pearson correlation coefficients. The results, reported in Table 3, indicate very strong correlations among several variables in levels, particularly between wastewater volumes, operating revenues and connected population. Such high correlations can distort estimated coefficients and reduce the reliability of inference.
Table 3.
Coefficients of correlation (Pearson) for model (A).
To address this issue, several specification strategies were considered. Excluding one variable from each highly correlated pair was deemed inappropriate, as high correlations also extend beyond isolated variable pairs. Fully differencing all variables was rejected because it would remove meaningful long-run information and complicate economic interpretation. Consequently, a selective transformation strategy was adopted, whereby only variables involved in strong correlations were differenced.
The resulting correlation structure after transformation is presented in Table 4. Except for the relationship between differenced treated wastewater and differenced transported wastewater, correlation coefficients fall within acceptable limits. To avoid remaining multicollinearity, two alternative model specifications were constructed, ensuring that treated wastewater and transported wastewater are never included simultaneously in the same regression.
Table 4.
Coefficients of correlation (Pearson) for model (B).
Despite the substantial reduction in correlation levels after transformation, the relationship between ΔAUE and ΔAUT remains relatively strong, reflecting the fact that both variables capture closely related dimensions of wastewater handling. To mitigate any remaining multicollinearity, the empirical analysis is based on two alternative specifications in which these variables are never included simultaneously. Comparing the results across models with treated wastewater and transported wastewater confirms that the main conclusions are not driven by collinearity, but rather reflect robust underlying relationships between investment, operational pressures, financial conditions and environmental performance.
4. Econometric Results
4.1. Dynamic Investment Model Including Treated Wastewater
The empirical analysis begins with the estimation of a dynamic panel data model in which treated wastewater is used as an indicator of the operational scale of regional wastewater operators. This specification allows the analysis to capture how variations in treatment activity interact with financial and structural factors to influence investment decisions over time. The model follows the general dynamic framework outlined in the Section 3 and is estimated using the Arellano–Bond Generalized Method of Moments (GMM) estimator [49]. The estimated coefficients are reported in Table 5.
Table 5.
Dynamic panel data model including treated wastewater (AUE). Dependent Variable: INVt. Method: Panel Generalized Method of Moments.
The theoretical specification of the baseline model is expressed as:
for operators i = 1, …, 43 and years t = 2012, …, 2022, where INVi,t denotes total annual investment in wastewater infrastructure, and the remaining variables describe changes in operational activity, costs, environmental performance, service coverage and financial capacity.
The inclusion of lagged investment terms allows the model to capture persistence and adjustment effects, which are typical of infrastructure investment processes. In such contexts, current investment decisions are strongly influenced by past capital allocations, ongoing projects and long-term strategic planning. However, the presence of lagged dependent variables renders conventional estimators biased due to correlation with unobserved operator-specific effects. The Arellano–Bond estimator addresses this issue by first-differencing the model and using lagged levels of endogenous variables as instruments.
The estimated version of the model, obtained using the two-step Arellano–Bond procedure, is given by:
where ut denotes the composite error term, and standard errors are reported in brakes. The estimation results clearly indicate a strong autoregressive structure in investment behavior. The positive and statistically significant coefficient on the first lag of investment, combined with a negative and significant coefficient on the second lag, points to an AR(2) dynamic process, consistent with gradual adjustment and partial reversals in infrastructure investment over time. This finding reflects the long-term and path-dependent nature of investment decisions in the wastewater sector.
Current operational pressures negatively affect investment dynamics. Increases in treated wastewater volumes and operating expenditures are associated with lower levels of investment, suggesting that higher operational intensity and rising costs constrain the financial resources available for capital formation. In contrast, the coefficient associated with the expected future evolution of pollution loads, captured by the lead of CBO5 removals, is positive and significant. This result indicates anticipatory investment behavior, whereby operators increase current investment in response to expected future environmental compliance requirements.
This negative short-run effect does not contradict the hypothesis of a positive relationship between scale and investment formulated in the literature review. The hypotheses refer primarily to medium and long-term complementarities, whereby sustained increases in service volumes create incentives for capacity expansion and network modernization. By contrast, the dynamic model estimated here identifies short-run deviations around these trends. In the presence of rigid budget constraints, unexpected increases in treated or transported volumes may temporarily crowd out capital expenditure, as operators are forced to allocate additional resources to operating and maintenance activities to preserve service continuity and comply with environmental standards. In periods characterised by intense investment cycles funded from European grants, this crowding-out mechanism is likely to be particularly strong, because co-financing requirements and cash-flow management further limit the room for parallel expansion of both operating and capital budgets. The negative and significant coefficients on ΔAUE and AUT should therefore be interpreted as evidence of such short-term trade-offs, rather than as a refutation of the longer-term complementarity between service expansion and infrastructure investment.
Investment activity is also positively influenced by variables reflecting scale and financial sustainability. Growth in the number of inhabitants connected to sewerage services is associated with higher investment levels, highlighting the need to expand and modernize infrastructure in response to increased demand. Similarly, higher tariffs and stronger revenue dynamics support investment by improving the financial capacity of operators and facilitating access to funding.
The statistical adequacy of the model is confirmed by a series of diagnostic tests. The over-identification test reported in Table 5 does not reject the null hypothesis of valid instruments, indicating that the instrument set is appropriate and uncorrelated with the error term. Furthermore, the Arellano–Bond serial correlation tests presented in Table 6 reveal first-order serial correlation but no evidence of second-order serial correlation in the differenced residuals, confirming that the assumptions required for the consistency of the Arellano–Bond estimator are satisfied.
Table 6.
Arellano–Bond Serial Correlation Test. Included observations: 387.
4.2. Robustness Analysis Including Wastewater Transported
To assess the robustness of the baseline results, a second dynamic panel model is estimated in which treated wastewater is replaced by wastewater transported to the sewerage network. This alternative measure captures the collection and conveyance dimension of wastewater services and allows verification of whether the estimated relationships depend on the specific operational proxy employed. The corresponding estimation results are reported in Table 7.
Table 7.
Dynamic panel data model including wastewater transported to the sewerage network (AUT). Dependent Variable: INVt. Method: Panel Generalized Method of Moments.
The estimated coefficients reveal a pattern that closely mirrors the baseline specification. Investment dynamics remain strongly persistent, with significant first and second lag effects. As in the baseline model, operating expenditures exert a negative influence on investment, while anticipated pollution loads, network size, tariffs and revenues all display positive and statistically significant effects.
The robustness of these findings is further supported by the diagnostic tests presented in Table 8. The over-identification test again confirms the validity of the instrument set, while the Arellano–Bond serial correlation statistics indicate the absence of second-order serial correlation. These results confirm that the alternative specification satisfies the key assumptions required for consistent GMM estimation.
Table 8.
Arellano–Bond Serial Correlation Test (model with transported wastewater). Included observations: 387.
The results closely mirror those obtained in the baseline model, both in terms of coefficient signs and magnitudes. Investment dynamics remain strongly persistent, and the effects of costs, tariffs, revenues and environmental performance indicators remain stable. Diagnostic tests, summarized in Table 8, again confirm instrument validity and the absence of second-order serial correlation, reinforcing the reliability of the results.
The empirical results provide consistent and robust evidence that investment decisions in the wastewater sector are shaped by a combination of past investment behavior, operational pressures, financial capacity and anticipated environmental requirements. The stability of coefficient signs and magnitudes across alternative model specifications underscores the reliability of the findings and confirms the suitability of the dynamic panel data approach adopted in this study.
5. Discussion
Building on the empirical analysis, this section provides an interpretative discussion of the results with respect to the research hypotheses, highlighting the mechanisms through which the evidence confirms, refines or nuances the conceptual expectations.
The first hypothesis (H1) postulated a significant relationship between changes in the volume of treated wastewater and infrastructure investment, reflecting variations in service demand and operational pressure. The empirical results confirm the existence of a statistically significant relationship, although its direction is negative. This finding suggests that, in the short to medium term, increases in treated wastewater volumes primarily capture intensified use of existing infrastructure rather than planned capacity expansion. Under such conditions, higher treatment volumes translate into greater operational strain and cost pressure, which may crowd out available resources for new capital investment. Therefore, while H1 is supported in terms of relevance, the results indicate that the operational dimension of treated wastewater acts as a constraining factor for investment when not accompanied by proportional increases in financial capacity or external funding.
Hypothesis H2 assumed that total wastewater operating expenditure is a significant determinant of investment. The negative and statistically significant coefficient associated with operating expenditure confirms this hypothesis, while also clarifying the nature of the relationship. Rather than signaling complementary investment activity, higher operating expenditures appear to absorb financial resources that could otherwise be allocated to infrastructure development. This result underscores the trade-off faced by wastewater operators between sustaining day-to-day operations and financing long-term capital projects, particularly in systems characterized by aging infrastructure and limited efficiency gains. Consequently, the findings suggest that operating expenditures function mainly as a financial constraint on investment, in line with the institutional realities of publicly owned utilities.
The empirical evidence provides clear support for Hypothesis H3, which proposed a positive relationship between wastewater tariffs and investment. The positive and significant effect of tariffs highlights their role as a key mechanism for improving cost recovery and strengthening the financial sustainability of operators. From an economic perspective, higher tariffs enhance the predictability of cash flows, facilitate access to borrowing and reduce reliance on irregular public transfers. These results confirm theoretical arguments in the literature emphasizing that adequate tariff structures are essential for sustaining capital-intensive infrastructure investment, even in regulated utility sectors.
Beyond statistical significance, the estimated coefficient for wastewater tariffs also has a clear economic interpretation. The results indicate that a one RON increase in the average wastewater tariff (TM) is associated with an increase in annual investment of approximately 5.8–6.5 million RON, depending on the model specification. This magnitude highlights the strong leverage effect of tariff policies on capital formation in the wastewater sector. Even relatively small adjustments in tariffs can significantly enhance operators’ capacity to finance large-scale infrastructure projects, particularly in capital-intensive segments such as wastewater treatment and network modernization. From an economic perspective, this effect reflects the role of tariffs in stabilizing cash flows, improving creditworthiness and strengthening co-financing capacity for European-funded investments.
Hypothesis H4, which posited a positive relationship between total operating revenues and investment, is also strongly supported by the empirical findings. The results indicate that revenue growth plays a central role in enabling investment, reinforcing the notion that internal financial capacity is an important determinant of long-term capital formation. In the context of wastewater infrastructure, stable and increasing revenues enhance operators’ autonomy in planning multi-year investment programs and reduce their vulnerability to external financing conditions. This finding aligns with the broader literature on infrastructure finance, which identifies revenue adequacy as a prerequisite for sustained investment activity.
With respect to Hypothesis H5, the analysis confirms a positive and statistically significant relationship between the number of inhabitants connected to sewerage services and investment. This result reflects the structural link between service coverage and infrastructure needs. An expanding user base increases system load and complexity, requiring network extensions, capacity upgrades and modernization to maintain service quality and environmental protection. The findings indicate that demographic and territorial expansion are important drivers of investment decisions, particularly in regions where sewerage networks are still evolving.
The coefficient associated with the number of inhabitants connected to sewerage services (LOC) is also economically meaningful. The estimates suggest that an increase of 1000 connected inhabitants is associated with an increase in annual investment of approximately 0.33–0.45 million RON. This result confirms that demographic expansion and network densification generate tangible investment needs, as additional users impose higher capacity requirements on treatment plants, pumping stations and sewerage networks. The magnitude of the coefficient indicates that service coverage expansion is not only statistically relevant, but also represents a substantial financial driver of infrastructure investment in practice.
Hypothesis H6 addressed the relationship between environmental performance, proxied by organic pollutant removal (CBO5), and infrastructure investment. The empirical results offer nuanced support for this hypothesis. While current treatment performance does not directly increase investment, anticipated future environmental pressure, captured through the lead of CBO5 dynamics, exerts a positive and significant effect on current investment. This outcome suggests that wastewater operators adopt a forward-looking investment behavior, responding to expected regulatory tightening and future pollution loads rather than reacting only to current performance indicators. In this sense, the results refine H6 by highlighting the anticipatory role of environmental regulation as a catalyst for investment.
The findings underline the importance of distinguishing between short-term operational pressures, which may constrain investment, and long-term structural and regulatory drivers, which support capital formation. By explicitly linking empirical results to the hypotheses derived from the literature, the analysis provides a coherent explanation of investment dynamics in the wastewater sector and offers a deeper understanding of how financial sustainability, operational efficiency and environmental regulation jointly shape infrastructure development.
6. Limitations and Directions for Future Research
A primary limitation of the present study is its focus on a single country, Romania, which may constrain the direct generalization of the results to other institutional and regulatory contexts. While the Romanian wastewater sector shares key structural characteristics with other European transition economies, cross-country extensions would allow for a more explicit assessment of external validity.
While the empirical results provide robust evidence on the determinants of investment in wastewater infrastructure, the findings should be interpreted in light of several limitations inherent to the data and the methodological approach. A first constraint relates to data availability and quality. The analysis relies on official benchmarking reports published by regional wastewater operators in Romania, which ensure a high degree of consistency and institutional credibility. However, as with any administrative data source, potential discrepancies may exist between reported figures and on-site operational realities, particularly with respect to cost allocation practices or investment classification.
Although standardization procedures and consistency checks reduce the risk of reporting manipulation, future research could further strengthen robustness by explicitly testing for outliers and influential observations using alternative trimming or winsorization techniques.
A second limitation arises from the aggregate nature of the econometric framework employed. Although the dynamic panel data approach is well suited to capturing persistence, delayed effects and endogeneity in investment behavior, it cannot fully account for region-specific factors such as local regulatory environments, geographical and climatic conditions, or operator-specific technological choices. Moreover, the use of annual, operator-level indicators may mask short-term adjustment dynamics or project-level heterogeneity, as large wastewater infrastructure investments are typically implemented over multiple years and may be affected by idiosyncratic events or financing arrangements that cannot be observed at this level of aggregation. Consequently, the estimated relationships should be interpreted as capturing general structural patterns across operators rather than precise causal mechanisms at the individual regional level.
An additional limitation concerns the indirect treatment of external financing and institutional factors. Although total investment (INV) includes expenditures financed from European Union grants as well as national and local budgets, the model does not explicitly distinguish between different funding instruments or measure operators’ differential access to EU funds. Furthermore, the lack of consistent information on the initial depreciation and age of wastewater infrastructure prevents the inclusion of capital stock replacement needs as explicit explanatory variables. Political and institutional dimensions, such as local political cycles, governance quality or strategic prioritization of infrastructure investment, are likewise not directly observable in the available data and therefore cannot be explicitly modeled. While these factors may influence investment decisions, their omission reflects data constraints rather than conceptual neglect.
In particular, the absence of detailed information on the composition of investment financing, such as the relative weight of EU grants, loans, or own equity, limits the ability to assess how different funding instruments influence investment behavior.
With respect to future research, several avenues could further extend and refine the present analysis. One promising direction would be the integration of more detailed indicators capturing technological efficiency, environmental outcomes and service quality, allowing a more direct assessment of how investment translates into sustainability performance. Complementing quantitative analysis with qualitative evidence, such as case studies or interviews with utility managers and regulators, could also provide deeper insights into institutional and governance mechanisms shaping investment decisions.
Furthermore, extending the empirical framework to a cross-country perspective within the European Union would facilitate comparative analyses and the identification of best practices under different regulatory and institutional settings. Incorporating governance-related variables, including tariff-setting mechanisms, degrees of financial autonomy and explicit measures of access to external funding sources, would offer a more comprehensive understanding of the factors driving investment behavior in the wastewater sector. By addressing these limitations and broadening the analytical scope, future research can contribute to the design of more coherent and effective policies aimed at ensuring the long-term sustainability of wastewater services.
7. Conclusions
This study provides an empirical assessment of the factors shaping investment behavior in wastewater infrastructure using a comprehensive panel of regional public operators in Romania. By combining operational, financial and environmental indicators within a dynamic panel data framework, the analysis contributes to a deeper understanding of how infrastructure investment decisions are formed and adjusted over time in a highly regulated and capital-intensive sector.
The findings highlight the dynamic and path-dependent nature of investment in wastewater services. Past investment levels exert a persistent influence on current investment decisions, confirming that capital formation in this sector follows multi-period adjustment processes rather than short-term optimization. This result underscores the importance of long-term planning and institutional stability in sustaining infrastructure development.
At the operational level, the analysis reveals that increases in treatment volumes and operating expenditures are associated with lower investment in the short run, indicating that operational pressures may constrain capital formation when financial resources are limited. These results emphasize the existence of trade-offs between maintaining day-to-day operations and financing long-term infrastructure projects, particularly in systems facing capacity constraints or efficiency challenges.
In contrast, financial variables emerge as key enablers of investment activity. Higher tariffs and stronger operating revenues significantly support infrastructure investment by improving cost recovery and financial sustainability. These findings reinforce the central role of sound financial frameworks in ensuring that wastewater operators can mobilize the resources necessary for modernization and expansion, while also highlighting the importance of balanced tariff policies that consider both investment needs and affordability concerns.
Environmental factors also play a critical role in shaping investment decisions. The positive relationship between anticipated pollution loads and current investment provides evidence of forward-looking behavior among wastewater operators, suggesting that expectations regarding future regulatory requirements and environmental standards act as important investment drivers. This result underlines the effectiveness of predictable and credible environmental regulation in stimulating timely infrastructure upgrades.
From a methodological perspective, the study demonstrates the suitability of dynamic panel data models for analyzing infrastructure investment under conditions of persistence, endogeneity and heterogeneous operator characteristics. The robustness of the results across alternative model specifications confirms the reliability of the empirical strategy and supports its application in similar institutional contexts. Future research could extend this framework by integrating water supply operations and energy efficiency indicators, allowing for a more comprehensive assessment of investment dynamics across the urban water cycle.
Overall, the study offers relevant insights for policymakers, regulators and utility managers concerned with the long-term sustainability of wastewater infrastructure. The results indicate that accelerating investment requires an integrated approach that simultaneously addresses operational efficiency, financial viability and regulatory predictability. By providing empirical evidence from a comprehensive national sample, this research contributes to the broader literature on infrastructure economics and environmental policy and offers a solid empirical foundation for future studies aimed at enhancing the sustainability and resilience of wastewater services.
From a policy perspective, the results suggest that tariff-setting mechanisms and co-financing arrangements play a critical role in sustaining investment capacity in the wastewater sector. Predictable tariff adjustment rules, combined with targeted co-financing schemes that leverage European Union funds, could help mitigate short-term investment crowding-out effects and support long-term infrastructure modernization. More explicit alignment between regulatory incentives, tariff policy and investment planning would enhance the effectiveness of public and EU-funded investment programs, particularly in transition economies.
These findings support the design of investment policies that align tariff-setting, financial sustainability and environmental regulation, ensuring timely and efficient modernization of wastewater infrastructure.
Author Contributions
Conceptualization, G.B., O.M., D.J. and K.-A.A.; methodology, D.J. and K.-A.A.; software, D.J. and K.-A.A.; validation, M.-I.S., G.B., O.M., D.-F.V., D.-D.Ț. and E.C.; formal analysis, M.-I.S., G.B., O.M., D.J., E.C. and K.-A.A.; investigation, M.-I.S., G.B., O.M., D.-F.V., D.-D.Ț. and E.C.; resources, G.B., O.M., D.-F.V. and D.-D.Ț.; data curation, M.-I.S., G.B., O.M., D.-F.V., D.-D.Ț. and E.C.; writing—original draft preparation, M.-I.S., D.J. and K.-A.A.; writing—review and editing, D.J. and K.-A.A.; visualization, M.-I.S., G.B., O.M., D.-F.V., D.-D.Ț. and E.C.; supervision, E.C., D.J. and K.-A.A.; project administration, D.J. and K.-A.A.; funding acquisition, M.-I.S., G.B., O.M., D.-F.V., D.-D.Ț. and E.C. All authors have read and agreed to the published version of the manuscript.
Funding
This research received no external funding.
Institutional Review Board Statement
Not applicable.
Informed Consent Statement
Not applicable.
Data Availability Statement
The data that support the findings of this study are available from the corresponding author upon reasonable request.
Conflicts of Interest
The authors declare no conflicts of interest.
References
- European Parliament Council. Directive 2000/60/EC Establishing a Framework for Community Action in the Field of Water Policy (Water Framework Directive). Off. J. Eur. Communities 2000, L327, 1–73. [Google Scholar]
- Council of the European Union. Directive 91/271/EEC Concerning Urban Waste Water Treatment. Off. J. Eur. Communities 1991, L135, 40–52. [Google Scholar]
- Santos, E.; Lisboa, I.; Eugénio, T. Economic Sustainability in Wastewater Treatment Companies: A Regional Analysis for the Iberian Peninsula. Appl. Sci. 2021, 11, 9876. [Google Scholar] [CrossRef]
- Marques, R.C.; Simões, P.; Marques, E. The Financial Model for Water and Sanitation Services in Portugal: Lessons from Decades of Subsidies and Questionable Public Policies. Water 2024, 16, 3087. [Google Scholar] [CrossRef]
- Ballabio, A.; Berardi, D.; Mazzarella, F.; Mocella, M.G.; Valle, N. Acqua e rifiuti nel Piano Nazionale di Ripresa e Resilienza. Econ. PUBBLICA 2021, 1, 77–103. [Google Scholar] [CrossRef]
- Gabric, S.; Broeks Motta, E.C.; Salvetti, M.S.G.; Lopez Martinez, P. Is the UWWTD Implementation Delivering Results for the People, the Economy, and the Environment of the Danube Region? A Wastewater Management Assessment Based on the World Bank’s Engagement. 2018, pp. 1–65. Available online: https://documents.worldbank.org/curated/en/558511544813043874/ (accessed on 10 November 2025).
- Chioatto, E.; Fedele, A.; Liscio, M.C.; Sospiro, P. How Do the Regions of the European Union Perform in the Sustainable Management of Municipal Waste? An Analysis of the Performance and Convergence of European Union Regions; Springer: Cham, Switzerland, 2024. [Google Scholar] [CrossRef]
- Bronner, M.; See, K.F. Pan-European Water Use Efficiency and Sustainability Evaluation Based on Stochastic Meta-frontier Analysis. Pertanika J. Soc. Sci. Humanit. 2024, 32, 1–27. [Google Scholar] [CrossRef]
- Rodrigues, C.; Martins, T.A.E.; Amaral, L. From Efficiency to Circularity in the Wastewater Sector: A Review of Performance Indicators in Regulated Countries. Water 2025, 17, 2226. [Google Scholar] [CrossRef]
- Lo Storto, C. Efficiency, Conflicting Goals and Trade-Offs: A Nonparametric Analysis of the Water and Wastewater Service Industry in Italy. Sustainability 2018, 10, 919. [Google Scholar] [CrossRef]
- Hassanein, A.A.; Khalifa, R.A. Financial and operational performance indicators applied to public and private water and wastewater utilities. Eng. Constr. Archit. Manag. 2007, 14, 479–492. [Google Scholar] [CrossRef]
- Tang, Y.; Liu, M.; Zhang, B. Can public-private partnerships (PPPs) improve the environmental performance of urban sewage treatment? J. Environ. Manag. 2021, 291, 112660. [Google Scholar] [CrossRef]
- Henriques, A.A.; Camanho, A.S.; Amorim, P.; Silva, J.G. Performance benchmarking using composite indicators to support regulation of the Portuguese wastewater sector. Util. Policy 2020, 66, 101082. [Google Scholar] [CrossRef]
- Ling, J.; Germain, E.; Murphy, R.; Saroj, D. Designing a Sustainability Assessment Framework for Selecting Sustainable Wastewater Treatment Technologies in Corporate Asset Decisions. Sustainability 2021, 13, 3831. [Google Scholar] [CrossRef]
- Sarraf, F.; Nejad, S.H. Improving performance evaluation based on balanced scorecard with grey relational analysis and data envelopment analysis approaches: Case study in water and wastewater companies. Eval. Program Plan. 2020, 79, 101762. [Google Scholar] [CrossRef] [PubMed]
- Ramos-Salgado, C.; Muñuzuri, J.; Aparicio-Ruiz, P.; Onieva, L. A comprehensive framework to efficiently plan short and long-term investments in water supply and sewer networks. Reliab. Eng. Syst. Saf. 2022, 219, 108248. [Google Scholar] [CrossRef]
- Khan, S.A.R.; Ponce, P.; Yu, Z.; Golpîra, H.; Mathew, M. Environmental technology and wastewater treatment: Strategies to achieve environmental sustainability. Chemosphere 2022, 286, 131532. [Google Scholar] [CrossRef]
- Faragò, M.; Damgaard, A.; Madsen, J.A.; Andersen, J.K.; Thornberg, D.; Andersen, M.H.; Rygaard, M. From wastewater treatment to water resource recovery: Environmental and economic impacts of full-scale implementation. Water Res. 2021, 204, 117554. [Google Scholar] [CrossRef] [PubMed]
- Walker, N.L.; Styles, D.; Gallagher, J.; Williams, A.P. Aligning efficiency benchmarking with sustainable outcomes in the United Kingdom water sector. J. Environ. Manag. 2021, 287, 112317. [Google Scholar] [CrossRef]
- Colella, M.; Ripa, M.; Cocozza, A.; Panfilo, C.; Ulgiati, S. Challenges and opportunities for more efficient water use and circular wastewater management. The case of Campania Region, Italy. J. Environ. Manag. 2021, 297, 113171. [Google Scholar] [CrossRef]
- Nahiun, K.M.; Sarker, B.; Keya, K.N.; Mahir, F.I.; Shahida, S.; Khan, R.A. A review on the methods of industrial waste water treatment. Sci. Rev. 2021, 7, 20–31. [Google Scholar] [CrossRef]
- Marques, R.C.; Simões, P. Revisiting the Comparison of Public and Private Water Service Provision: An Empirical Study in Portugal. Water 2020, 12, 1477. [Google Scholar] [CrossRef]
- Wada, C.A.; Burnett, K.M.; Okuhata, B.K.; Delevaux, J.M.S.; Dulai, H.; El-Kadi, A.I.; Gibson, V.; Smith, C.; Bremer, L.L. Identifying wastewater management tradeoffs: Costs, nearshore water quality, and implications for marine coastal ecosystems in Kona, Hawai‘i. PLoS ONE 2021, 16, e0257125. [Google Scholar] [CrossRef]
- Purnell, S.; Mills, N.; Davis, K.; Joyce, C. Assessment of the pollution incident performance of water and sewerage companies in England. PLoS ONE 2021, 16, e0251104. [Google Scholar] [CrossRef]
- Molinos-Senante, M.; Maziotis, A. Productivity growth, economies of scale and scope in the water and sewerage industry: The Chilean case. PLoS ONE 2021, 16, e0251874. [Google Scholar] [CrossRef]
- Liu, P.; Huang, Y.; Hermanowicz, S.W. Shifting entrepreneurial landscape and development performance of water startups in emerging water markets. PLoS ONE 2021, 16, e0246282. [Google Scholar] [CrossRef]
- Trimmer, J.T.; Qureshi, H.; Otoo, M.; Delaire, C. The enabling environment for citywide water service provision: Insights from six successful cities. PLoS Water 2023, 2, e0000071. [Google Scholar] [CrossRef]
- Thomas, E. Turning global water security research into policy and action. PLoS Water 2024, 3, e0000261. [Google Scholar] [CrossRef]
- Canteiro, M.; Cotler, H.; Mazari-Hiriart, M.; Babinet, N.; Maass, M. Natural dynamics and watershed approach incorporation in urban water management: A scoping review. PLoS ONE 2024, 19, e0309239. [Google Scholar] [CrossRef] [PubMed]
- Masoud, A.M.N.; Alfarra, A.; Sorlini, S. Constructed Wetlands as a Solution for Sustainable Sanitation: A Comprehensive Review on Integrating Climate Change Resilience and Circular Economy. Water 2022, 14, 3232. [Google Scholar] [CrossRef]
- Jensen, O.; Khalis, A. Urban water systems: Development of micro-level indicators to support integrated policy. PLoS ONE 2020, 15, e0228295. [Google Scholar] [CrossRef] [PubMed]
- Wu, Z.; Tian, G.; Han, X.; Li, J.; Xia, Q. Can the water resources tax policy effectively stimulate the water saving behavior of social water users? A DSGE model embedded in water resources tax. PLoS ONE 2023, 18, e0281920. [Google Scholar] [CrossRef]
- Kapanski, A.; Hruntovich, N.V.; Klyuev, R.V.; Brigida, V. Identification of Easily Accessible Urban Water Consumption Factors for Energy-Efficient Management of Pumping Stations. Water Conserv. Sci. Eng. 2025, 10, 46. [Google Scholar] [CrossRef]
- Puschnigg, S.; Patauner, D.; Böhm, H.; Doujak, E.; Müller, C. Digitalization and Hydropower Integration in Water Supply Systems: Unlocking Energy Potential, Efficiency, and Resilience. Clean. Eng. Technol. 2025, 29, 101098. [Google Scholar] [CrossRef]
- Ionașcu, A.E.; Hordofa, D.F.; Dănilă, A.; Spătariu, E.C.; Burcă, A.L.; Horga, M.G. ESG Performance in the EU and ASEAN: The Roles of Institutional Governance, Economic Structure, and Global Integration. Sustainability 2025, 17, 7997. [Google Scholar] [CrossRef]
- Silva, J.A. Wastewater Treatment and Reuse for Sustainable Water Resources Management: A Systematic Literature Review. Sustainability 2023, 15, 10940. [Google Scholar] [CrossRef]
- Munteanu, I.; Grigorescu, A.; Condrea, E.; Pelinescu, E. Convergent Insights for Sustainable Development and Ethical Cohesion: An Empirical Study on Corporate Governance in Romanian Public Entities. Sustainability 2020, 12, 2990. [Google Scholar] [CrossRef]
- Ćetković, J.; Knežević, M.; Lakić, S.; Žarković, M.; Vujadinović, R.; Živković, A.; Cvijović, J. Financial and Economic Investment Evaluation of Wastewater Treatment Plant. Water 2022, 14, 122. [Google Scholar] [CrossRef]
- Munteanu, I.; Ionescu-Feleagă, L.; Ionescu, B.Ș.; Spânu, A.-M.; Rus, M.I. The Philosophy of Financial Performance: A Bibliometric and Conceptual Review. Int. J. Financ. Stud. 2025, 13, 172. [Google Scholar] [CrossRef]
- Collins, E.J., Jr. Center for Public Management, University of Massachusetts Boston. In Study on Investment in Water and Wastewater Infrastructure and Economic Development; Edward J. Collins Center for Public Management Publications: Boston, MA, USA, 2014; Volume 23, Available online: https://scholarworks.umb.edu/cpm_pubs/23 (accessed on 5 November 2025).
- Moral Pajares, E.; Gallego Valero, L.; Román Sánchez, I.M. Cost of Urban Wastewater Treatment and Ecotaxes: Evidence from Municipalities in Southern Europe. Water 2019, 11, 423. [Google Scholar] [CrossRef]
- Murrar, A.; Awad, I.; Hasan, A.; Yaqob, E.; Barghothi, I.; Sadaqa, A.; Samhan, S.; Tamimi, A. The Impact of Water Price on the Financial Sustainability of the Palestinian Water Service Providers. J. Environ. Prot. 2017, 8, 1490–1508. [Google Scholar] [CrossRef]
- Mergoni, A.; D’Inverno, G.; Carosi, L. A composite indicator for measuring the environmental performance of water, wastewater, and solid waste utilities. Util. Policy 2022, 74, 101285. [Google Scholar] [CrossRef]
- Smol, M.; Koneczna, R. Economic Indicators in Water and Wastewater Sector Contributing to a Circular Economy (CE). Resources 2021, 10, 129. [Google Scholar] [CrossRef]
- Grimaldi, M.; Pellecchia, V.; Fasolino, I. Urban Plan and Water Infrastructures Planning: A Methodology Based on Spatial ANP. Sustainability 2017, 9, 771. [Google Scholar] [CrossRef]
- Al-Ajmi, F.; Al-Marri, M.; Almomani, F.; AlNouss, A. A Comprehensive Review of Advanced Treatment Technologies for the Enhanced Reuse of Produced Water. Water 2024, 16, 3306. [Google Scholar] [CrossRef]
- Obaideen, K.; Shehata, N.; Sayed, E.T.; Abdelkareem, M.A.; Mahmoud, M.S.; Olabi, A.G. The role of wastewater treatment in achieving sustainable development goals (SDGs) and sustainability guideline. Energy Nexus 2022, 7, 100112. [Google Scholar] [CrossRef]
- Baltagi, B.H. Econometric Analysis of Panel Data, 6th ed.; Springer: Cham, Switzerland, 2021. [Google Scholar] [CrossRef]
- Arellano, M.; Bond, S. Some tests of specification for panel data: Monte Carlo evidence and an application to employment equations. Rev. Econ. Stud. 1991, 58, 277–297. [Google Scholar] [CrossRef]

Disclaimer/Publisher’s Note: The statements, opinions and data contained in all publications are solely those of the individual author(s) and contributor(s) and not of MDPI and/or the editor(s). MDPI and/or the editor(s) disclaim responsibility for any injury to people or property resulting from any ideas, methods, instructions or products referred to in the content. |
© 2025 by the authors. Licensee MDPI, Basel, Switzerland. This article is an open access article distributed under the terms and conditions of the Creative Commons Attribution (CC BY) license (https://creativecommons.org/licenses/by/4.0/).