Abstract
Lithium (Li) is a critical metal element in geothermal systems, yet its enrichment mechanism in coastal geothermal waters remains poorly understood. This study focuses on the Xiamen coastal geothermal system, located in the South China granitic reservoir at the front of the Pacific subduction zone. Self-organizing map (SOM) classification, hydrogeochemical analysis, hydrogen–oxygen isotopic constraints, and a three end-member mass balance model were applied to identify the sources and enrichment mechanisms of Li. The geothermal waters are classified into two types: inland low-TDS (Cluster-1) and coastal high-TDS (Cluster-2). Isotopic data indicate a mixture of meteoric water and seawater as the recharge source. The model shows that seawater and groundwater mixing accounts for 2–45% of Li concentration, with over 55% derived from the rock end-member. The leaching of 0.002–0.187 kg of granite per liter of geothermal water explains the observed Li levels. Elevated temperature and low pH enhance Li+ release from silicate minerals, and reverse cation exchange further amplifies this process. A strong positive correlation between the CAI-II index and Li+ concentration reveals a synergistic effect of ion exchange in high-salinity environments. Overall, the results provide a quantitative framework for understanding Li enrichment and evaluating resource potential in coastal geothermal systems.
1. Introduction
Amid the global energy transition and carbon neutrality goals, geothermal energy has gained prominence as a clean and sustainable resource. Compared with wind and solar energy, it offers greater supply stability and continuity. Geothermal fluids are often enriched in strategic metals, particularly lithium (Li) [1,2]. As a key element for energy storage technologies, Li demand is surging due to the expansion of electric mobility and large-scale storage systems [3]. Conventional extraction from salt lakes and pegmatite deposits faces high costs and environmental impacts, prompting the search for alternative, eco-friendly Li sources [4,5]. Consequently, geothermal water has recently attracted considerable attention as a promising carrier and potential substitute for lithium resources [6,7,8].
Lithium enrichment in geothermal fluids has been reported in several major geothermal belts worldwide, including the Salton Sea (USA), the Upper Rhine Graben (Europe), and New Zealand, where Li concentrations in geothermal waters can reach tens to hundreds of mg/L, highlighting their dual potential for both energy production and metal extraction [8,9,10]. Despite rapid progress in related studies, the sources and enrichment mechanisms of Li in geothermal fluids remain debated. Most studies suggest that Li primarily originates from high temperature water–rock interactions during which, Li+ is released through mineral leaching and cation exchange/desorption from Li-bearing silicate minerals hosted within granites and rhyolites rocks [11,12,13,14]. Other studies propose that magmatic fluids or degassing may also provide a significant Li input in tectonically active regions [15,16]. Overall, Li in geothermal fluids can be attributed to the combined contributions of multiple end-members—including magmatic fluids, seawater, groundwater, and rock leaching—whose relative proportions ultimately control the hydrochemical composition of the system.
Compared with inland geothermal systems, coastal geothermal systems exhibit more complex geochemical coupling processes and greater spatial heterogeneity due to seawater intrusion and high ionic strength. Most previous studies have focused on the genesis of geothermal resources, reservoir temperatures, and seawater mixing processes [17,18,19,20,21], whereas investigations into Li enrichment mechanisms within coastal geothermal systems remain limited [22]. Xiamen, located in southeastern coastal China, lies within the continental–oceanic subduction geothermal belt of the circum-Pacific region and is characterized by granitic reservoirs representative of coastal geothermal settings [21]. Available data indicate that Li concentrations in Xiamen geothermal waters are relatively low (1–3 mg/L) but still exceed the national average [23,24]. This suggests that temperature-dependent water–rock interactions may continue to play a dominant role in Li enrichment even under significant seawater intrusion. Recent studies also suggest that seawater mixing significantly modifies water–rock interactions in coastal geothermal systems by increasing ionic strength, altering activity coefficients, and enhancing the leaching of silicate minerals. Experimental and field-based evidence shows that chloride-rich fluids derived from seawater can accelerate Li release through both mineral leaching and competitive cation exchange processes. For example, Dotsika et al. (2012) [25] demonstrated that seawater-derived Cl− can enhance fluid–rock isotopic exchange and mineral leaching at elevated temperatures, while leaching experiments by Toupal et al. (2024) [26] further indicate that acidic or high–ionic-strength fluids promote Li desorption from clay minerals. More recently, Siregar et al. (2026) [27] reported that in radiogenic granitic systems affected by seawater mixing, high ionic strength strengthens Li mobilization by promoting feldspar alteration and destabilizing Li-bearing phases. These findings highlight that although seawater does not directly supply Li, it may play an important catalytic role in coastal geothermal systems by amplifying temperature-dependent water–rock reactions responsible for Li enrichment. Direct sampling of reservoir rocks is often limited in coastal geothermal systems because deep drilling access is highly restricted. In this study, granitic core samples from the Dongshan geothermal well provide a measured Li content of 15 mg/kg, which is consistent with reported values for Yanshanian granites in southeastern China. When combined with major-ion ratios, isotopic constraints, and end-member modeling, this reservoir evidence allows geothermal fluids to serve as reliable geochemical proxies for subsurface lithology where systematic rock or sediment sampling is not feasible. Therefore, Xiamen provides an ideal natural laboratory for investigating the sources and enrichment pathways of Li in coastal geothermal systems.
Against this background, this study focuses on the coastal geothermal system of Xiamen to elucidate the sources and enrichment mechanisms of Li in geothermal waters, with particular emphasis on the dominant role of water–rock interaction under seawater mixing conditions. A combination of self-organizing map (SOM) classification and hydrogeochemical analysis was employed, coupled with δ2H–δ18O isotopic characterization to identify recharge sources. A three end-member mass balance model was used to quantitatively constrain the relative contributions of seawater, groundwater, and rock leaching to Li, while chloro-alkaline indices and ionic ratio diagrams were applied to diagnose the direction and intensity of cation exchange. This integrated approach enables quantitative identification of Li enrichment mechanisms and characterization of process coupling in high-TDS coastal geothermal systems. The findings provide new theoretical insights for Li resource evaluation and geochemical characterization of coastal geothermal provinces.
The increasing demand for lithium, driven by its crucial role in clean energy technologies such as electric vehicles and large-scale energy storage systems, has highlighted the need for more sustainable lithium extraction methods. Geothermal systems, particularly those enriched with lithium, present a promising alternative to traditional mining sources. The extraction of lithium from geothermal waters not only provides an eco-friendly alternative but also contributes to the sustainable utilization of geothermal energy resources, supporting the transition to a low-carbon economy.
2. Materials and Methods
2.1. Study Area
Xiamen is located on the southeastern coast of China, at the eastern edge of the South China Block (Figure 1a) and is strongly influenced by the subduction of the Pacific Plate, resulting in a complex geological setting [28,29]. The region is extensively covered by acidic granitic bodies from the Late Jurassic to Early Cretaceous (Figure 1b), which exhibit relatively high radioactivity [30]. The granite surfaces are covered by weathered layers up to 50 m thick, with Quaternary loose sediments covering the granite in coastal nearshore areas [21]. The region’s tectonic features are dominated by fault zones in multiple orientations, including NE, NW, and near-EW trending fault systems. Notably, the NW-striking extensional faults exhibit high hydraulic conductivity, while deep compressional faults in the NE direction govern the region’s heat flow and hydrogeological characteristics [21,31].
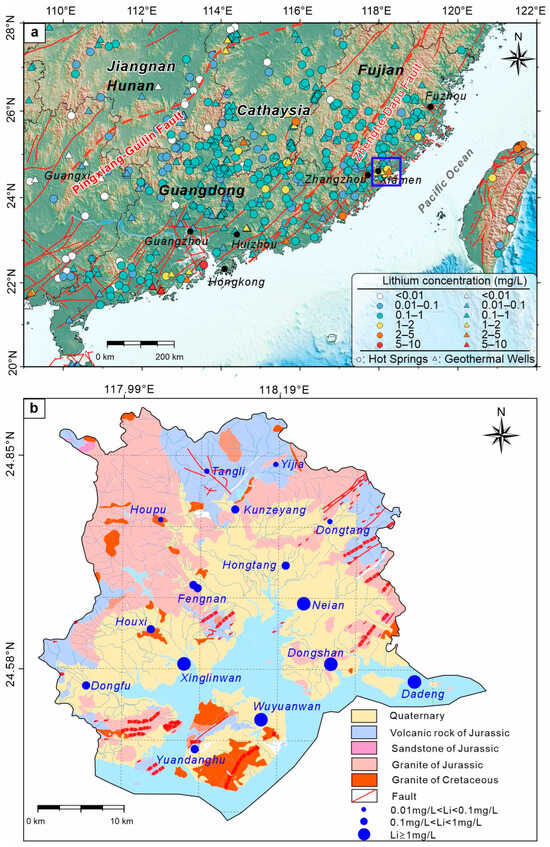
Figure 1.
Spatial distribution of lithium (Li) concentrations in geothermal waters of southeastern China (a); Geological map and spatial distribution of Li concentrations in geothermal waters of Xiamen (b).
The groundwater system is mainly replenished by atmospheric precipitation, with a well-developed runoff system flowing toward the ocean. Water sources include pore water in loose rocks, fissure water in the weathering zone, and fissure water in the bedrock [31,32]. Pore water in loose rocks is primarily distributed in shallow alluvial and residual weathering layers, while fissure water in the weathering zone and bedrock mainly resides in fractures of Yanshanian granites and volcanic rocks [31]. These fissure waters, controlled by the fault system, exhibit high permeability, especially where the NW-striking extensional faults and NE-striking compressional deep faults intersect, facilitating strong groundwater flow that is conducive to the migration and accumulation of geothermal fluids.
The geothermal anomalies in this region are particularly significant and are mainly concentrated in fault intersection areas. Studies show that the temperature of the geothermal waters generally ranges from 39 °C to 93 °C, with flow rates between 0.02 and 14.3 L/s [21]. These geothermal anomalies are closely associated with the fault systems, where fault opening and activity provide ample circulation pathways for geothermal fluids, influencing their distribution and dynamic changes. Estimates of deep geothermal reservoirs suggest that the temperature of deep geothermal waters ranges from 185 °C to 225 °C [31]. The geothermal system in this area is mainly fed by surface precipitation, which percolates through fault zones to the subsurface. After heating, it is released in the form of hot springs or penetrates the ocean through underwater seepage. The distribution of geothermal anomalies is closely related to fault activity, the upward migration paths of geothermal fluids, and local hydrogeological conditions, with faults playing a key role in the storage and movement of geothermal fluids [31]. Additionally, the regional geological conditions are deeply influenced by plate subduction. The subduction of plates not only causes significant changes in the depth of the Moho discontinuity but also induces localized asthenosphere uplift and deep depressions, which further influence the region’s hydrogeological characteristics [29].
2.2. Sample Collection and Testing Analysis
Medium- to low-temperature geothermal resources in Xiamen are distributed across bedrock mountainous areas, residual-slope terrains, and depositional landforms, forming 16 geothermal fields in total (Figure 2). In July 2024, 5 geothermal water samples were collected from representative sites covering these three geomorphic types, with their spatial distribution shown in Figure 2. Additionally, one seawater sample was collected from the Xiamen coastal zone. To complement this dataset, hydrochemical and partial hydrogen–oxygen isotope data from 24 additional geothermal water samples, sourced from 16 geothermal fields, were compiled from published studies and geological survey reports [24,31,33,34,35,36,37,38,39,40].
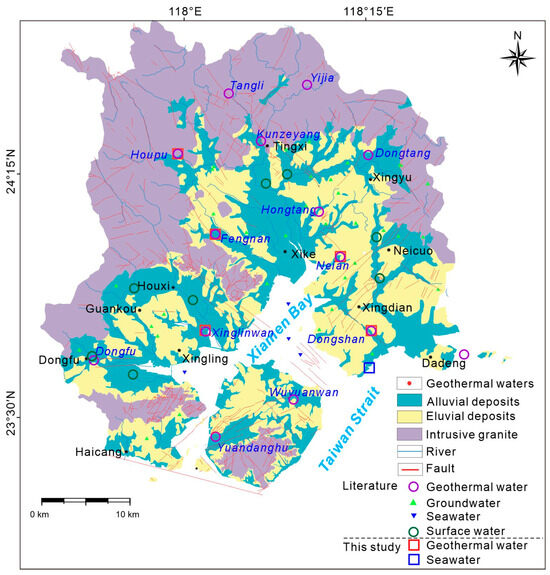
Figure 2.
Locations of water sampling sites in the Xiamen geothermal area.
In addition to water samples, core samples from the Dongshan geothermal well were collected for analysis. The Li content of the granite reservoir was measured using the ELEMENT XR inductively coupled plasma mass spectrometer, following Chinese national standard GB/T 14506.30-2010 [41], with a detection limit of 1.0 μg/g.
During sampling, a portable pH/temperature meter (HI991301; accuracy ±0.01 pH, ±0.5 °C) was used for in situ measurements of pH and temperature. All sampling bottles were pre-rinsed with the target water prior to collection. The geothermal groundwater samples were filtered through 0.2 μm cellulose acetate membranes and stored in 500 mL high-density polyethylene (HDPE) bottles with minimal headspace. Samples for cation, trace element, and isotope analyses were acidified to pH < 2 with ultrapure HNO3, while those for anion analysis were kept unacidified and stored in the dark at 4 °C. To prevent compositional alteration, all samples were cooled and analyzed as soon as possible after collection.
Major ions and dissolved SiO2 were analyzed in the laboratory, including K+, Ca2+, Na+, Mg2+, Li+, HCO3−, CO32−, SO42−, NO3−, Cl−, F−, and Br−. Cations (K+, Ca2+, Na+, Mg2+, Li+) were determined using inductively coupled plasma–optical emission spectrometry (ICP-OES) following the Chinese national standard HJ 776-2015 [42] with limits of detection (LOD) of 0.18, 0.47, 0.08, 0.01, and 0.009 mg/L, respectively. Chloride (Cl−) was measured by argentometric titration (LOD = 3.0 mg/L) following the Chinese national standard HJ 84-2016 [43], while SO42−, F−, and Br− were measured by ion chromatography (LOD = 0.072, 0.024, and 0.064 mg/L, respectively) in accordance with the same standard. The reference materials used for calibration were GNM-M047508-2013 (for Na, K, Ca, Mg) and GNM-M057231-2013 (for F−, NO3−, SO42−). Bicarbonate and carbonate (HCO3−, CO32−) concentrations were measured following DZ/T 0064.49-2021 [44] using standardized HCl solutions, with Na2CO3 analytical-grade primary standards used for titrant standardization. Total dissolved solids (TDS) were measured gravimetrically, and dissolved SiO2 was determined using the molybdate blue spectrophotometric method (LOD = 1.3 mg/L) following DZ/T 0064.62-2021 [45], with GBW(E)080272 used as the calibration standard.
Stable isotopes of δ18O and δ2H were analyzed using a liquid water isotope analyzer (L2130-i) following in Chinese national standard JCZX-BZ-002-2015 [46], and calibrated with standard solutions (GBW 04458, GBW 04459, GBW 04460). All results are reported relative to VSMOW. Analytical precision was better than 0.2‰ for δ18O and 2‰ for δ2H. Data quality was verified by charge balance error (CBE) calculations using Equation (1) [47]. All samples yielded CBE values within ±10%, indicating acceptable analytical accuracy and reliability.
where ion concentrations are expressed in milliequivalents per liter (meq/L).
2.3. Data Processing and Analytical Method
2.3.1. Self-Organizing Map (SOM) and K-Means Clustering
To identify the major hydrochemical types and controlling factors of geothermal waters in Xiamen, this study employed a coupled approach of self-organizing map (SOM) neural network [48] and K-means clustering to analyze 14 hydrochemical parameters (T, pH, TDS, K+, Ca2+, Na+, Mg2+, Li+, HCO3−, SO42−, Cl−, F−, Br−, SiO2) from 29 geothermal water samples. SOM is an unsupervised learning model that maps high-dimensional nonlinear data to a lower-dimensional space while preserving the topological structure of the data, revealing chemical similarities and evolutionary trends between samples [47,49,50].
The number of SOM output neurons was determined using the empirical formula (where n is the number of samples) [51]. The model was implemented in MATLAB R2023b (The MathWorks, Inc., Natick, MA, USA), and the optimal network structure was determined by minimizing quantization error (QE) and topographic error (TE) [52]. To improve clustering discrimination and robustness, K-means clustering was applied after SOM training [47]. The optimal number of clusters was determined using the Davies–Bouldin Index (DBI), where a lower DBI value indicates higher inter-cluster separation and better intra-cluster compactness, thus a better clustering result [53]. This combined SOM–K-means approach integrates the nonlinear pattern recognition ability of SOM with the statistical precision of K-means, enabling reliable classification and interpretation of geothermal water chemical evolution.
2.3.2. Isotopic Analysis and Water Source Identification
Stable isotopes (δ2H and δ18O) were used to trace the recharge sources and mixing processes of geothermal waters. The isotopic data were compared with the Global Meteoric Water Line (GMWL) [54] and the Local Meteoric Water Line (LMWL) [55] to identify the recharge origin and evaluate potential seawater mixing effects. Deviations from these reference lines indicate isotopic exchange during water–rock interactions or evaporation processes. Correlations between isotopic composition, chloride concentration, and lithium content were analyzed to assess the contributions of seawater intrusion and deep hydrothermal fluids.
2.3.3. Three End-Member Mass Balance Model
To quantitatively assess the relative contributions of seawater (sw), groundwater (gw), and rock leaching (rock) to Li in geothermal waters, a three end-member mass balance model based on Cl− mass conservation was established. Cl− was selected as the conservative tracer for the mixing process as it remains relatively unaffected by water–rock interactions and has minimal contribution from rock leaching (Cl₍rock₎ ≈ 0). Lithium (Li+), on the other hand, can be released or adsorbed during water–rock interactions. Precipitation and freshwater were not considered as an end-member in this study as the primary sources of geothermal water in the region are groundwater and seawater, with little direct contribution from precipitation. The lithium concentration in precipitation is typically low and often below the detection limit, which further supports the exclusion of precipitation as a major contributor to Li in geothermal fluids.
- Seawater fraction () calculation:
Using Cl− as a conservative tracer, the volume fraction of seawater in the mixing system was calculated as:
where is the observed Cl concentration of the sample and and are the Cl concentrations of seawater and groundwater end-members, respectively.
- 2.
- Li concentration from mixed water sources ():
Based on mass conservation in seawater–groundwater mixing, the Li concentration from the mixed water sources is given by:
where and are the Li concentrations of seawater and groundwater, respectively.
- 3.
- Rock end-member contribution:
The excess Li concentration beyond is attributed to the contribution from rock leaching:
The percentage contribution of each end-member is calculated as:
If , it indicates that the mixing model can explain the observed Li concentration, and the contribution from rock leaching is considered negligible.
- 4.
- Estimation of rock leaching amount:
The bulk Li content in rock was assumed to be , which was measured from granite core samples from the Dongshan geothermal well in this study. This value is consistent with reported Li abundances of granitic rocks in the Xiamen–Zhangzhou coastal batholith [56], suggesting that it is representative of the regional lithology. Adopting a fixed not only simplifies the mass balance calculation but also provides a reasonable first-order approximation of the rock-derived Li contribution to the geothermal fluids. This assumption allows for the calculation of the required rock leaching per liter of geothermal water:
This parameter represents the theoretical amount of rock leaching required for Li+ enrichment in geothermal waters and reflects the intensity of water–rock interactions.
2.3.4. Statistical and Hydrochemical Analysis
Statistical analyses were performed using OriginPro 2023 (OriginLab, version 2023) to explore the correlations among major ions, temperature, pH, and lithium concentrations. Ion ratio diagrams (e.g., Na+/Cl− vs. Ca2+/Mg2+) and chloro-alkaline indices (CAI-I and CAI-II) [57] were used to evaluate cation exchange reactions and their directional tendencies. Gibbs diagrams [58] and extended ionic ratio plots were employed to identify the dominant hydrogeochemical processes controlling the geothermal system, including water–rock interactions, evaporation, and seawater mixing.
3. Result
3.1. Hydrochemical Characteristics
The main physicochemical parameters and ionic compositions of geothermal waters in the study area are presented in Appendix A (Table A1). The geothermal water temperature ranges from 37.6 to 88.9 °C (average 56.86 °C), showing an increasing trend from inland hills toward the coastal zone, reflecting regional differences in geothermal gradients. In contrast, cold groundwater and seawater temperatures remain stable at approximately 25 °C. The pH of geothermal waters varies between 6.55 and 9.00 (average 7.33), indicating neutral to slightly alkaline conditions. Total dissolved solids (TDS) range from 231 to 21,093 mg/L (mean 6749 mg/L), significantly higher than those of cold groundwater (186–251 mg/L), with coastal samples showing generally higher salinity.
The dominant cations are Na+, Ca2+, K+, and Mg2+ (averages of 1608, 830, 55, and 33 mg/L, respectively), while the main anions are Cl−, SO42−, and HCO3− (averages of 3817, 278, and 64 mg/L, respectively). The notably high Cl− concentrations reflect a chloride-type geothermal fluid, while Br− concentrations are low but exhibit Br−/Cl− ratios close to seawater, suggesting potential seawater mixing. The SiO2 concentrations range from 49.26 to 114.25 mg/L (average 76.94 mg/L), indicating widespread hydrothermal water–rock interactions involving quartz-bearing minerals. Li+ concentrations range from 0.06 to 3.29 mg/L (mean 0.92 mg/L), and F− concentrations range from 0.29 to 13.06 mg/L (mean 5.23 mg/L). The reservoir temperature estimated using the quartz geothermometer ranges from 98.5 to 141.6 °C [31].
Overall, geothermal waters in Xiamen show a spatial evolution from inland low-salinity to coastal high-salinity types. The synchronous increase in TDS and Cl− suggests seawater intrusion as a possible controlling factor. The co-variation of Na+ and Ca2+ implies active cation exchange processes, while elevated SiO2 and Li+ contents further indicate intense water–rock interactions within the geothermal reservoirs.
3.2. SOM and K-Means Clustering Results
In the SOM–K-means analysis of the hydrochemical dataset, the optimal number of clusters was determined as k = 2 based on the minimum Davies–Bouldin Index (DBI) criterion. Following the Vesanto empirical rule [51] (), grid sensitivity tests were performed for amples using configurations of 4 × 6 (24), 5 × 5 (25), 5 × 6 (30), and 6 × 6 (36) neurons. After 100 iterations, the quantization error (QE) and topographic error (TE) converged, and a 5 × 5 (25-unit) SOM grid was selected as the optimal topology (Figure 3).
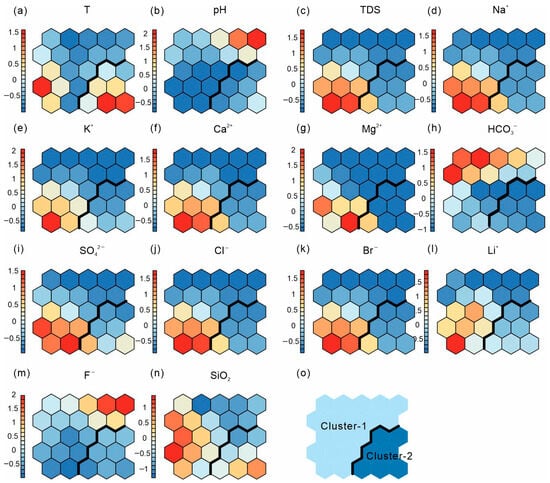
Figure 3.
Component planes (a–n) and classification map (o) of 14 hydrochemical variables obtained from the SOM analysis.
Figure 3 illustrates the SOM component planes and U-matrix/classification map trained using 14 hydrochemical variables. Each component plane displays the weight distribution of a single variable across the neurons, with colors ranging from cool (low) to warm (high), visually indicating relative variations and gradients among samples. Comparing color gradients across planes helps identify potential correlations among variables and their hydrochemical significance [59].
As shown in the component planes (Figure 3), Na+ and Cl− exhibit highly consistent gradients, indicating a common origin associated with seawater mixing. Similar spatial patterns between Ca2+–Mg2+ and Mg2+–SO42− suggest the involvement of carbonate dissolution and/or cation exchange processes for Ca2+ and Mg2+, while Mg2+–SO42− patterns indicate sulfate dissolution and cation exchange. Li+ shows a similar distribution pattern to SiO2, with high-value zones overlapping areas of elevated TDS, implying that silicate mineral leaching under high-temperature conditions significantly contributes to Li release. In contrast, F− displays a relatively independent distribution pattern, suggesting that its concentration is more strongly influenced by pH and local lithology.
Figure 4a presents the visualization of SOM node weight vectors (radial fan diagrams), where each node represents the normalized values of 14 variables, and the fan blade length indicates relative intensity. Overall, TDS, Na+, Cl−, and Li+ show extended blades in certain nodes, implying higher concentrations in corresponding samples. In particular, nodes corresponding to Cluster-2 display simultaneously enlarged Na+ and Cl− fans along with high TDS and Li+, indicating that the elevated Na+ and Cl− concentrations are likely influenced by both seawater mixing and water–rock interactions. Seawater mixing introduces Na+ and Cl− into the system, while water–rock interactions, particularly the leaching of silicate minerals and cation exchange, enhance the release of Li+ and further raises TDS. This combined influence results in the observed patterns of high Na+, Cl−, and TDS, suggesting a coupling of both processes.
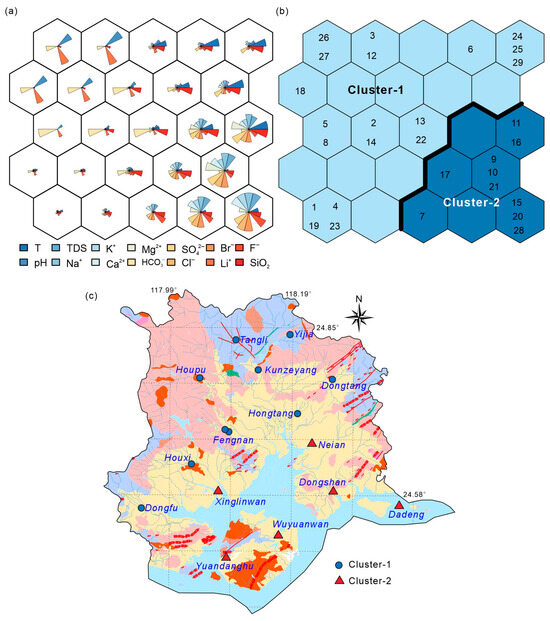
Figure 4.
SOM clustering results and spatial distribution of geothermal water samples. (a) Visualization of normalized weight vectors for hydrochemical parameters; (b) U-matrix displaying topological distances and cluster boundaries; (c) spatial distribution of clustered geothermal samples in the Xiamen area.
After SOM training, K-means clustering was applied for secondary grouping, with DBI confirming k = 2 as optimal. Accordingly, SOM nodes were classified into Cluster-1 and Cluster-2. Cluster-1, primarily located in inland regions, is characterized by low TDS and Li+ concentrations (<1.0 mg/L), representing freshwater-dominated geothermal systems mainly recharged by meteoric water. Cluster-2, concentrated in coastal areas, exhibits high TDS (>10,000 mg/L) and elevated Li+ (0.75–3.29 mg/L), along with pronounced Na+ and Cl− enrichment, reflecting the combined influence of seawater mixing and high-temperature water–rock reactions.
The spatial distribution of these clusters (Figure 4c) shows that Cluster-1 samples are mainly distributed within bedrock mountainous and residual-slope areas, while Cluster-2 samples are concentrated along coastal fault zones and nearshore geothermal fields. This distribution indicates that the differentiation of hydrochemical types is closely linked to regional tectonic structures and seawater intrusion. The spatial concentration of Cluster-2 further suggests that coastal fault systems serve as critical conduits for seawater–thermal fluid exchange and represent the primary geological environment for Li enrichment processes.
3.3. Hydrogen and Oxygen Isotopic Characteristics
The δ18O and δ2H values of geothermal waters in the study area range from −7.7‰ to −3.8‰ and −51‰ to −21‰, respectively. In comparison, cold groundwater and surface water exhibit δ18O values of −7.3‰ to −4.7‰ and −6.4‰ to −4.8‰, and δ2H values of −47‰ to −32‰ and −41‰ to −32‰, respectively [31]. Seawater, however, is isotopically more enriched, with δ18O values between −2.35‰ and −0.6‰ and δ2H values between −17.6‰ and −5‰ [60].
Figure 5 shows the relationship between δ18O and δ2H for surface water, groundwater, and geothermal water, plotted together with the Global Meteoric Water Line (GMWL) [58] and the Local Meteoric Water Line (LMWL) [55]. Overall, all water types plot close to the GMWL and LMWL, indicating that meteoric water serves as the primary recharge source. Spatially, Cluster-1 geothermal waters in inland areas exhibit more depleted δ18O and δ2H values relative to surface and cold groundwater, while Cluster-2 geothermal waters from coastal zones show relatively enriched δ18O and δ2H values. The pronounced positive δ18O shift observed in Cluster-2 likely reflects isotopic exchange between water and rock at elevated temperatures [25].
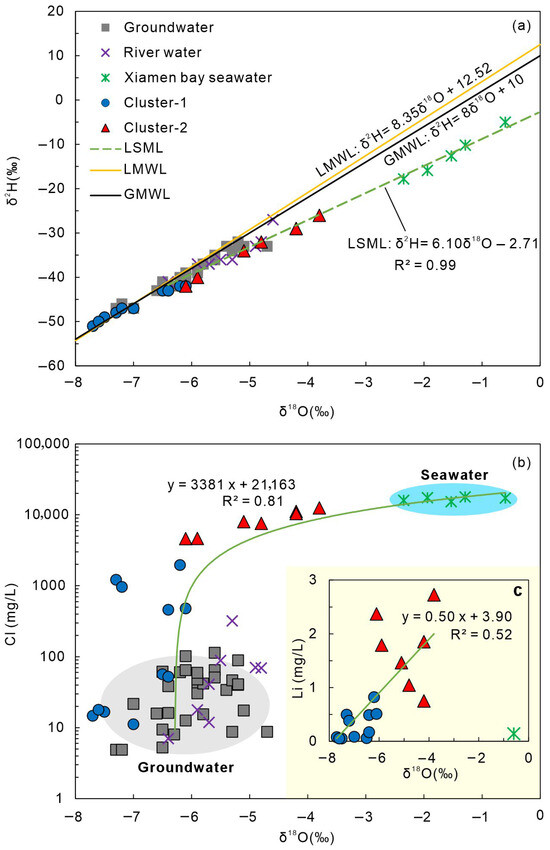
Figure 5.
(a) δ18O–δ2H diagram of geothermal waters and other water types. GMWL: Global Meteoric Water Line [48]; LMWL: Local Meteoric Water Line [54]. Hydrogen and oxygen isotope data for river water are from [31], and seawater isotope data are from [60]. (b) Relationship between δ18O and Cl− for geothermal waters and other water types. (c) Relationship between δ18O and Li+ for geothermal waters.
4. Discussion
4.1. Integration of SOM Clustering and Hydrochemical Types
Figure 6 presents the Piper diagram of geothermal water samples colored according to the SOM–K-means (SOM–KM) clustering results. Cluster-1 (inland samples) is mainly distributed in the HCO3·SO4–Na, SO4·HCO3–Na·Ca, Na·Ca–Cl, and Na–Cl facies fields, indicating dominant water–rock interactions controlled by meteoric recharge and carbonate/silicate weathering, accompanied by partial cation exchange (Ca2+ ↔ Na+). These samples exhibit relatively low TDS and Li+ concentrations with limited variability. The co-variation of Ca2+ and HCO3− further suggests that carbonate dissolution and early-stage mineral weathering are the primary controls on water chemistry. Cluster-2 (coastal samples) plots predominantly in the Cl–Na·Ca field of the Piper diagram, characterized by elevated Na+, Cl−, and TDS concentrations. The strong Na+–Cl− coupling and Br−/Cl− ratios close to seawater values indicate that seawater mixing is a key process. Simultaneously, significantly higher Li+ concentrations in Cluster-2 suggest that enhanced ionic strength from seawater mixing and intensified water–rock interactions jointly promote Li release.
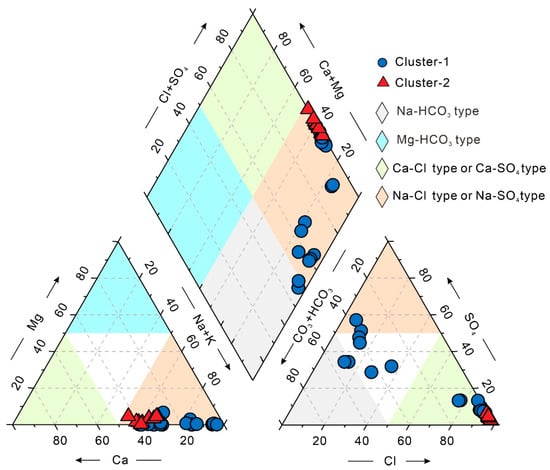
Figure 6.
Piper diagram of geothermal water samples colored according to the SOM–K-means clustering results.
Overall, the hydrochemical facies evolve from Ca–HCO3 type in inland areas to Na–Cl type in coastal zones, reflecting the combined influence of water–rock interactions and seawater intrusion. The SOM–KM clustering results further confirm this trend: Cluster-1 waters are primarily governed by water–rock reactions, while Cluster-2 waters experience the dual influence of seawater intrusion and geothermal water–rock processes.
4.2. Source of Geothermal Water
Figure 5a illustrates the relationships between the hydrogen–oxygen isotopic compositions and chemical parameters of geothermal and other water types in Xiamen. In Figure 5a, the δ18O and δ2H values of geothermal water samples plot near the Global Meteoric Water Line (GMWL) and the Local Meteoric Water Line (LMWL), indicating that meteoric water serves as one of the primary recharge sources [54,55]. However, SOM clustering divides the geothermal waters into two distinct groups—Cluster-1 and Cluster-2—which differ significantly in both hydrochemical features and origins.
Cluster-1 (inland samples) is mainly characterized by mixed hydrochemical facies such as HCO3–Ca·Na and HCO3·SO4–Na·Ca, reflecting meteoric water–dominated recharge with minimal marine influence. Br− was undetected or present in trace amounts in these samples, and δ18O-based recharge elevation estimates further support a meteoric origin [24].
In contrast, Cluster-2 (coastal samples) exhibits markedly higher Cl− concentrations and Br−/Cl− ratios close to the seawater end-member [24]. The δ18O–δ2H relationship of these samples lies along the precipitation–seawater mixing line (LSML: δ2H = 6.10δ18O + 2.71, R2 = 0.91), suggesting that seawater mixing is an important source of coastal geothermal water. As shown in Figure 5b, a strong positive correlation exists between Cl− and δ18O for Cluster-2, which cannot be explained by rock leaching (as Cl− contributions from rocks are negligible). Therefore, in addition to water–rock interactions, saline (seawater) mixing is a major factor contributing to Cl− and δ18O enrichment [25]. Cluster-2 samples plot along the groundwater–seawater mixing line with a correlation coefficient of R2 ≈ 0.81 [19], confirming that these geothermal waters originate from the mixing of meteoric water and seawater. In contrast, inland samples show no significant Cl−–δ18O correlation, highlighting the compositional and source differences between inland and coastal systems.
Furthermore, Figure 5c shows a strong positive correlation between Li+ and δ18O, while seawater end-members deviate from this trend line. This indicates that Li enrichment does not result from direct seawater contribution. Instead, seawater intrusion increases ionic strength and, under elevated temperature conditions, enhances water–rock interactions and mineral leaching, thereby indirectly promoting Li release. The distinct separation of Li+–δ18O relationships between Cluster-1 and Cluster-2 further confirms their differences in recharge sources and hydrochemical composition.
4.3. Factors Influencing Li Enrichment
4.3.1. pH
In the study area, the pH of geothermal waters in Cluster-1 and Cluster-2 ranges from 6.64 to 9.00 (mean 7.6) and 6.55 to 7.01 (mean 6.82), respectively. Lower pH (higher H+ activity) enhances mineral–solution reaction rates, promoting Li+ release from lithium-bearing silicates and clays. Under acidic conditions, H+ competes for interlayer sites and accelerates partial leaching of clays and silicates, releasing Li+ into the fluid [26,61]. In this study, the geothermal reservoir consists of granite, which contains silicate minerals such as biotite. Although no direct sediment samples were analyzed, the high concentration of SiO2 in the geothermal water, along with the presence of lithium-bearing silicates like biotite in the granite, suggests that these minerals contribute to Li release during water–rock interactions. At low pH, surface Si–OH groups on silicates are known to undergo condensation to form Si–O–Si linkages, reducing the density of available adsorption sites and thereby suppressing re-adsorption of Li+. This process further enhances the net release of Li+ into solution. As shown in Figure 7, pH and Li+ concentrations show a weak negative correlation (R2 ≈ 0.33), with lower pH corresponding to higher Li+ concentrations, especially in Cluster-2, suggesting that pH is a controlling factor for Li enrichment.
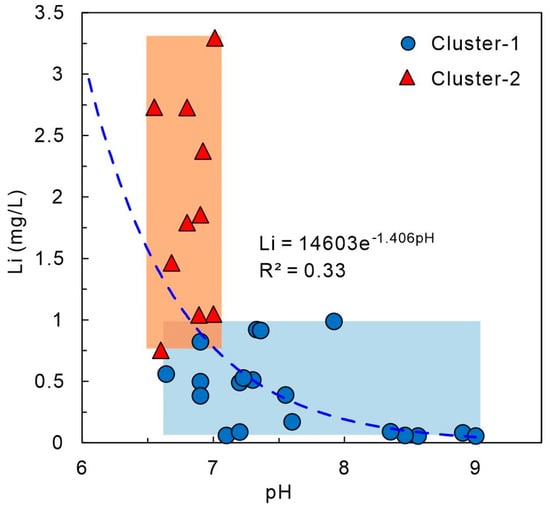
Figure 7.
Relationship between lithium concentration and pH in geothermal waters.
In alkaline conditions (pH > 7), Li+ is more likely to be adsorbed onto clay edge sites and incorporated into carbonate co-precipitation or secondary silicate formation, reducing its effective activity. LiOH and Li2CO3 are unlikely to precipitate in natural waters; adsorption and co-precipitation are the dominant mechanisms. Higher pH in Cluster-1 likely inhibits Li release, while lower pH and higher ionic strength in Cluster-2 promote Li migration. Although the correlation is moderate (R2 ≈ 0.33), pH is still a significant regulator of Li enrichment, influenced by temperature, water–rock interactions, mineral composition, and ionic strength [62].
4.3.2. Temperature
Temperature is a key parameter influencing both the thermodynamic and kinetic properties of element solubility and water–rock interactions. Generally, increasing temperature enhances the leaching of host rock minerals, thereby elevating elemental concentrations in geothermal fluids [63]. In this study, the relationship between geothermal outlet temperature and Li concentration (Figure 8a) shows a strong positive correlation in Cluster-1 waters, whereas Cluster-2 exhibits no clear relationship. This suggests that the effect of outlet temperature on Li enrichment in coastal samples may be partially masked by seawater mixing, which increases ionic strength and induces dilution effects.
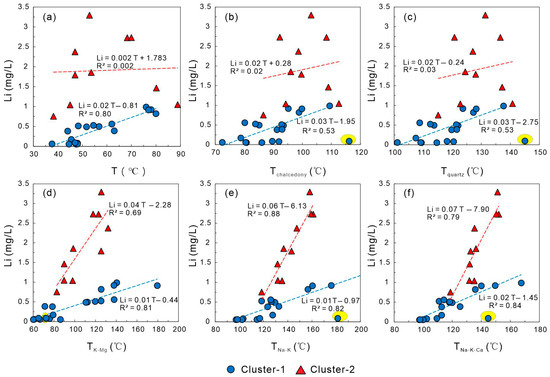
Figure 8.
Relationships between lithium (Li) concentration, temperature (T), and geothermal geothermometers in geothermal waters of the study area. (a) Li concentration vs. measured temperature (T); (b–f) relationships between Li concentration and calculated geothermometer temperatures (Tchalcedony, Tquartz, TK–Mg, TNa–K, and TNa–K–Ca), showing strong positive correlations for cation-based thermometers. The yellow highlighted area represents an anomaly in Cluster-1.
Since outlet temperatures can be biased by shallow cold-water inflow, reservoir temperatures were estimated using multiple geothermometers—Tchalcedony, Tquartz, TK–Mg, TNa–K, and TNa–K–Ca—to better assess the correlation between Li concentration and reservoir temperature [64,65,66,67,68]. Excluding the Tangli sample (whose host rocks are Jurassic rhyolites, while others are granitic), both geothermal clusters exhibit strong positive correlations between Li+ concentration and cation-based geothermometers (TK–Mg, TNa–K, and TNa–K–Ca). Among these, Cluster-2 shows higher correlations, with R2 values of 0.88 for TNa–K and 0.79 for TNa–K–Ca, indicating that reservoir temperature exerts a strong positive control on Li enrichment in medium- to high-temperature geothermal systems. In contrast, the correlations between Li+ and silica geothermometers (Tchalcedony and Tquartz) are weaker (R2 = 0.53 for both). This reduced performance reflects several well-recognized limitations of Si-based thermometry: (i) silica minerals re-equilibrate slowly during fluid ascent so chalcedony and quartz often fail to reach thermodynamic equilibrium and tend to underestimate reservoir temperatures; (ii) seawater mixing modifies dissolved SiO2 activity through dilution and ionic-strength-dependent speciation effects, particularly in high-TDS Cluster-2 waters, causing disequilibrium between measured SiO2 concentrations and actual reservoir conditions; and (iii) secondary silica precipitation during cooling or flashing can further reduce dissolved silica and obscure the primary thermal signal. These kinetic and mixing-related processes weaken the reservoir-temperature signal recorded by dissolved silica, making Si-based thermometers less reliable than cation geothermometers in the Xiamen coastal system [64,65,66,67,68].
The Na–K–Mg ternary diagram [66] (Figure 9) shows that most geothermal waters lie within the partial equilibrium zone, suggesting that water–rock reactions are ongoing and chemical compositions are still evolving. This partial equilibrium may introduce bias into cation geothermometers, affecting the stability of Li–temperature correlations. Despite these uncertainties, the overall influence of temperature on Li enrichment remains significant, as Li concentrations in medium- to high-temperature geothermal systems generally exhibit a clear positive relationship with temperature.
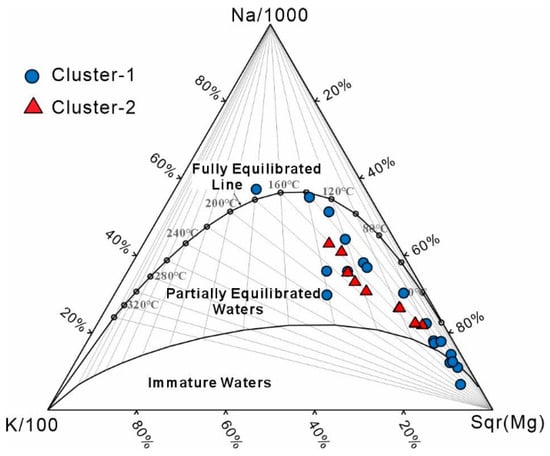
Figure 9.
Na–K–Mg ternary diagram of geothermal waters in the study area.
4.3.3. Water–Rock Interactions
The Gibbs diagram is a classical tool for interpreting geothermal water chemistry, illustrating the dominant roles of water–rock interactions, meteoric recharge, and evaporation [58]. In coastal geothermal systems, the apparent “evaporation effect” typically reflects seawater mixing or halite dissolution rather than physical evaporation. In the Xiamen geothermal system, however, the reservoir is hosted entirely in granites and volcanic rocks, and no halite-bearing strata are present. Thus, halite dissolution can be excluded as a chloride source, and the assumption of negligible Cl− contribution from rock leaching remains valid. The dominant source of Cl− is seawater mixing, consistent with observations from other coastal geothermal systems [69]. The extended Gibbs diagram [70] indicates that such processes project into the evaporation domain, modifying ionic composition. Accordingly, in Xiamen, the apparent evaporation trend mainly represents seawater intrusion.
Figure 10 shows that Cluster-1 samples plot in the water–rock interaction field, while Cluster-2 lies in the evaporation zone, consistent with geothermal systems in the Pearl River Delta [69]. Cluster-1 waters are dominated by rock weathering and mineral leaching, typical of inland systems. Cluster-2, with higher Na+/(Na+ + Ca2+) and TDS, indicates a strong marine influence. Although seawater mixing is significant, water–rock interactions remain the key driver of Li enrichment as seawater mainly enhances ionic strength and promotes reaction kinetics rather than directly supplying Li.
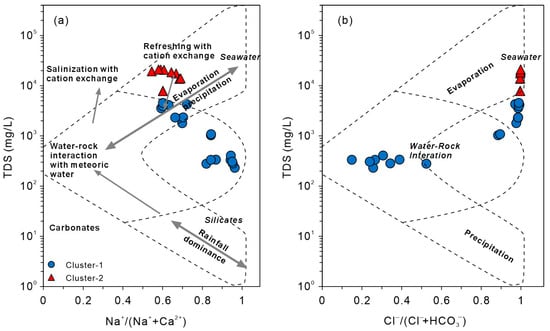
Figure 10.
Gibbs diagrams of geothermal waters. (a) Relationship between total dissolved solids (TDS) and Na+/(Na+ + Ca2+) (modified after [69]); (b) relationship between total dissolved solids (TDS) and Cl−/(Cl− + HCO3−).
Figure 11 presents the relationships between Li concentration and ionic ratios (rNa+/rCl−, rSO42−/rCl−). Seawater in Xiamen has rNa+/rCl− ≈ 0.87 and rSO42−/rCl− ≈ 0.10, while geothermal waters show strong divergence. Cluster-1 exhibits higher ratios (rNa+/rCl− = 0.63–13.67, rSO42−/rCl− = 0.07–8.95), reflecting silicate leaching and cation exchange under open, oxidizing conditions. Cluster-2 shows lower ratios (rNa+/rCl− = 0.56–0.72, rSO42−/rCl− = 0.02–0.07), suggesting Na+ depletion and suppressed SO42− levels that are more plausibly attributed to mixing with sulfate-poor saline waters, mineral precipitation, or long water–rock interactions, together with enhanced Cl− enrichment under more closed conditions. These changes likely result from Na–Ca exchange and plagioclase weathering, accompanied by Li release from silicate lattices.
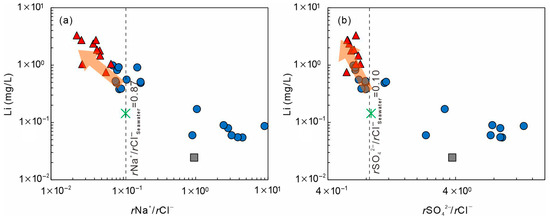
Figure 11.
Relationships between lithium (Li) concentration and ionic ratios in geothermal waters. (a) Li plotted against rNa+/rCl−; (b) Li plotted against rSO42−/Cl−. The symbols are consistent with those used in Figure 5.
Li concentrations in Cluster-2 (0.75–3.29 mg/L) are 5–20 times higher than in seawater (0.144 mg/L). Although their ratios approach seawater values, Li enrichment originates mainly from granite–fluid reactions. Seawater mixing increases ionic strength and modifies activity coefficients, thereby accelerating silicate leaching and clay desorption [71,72]. Thus, seawater intrusion acts as a facilitator, enhancing Li mobilization rather than serving as a direct source.
4.3.4. Cation Exchange
Cation exchange is a key mechanism in the hydrogeochemical evolution of groundwater [69,73], regulating major cations (Na+, Ca2+, Mg2+) and indirectly affecting trace elements such as Li+. In Figure 12a, the rNa+/rCl− ratios of Cluster-2 (<0.56) are notably lower than those of seawater (~0.87), indicating Na+ depletion and reverse exchange, whereas Cluster-1 (0.63–13.67) shows normal exchange. A strong Na+–Li+ correlation (Figure 12b)—especially in Cluster-2—suggests that ion exchange facilitates Li+ release.
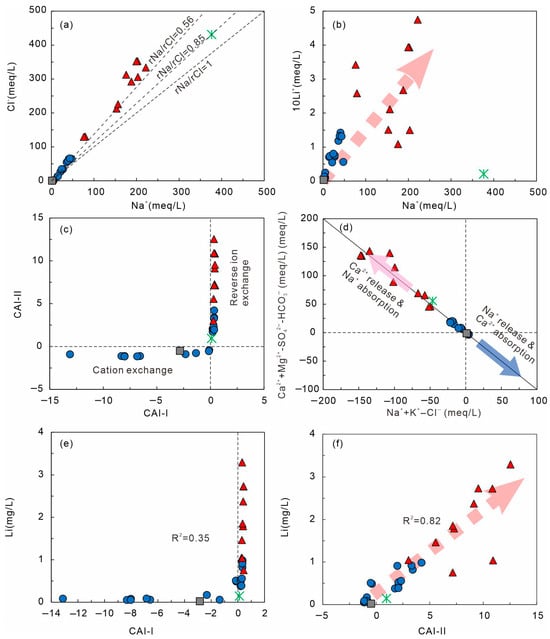
Figure 12.
Relationships among major ions, CAI indices, and Li concentration in geothermal waters. (a) Na+–Cl−; (b) Na+–Li+; (c) CAI-I–CAI-II plot; (d) (Ca2+ + Mg2+ − SO42− − HCO3−)–(Na+ + K+ − Cl−); (e) Li+–CAI-I (R2 = 0.35); (f) Li+–CAI-II (R2 = 0.82). The symbols are consistent with those used in Figure 5.
The Chloro-Alkaline Indices (CAI-I and CAI-II; Equations (9) and (10)) are effective indicators of exchange direction, with all ion concentrations expressed in meq/L to ensure charge-equivalent comparability [74]. Positive CAI values in Cluster-2 imply Na+ adsorption and Ca2+/Mg2+ release (reverse exchange), while negative CAI values in Cluster-1 indicate Na+ release and Ca2+ uptake. The (Ca2+ + Mg2+ − SO42− − HCO3−) vs. (Na+ + K+ − Cl−) diagram (Figure 12d) forms a y = −x trend, confirming exchange processes [75]. Cluster-2 plots in the upper-right quadrant (Ca2+ release), whereas Cluster-1 plots near the origin (Na+ release).
The Li–CAI relationships (Figure 12e,f) reveal weak correlation with CAI-I (R2 = 0.35) but a strong positive one with CAI-II (R2 = 0.82), indicating that in high-salinity Cluster-2 waters, reverse exchange enhances Li+ mobilization. Elevated Cl− and ionic strength promote Li+ desorption from clay minerals, increasing its concentration in solution. Similarly, Figure 11b shows that low rNa+/rCl− (<0.87) corresponds to higher Li+ in Cluster-2, whereas higher ratios (>1) in Cluster-1 coincide with lower Li+. Thus, reverse exchange contributes to Li enrichment but acts jointly with temperature-dependent water–rock reactions and enhanced ionic strength.
Overall, in the Xiamen geothermal system, Na+ ↔ Ca2+/Mg2+ exchange governs major-ion chemistry. The strong Li+–CAI-II correlation (R2 = 0.82) confirms that reverse exchange accelerates Li release, while CAI-I (R2 = 0.35) reflects only a minor effect.
4.4. Lithium Sources and End-Member Contributions
Figure 13 illustrates the relationships of Cl–Li and Li/Cl–Cl in geothermal waters and other water types, revealing the origin of Li. All samples deviate significantly from the groundwater–seawater mixing line, and both Li+ concentration and Li/Cl ratio increase with rising Cl− (Figure 13a,b). Theoretical Li concentrations derived from seawater–freshwater mixing (~0.1 mg/L) are much lower than the observed values (0.06–3.29 mg/L), suggesting that Li+ does not primarily originate from seawater but is mainly controlled by rock leaching. Cluster-2 samples plot farther from the mixing line, with Li+ and Li/Cl both increasing alongside Cl−, indicating that although seawater intrusion enhances ionic strength, Li enrichment is dominantly sourced from water–rock interactions. In contrast, Cluster-1 samples plot closer to or along the groundwater–seawater mixing line, showing lower Cl− and Li+ contents, consistent with freshwater-dominated, low-salinity systems where Li release is mainly driven by silicate weathering.
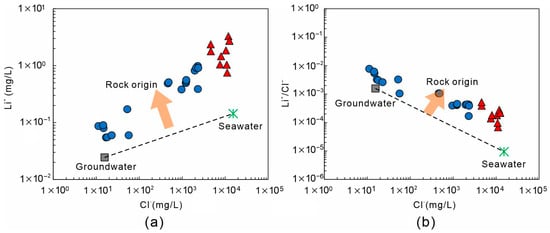
Figure 13.
Li+ source discrimination diagrams for geothermal waters in Xiamen. (a) Li+ − Cl−; (b) Li+/Cl− − Cl−. The symbols are consistent with those used in Figure 5.
Using the measured end-member values , each sample was substituted into the three-end-member mass balance model, and results are summarized in Table 1. The model indicates that seawater and groundwater mixing together account for only 2–45% of the observed Li concentration, while the rock end-member contributes over 55%, reaching up to 97% in some samples. For geothermal waters, only 0.002–0.187 kg of granite leaching per liter is required to reproduce the measured Li concentrations. Typical examples include the Dongshan, Wuyuanwan, and Neian, where calculated Li₍rock₎ values are 2.92, 1.86, and 2.08 mg/L, corresponding to rock leaching rates of 0.187, 0.117, and 0.135 kg/L, respectively.

Table 1.
Contributions of the three end-members (seawater, rock, and groundwater) to lithium in geothermal waters.
4.5. Enrichment Mechanisms of Lithium
Integrating isotopic and hydrochemical evidence with the three-end-member mass balance results (Table 1; Figure 12 and Figure 13), Li enrichment in the Xiamen coastal geothermal system can be interpreted as a coupled mechanism governed by temperature-dependent water–rock leaching, seawater-induced facilitation, reverse cation exchange synergy, and pH modulation.
The mass balance model demonstrates that the rock end-member dominates Li contribution, while the synchronous increase in Cl–Li and Li/Cl–Cl with Cl− indicates that Li primarily originates from silicate mineral leaching within granitic reservoirs under medium- to high-temperature conditions. Seawater, though not a direct Li source, enhances ionic strength and activity, alters diffusive boundary layers, and thereby amplifies leaching and desorption rates, intensifying water–rock interactions (Figure 13).
Under high-salinity conditions, reverse cation exchange (Na+ adsorption − Ca2+/Mg2+ release) shows a strong coupling with elevated Li concentrations (Figure 12), suggesting that ion exchange promotes the desorption and mobilization of Li+ adsorbed on clay mineral surfaces. Meanwhile, pH acts as a regulating factor: relatively low pH enhances acid-promoted leaching and competitive exchange, reducing Li fixation on mineral surfaces and increasing its mobility in fluids, whereas higher pH favors adsorption or incorporation into secondary minerals.
Collectively, these processes—validated by end-member ratios and the conservative behavior of Cl− confirmed through isotopic cross-checking—operate synergistically to define a Source–Facilitation–Synergy–Regulation framework in which leaching, seawater mixing, cation exchange, and pH jointly control Li enrichment in coastal geothermal systems. This mechanism explains the elevated Li concentrations observed in Cluster-2 waters and underscores the integrated effects of temperature, fluid chemistry, and lithology on Li mobilization and accumulation.
In the context of sustainability, the self-organizing map (SOM) classification and the three-end-member mass balance model used in this study play a crucial role in quantifying the sustainable yield of lithium from geothermal systems. By analyzing water–rock interactions and leveraging advanced statistical tools, the study enables a precise assessment of lithium enrichment processes and the contributions of various end-members (seawater, groundwater, and rock dissolution). This methodology provides valuable data for evaluating the sustainable availability of lithium, promoting its environmentally responsible extraction from geothermal resources. Additionally, the findings contribute to sustainability metrics by supporting the use of geothermal energy as a low-carbon, renewable alternative to traditional mining, and facilitating the transition toward a circular economy by recovering valuable metals like lithium with minimal environmental impact.
5. Conclusions
This study systematically investigated the sources and enrichment mechanisms of lithium (Li) in the Xiamen coastal geothermal system using self-organizing map (SOM) classification, hydrochemical and isotopic analyses, and a three-end-member mass balance model. The main conclusions are as follows:
- (1)
- SOM–K-means clustering divides the geothermal waters into two distinct types: inland low-salinity Cluster-1 and coastal high-salinity Cluster-2. The δ2H–δ18O data and Br/Cl ratios indicate that coastal samples are influenced by the mixing of meteoric water and seawater. However, seawater acts mainly as a modifier of ionic composition and chemical evolution, not as a direct Li source.
- (2)
- Temperature, pH, ionic strength, and water–rock interactions jointly influence Li behavior. Elevated temperature promotes the leaching of silicate minerals and the desorption of Li from clays, while relatively low pH enhances Li mobility through acid-promoted reactions. In contrast, high pH conditions favor Li adsorption or incorporation into secondary minerals.
- (3)
- The three-end-member mass balance model reveals that seawater and groundwater mixing explain only 2–45% of the measured Li concentration, whereas rock leaching contributes more than 55%, reaching up to 97% in certain samples. Only 0.002–0.187 kg of granite leaching per liter of geothermal water is required to reproduce the observed Li levels, confirming the dominant contribution of granitic reservoirs.
- (4)
- Li enrichment in the Xiamen geothermal system is governed by a Source–Facilitation–Synergy–Regulation framework in which temperature-dependent rock leaching provides the Li source; seawater mixing enhances ionic strength and reaction kinetics; reverse cation exchange (Na+ adsorption–Ca2+/Mg2+ release) promotes Li desorption; and pH regulates the balance between mobilization and adsorption. Together, these processes explain the high Li concentrations observed in Cluster-2 geothermal waters and provide a quantitative understanding of Li behavior and resource potential in coastal geothermal environments.
The methods used in this study provide a quantitative framework for assessing the sustainability of lithium extraction from geothermal fluids, contributing to more efficient and environmentally friendly resource management in geothermal provinces. By highlighting the role of temperature, pH, and seawater mixing in lithium mobilization, our findings support the development of sustainability strategies for lithium extraction that align with global goals for clean energy transitions and resource conservation.
Although the study provides valuable insights into lithium sources and enrichment in the Xiamen coastal geothermal system, it has limitations. The lack of lithium (Li) and strontium (Sr) isotopic analyses restricts the ability to fully trace lithium sources. Future research incorporating these isotopes will improve the model’s accuracy and provide a more detailed understanding of lithium origins, especially in systems with multiple contributing end-members.
Author Contributions
Conceptualization, S.W., Y.F., G.W. and W.Z.; data curation, S.W.; formal analysis, S.W. and X.Y.; funding acquisition, W.Z. and G.W.; investigation, S.W., L.L., R.Y. and F.L.; methodology, S.W. and X.Y.; software, S.W. and X.Y.; writing—original draft, S.W.; writing—review and editing, W.Z., R.Y. and Y.F. All authors have read and agreed to the published version of the manuscript.
Funding
This research was funded by the Xiamen Natural Science Foundation (No.3502Z202372111), the China Geological Survey project (DD20221676-1; DD20230501001), the National Key Research and Development Program of China (2021YFC2901905), the Guizhou Province Talent Base Project (No. RCJD2018-21), and Basic Research Fees of the Institute of Hydrogeology and Environmental Geology, Chinese Academy of Geological Sciences (No. SK202212).
Institutional Review Board Statement
Not applicable.
Informed Consent Statement
Not applicable.
Data Availability Statement
The data presented in this study are available upon request from the corresponding author.
Conflicts of Interest
The authors declare no conflicts of interest.
Appendix A
Table A1.
Hydrochemical characteristics of groundwater in Xiamen.
Table A1.
Hydrochemical characteristics of groundwater in Xiamen.
| Sampling Site | Type | Cluster | T (°C) | pH | TDS (mg/L) | Na+ (mg/L) | K+ (mg/L) |
| Yijia (2) | Geothermal water | Cluster-1 | 47.0–48.0 (47.5) | 8.35–8.90 (8.62) | 231.63–306.69 (269.16) | 72.65–85.17 (78.91) | 1.36–1.51 (1.44) |
| Dongtang (1) | Geothermal water | Cluster-1 | 37.6 | 7.1 | 279.59 | 86 | 1.71 |
| Dongfu (4) | Geothermal water | Cluster-1 | 76.0–80.0 (77.8) | 6.90–7.92 (7.38) | 3575.30–4551.03 (4055.33) | 828.40–995.81 (916.28) | 33.44–70.59 (48.68) |
| Dongshan (3) | Geothermal water | Cluster-2 | 52.9–70.0 (63.7) | 6.55–7.01 (6.79) | 20,740.00–21,092.93 (20,957.53) | 4595.07–5106.00 (4785.07) | 193.22–211.00 (201.67) |
| Wuyuanwan (1) | Geothermal water | Cluster-2 | 53.6 | 6.9 | 17,572.29 | 4322.04 | 127.02 |
| Neian (2) | Geothermal water | Cluster-2 | 47.0–47.0 (47.0) | 6.80–6.92 (6.86) | 7816.00–7951.11 (7883.56) | 1758.00–1832.01 (1795.00) | 59.88–61.60 (60.74) |
| Fengnan (4) | Geothermal water | Cluster-1 | 44.0–62.0 (54.3) | 6.64–7.23 (6.92) | 1797.29–2346.00 (2178.26) | 491.30–628.00 (574.38) | 11.47–15.94 (13.62) |
| Houpu (3) | Geothermal water | Cluster-1 | 44.5–48.0 (46.7) | 8.46–9.00 (8.67) | 283.25–406.35 (341.20) | 100.70–110.81 (105.17) | 1.43–1.63 (1.56) |
| Houxi (1) | Geothermal water | Cluster-1 | 63 | 7.55 | 4284 | 1094 | 30.02 |
| Kunzeyang (1) | Geothermal water | Cluster-1 | 45.5 | 7.6 | 338.13 | 111.8 | 2.81 |
| Dadeng (1) | Geothermal water | Cluster-2 | 45 | 6.89 | 18,570.95 | 4674.06 | 134.28 |
| Xinglinwan (2) | Geothermal water | Cluster-2 | 80.2–88.9 (84.5) | 6.68–7.00 (6.84) | 13,713.54–14,030.00 (13,871.77) | 3520.03–3602.00 (3561.02) | 95.30–97.10 (96.20) |
| Tangli (1) | Geothermal water | Cluster-1 | 48.5 | 7.2 | 334.79 | 99.17 | 5.72 |
| Hongtang (1) | Geothermal water | Cluster-1 | 51.7 | 7.2 | 1032.47 | 331.5 | 8.62 |
| Yuangdanghu (1) | Geothermal water | Cluster-2 | 38.2 | 6.6 | 19,350.64 | 4042.05 | 86.42 |
| Unnamed (1) | Geothermal water | Cluster-1 | 48.3 | 7.3 | 1082.84 | 356.1 | 8.76 |
| All Geothermal water (29) | Geothermal water | 37.6–88.9 (56.86) | 6.55–9 (7.33) | 231.63–21,092.93 (6749.15) | 72.65–5106 (1607.58) | 1.36–211 (54.52) | |
| Xiamenwan (1) | Sea water | 25 | 7.64 | 28,260 | 8659 | 324 | |
| Cold Groundwater (2) | Groundwater | 25–25.1 (25.05) | 6.9–7.92 (7.41) | 186–251 (218.5) | 17.33–58.59 (37.96) | 0.71–2.39 (1.55) | |
| Dongshan rock (1) | Rock | / | / | / | / | / | |
| Sampling Site | Ca2+ (mg/L) | Mg2+ (mg/L) | HCO3− (mg/L) | SO42− (mg/L) | Cl− (mg/L) | Br− (mg/L) | Li+ (mg/L) |
| Yijia (2) | 2.84–3.33 (3.08) | 0.08–0.25 (0.16) | 73.22–79.22 (76.22) | 47.38–55.77 (51.58) | 14.43–14.67 (14.55) | 0.01–0.03 (0.02) | 0.08–0.09 (0.08) |
| Dongtang (1) | 16.43 | 0.47 | 88.47 | 69 | 56.58 | 0.01 | 0.06 |
| Dongfu (4) | 481.60–576.18 (518.67) | 0.10–2.30 (1.24) | 33.40–48.81 (42.08) | 216.20–493.22 (294.06) | 1947.02–2344.09 (2170.28) | 6.25–8.01 (7.03) | 0.82–0.99 (0.91) |
| Dongshan(3) | 2813.02–2907.83 (2866.28) | 51.00–71.48 (59.13) | 43.90–48.81 (45.70) | 365.00–706.50 (506.30) | 11,837.00–12,522.07 (12,280.10) | 40.25–49.17 (44.31) | 2.73–3.29 (2.92) |
| Wuyuanwan (1) | 1872.12 | 117.8 | 84.81 | 609.4 | 10,374.15 | 38.69 | 1.86 |
| Neian (2) | 1017.00–1057.00 (1037.00) | 2.90–4.17 (3.54) | 31.10–36.61 (33.86) | 239.00–297.00 (268.00) | 4593.00–4628.00 (4610.50) | 15.20–16.51 (15.86) | 1.79–2.37 (2.08) |
| Fengnan (4) | 184.60–247.74 (224.96) | 0.10–4.61 (1.41) | 30.50–40.88 (34.14) | 114.00–185.68 (140.00) | 957.02–1234.32 (1157.10) | 2.95–4.80 (3.99) | 0.38–0.56 (0.49) |
| Houpu (3) | 4.40–5.80 (5.28) | 0.05–0.35 (0.22) | 55.53–88.57 (76.47) | 92.40–100.60 (96.46) | 16.77–22.70 (19.12) | 0.01–0.06 (0.04) | 0.06–0.06 (0.06) |
| Houxi (1) | 366.5 | 58.13 | 121.4 | 289.4 | 2300 | 8.35 | 0.39 |
| Kunzeyang (1) | 14.81 | 0.26 | 141.6 | 73.82 | 52.39 | 0.01 | 0.17 |
| Dadeng (1) | 2248.39 | 138.19 | 51.43 | 397.4 | 10,854.2 | 40.8 | 1.04 |
| Xinglinwan (2) | 1405.00–1413.21 (1409.10) | 129.40–133.00 (131.20) | 64.00–67.12 (65.56) | 518.00–690.10 (604.05) | 7545.23–8005.00 (7775.12) | 27.03–27.20 (27.12) | 1.05–1.46 (1.26) |
| Tangli (1) | 16.16 | 1.9 | 109.8 | 135.6 | 11.18 | 0.01 | 0.09 |
| Hongtang (1) | 53.87 | 0.23 | 103.7 | 107.8 | 459.3 | 1.17 | 0.49 |
| Yuangdanghu (1) | 2940.04 | 184.5 | 45.76 | 865.5 | 11,090.04 | 35.28 | 0.75 |
| Unnamed (1) | 57.46 | 0.13 | 97.63 | 112.6 | 480.3 | 1.5 | 0.51 |
| All Geothermal water (29) | 2.84–2940.04 (830.12) | 0.05–184.5 (33.1) | 30.5–141.6 (64.39) | 47.38–865.5 (277.66) | 11.18–12,522.07 (3816.75) | 0.01–49.17 (13.41) | 0.055–3.294 (0.92) |
| Xiamenwan (1) | 329 | 1055 | 140 | 2226 | 15,311 | 56.1 | 0.144 |
| Cold Groundwater (2) | 25.83–29.31 (27.57) | 0.54–4.06 (2.3) | 122–140.3 (131.15) | 6.48–33.49 (19.99) | 9.43–21.66 (15.55) | 0.1–0.1 (0.1) | 0.007–0.042 (0.0245) |
| Dongshan rock (1) | / | / | / | / | / | / | 15 |
| Sampling Site | F− (mg/L) | SiO2 (mg/L) | CO32− (mg/L) | NO3− (mg/L) | Br/Cl | Reference | |
| Yijia (2) | 12.44–12.89 (12.66) | 70.00–73.19 (71.60) | 11.64 | 4.11 | 0.0007–0.0021 (0.0014) | [21,38] | |
| Dongtang (1) | 4.72 | 49.26 | <0.01 | <0.01 | 0.0002 | [21] | |
| Dongfu (4) | 2.91–3.39 (3.25) | 77.80–100.80 (86.71) | 0 | <0.2 | 0.0027–0.0038 (0.0033) | [21,36,40] | |
| Dongshan (3) | 2.09–4.07 (2.88) | 73.63–98.88 (87.50) | 0 | 205.2 | 0.0032–0.0039 (0.0036) | [21,39], This study | |
| Wuyuanwan (1) | 0.29 | 79.07 | <0.01 | 6.82 | 0.0037 | [21] | |
| Neian (2) | 2.55–2.67 (2.61) | 83.08–84.65 (83.86) | <0.01 | <0.01 | 0.0033–0.0036 (0.0034) | [21], This study | |
| Fengnan (4) | 3.85–4.19 (3.97) | 57.92–72.22 (64.15) | <0.01 | <0.01 | 0.0031–0.0039 (0.0034) | [21,24,35], This study | |
| Houpu (3) | 11.50–13.06 (12.52) | 58.31–65.25 (60.72) | 11.74 | <0.2 | 0.0006–0.0036 (0.0021) | [21,37], This study | |
| Houxi (1) | 2.69 | 74.73 | 0 | / | 0.0036 | [34] | |
| Kunzeyang (1) | 8.03 | 56.32 | <0.01 | 2.83 | 0.0002 | [21] | |
| Dadeng (1) | 3 | 76.54 | 0 | <0.2 | 0.0038 | [33] | |
| Xinglinwan (2) | 2.65–4.45 (3.55) | 100.00–106.52 (103.26) | <0.01 | 218 | 0.0034–0.0036 (0.0035) | [21], This study | |
| Tangli (1) | 7.98 | 114.25 | <0.01 | 1.68 | 0.0009 | [21] | |
| Hongtang (1) | 5.21 | 75.39 | <0.01 | 10.93 | 0.0025 | [21] | |
| Yuangdanghu (1) | 1.3 | 65.92 | <0.01 | 7.23 | 0.0032 | [21] | |
| Unnamed (1) | 5.64 | 74.5 | <0.01 | 9.43 | 0.0031 | [21,24] | |
| All Geothermal water (29) | 0.29–13.06 (5.23) | 49.26–114.25 (76.95) | / | / | / | ||
| Xiamenwan (1) | 0.024 | 2.92 | <5 | 0.91 | 0.0037 | This study | |
| Cold Groundwater (2) | / | 37.85–45.41 (41.63) | / | / | / | [24] | |
| Dongshan rock (1) | / | / | / | / | / | This study | |
Note: the number of samples for each sampling site is given in parentheses, while values in parentheses within the table represent mean concentrations. The symbol “/” indicates data that were not measured.
References
- Han, S.; Ma, Z.; Liu, M.; Yang, X.; Wang, X. Global supply sustainability assessment of critical metals for clean energy technology. Resour. Policy 2023, 85, 103994. [Google Scholar] [CrossRef]
- Liu, M.; Kong, Y.; Guo, Q. Sources and enrichment mechanisms of lithium, rubidium, and cesium in waters of magmatic–hydrothermal systems. Earth-Sci. Rev. 2025, 270, 105241. [Google Scholar] [CrossRef]
- Pan, S.; Zhao, P.; Zhang, H.; Yang, Z.; Li, Y.; Yue, Y.; Liu, X.; Gao, S.; Sun, Y.; Dor, J. Hydrogeochemical mechanism of Li–Cs-rich thermal springs in the Karakoram Fault, Qinghai–Xizang Plateau: New insights from multiple stable isotopes. Sci. Total Environ. 2025, 958, 178083. [Google Scholar] [CrossRef]
- Flexer, V.; Baspineiro, C.F.; Galli, C.I. Lithium recovery from brines: A vital raw material for green energies with potential environmental impacts in its mining and processing. Sci. Total Environ. 2018, 639, 1188–1204. [Google Scholar] [CrossRef] [PubMed]
- Kesler, S.E.; Gruber, P.W.; Medina, P.A.; Keoleian, G.A.; Everson, M.P.; Wallington, T.J. Global lithium resources: Relative importance of pegmatite, brine, and other deposits. Ore Geol. Rev. 2012, 48, 55–69. [Google Scholar] [CrossRef]
- Kölbel, L.; Kölbel, T.; Herrmann, L.; Kaymakci, E.; Ghergut, I.; Poirel, A.; Schneider, J. Lithium extraction from geothermal brines in the Upper Rhine Graben: A case study of potential and current state of the art. Hydrometallurgy 2023, 221, 106131. [Google Scholar] [CrossRef]
- Sajkowski, L.; Turnbull, R.; Blundy, J.; Rogers, K. Experimental assessment of sustainable lithium extraction from geothermal reservoirs. Geothermics 2025, 132, 103448. [Google Scholar] [CrossRef]
- Sajkowski, L.; Turnbull, R.; Rogers, K. A review of critical element concentrations in high-enthalpy geothermal fluids in New Zealand. Resources 2023, 12, 68. [Google Scholar] [CrossRef]
- Dobson, P.; Araya, N.; Brounce, M.; Busse, M.M.; Camarillo, M.K.; English, L.; Humphreys, J.; Kalderon-Asael, B.; McKibben, M.A.; Millstein, D. Characterizing the Geothermal Lithium Resource at the Salton Sea; Lawrence Berkeley National Laboratory (LBNL): Berkeley, CA, USA, 2023. [Google Scholar]
- Sanjuan, B.; Gourcerol, B.; Millot, R.; Rettenmaier, D.; Jeandel, E.; Rombaut, A. Lithium-rich geothermal brines in Europe: An update on geochemical characteristics and implications for potential Li resources. Geothermics 2022, 101, 102385. [Google Scholar] [CrossRef]
- Cullen, J.T.; Hurwitz, S.; Barnes, J.D.; Lassiter, J.C.; Penniston-Dorland, S.; Kasemann, S.A.; Thordsen, J.J. Temperature-dependent variations in mineralogy, major element chemistry and the stable isotopes of boron, lithium and chlorine resulting from hydration of rhyolite: Constraints from hydrothermal experiments at 150–350 °C and 25 MPa. Geochim. Cosmochim. Acta 2019, 261, 269–287. [Google Scholar] [CrossRef]
- Wang, W.; Jiang, S.Y.; Xiao, Y. Fluid–rock interaction effects on Li isotope behavior in continental geothermal systems. Chem. Geol. 2023, 631, 121525. [Google Scholar] [CrossRef]
- Millot, R.; Hegan, A.; Négrel, P. Geothermal waters from the Taupo Volcanic Zone, New Zealand: Li, B and Sr isotopes characterization. Appl. Geochem. 2012, 27, 677–688. [Google Scholar] [CrossRef]
- Bernal, N.F.; Gleeson, S.A.; Dean, A.S.; Liu, X.-M.; Hoskin, P. The source of halogens in geothermal fluids from the Taupo Volcanic Zone, North Island, New Zealand. Geochim. Cosmochim. Acta 2014, 126, 265–283. [Google Scholar] [CrossRef]
- Tan, H.; Shi, Z.; Cong, P.; Xue, F.; Chen, G. The spatial distribution law of B, Li, Rb and Cs elements and supernormal enrichment mechanism in Tibet geothermal system. Sediment. Geol. Tethyan Geol. 2023, 43, 404–415. [Google Scholar] [CrossRef]
- Liu, Y.; Liu, W.; Zhang, M.; Xie, X.G.; Chen, B.; Dan, Z.; Ellam, R.M.; Xu, S. Assessing magmatic contributions to rift-related geothermal systems in collisional orogens: Insights from the Sangri–Cona rift, southern Tibetan Plateau. J. Asian Earth Sci. 2024, 270, 106193. [Google Scholar] [CrossRef]
- Liu, C.L.; Lu, C.M.; Li, Y.S.; Hao, Q.C.; Cao, S.W. Genetic model and exploration target area of geothermal resources in Hongtang Area, Xiamen, China. J. Groundw. Sci. Eng. 2022, 10, 128. [Google Scholar] [CrossRef]
- Gan, H.N.; Lin, W.J.; Yue, G.F.; Wang, X.; Ma, F.; Wang, G.L. Research on the fault-controlling mechanism of geothermal water in Zhangzhou Basin. J. Groundw. Sci. Eng. 2017, 5, 19–28. [Google Scholar] [CrossRef]
- Wei, Z.A.; Shao, H.; Tang, L.; Deng, B.; Li, H.; Wang, C. Hydrogeochemistry and geothermometry of geothermal waters from the Pearl River Delta region, South China. Geothermics 2021, 96, 102164. [Google Scholar] [CrossRef]
- Yuan, J.; Xu, F.; Zheng, T. The genesis of saline geothermal groundwater in the coastal area of Guangdong Province: Insight from hydrochemical and isotopic analysis. J. Hydrol. 2022, 605, 127345. [Google Scholar] [CrossRef]
- Li, J.; Liu, C.; Cao, S.; Lin, X.; Ma, Q.; Li, Y. Multi-isotope characteristics and residence time of saline geothermal waters in the coastal area of Xiamen Bay, Southeast China. J. Hydrol. Reg. Stud. 2025, 59, 102363. [Google Scholar] [CrossRef]
- Arrofi, D.; Abu-Mahfouz, I.S.; Prayudi, S.D. Lithium enrichment in high-enthalpy geothermal systems influenced by seawater, Indonesia. Sci. Rep. 2024, 14, 24093. [Google Scholar] [CrossRef] [PubMed]
- Wei, S.; Zhang, W.; Fu, Y.; Liu, F.; Yuan, R.; Yan, X.; Liao, Y.; Wang, G. Distribution characteristics and resource potential evaluation of lithium in geothermal water in China. Geol. China 2024, 51, 1527–1553. [Google Scholar] [CrossRef]
- Li, Y.; Liu, C.; Cao, S.; Miao, Q.; Dong, Y.; Jiang, Z. Br/Cl ratio, Zn and radon constraints on the origin and fate of geothermal fluids in the coastal region of southeastern China. Hydrogeol. J. 2021, 29, 2211–2218. [Google Scholar] [CrossRef]
- Dotsika, E. Isotope and hydrochemical assessment of the Samothraki Island geothermal area, Greece. J. Volcanol. Geotherm. Res. 2012, 233–234, 18–26. [Google Scholar] [CrossRef]
- Toupal, J.; Zhu, C.; Zaccarini, F.; Vigliaturo, R.; Servetto, G.P.; Gieré, R. Experimental leaching of lithium ores in simulated environmental conditions. Geochemistry 2024, 84, 126132. [Google Scholar] [CrossRef]
- Siregar, R.N.; Sismanto, S.; Triyana, K.; Harijoko, A.; Iqbal, M.; Antarnusa, G.; Putra, F.G.; Umam, R. Lithium enrichment in high radiogenic geothermal systems originating from lithospheric water due to water-rock interactions. Geothermics 2026, 134, 103499. [Google Scholar] [CrossRef]
- Gilder, S.A.; Gill, J.; Coe, R.S.; Zhao, X.; Liu, Z.; Wang, G.; Yuan, K.; Liu, W.; Kuang, G.; Wu, H. Isotopic and paleomagnetic constraints on the Mesozoic tectonic evolution of South China. J. Geophys. Res. Solid Earth 1996, 101, 16137–16154. [Google Scholar] [CrossRef]
- Lin, W.; Chen, X.; Gan, H.; Yue, G. Geothermal, geological characteristics and exploration of hot dry rock in the Xiamen bay–Zhangzhou Basin, southeast China. Acta Geol. Sin. 2020, 94, 2066–2077. [Google Scholar] [CrossRef]
- Zhang, J.; Wang, B.; Tang, X.; Dong, M.; Ai, Y. Temperature structure and dynamic background of crust and mantle beneath the high heat flow area of the South China continental margin. Chin. J. Geophys. 2018, 61, 3917–3932. [Google Scholar] [CrossRef]
- Liu, C.; Li, Y.; Cao, S.; Wang, W.; Li, J. Effects of seawater recharge on the formation of geothermal resources in coastal areas: A case study of Xiamen City, Fujian Province, China. Front. Earth Sci. 2022, 10, 872620. [Google Scholar] [CrossRef]
- Liu, C.L.; Zheng, J.H.; Li, Z.H.; Li, Y.S.; Hao, Q.C.; Li, J.F. Analysis of water resources supply and demand in small and medium-sized river basin cities along the southeast coast of China: A case study of Xiamen. J. Groundw. Sci. Eng. 2021, 9, 350. [Google Scholar] [CrossRef]
- Dai, J.J.; Zheng, J.; Chen, X.H.; Zheng, Y.C.; Lin, D.T.; Huang, J.M. Pre-Feasibility Study Report on the Underground Hot Water Resources in Dadeng Mining Area, Xiang’an District, Xiamen City, Fujian Province; National Geological Archives of China: Beijing, China, 2012. [Google Scholar]
- Zheng, J.; Guan, Z.Q.; Huang, J.M.; Zheng, Y.C. Investigation and Evaluation Report on Geothermal Resources in Xiamen Area, Fujian Province; National Geological Archives of China: Beijing, China, 2015. [Google Scholar]
- Zheng, J.; Huang, J.M. Feasibility Study Report on Underground Hot Water Resources in Fennan Farm Mining Area, Tong’an District, Xiamen City, Fujian Province; National Geological Archives of China: Beijing, China, 2012. [Google Scholar]
- Zheng, J.; Wang, W.T. Feasibility Study Report on Geothermal Resources in Dongfu Mining Area (Expanded Scope), Haicang District, Xiamen City, Fujian Province; National Geological Archives of China: Beijing, China, 2016. [Google Scholar]
- Zheng, J.; Chen, X.H.; Dai, J.J.; Lu, L.B.; Huang, J.M.; Zheng, Y.C.; Lin, D.T. Feasibility Study Report on Underground Hot Water Resources in Houpu Mining Area, Tong’an District, Xiamen City, Fujian Province; National Geological Archives of China: Beijing, China, 2012. [Google Scholar]
- Huang, J.M.; Chen, X.H.; Zheng, Y.C.; Lu, L.B.; Lin, D.T.; Zheng, J.; Dai, J.J. Feasibility Study Report on Underground Hot Water Resources in Yijia Mining Area, Tong’an District, Xiamen City, Fujian Province; National Geological Archives of China: Beijing, China, 2012. [Google Scholar]
- Zheng, Y.C.; Lin, D.T.; Chen, X.H.; Huang, J.M.; Dai, J.J.; Zheng, J.; Lu, L.B. Exploration Report on Underground Hot Water Resources in Dongshan Area, Xiang’an District, Xiamen City, Fujian Province; National Geological Archives of China: Beijing, China, 2008. [Google Scholar]
- Zheng, J.; Huang, J.M. Exploration Report on Underground Hot Water Resources in Dongyao Area, Haicang District, Xiamen City, Fujian Province; National Geological Archives of China: Beijing, China, 2010. [Google Scholar]
- GB/T 14506.30-2010; Methods for chemical analysis of silicate rocks—Part 30: Determination of 44 Elements. Standards Press of China: Beijing, China, 2010.
- HJ 776-2015; Water Quality—Determination of 32 Elements—Inductively Coupled Plasma Optical Emission Spectrometry. Ministry of Environmental Protection of the People’s Republic of China: Beijing, China, 2015.
- HJ 84-2016; Water Quality-Determination of Inorganic Anions (F−, Cl−, NO2−, Br−, NO3−, PO43−, SO32−, SO42−)-Ion Chromatography. Ministry of Environmental Protection of the People’s Republic of China: Beijing, China, 2016.
- DZ/T 0064.49-2021; Methods for Analysis of Groundwater Quality—Part 49: Determination of Carbonate, Bicarbonate Ions, Hydroxy—Titration. Ministry of Natural Resources of the People’s Republic of China: Beijing, China, 2021.
- DZ/T 0064.62-2021; Methods for Analysis of Groundwater Quality—Part 62: Determination of Silicic Acid—Silicon Molybdenum Yellow Spectrophotometry. Ministry of Natural Resources of the People’s Republic of China: Beijing, China, 2021.
- JCZX-BZ-002-2015; Determination of Hydrogen and Oxygen Isotopes in Water by Spectroscopy. Ministry of Industry and Information Technology of the People’s Republic of China: Beijing, China, 2015.
- Mao, H.; Wang, G.; Rao, Z.; Liao, F.; Shi, Z.; Huang, X.; Chen, X.; Yang, Y. Deciphering spatial patterns of groundwater chemistry and nitrogen pollution in the Poyang Lake Basin (eastern China) using self-organizing maps and multivariate statistics. J. Clean. Prod. 2021, 329, 129697. [Google Scholar] [CrossRef]
- Kohonen, T. Self-organized formation of topologically correct feature maps. Biol. Cybern. 1982, 43, 59–69. [Google Scholar] [CrossRef]
- Zhuang, S.; Wang, G.; Zhou, X.; Shi, Z.; Yuan, D.; Tian, J.; He, M.; Zeng, Z.; Yan, Y.; Yao, B.; et al. Deciphering the distribution and enrichment of arsenic in geothermal water in the Red River Fault Zone, southwest China. J. Hazard. Mater. 2025, 485, 136756. [Google Scholar] [CrossRef]
- Zeng, Z.; Yang, L.; Cui, Y.; Zhou, X.; He, M.; Wang, Y.; Yan, Y.; Yao, B.; Hu, X.; Shao, W.; et al. Assessment of geothermal waters in Yunnan, China: Distribution, quality and driving factors. Geothermics 2025, 130, 103323. [Google Scholar] [CrossRef]
- Vesanto, J.; Alhoniemi, E. Clustering of the self-organizing map. IEEE Trans. Neural Netw. 2000, 11, 586–600. [Google Scholar] [CrossRef]
- Céréghino, R.; Park, Y.-S. Review of the self-organizing map (SOM) approach in water resources: Commentary. Environ. Model. Softw. 2009, 24, 945–947. [Google Scholar] [CrossRef]
- Davies, D.L.; Bouldin, D.W. A cluster separation measure. IEEE Trans. Pattern Anal. Mach. Intell. 2009, PAMI-1, 224–227. [Google Scholar] [CrossRef]
- Craig, H. Isotopic variations in meteoric waters. Science 1961, 133, 1702–1703. [Google Scholar] [CrossRef]
- Chen, Y.; Du, W.; Chen, J.; Xu, L. Composition of hydrogen and oxygen isotopic of precipitation and source apportionment of water vapor in Xiamen Area. Acta Sci. Circumstantiae 2016, 36, 667–674. [Google Scholar] [CrossRef]
- Sheng, D. Chronology and Geochemistry of Intermediate Dikes Host Granitoids and Enclaves in the Xiamen-Zhangzhou Area. Master’s Thesis, China University of Geosciences (Beijing), Beijing, China, 2012. [Google Scholar]
- Scholler, H. Qualitative evaluation of groundwater resources: Methods and techniques of groundwater investigation and development. Water Resour. Ser. 1967, 33, 44–52. [Google Scholar]
- Gibbs, R.J. Mechanisms controlling world water chemistry. Science 1970, 170, 1088–1090. [Google Scholar] [CrossRef] [PubMed]
- Rahman, A.T.M.S.; Kono, Y.; Hosono, T. Self-organizing map improves understanding of hydrochemical processes in aquifer systems. Sci. Total Environ. 2022, 846, 157281. [Google Scholar] [CrossRef] [PubMed]
- Cai, M.; Huang, Y.; Chen, M.; Liu, G.; Jin, D. The study of hydrogen and oxygen isotopes of coastal groundwater in Xiamen Island. Mar. Sci. 2003, 27, 1–6. [Google Scholar] [CrossRef]
- Zhang, X.; Zhao, J.; Li, Y.; An, D.; Cheng, H.; Ma, Y.; Song, H. Mineral phase transformation and leaching behavior during the roasting–acid–leaching process of clay-type lithium ore in the Qaidam Basin. Minerals 2025, 15, 777. [Google Scholar] [CrossRef]
- Dugamin, E.J.M.; Cathelineau, M.; Boiron, M.-C.; Richard, A.; Despinois, F. Lithium enrichment processes in sedimentary formation waters. Chem. Geol. 2023, 635, 121626. [Google Scholar] [CrossRef]
- Li, J.; Zhang, H.; Zhang, Y.; Wang, L.; Zhang, Z. Enrichment mechanism of lithium in geothermal waters from a bedrock reservoir in Xiong’an New Area, China. Water 2023, 15, 3518. [Google Scholar] [CrossRef]
- Arnórsson, S. Chemical equilibria in Icelandic geothermal systems—Implications for chemical geothermometry investigations. Geothermics 1983, 12, 119–128. [Google Scholar] [CrossRef]
- Fournier, R.O. Chemical geothermometers and mixing models for geothermal systems. Geothermics 1977, 5, 41–50. [Google Scholar] [CrossRef]
- Giggenbach, W.F. Geothermal solute equilibria: Derivation of Na-K-Mg-Ca geoindicators. Geochim. Cosmochim. Acta 1988, 52, 2749–2765. [Google Scholar] [CrossRef]
- Fournier, R.O. A revised equation for the Na/K geothermometer. Trans. Geotherm. Resour. Counc. 1979, 3, 221–224. [Google Scholar]
- Fournier, R.O.; Truesdell, A.H. An empirical Na-K-Ca geothermometer for natural waters. Geochim. Cosmochim. Acta 1973, 37, 1255–1275. [Google Scholar] [CrossRef]
- Marandi, A.; Shand, P. Groundwater chemistry and the Gibbs diagram. Appl. Geochem. 2018, 97, 209–212. [Google Scholar] [CrossRef]
- Wei, Z.; Huang, S.; Xu, J.; Yuan, C.; Zhang, M.; Wang, C. Geochemical evolution of geothermal waters in the Pearl River Delta region, South China: Insights from water chemistry and isotope geochemistry. J. Hydrol. Reg. Stud. 2024, 51, 101670. [Google Scholar] [CrossRef]
- Eid, M.H.; Pinjung, Z.; Mikita, V.; Bence, C.; Szűcs, P. A novel integration of self-organizing maps and NETPATH inverse modeling to trace uranium and toxic metal contamination risks in West Mecsek, Hungary. J. Hazard. Mater. 2025, 496, 139291. [Google Scholar] [CrossRef]
- Shoedarto, R.M.; Tada, Y.; Kashiwaya, K.; Koike, K.; Iskandar, I. Advanced characterization of hydrothermal flows within recharge and discharge areas using rare earth elements: A case study of a two-phase reservoir geothermal field in southern Bandung, West Java, Indonesia. Geothermics 2022, 105, 102507. [Google Scholar] [CrossRef]
- Zhang, S.; Liu, K.; Yu, C.; Deng, Y.; Zhang, Y.; Jia, W. Identifying the genetic mechanism of medium–low-temperature fluoride-enriched geothermal groundwater by the self-organizing map and evaluating health risk in the Wugongshan area, southeast China. Environ. Geochem. Health 2024, 46, 274. [Google Scholar] [CrossRef]
- Yan, Y.; Zhang, Y.; Yang, S.; Wei, D.; Zhang, J.; Li, Q.; Yao, R.; Wu, X.; Wang, Y. Optimized groundwater quality evaluation using unsupervised machine learning, game theory, and Monte-Carlo simulation. J. Environ. Manag. 2024, 371, 122902. [Google Scholar] [CrossRef]
- Marrugo-Negrete, J.; Paternina-Uribe, R.; Enamorado-Montes, G.; Herrera-Arango, J.; Rosso-Pinto, M.; Ospino-Contreras, J.; Pinedo-Hernández, J. Groundwater quality assessment in the La Mojana region of northern Colombia: Implications for consumption, irrigation, and human health risks. Appl. Water Sci. 2024, 14, 96. [Google Scholar] [CrossRef]
Disclaimer/Publisher’s Note: The statements, opinions and data contained in all publications are solely those of the individual author(s) and contributor(s) and not of MDPI and/or the editor(s). MDPI and/or the editor(s) disclaim responsibility for any injury to people or property resulting from any ideas, methods, instructions or products referred to in the content. |
© 2025 by the authors. Licensee MDPI, Basel, Switzerland. This article is an open access article distributed under the terms and conditions of the Creative Commons Attribution (CC BY) license (https://creativecommons.org/licenses/by/4.0/).