Abstract
To address the limitations of low model accuracy and single-scenario settings in traditional rainfall-induced landslide hazard assessments, this study focuses on Yongren County, Yunnan Province—a region where landslides pose significant threats to sustainable socio-economic development and infrastructure resilience. Eight controlling factors—lithology, slope, terrain relief, distances to faults, rivers, and roads, vegetation coverage, and elevation—were used to build a landslide susceptibility index system. Three internationally recognized machine learning models, Random Forest (RF), Support Vector Machine (SVM), and Extreme Gradient Boosting (XGBoost), were applied for comparison. The XGBoost model was further coupled with rainfall scenario analysis, simulating three rainfall scenarios—normal, 10-year, and 20-year return periods—to form a framework integrating “high-precision susceptibility prediction–multi-scenario rainfall driving–dynamic hazard assessment.” Results show that XGBoost achieved the highest accuracy and stability, with AUC and overall accuracy exceeding those of RF and SVM, supporting high-precision multi-scenario simulations. High-hazard zones expanded from road-disturbed areas under normal rainfall to riverbanks under 10-year rainfall and to fault-fracture and road–river interaction zones under 20-year rainfall. This study provides a transferable framework for sustainable landslide risk management, enabling precision prevention, optimizing resource allocation for disaster risk reduction, and supporting evidence-based policy-making for sustainable development and climate adaptation in similar geological settings.
1. Introduction
Landslides, as one of the most devastating types of geological disasters globally, frequently result in significant loss of life and property, making hazard zonation a fundamental aspect of disaster prevention and mitigation studies [1]. In China, due to the complex geological structures and the significant influence of the monsoon climate, rainfall represents the primary trigger for most landslide events [2]. Statistical data show that between 2019 and 2021, landslides accounted for 60.5% of all geological disasters in China, and nearly 80% of them were directly linked to this mechanism [1]. Yongren County in Yunnan Province is characterized by complex geological structures, highly variable topography, and significant spatiotemporal variations in rainfall, making it an archetypal region susceptible to such events. However, conventional hazard assessments are often constrained by low predictive accuracy and single-scenario limitations, hindering precise disaster prevention. To overcome these challenges, this study proposes an integrated framework that couples multi-scenario rainfall simulations with an optimized XGBoost model, enabling dynamic and high-precision hazard zonation. This approach is particularly suitable for capturing the substantial variations in landslide distribution and magnitude across different rainfall conditions, reflecting the coupled relationship between rainfall and landslide processes. Therefore, conducting hazard zonation of rainfall-induced landslides constitutes a cornerstone within disaster risk reduction frameworks [3,4].
Traditional methods for landslide hazard assessment have certain limitations. Physically based models can effectively represent the mechanisms of landslide formation; however, they are computationally expensive and suffer from high parameter uncertainty when applied at regional scales [5]. Qualitative and statistical approaches based on expert judgment-such as the frequency ratio, information value, and logistic regression models-provide preliminary assessment frameworks but are easily influenced by subjectivity and fail to capture complex nonlinear relationships, leading to limited accuracy in hazard zonation [6]. In addition, some early landslide prediction models that integrated Geographic Information Systems (GIS) with ordinal-scale relative weighting techniques could perform hazard mapping but still faced challenges in data diversity and accuracy [7].
With the rapid development of geographic information and computational technologies, machine learning (ML) and deep learning (DL) methods have been increasingly applied to landslide hazard assessment [8]. Machine learning methods have been widely employed in landslide susceptibility assessment owing to their strong adaptability to nonlinear and multi-factor–coupled geological systems [9]. Among them, Random Forest (RF), Support Vector Machine (SVM), and eXtreme Gradient Boosting (XGBoost) were selected in this study as three representative models that are internationally recognized for their wide application and stable performance.
As a tree-based ensemble method, RF is known for its robustness to noise, outliers, and complex feature interactions. As early as 2013, European researchers applied RF to regional-scale landslide susceptibility modeling in Italy to examine the influence of input factor scales and parameter tuning on prediction stability [10]. Since then, RF has been repeatedly applied in high-incidence regions such as Turkey, the Andes in South America, and the European Alps, often in combination with techniques such as Boruta feature selection, terrain-unit optimization, or coupling with physical parameters. These studies consistently achieved high Area Under the Receiver Operating Characteristic Curve (AUC) values and stable classification performance [11], establishing RF as a “benchmark model” in international comparative research [12].
SVM, based on its margin-maximization principle and kernel-function mapping capability, demonstrates excellent generalization performance in landslide studies characterized by limited sample sizes, high-dimensional feature spaces, or imbalanced classes [13]. Since the 2000s, SVM has been repeatedly validated in typical mountainous regions of Asia, including northeastern India, central Nepal, and southern Korea. Its prediction accuracy is generally superior to that of traditional statistical models, particularly in areas where terrain factors are highly coupled, training samples are sparse, or landslide inventory data are limited. Under such conditions, SVM maintains stable performance [14] and is therefore frequently employed for reliable validation under “boundary conditions’’ or in “small-sample scenarios.’’
XGBoost, a representative model of the Gradient Boosting Decision Tree (GBDT) family, excels in large-sample, multi-factor landslide susceptibility analyses due to its second-order optimization, regularization, and column-subsampling mechanisms [15], demonstrating high accuracy and generalization capability. Recent studies in Turkey, Italy, Colombia, Brazil, and the Himalayan region have shown that XGBoost achieves significantly higher AUC values than traditional models such as RF and SVM, especially when dealing with diverse features and large sample sizes. This advantage makes XGBoost particularly suitable for heterogeneous datasets encompassing multi-scale terrain, geology, rainfall, land use, and other environmental factors [16,17,18].
Among them, the Extreme Gradient Boosting (XGBoost) model introduces regularization and second-order gradient optimization, demonstrating superior accuracy and generalization capability [19]. Studies have shown that in the landslide hazard assessment of the Three Gorges Reservoir area, the XGBoost model achieved an AUC value of 0.934, which was significantly higher than those of the Random Forest (RF) and Support Vector Machine (SVM) models [20]. This indicates that the XGBoost model has notable advantages in identifying landslide-prone areas and provides a reliable technical foundation for landslide hazard prediction.
However, in the assessment of these hazards, challenges such as insufficient model accuracy and simplified scenario settings still persist. Most existing studies conduct hazard zonation under a single rainfall scenario or neglect the spatiotemporal variability of rainfall, resulting in discrepancies between the assessment results and actual landslide occurrences [21,22]. Under the influence of climate change, extreme rainfall events have become more frequent and spatially heterogeneous, making rainfall scenario classification and indicator selection critical yet challenging issues in landslide hazard assessment [23]. Therefore, developing an evaluation framework that comprehensively considers multi-scenario rainfall-driving processes is of great significance for improving assessment accuracy [24]. In this regard, Huang et al. coupled landslide susceptibility maps with rainfall data to simulate the probability of landslide occurrence under specific rainfall scenarios and established a regional early warning system for rainfall-induced landslides [25]. In addition, some researchers have proposed double-exponential rainfall warning models that combine daily rainfall with 5-day effective rainfall to account for short-term intense rainfall and increased pore water pressure in typhoon-prone regions [26]. Overall, current studies on landslide hazard assessment are gradually evolving toward multi-source data integration, physical mechanism analysis, and the integration of machine learning models, aiming to achieve high-precision, multi-scenario, and dynamic assessments of landslide hazards [19,27].
In view of this, this study takes Yongren County in Yunnan Province as a case study, integrating multi-source factors such as topography, geology, and meteorology to identify the dominant driving mechanisms of such phenomena. A rainfall scenario–based landslide hazard zonation framework is established to characterize spatial hazard patterns under multiple rainfall conditions. By optimizing the parameters and analyzing the feature importance of the XGBoost model, an optimal regional-scale model is developed to achieve accurate characterization of landslide hazard distributions under different rainfall scenarios. The results of this study can provide a scientific basis for landslide early warning, territorial spatial planning, and the enhancement of regional disaster resilience under the context of climate change [28,29].
2. Materials and Methods
2.1. Study Area
Yongren County, administered by Chuxiong Yi Autonomous Prefecture in north-central Yunnan Province, lies at the transition between the Central Yunnan Plateau and the Hengduan Mountains. The terrain is characterized by middle- to low-elevation mountains with substantial topographic relief. The overall terrain is high in the northwest and low in the southeast. Strongly influenced by tectonic movements, the region exhibits well-developed fault structures. Major rivers such as the Jinsha River have deeply incised valleys, resulting in highly undulating terrain and locally fragmented geomorphology that easily leads to the formation of unstable slopes.
The stratigraphic and lithological conditions are complex and diverse, mainly consisting of Jurassic and Cretaceous strata interbedded with Cenozoic sediments. The dominant lithologies include sandstone, mudstone, and carbonate rocks, which are generally weathered and fractured, indicating poor engineering geological conditions. The region lies within the convergence zone between the Indian and Eurasian plates, where frequent fault activity has generated multiple regional and secondary faults that exert strong control over the development and distribution of landslides.
The climate of Yongren County is characterized as a South Asian subtropical dry-hot valley climate, with distinct wet and dry seasons. Rainfall is mainly concentrated during the flood season from May to October, which serves as the primary external trigger for landslides and other geological hazards. Vegetation coverage is significantly influenced by topography and human activities: forest land dominates the high-altitude zones, while cultivated land and shrubland are widely distributed in the middle and low mountains as well as valley areas. Such variations in vegetation cover lead to notable spatial differences in slope stability.
According to geological hazard survey data, more than one hundred potential landslide hazard sites have been identified in Yongren County. These landslides are generally small in scale, widely distributed, and exhibit strong clustering characteristics. They are mainly concentrated along transportation corridors, river valleys, and near active fault zones. Critical transportation corridors and residential zones are frequently situated along valley floors and at slope bases, rendering them acutely susceptible to geological hazards that endanger public safety and infrastructure integrity. Therefore, Yongren County represents a high-prone area for landslides and serves as a typical study region suitable for landslide susceptibility and hazard zonation analysis (Figure 1).
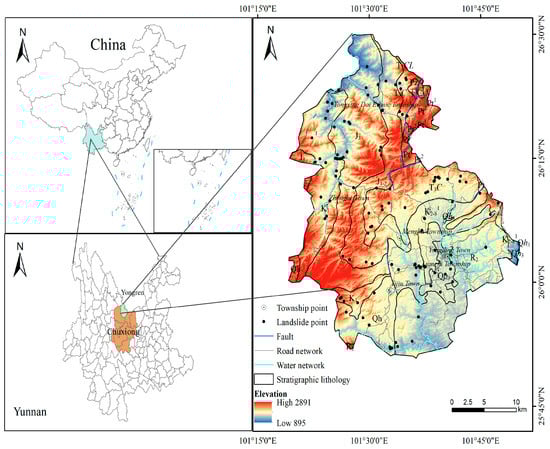
Figure 1.
Geological–topographic configuration of the study area.
2.2. Data Sources
This study integrated multiple datasets, including elevation, lithology, fault, river and road distribution, vegetation cover, precipitation, and land use data, to prepare the influencing factors. The sources of these datasets are summarized in Table 1.

Table 1.
Data sources of relevant factors in the study area.
2.3. Research Questions and Hypotheses
2.3.1. XGBoost Outperforms RF and SVM in Landslide Susceptibility Prediction
This hypothesis is informed by consistent patterns reported in international studies. Owing to its second-order gradient optimization and built-in regularization, XGBoost is capable of capturing complex nonlinear interactions among topographic, geological, and environmental variables more effectively than RF and SVM. These advantages allow XGBoost to achieve superior performance in high-dimensional, multi-factor landslide susceptibility modeling. Previous research has demonstrated that, in regions characterized by rugged terrain and intricate triggering mechanisms, the AUC values of XGBoost generally exceed those of RF and SVM [30,31]. Therefore, this study conducts a systematic comparison of the three models under identical data conditions to empirically verify this hypothesis.
2.3.2. Increasing Rainfall Intensity Expands High-Hazard Zones
Intense rainfall infiltration significantly elevates pore-water pressure, reduces effective stress, and weakens soil shear strength. It also increases shallow-layer saturation, diminishes root–soil interface strength, and adds self-weight, collectively leading to internal mechanical degradation. When the infiltration rate exceeds the hydraulic conductivity, preferential flow paths or transient saturated zones may develop, bringing potential slip surfaces closer to the limit-equilibrium threshold. Concurrently, enhanced fluvial incision and toe erosion during heavy rainfall reduce downslope support, contributing to external unloading effects [32]. Building on these hydrological and geomechanical mechanisms, this study establishes three representative rainfall scenarios and couples them with the XGBoost-derived static susceptibility baseline using dynamic weighting. This framework enables quantification of the magnitude and spatial differences in hazard expansion under varying rainfall intensities.
2.4. Research Methods
The data used in this study include landslide inventory data obtained from geological surveys and multi-source environmental factor datasets. First, the spatial accuracy of the landslide points was verified, and duplicate or erroneous samples were removed. Then, relevant evaluation factors were extracted from the data sources listed in Table 1 within the study area, with all datasets projected to a unified coordinate system and rasterized at a spatial resolution of 30 m to ensure consistency. A total of 119 landslide points were identified (The landslide inventory data were sourced from the Resource and Environment Science and Data Center, Chinese Academy of Sciences. Historical landslide data up to 2020 were identified and validated through remote sensing image interpretation, topographic and geomorphological verification, and other comprehensive research methods, with minor corrections applied to the original data, to determine the spatial locations and attribute information of landslide sites), and a random sampling approach was applied to balance the number of landslide and non-landslide samples. The dataset was subsequently divided into training and validation subsets at a ratio of 7:3, where the training set was used for model construction and the validation set for independent accuracy assessment. To ensure systematic implementation and reproducibility, this study follows the research workflow illustrated in Figure 2.
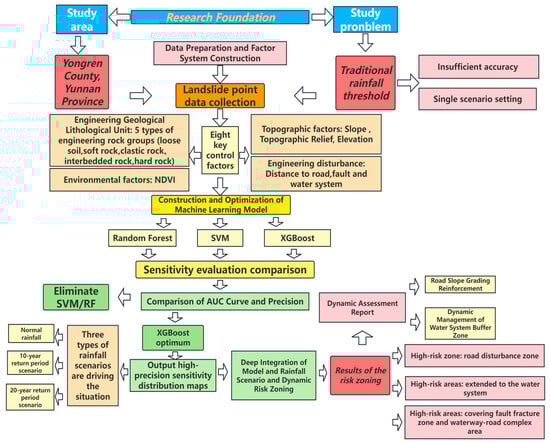
Figure 2.
Research Flowchart.
This study selects Random Forest (RF), Support Vector Machine (SVM), and XGBoost as the comparative models primarily because they represent three influential categories in landslide susceptibility prediction: a bagging-based traditional tree ensemble (RF), a kernel-based method known for its stability under limited sample conditions (SVM), and a state-of-the-art gradient-boosting algorithm with consistently superior performance (XGBoost). These three models have long served as mainstream approaches in international geohazard research and therefore constitute a representative and robust comparative modeling framework.
2.4.1. Random Forest Model (RF)
Proposed by Breiman in 2001, the RF model builds an ensemble of decision trees by sampling the original dataset through bootstrap resampling. Every resampled subset is used to grow an individual classification or regression tree, forming the basis of the ensemble [33]. For the Random Forest model, the hyperparameters were determined through a combination of empirical experience and cross-validation to balance model complexity and generalization ability, following commonly adopted practices in ensemble learning studies [33,34]. Specifically, the maximum tree depth (max_depth = 8) was selected to restrict excessive tree growth and reduce overfitting, which is particularly important given the moderate sample size and the number of conditioning factors used in this study.
The minimum number of samples required to split an internal node (min_samples_split = 6) was set to avoid overly specific splits driven by local noise, thereby enhancing model robustness. The number of trees (n_estimators = 200) was chosen sufficiently large to ensure stable ensemble performance, while further increases showed no significant improvement in prediction accuracy during validation, consistent with previous findings [33].
The RF model excels in situations where the predictor set is large and the interactions among variables are highly nonlinear, allowing it to model complex data structures with stability. It demonstrates strong resistance to overfitting and excellent generalization performance. In landslide susceptibility assessment, the RF model can quantify the contribution of each evaluation factor by calculating its variable importance, thereby improving the interpretability of the model. The classification function of the RF model is expressed as Equation (1):
where represents the prediction result of the -th decision tree for sample , sample, and denotes the final predicted class.
2.4.2. Support Vector Machine Model (SVM)
The Support Vector Machine (SVM) is a binary classification method based on statistical learning theory. Its fundamental principle is to construct an optimal hyperplane that maximizes the margin between different classes of samples [35]. For nonlinear problems, SVM employs kernel functions (such as the Radial Basis Function, RBF) to map the original input space into a higher-dimensional feature space, where the data can be linearly separated.
In this study, the Support Vector Machine (SVM) model employed the radial basis function (RBF) kernel, which is widely used for capturing nonlinear relationships between landslide occurrences and conditioning factors in geohazard studies [36,37]. The penalty parameter (C = 1.0) was determined based on cross-validation to balance the trade-off between margin width and misclassification tolerance [38]. The gamma parameter was automatically set using the ‘scale’ strategy, which has been shown to perform effectively for datasets with moderate sample size and multiple input variables. These parameter settings ensure that the SVM model is both robust and capable of accurately capturing nonlinear patterns in landslide susceptibility prediction.
In landslide susceptibility prediction, SVM demonstrates high classification accuracy even with limited samples and is well-suited for handling complex nonlinear relationships among evaluation factors. SVM determines decisions according to the formulation shown in Equation (2):
where represents the Lagrange multiplier, is the class label of the training sample, denotes the kernel function, and is the bias term.
2.4.3. Extreme Gradient Boosting Model (XGBoost)
XGBoost is an ensemble learning method based on the Gradient Boosting framework, characterized by the introduction of a regularization term and second-order gradient approximation, which enhances model fitting while effectively preventing overfitting [39]. In this study, the XGBoost model iteratively constructs CART regression trees, with each tree learning the residuals from the previous iteration. The number of trees (n_estimators = 100) was chosen based on cross-validation to ensure stable ensemble performance without overfitting. The maximum tree depth (max_depth = 3) was selected to limit the complexity of individual trees. The learning rate (eta = 0.1) was set to balance the contribution of each tree and improve generalization. Subsampling (subsample = 0.8) and feature sampling (colsample_bytree = 0.8) were applied to control overfitting and enhance model robustness. These parameter settings follow commonly adopted practices in XGBoost modeling for landslide susceptibility prediction [40,41]. The objective function is defined as shown in Equation (3):
where represents the loss function, is the predicted value, and denotes the regularization term used to control model complexity.
Compared with traditional gradient boosting methods, XGBoost exhibits significant advantages in computational efficiency, feature selection, and generalization ability, making it suitable for large-scale and highly nonlinear problems. In this study, XGBoost achieved the highest predictive accuracy among the three models, effectively capturing the spatial distribution characteristics of landslides in Yongren County.
By comparing the performance of the three models, this study establishes a complete methodological chain—from “robust baseline (RF) → small-sample validation (SVM) → high-precision prediction (XGBoost)”—enabling a multi-perspective characterization of landslide susceptibility patterns and providing a more reliable basis for disaster risk management.
2.5. Rationale for Factor Selection
Based on the physical processes underlying landslide initiation and triggering, this study selects representative predisposing factors from three aspects: topographic structure, geotechnical properties, and external disturbances. The detailed types are listed in Table 2.
Table 2.
Landslide Susceptibility Factors: Mechanisms and Applicability.
2.6. Correlation and Multicollinearity Analysis of Evaluation Factors
To ensure the independence of influencing factors in the landslide susceptibility evaluation model and to avoid the adverse effects of multicollinearity on model stability and result reliability, eight core susceptibility factors were selected for Yongren County: Engineering Geologic Rock Group, Slope Angle, Topographic Relief, Distance to Faults, D Rivers, Roads, NDVI, and Elevation.
A Pearson correlation analysis and Variance Inflation Factor (VIF) test were conducted to examine the relationships and potential multicollinearity among these variables [55]. The Pearson correlation heatmap is shown in Figure 3, and the results of the multicollinearity analysis are presented in Table 3. The confidence intervals are shown in Table 4.
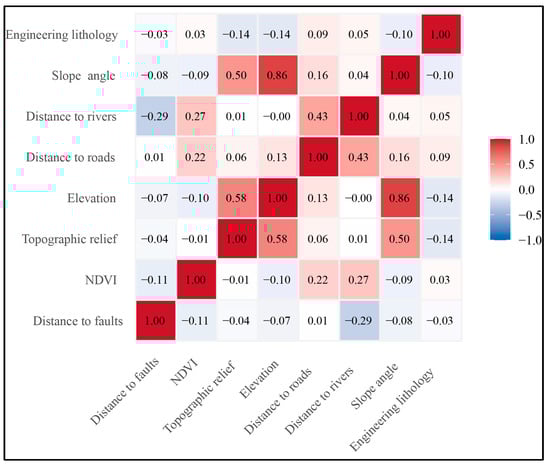
Figure 3.
Heatmap of correlation analysis among evaluation factors.
Table 3.
Variance inflation factor and tolerance test results of evaluation factors.
Table 4.
Confidence Intervals of Evaluation Factors.
Based on the above analysis of the key evaluation factors’ correlations and confidence intervals (Table 4), together with the results of variance inflation factor (VIF) and tolerance tests for the evaluation factors (Table 3), the following conclusions can be drawn:
The absolute values of the correlation coefficients for all evaluation factors are below 0.9, indicating that no significant multicollinearity exists among the variables, and they can be jointly used in landslide susceptibility modeling. Overall, the correlations among factors are relatively low, suggesting that each factor can independently reflect the natural and anthropogenic conditions influencing landslide occurrence. Specifically, elevation and slope show a significant positive correlation (r = 0.86, 95% CI: [0.802, 0.905]), reflecting that higher elevations are often associated with steeper slopes. Topographic relief and elevation also exhibit a strong correlation (r = 0.58, 95% CI: [0.445, 0.686]), indicating some overlap in the terrain representation. Roads and rivers show a noticeable correlation (r = 0.43, 95% CI: [0.266, 0.555]), likely due to roads being constrained along river valleys. Apart from these relationships, the remaining factors show weak correlations (|r| < 0.3), and except for “Distance to faults—NDVI” (95% CI: [−0.239, 0.013], confidence interval crosses 0, not statistically significant), the confidence intervals of all other weakly correlated factors do not cross 0, indicating statistical stability; indicators such as faults, NDVI, and lithology can capture geological and ecological characteristics of landslides from different perspectives.
The variance inflation factors (VIF) of all factors are below 5, and the tolerance values are greater than 0.2, indicating no obvious multicollinearity among the variables. In particular, NDVI (VIF = 1.12), faults (VIF = 1.14), and lithology (VIF = 1.04) have VIF values close to 1, demonstrating high independence. All eight evaluation factors meet the statistical prerequisites for landslide susceptibility modeling and can be jointly applied in constructing subsequent integrated evaluation models.
2.7. Classification of Landslide Conditioning Factors
The reliability of landslide susceptibility mapping is strongly influenced by the choice of conditioning factors and the modeling strategy employed. To enhance the robustness of the evaluation, this study integrates findings from previous research and engineering practice, selecting elevation, slope, NDVI, engineering geological lithology, Topographic relief, distance to roads, distance to rivers, and distance to faults as key evaluation indicators to characterize landslide distribution and controlling mechanisms [56]. Table 5 and Figure 4 summarize the class divisions of all factors along with the landslide counts in each category.
Table 5.
Statistical summary of landslide counts and information value for each factor class.
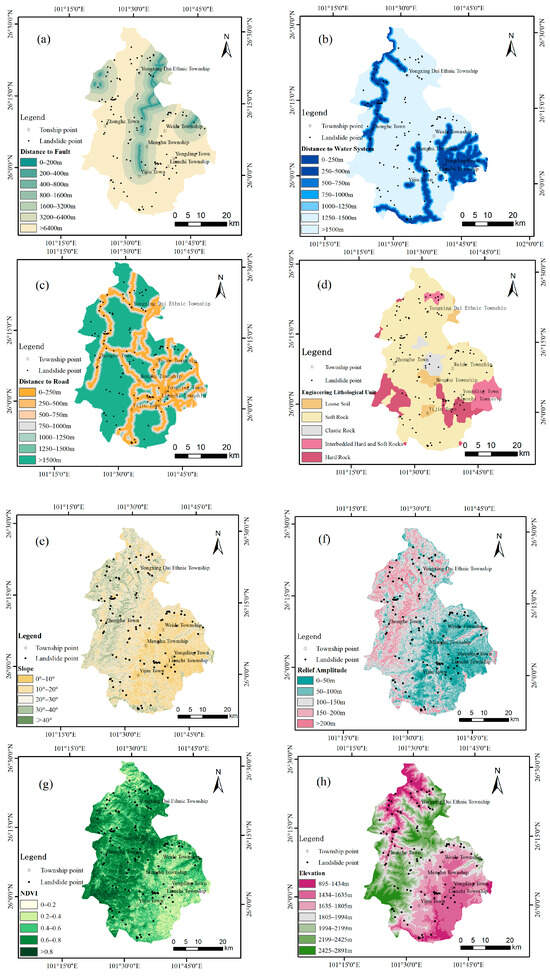
Figure 4.
Classification maps of evaluation factors: (a) Distance to fault evaluation factor classification: Colors correspond to distance intervals of 0–200 m, 200–400 m, 400–800 m, 800–1600 m, 1600–3200 m, 3200–6400 m, and >6400 m; (b) Distance to water system evaluation factor classification: Colors correspond to distance intervals of 0–250 m, 250–500 m, 500–750 m, 750–1000 m, 1000–1250 m, 1250–1500 m, and >1500 m; (c) Distance to road evaluation factor classification: Colors correspond to distance intervals of 0–250 m, 250–500 m, 500–750 m, 750–1000 m, 1000–1250 m, 1250–1500 m, and >1500 m; (d) Engineering lithological unit evaluation factor classification: Colors represent loose layers, soft rocks, clastic rocks, interbedded hard–soft rocks, and hard rocks; (e) Slope evaluation factor classification: Colors correspond to slope intervals of 0°–10°, 10°–20°, 20°–30°, 30°–40°, and >40°; (f) Relative relief amplitude evaluation factor classification: Colors correspond to relative relief amplitude intervals of 0–50 m, 50–100 m, 100–150 m, 150–200 m, and >200 m; (g) NDVI (Normalized Difference Vegetation Index) evaluation factor classification: Colors correspond to NDVI intervals of 0–0.2, 0.2–0.4, 0.4–0.6, 0.6–0.8, and >0.8; (h) Elevation evaluation factor classification: Colors correspond to elevation intervals of 895–1434 m, 1434–1635 m, 1635–1805 m, 1805–1994 m, 1994–2199 m, 2199–2425 m, and 2425–2891 m.
2.7.1. Distance to Faults
Faults represent structurally weak zones within the Earth’s crust. Areas in close proximity to faults generally exhibit unstable geological structures and are more susceptible to seismic and tectonic disturbances, thereby increasing the likelihood of landslides [57]. Fault zones are typically characterized by fractured rock masses, well-developed joints, and weak planes. These features, together with the presence of fluid channels and stress concentration, reduce the mechanical strength of surrounding rocks and make slope failure more likely. Moreover, active faults may directly trigger landslides, with landslide susceptibility being higher in areas closer to faults. The influence of faults is significant within a certain range and gradually decreases with increasing distance.
2.7.2. Distance to Rivers
The distance to rivers is an important factor in assessing landslide hazard. Areas adjacent to rivers are more prone to landslides due to the erosive and saturating effects of flowing water. River erosion can undercut and weaken the slope toe, while prolonged water infiltration reduces the effective stress within slope materials, both of which contribute to slope instability [58].
2.7.3. Distance to Roads
Road construction and traffic activities can significantly alter slope stability through processes such as slope toe excavation, increased load on slope surfaces, and changes in surface drainage conditions [59]. In mountainous areas, road construction is often accompanied by large-scale terrain modification. Excavation, fill placement, drainage alteration, and vibration from construction activities can weaken slope materials and reduce stability. Engineering disturbances commonly increase slope instability, and slopes along road corridors frequently become concentrated zones of landslides due to over-excavation or inadequate drainage. Therefore, the distance to roads is an important indicator in landslide susceptibility assessment.
2.7.4. Engineering Geological Lithology
Based on regional geological maps and field investigations, the study area was divided into five engineering lithological units according to lithologic characteristics and mechanical properties: (1) loose soil (residual and colluvial deposits), (2) soft rock (mudstone and shale), (3) clastic rock (sandstone and conglomerate), (4) alternating soft and hard rock, and (5) hard rock (granite and limestone). These lithological units exhibit distinct differences in shear strength, weathering characteristics, and permeability. Shallow landslides commonly occur in loose soil layers, whereas failures in hard rock units typically develop along fault or fracture zones [60].
2.7.5. Slope Gradient
Slope gradient is one of the primary mechanical factors controlling landslide occurrence. It directly determines the magnitude of the gravitational component acting parallel to the slope surface. As the slope angle increases, the shear component of gravity rises while the normal component decreases. When the shear force exceeds the shear strength of slope materials, slope failure occurs [61]. The critical slope angle varies with lithology-approximately 25–35° for loose soils, 30–40° for soft rocks, and 40–50° for hard rocks. Beyond these thresholds, susceptibility increases sharply. Overall, slope gradient shows a positive correlation with landslide susceptibility, although “threshold effects” and “lithological modulation effects” are evident.
2.7.6. Terrain Relief
High terrain relief often indicates intense river incision, numerous unstable slope boundaries, and fragmented landforms, all of which facilitate surface erosion and toe instability. In contrast, areas with low relief-typically gentle slopes or terraces-tend to exhibit lower landslide susceptibility.
2.7.7. Vegetation Coverage
Vegetation coverage, commonly quantified by the Normalized Difference Vegetation Index (NDVI), represents the proportion of ground surface covered by vegetation and is standardized to a range between 0 and 1. Seasonal composite images from May to October (the rainy and landslide-prone period in Yongren County) were used to minimize the effects of cloud cover and phenological differences. Vegetation enhances slope stability by increasing soil shear strength through root reinforcement, reducing surface runoff and erosion, and promoting rainfall interception and evapotranspiration, which mitigates short-term soil moisture accumulation [62].
2.7.8. Elevation
Elevation influences regional climate (precipitation and temperature), vegetation distribution, weathering, and erosion processes. High-altitude areas may exhibit distinct geomorphological and lithological assemblages. In some regions, low-elevation valleys are more prone to landslides due to strong fluvial incision, whereas in others, steep high-elevation slopes show higher instability. The relationship between elevation and landslide susceptibility is thus non-linear and context-dependent, functioning more as a regulating factor influenced by geomorphology and rainfall distribution.
2.8. Landslide Susceptibility Results Based on RF, SVM, and XGBoost Models
Landslide susceptibility was assessed using three machine learning algorithms: Random Forest (RF), Support Vector Machine (SVM), and Extreme Gradient Boosting (XGBoost). The input data included filtered landslide sample points and eight raster layers representing evaluation factors. The dataset was randomly split into training (70%) and validation (30%) subsets. During training, the RF model predicted probabilities based on the aggregated votes of multiple decision trees; the SVM model employed an RBF kernel to project the data into a higher-dimensional space and identify the optimal decision boundary; and the XGBoost model built an ensemble of weak classifiers through iterative residual minimization with regularization. After training, the predicted probabilities from all models were normalized to a 0–1 range and classified into five susceptibility levels: very low, low, moderate, high, and very high. Model performance was evaluated using the area under the Receiver Operating Characteristic (ROC) curve (AUC), and the spatial distributions of susceptibility were compared to highlight similarities and differences among the three approaches. The resulting maps are presented in Figure 5.
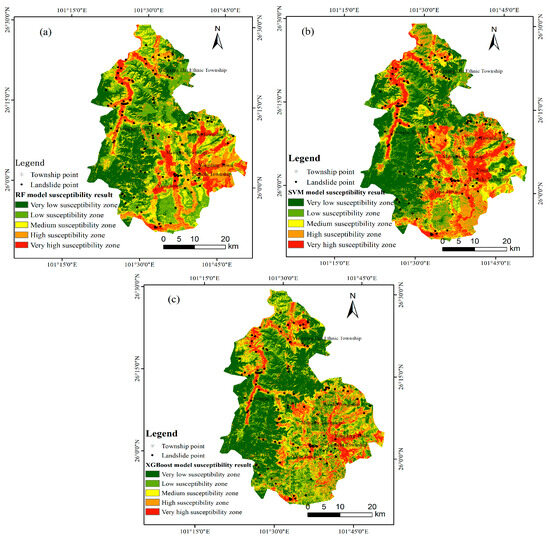
Figure 5.
Landslide susceptibility zoning maps based on different models: (a) RF model susceptibility result; (b) SVM model susceptibility result; (c) XGBoost model susceptibility result. All models classify susceptibility into five zones: very low, low, medium, high, and very high.
2.8.1. Model Accuracy Assessment
The ROC curve serves as a standard tool for examining the effectiveness of predictive models, depicting the trade-off between sensitivity and the false positive rate under multiple threshold conditions. Its integral measure, the AUC, is commonly used to summarize overall model performance. An AUC between 0.5 and 1 is expected, with higher values signifying superior discriminatory power [63,64]. In the ROC plot, the central 45° line denotes the baseline performance (AUC = 0.5). A model demonstrates stronger discriminative ability when its ROC curve rises further toward the upper-left region of the figure.
2.8.2. ROC Analysis and AUC Evaluation
To further validate the reliability of the susceptibility assessment models, both landslide and non-landslide sample points within the study area were used. The corresponding probability values derived from the models were processed in relevant software platforms to generate the ROC curves for performance evaluation. As shown in Figure 6, among the three models-Random Forest (RF), Support Vector Machine (SVM), and Extreme Gradient Boosting (XGBoost)-the ROC curve of the XGBoost model is closest to the upper-left corner, with an AUC value of 0.934. This indicates that XGBoost demonstrates superior capability in balancing true positive recognition and minimizing false positive predictions [56]. Compared with the other two models, XGBoost achieves the highest prediction accuracy. Therefore, based on the comprehensive analysis of all three models, the XGBoost model exhibits the best predictive performance and provides the most reasonable susceptibility zonation in the study area. Figure 6 presents the ROC curves of the three models.
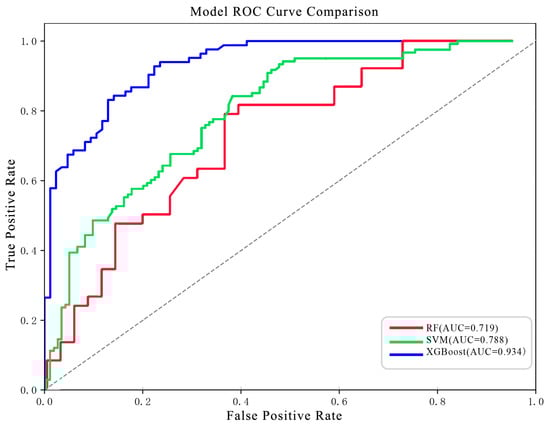
Figure 6.
Comparison of ROC curves for different models.
3. Results
This section focuses on the landslide hazard assessment under multiple rainfall scenarios, as multi-scenario rainfall simulation is a crucial component in evaluating rainfall-induced landslide hazards. By constructing rainfall scenarios of varying intensities, it is possible to analyze how different rainfall magnitudes influence landslide occurrence. As the primary triggering factor, rainfall not only affects the frequency of landslides but also directly determines their spatial distribution and scale [65]. To improve the reliability of landslide hazard prediction, this study integrates the susceptibility assessment results obtained from the XGBoost model with a multi-scenario rainfall simulation framework, in order to explore the spatial differentiation and impacts of landslide hazard zoning under different rainfall intensities.
3.1. Rainfall Scenario Design and Simulation
Based on the climatic characteristics and historical rainfall records of Yongren County, three representative rainfall scenarios were selected to comprehensively evaluate the variation in landslide hazards under different rainfall conditions. The rainfall event on 9 June 2024, was defined as the normal rainfall scenario, representing typical precipitation conditions in the study area. The rainfall event on 27 May 2018, was designated as a 10-year return period heavy rainfall scenario, reflecting the impact of moderate-intensity storms on slope stability. Meanwhile, the rainfall event on 20 August 2001, was selected as a 20-year return period extreme rainfall scenario, characterizing the maximum response of landslides to extreme precipitation events.
Together, these three scenarios form a rainfall intensity gradient ranging from normal to extreme conditions, providing a basis for analyzing the spatiotemporal variations and susceptibility differences of landslide hazards under changing rainfall intensities. The three rainfall scenarios are illustrated in Figure 7, and the spatial distribution of rainfall at corresponding stations is shown in Figure 8.

Figure 7.
Rainfall distribution maps under three scenarios: (a) normal rainfall; (b) 10-year rainfall event; (c) 20-year rainfall event.
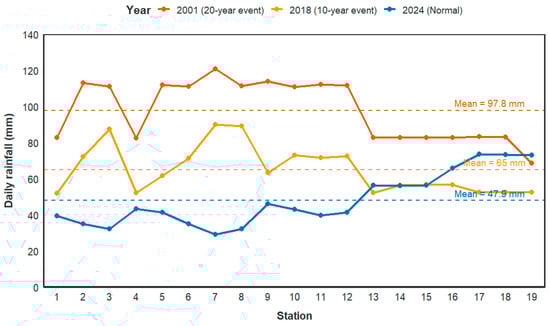
Figure 8.
Daily rainfall distribution across stations in three rainfall scenarios.
According to the analysis results shown in Figure 7 and Figure 8, significant differences are observed in rainfall intensity and spatial distribution across the three scenarios-normal rainfall, 10-year return period, and 20-year return period-in Yongren County. Under the normal rainfall scenario, the regional average daily precipitation is approximately 47.9 mm, with overall weak rainfall intensity; only localized areas in the southern part exhibit relatively higher values, which representing the baseline rainfall level under typical climatic conditions. In the 10-year return period scenario, the average precipitation increases to around 65 mm, with the rainfall center concentrated in the southeastern region, where local precipitation exceeds 80 mm, indicating the potential impact of moderate to heavy rain events on slope stability. Under the 20-year return period scenario, rainfall intensity reaches its peak, with an average of 97.8 mm, and significantly enhanced precipitation in the southern and central regions, where the maximum value exceeds 120 mm, highlighting the amplified probability of landslide initiation under extreme rainfall conditions. Overall, rainfall intensity exhibits a clear increasing trend with higher return period levels, and spatially, rainfall is consistently greater in the southern and southeastern areas than in the north, revealing the dominant role of intense precipitation in shaping the regional distribution pattern of landslide hazard.
3.2. Landslide Hazard Evaluation Under Multiple Precipitation Scenarios
Under multiple rainfall scenarios, the spatial distribution of landslide hazard in Yongren County exhibits pronounced variability. To quantitatively reveal the impact of different rainfall intensities on landslide occurrence, this study constructed landslide hazard zoning maps based on three rainfall scenarios-normal rainfall, 10-year return period, and 20-year return period-and statistically analyzed the area proportion and number of potential landslide sites in each hazard class (Figure 9 and Table 6, Table 7 and Table 8).
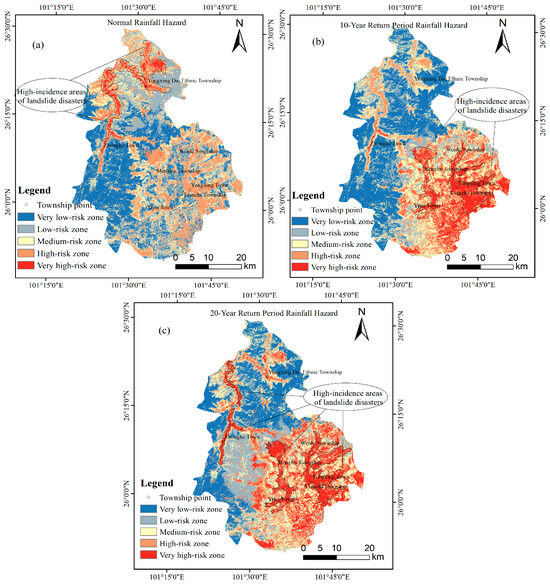
Figure 9.
Landslide hazard zonation maps under different rainfall scenarios: (a) normal rainfall hazard; (b) 10-year return period rainfall hazard; (c) 20-year return period rainfall hazard. All maps classify hazard into five levels: very low, low, medium, high, and very high.
Table 6.
Statistical information of landslide hazard susceptibility zones under the normal rainfall scenario.
Table 7.
Statistical information of landslide hazard susceptibility zones under the 10-Year Return Period Rainfall.
Table 8.
Statistical information on landslide hazard susceptibility zones under the 20-Year Return Period Rainfall Scenario.
The results show that with increasing rainfall intensity, the landslide hazard zones gradually shift from low- to high-hazard levels, with their spatial extent expanding significantly and the overall hazard intensity notably enhanced. Under the normal rainfall scenario, high-hazard zones are mainly distributed along major transportation corridors and lithologically weak zones, reflecting the combined effects of anthropogenic disturbance and geological fragility. Under the 10-year return period scenario, high-hazard areas further extend along river systems, with river–road intersection zones becoming hotspots for landslide concentration. Under the 20-year return period (extreme rainfall) scenario, the high-hazard zones reach their maximum extent, with fault belts and river–road compound disturbance areas emerging as the dominant high-risk regions.
Overall, a distinct upward trend is observed between precipitation intensity and landslide hazard levels. Under extreme rainfall, both the extent of high-risk zones and the number of potential failure sites increase markedly, demonstrating that intense precipitation is the dominant factor shaping the spatial pattern of landslide hazards in the study area.
According to the statistical results presented in Table 6, Table 7 and Table 8 and Figure 9 and Figure 10. Both the spatial extent of landslide-hazard classes and the number of susceptible sites exhibit marked differences across rainfall scenarios. Under normal rainfall, the landscape is dominated by low to moderate hazard levels, covering roughly 71% of the region, whereas high and very high hazard classes together account for 29%, with only 2.5% falling into the very high category. Potential landslide spots are primarily clustered within areas classified as high hazard, while high and very high hazard zones represent only 29%, with the very high hazard zone comprising 2.5%. Landslide-prone sites are mainly concentrated in high-hazard areas, indicating that under normal climatic conditions, landslide activity remains relatively weak; however, localized risks persist in areas affected by geological structures and road-induced disturbances.
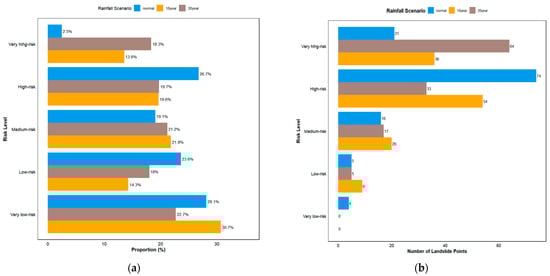
Figure 10.
Distribution characteristics of landslide hazard under different rainfall scenarios: (a) proportion of hazard zones under different rainfall scenarios; (b) Number of potential landslides in hazard zones under three rainfall scenarios.
As rainfall intensity increases to the 10-year return period scenario, the proportion of high and very high hazard zones rises sharply to 33.2%, and the number of landslide-prone sites within the very high hazard zone increases to 36, suggesting that moderate-intensity storms are sufficient to trigger widespread slope instabilities. Under the 20-year return period (extreme rainfall) scenario, the total proportion of high and very high hazard zones further expands to 38%, with the very high hazard zone alone accounting for 18.3% of the study area, and the number of potential landslide sites rising to 64, predominantly distributed along fault zones, river networks, and road intersections.
The increase in rainfall intensity not only leads to a progressive expansion of high-hazard areas but also transforms the spatial pattern of potential landslides from linear distributions along valleys and roads to clustered areal concentrations. The expansion of high-hazard zones mainly occurs in areas with strong topographic relief, weak lithology, and intensive human disturbance, reflecting the combined effects of extreme rainfall, geological fragility, and anthropogenic activity. These findings confirm that rainfall is the dominant factor controlling the spatiotemporal distribution of landslides in Yongren County and provide a quantitative basis for infrastructure planning and disaster prevention under future extreme climatic conditions.
4. Discussion
4.1. Key Findings and Mechanism Analysis
This study focuses on Yongren County, Yunnan Province, through the application of RF, SVM, and XGBoost models with multi-scenario rainfall simulations to conduct landslide susceptibility evaluation and hazard zoning. The research provides methodological support for the management of these hazards in mountainous regions and reveals the underlying regional disaster-forming mechanisms.
In terms of model performance, XGBoost achieved the highest accuracy (AUC = 0.934), which is significantly higher than that of RF (0.719) and SVM (0.788), demonstrating superior overall precision and stability. This advantage mainly arises from XGBoost’s regularization mechanism and second-order gradient optimization, which effectively suppress overfitting in high-dimensional datasets and capture nonlinear coupling effects among key factors such as slope, lithology, and rainfall. By contrast, RF tends to overlearn redundant features, while SVM is highly sensitive to small sample sizes and kernel parameter settings. Variance Inflation Factor (VIF) analysis indicates that the eight selected factors-lithology, slope, terrain relief, distances to faults, rivers, and roads, NDVI, and elevation-exhibit no significant multicollinearity. Although elevation and slope show a strong correlation (r = 0.86), XGBoost effectively filters redundant information, ensuring the robustness and reliability of the susceptibility assessment. This result is consistent with previous studies in Conghua District, Guangzhou, where ensemble models, especially XGBoost, generally outperform traditional classifiers in AUC and overall predictive performance [66].
4.2. Landslide Hazard Response Under Multi-Rainfall Scenarios
Under different rainfall scenarios, the very-high hazard zone exhibits a stepwise and markedly amplified expansion (Figure 9 and Figure 10). Under the normal scenario, this zone accounts for 2.5% of the total area, with 21 identified potential landslide sites. Under the 10-year return period scenario, its proportion increases to 13.6%, representing a 5.4-fold expansion relative to the baseline, and the number of hazard sites rises to 36 (+15 sites, +71.4%). Under the 20-year return period scenario, the proportion further increases to 18.3%, corresponding to a 7.3-fold expansion, with 64 hazard sites (+43 sites, +204.8%).
In contrast, the high hazard zone demonstrates a “shift–shrink” pattern: its area proportion decreases from 26.7% (74 sites) to 19.6% (54 sites), followed by a slight rebound to 19.7% (33 sites). This pattern indicates that, under intensified rainfall, portions of the high hazard zone transition into the very-high hazard category, resulting in a “top-end concentration effect” within the risk hierarchy.
From the baseline to the 10-year scenario, the very-high hazard zone expands by 11.1 percentage points, whereas the increase in the second-level zone narrows to 4.7 percentage points, revealing a marginally decreasing expansion rate of high hazard areas as rainfall intensity increases. Spatially, hazard-prone zones migrate progressively from road-disturbance belts → river corridors → fault–river compound zones, reflecting the nonlinear driving mechanism of rainfall intensity in reshaping the hazard configuration.
With increasing rainfall intensity, the very-high hazard zones exhibit a stepwise expansion, which aligns with the threshold-controlled slope failure theory suggesting that once cumulative rainfall exceeds local infiltration capacity, critical slopes in areas of loose lithology become highly susceptible. The “shift–shrink” pattern observed in high hazard zones reflects a redistribution of risk under extreme rainfall, consistent with findings from similar mountainous terrain studies [67]. Spatially, the hazard-prone zones migrate from road-disturbance belts → river corridors → fault–river compound zones, demonstrating the nonlinear coupling between anthropogenic disturbance, hydrological pathways, and tectonic structures [68].
4.3. Critical Evaluation and Sources of Uncertainty
4.3.1. Sensitivity to Sample Imbalance and Rare-Event Bias
In this study, the ratio of landslide to non-landslide samples was set to 1:1. Although random sampling was applied during model training to control class proportions, the limited number of landslide samples still constrained model robustness. The scarcity of positive samples makes it difficult for algorithms such as XGBoost to fully capture localized anomalous patterns and extreme responses, forcing the model to rely more heavily on global feature trends and thereby reducing its ability to identify rare high-risk zones. Sensitivity analyses indicate that fluctuations in sample ratios substantially increase uncertainty along the boundaries of high-risk areas, directly affecting the stability of susceptibility outcomes and contributing to scale-dependent effects.
4.3.2. Biases in Landslide Inventory and Cascading Spatial Effects
Small-scale landslides in remote mountainous areas may be omitted due to limited accessibility for field verification, resulting in contamination of negative labels. Such bias decreases the model’s sensitivity to true landslide signals, and interacts with sample imbalance in a cascading amplification manner. Missed landslide occurrences are often located in highly dissected terrain—precisely the zones that provide critical training signals for hazard classification. Their absence intensifies the smoothing effects associated with DEM resolution constraints, and together these factors may lead to an artificial reduction in predicted susceptibility under extreme rainfall scenarios. Future work may incorporate active learning strategies and supplemental UAV–LiDAR surveys within geomorphically complex zones to minimize catalog bias at reduced cost.
4.3.3. Influence of DEM Resolution on Topographic Threshold Detection
The 30 m DEM exhibits a smoothing effect when representing micro-topography in steep slopes and fault-fractured belts, potentially weakening the accurate detection of critical slope thresholds for loose materials. Future studies should balance computational cost with geomorphological precision by adopting multi-scale DEM fusion strategies (e.g., 30 m for macro-scale control combined with 12.5 m local refinement), thereby improving susceptibility estimation while maintaining efficiency.
4.4. Research Advantages and Significance
This study established an integrated evaluation framework of “high-precision susceptibility–multi-scenario driving–dynamic hazard assessment”, achieving a methodological shift from static susceptibility mapping to dynamic hazard evaluation and overcoming the limitations of traditional single-scenario static assessments. The results show that, under multiple rainfall scenarios, the proportion of high-hazard zones expands progressively from 2.5% to 13.6% and 18.3%, exhibiting a distinct “fault–river system composite zone” expansion pattern. The findings reveal a regional disaster-forming pathway characterized by “loose lithology–fault activity–rainfall infiltration”, reflecting the unique geological response mechanism of the dry–hot valley regions in Southwest China.
Further analysis indicates that the probability of landslides increases sharply once slope gradients exceed a critical threshold, while vegetation cover exerts a significant inhibitory effect on landslide occurrence. However, this protective effect is markedly weakened under extreme rainfall conditions, suggesting that rainfall intensity plays a key regulatory role in moderating vegetation’s stabilizing influence. The study quantitatively demonstrates that each increase in rainfall intensity level corresponds to an approximately 11% enlargement of the extremely high-hazard area, providing a scientific basis for defining rainfall-driven warning thresholds and for implementing dynamic risk management.
In addition to the methodological advantages described above, the findings of this study also provide substantial practical value for disaster prevention and mitigation. The multi-scenario landslide hazard maps can support county-level emergency management agencies in developing hierarchical early-warning and evacuation plans by identifying villages, road segments, and critical land parcels that require prioritized protection under different cumulative rainfall conditions. The observed boundary shifts of very-high hazard zones across models and data conditions further offer useful guidance for natural-resource authorities in selecting key monitoring sites—such as river-eroded slope toes, sharp road bends, or residential back-slope areas—facilitating low-cost deployment of crack meters and routine field inspections.
For deeply incised valleys or remote slopes where landslide inventories are often incomplete, the proposed uncertainty-detection framework can also help optimize UAV survey routes by prioritizing areas with the highest predictive instability, thereby improving monitoring efficiency under limited resources. Moreover, the multi-scale DEM fusion strategy provides a more reliable basis for land-use planning, engineering siting, and infrastructure risk assessment by reducing the misclassification of locally steep terrain caused by coarse-resolution elevation data. These application-oriented outcomes demonstrate the broader transferability of this study to similar mountainous regions worldwide.
4.5. Quantitative Comparison and Methodological Highlights
In this study, the XGBoost model achieved an AUC of 0.934, which is comparable to results reported in similar studies in the Three Gorges Reservoir area [20], Moreover, the XGBoost model captures nonlinear interactions among key factors more effectively than RF and SVM, as reflected in both AUC values and spatial hazard patterns, consistent with similar ensemble-based studies [41], demonstrating stable high-precision performance in complex geological settings. The RF (AUC = 0.719) and SVM (AUC = 0.788) models exhibited performance patterns consistent with trends observed in previous studies, and their accuracy differences (6.9 percentage points) fall within a reasonable range, indicating that XGBoost can effectively capture the nonlinear coupling among geology, topography, and rainfall.
Furthermore, previous studies often employed a single rainfall scenario or only two threshold-based scenarios, whereas this study constructed a three-level rainfall gradient (“normal–moderate extreme–severe extreme”), which allowed for quantifying the relationship between rainfall intensity and the expansion of very high hazard zones in the dry-hot valley region of Southwest China (with an increase of approximately 11% in very high hazard areas per level). This approach provides a more detailed quantitative analysis of regional rainfall–landslide responses. The results show that each increase in rainfall intensity corresponds to an ~11% enlargement of the very-high hazard area. This finding provides a more granular quantification than most previous studies, which typically considered only two rainfall thresholds or a single scenario [69,70].
4.6. Limitations and Future Perspectives
Although XGBoost delivers strong predictive performance, its “black-box” nature limits interpretability of the underlying physical mechanisms. Future work may integrate machine learning with process-based physical models to enhance explanatory capability. The use of actual rainfall data also introduces spatial heterogeneity, which may generate uncertainties in the hazard zonation results.
Hyperparameters in this study were selected through empirical knowledge and manual tuning; while adequate for supporting the main conclusions, more systematic optimization—such as using automated frameworks like Optuna—could further improve model performance. Moreover, the current analysis does not include longer return-period rainfall scenarios. Extending the framework to 50–100-year extreme events would improve long-term hazard characterization and strengthen its applicability under climate-change conditions.
Given the constraints related to data resolution, rainfall scenario coverage, and model interpretability, future studies should combine high-resolution UAV data, climate model projections, and physically based models to further improve both predictive accuracy and mechanistic understanding. These efforts will help refine the landslide hazard assessment framework for mountainous regions in Southwest China and support more effective disaster risk reduction under changing climate conditions.
5. Conclusions
Taking Yongren County, Yunnan Province, as a case study, this research addresses the limitations of traditional landslide assessments under rainfall forcing—namely insufficient model accuracy and single-scenario settings—by developing an integrated evaluation framework of “high-precision susceptibility–multi-scenario driving–dynamic hazard assessment.”
- (1)
- Eight controlling factors, including lithology, slope, terrain relief, distance to faults, distance to rivers, distance to roads, vegetation cover, and elevation, were selected as evaluation indicators. Correlation and variance inflation factor (VIF < 5) analyses confirmed the good independence of these variables. Three machine learning models, Random Forest (RF), Support Vector Machine (SVM), and Extreme Gradient Boosting (XGBoost), were applied for landslide susceptibility mapping. Among them, XGBoost demonstrated the best predictive performance (AUC = 0.934), effectively capturing the nonlinear relationships between conditioning factors and landslide occurrence. This high-precision modeling capability provides a scientific foundation for sustainable land-use planning and infrastructure resilience.
- (2)
- Based on three representative rainfall scenarios (normal rainfall, 10-year return, and 20-year return), the results reveal that with increasing rainfall intensity, the proportion of very high hazard zones expands markedly from 2.5% under normal rainfall to 13.6% and 18.3% under the 10-year and 20-year events, respectively. The dominant spatial drivers shift from anthropogenic disturbances to coupled natural–human interactions. A lithology-dependent slope threshold was identified, beyond which the probability of landslides rises sharply. Under extreme rainfall, the protective effect of vegetation cover weakens significantly, while landslide hotspots tend to cluster near fault zones and river systems. These findings enable proactive and sustainable disaster risk management strategies that can adapt to changing climate conditions.
- (3)
- Furthermore, the quantitative relationship between rainfall intensity and the expansion of extremely high hazard zones was established—each increase in rainfall level corresponds to an approximate 11% growth in the extremely high hazard area. This quantifiable relationship serves as a critical sustainability indicator for monitoring and evaluating landslide risk trends under future climate scenarios. These results offer robust technical support for early-warning efforts, targeted risk mitigation, and regional hazard governance in comparable mountainous regions, supporting evidence-based policy-making for sustainable development and resource optimization in disaster-prone regions. The transferable framework developed in this study offers a practical sustainability tool for dynamic hazard monitoring and integrated risk governance, contributing to the global agenda of building resilient and sustainable communities.
Author Contributions
Conceptualization, Z.Z. and S.T.; methodology, Z.Z.; software, Z.Z. and A.L.; validation, Z.Z., A.L. and Y.L.; formal analysis, Y.L.; investigation, W.Z.; resources, S.T.; data curation, Z.Z.; writing—original draft preparation, Z.Z. and A.L.; writing—review and editing, S.T. and Z.Z.; visualization, A.L.; supervision, Y.L.; project administration, W.Z.; funding acquisition, S.T. All authors have read and agreed to the published version of the manuscript.
Funding
This research was funded by the Practical Innovation Project of Postgraduate Students in the Professional Degree of Yunnan University, grant number ZC-24249445 and the Key Research and Development Program of Yunnan Province, grant number 202303AP140020.
Institutional Review Board Statement
Not applicable.
Informed Consent Statement
Not applicable.
Data Availability Statement
The digital elevation model (DEM) data were obtained from the Geospatial Data Cloud platform at https://www.gscloud.cn/ (accessed on 26 April 2025). The landslide inventory data were sourced from the Resource and Environmental Science Data Platform at https://www.resdc.cn/ (accessed on 10 June 2025). The 1:200,000-scale geological maps were acquired from the Geological Remote Sensing and Ecology Network platform at http://www.gisrs.cn/ (accessed on 20 June 2025). The rainfall data were obtained from the National Tibetan Plateau Data Center at https://data.tpdc.ac.cn/ (accessed on 21 September 2025).The rivers and road network data were sourced from the National Geoinformation Resource Catalog Service System at https://www.webmap.cn/ (accessed on 15 July 2025).
Acknowledgments
I would like to express my sincere gratitude to all those who provided valuable guidance, insightful suggestions, and continuous encouragement throughout the course of this research. I am also deeply thankful to the members of the laboratory for their assistance in data collection, technical support, and constructive discussions, which have greatly contributed to improving the quality of this work.
Conflicts of Interest
The authors declare no conflicts of interest.
References
- Wang, T.; Tang, C.-S.; Zeng, Z.-X.; Cheng, Q.; Pan, X.-H.; Han, X.-X.; Li, L.; Wei, Y. Rainfall-Induced Landslide Risk: The State of the Art and Future Needs. Environ. Earth Sci. 2025, 84, 535. [Google Scholar] [CrossRef]
- Ng, C.W.W.; Yang, B.; Liu, Z.Q.; Kwan, J.S.H.; Chen, L. Spatiotemporal Modelling of Rainfall-Induced Landslides Using Machine Learning. Landslides 2021, 18, 2499–2514. [Google Scholar] [CrossRef]
- Yuan, R.; Chen, J. A Novel Method Based on Deep Learning Model for National-Scale Landslide Hazard Assessment. Landslides 2023, 20, 2379–2403. [Google Scholar] [CrossRef]
- Wu, Y.; Xu, A.; Hou, L.; Liu, F.; Lou, C.; Yan, Q. Landslide Susceptibility Assessment in Zhenan County Based on InSAR and Integrated Information Value Multi Scale Convolutional Neural Network. Discov. Geosci. 2025, 3, 182. [Google Scholar] [CrossRef]
- Guo, Z.; He, J.; Huang, D.; Zhou, Y.; Zhu, Y. Fast Assessment Model for Rainfall-Induced Shallow Landslide Hazard and Application. Chin. J. Rock Mech. Eng. 2023, 42, 1188–1201. [Google Scholar] [CrossRef]
- Han, Y.; Semnani, S.J. Integration of Physics-based and Data-driven Approaches for Landslide Susceptibility Assessment. Int. J. Numer. Anal. Methods Geomech. 2025, 49, 3060–3097. [Google Scholar] [CrossRef]
- Wang, J.; Peng, X.-g. GIS-Based Landslide Hazard Zonation Model and Its Application. Procedia Earth Planet. Sci. 2009, 1, 1198–1204. [Google Scholar] [CrossRef]
- Toprak, A.; Yükseler, U.; Yildizhan, E. Success of Machine Learning and Statistical Methods in Predicting Landslide Hazard: The Case of Elazig (Maden). Arab. J. Geosci. 2024, 17, 275. [Google Scholar] [CrossRef]
- Abdelkader, M.M.; Csámer, Á. Comparative Assessment of Machine Learning Models for Landslide Susceptibility Mapping: A Focus on Validation and Accuracy. Nat. Hazard. 2025, 121, 10299–10321. [Google Scholar] [CrossRef]
- Catani, F.; Lagomarsino, D.; Segoni, S.; Tofani, V. Landslide Susceptibility Estimation by Random Forests Technique: Sensitivity and Scaling Issues. Nat. Hazards Earth Syst. Sci. 2013, 13, 2815–2831. [Google Scholar] [CrossRef]
- Ada, M.; San, B.T. Comparison of Machine-Learning Techniques for Landslide Susceptibility Mapping Using Two-Level Random Sampling (2LRS) in Alakir Catchment Area, Antalya, Turkey. Nat. Hazard. 2018, 90, 237–263. [Google Scholar] [CrossRef]
- Maharani, S.; Lubis, A.M.; Yuliza, E.; Samdara, R.; Setiadi, B. Landslide Susceptibility Mapping along Taba Penanjung Area, Bengkulu Province, Indonesia Using Machine Learning (ML) Techniques. Spatial Inf. Res. 2025, 33, 45. [Google Scholar] [CrossRef]
- Lee, S.; Hong, S.-M.; Jung, H.-S. A Support Vector Machine for Landslide Susceptibility Mapping in Gangwon Province, Korea. Sustainability 2017, 9, 48. [Google Scholar] [CrossRef]
- Bilgilioğlu, H. A Comparison of Different Machine Learning Models for Landslide Susceptibility Mapping in Rize (Türkiye). Baltica 2023, 36, 115–132. [Google Scholar] [CrossRef]
- Can, R.; Kocaman, S.; Gokceoglu, C. A Comprehensive Assessment of XGBoost Algorithm for Landslide Susceptibility Mapping in the Upper Basin of Ataturk Dam, Turkey. Appl. Sci. 2021, 11, 4993. [Google Scholar] [CrossRef]
- Yavuz Ozalp, A.; Akinci, H.; Zeybek, M. Comparative Analysis of Tree-Based Ensemble Learning Algorithms for Landslide Susceptibility Mapping: A Case Study in Rize, Turkey. Water 2023, 15, 2661. [Google Scholar] [CrossRef]
- Abdo, H.G.; Richi, S.M.; Prasad, P.; Katipoğlu, O.M.; Halder, B.; Niknam, A.; Hang, H.T.; Alharbi, M.M.; Mallick, J. Mapping-Landslide-Susceptibility-in-the-Eastern-Mediterranean-Mountainous-Region-a-Machine-Learning-Perspective. Environ. Earth Sci. 2025, 84, 250. [Google Scholar] [CrossRef]
- Badola, S.; Pandey, M.; Mishra, V.N.; Parkash, S.; Zhran, M. Landslide Susceptibility Mapping in Complex Topo-Climatic Himalayan Terrain, India Using Machine Learning Models: A Comparative Study of XGBoost, RF and ANN. Geol. J. 2025, 60, 2331–2350. [Google Scholar] [CrossRef]
- Wu, H.; Zhou, C.; Liang, X.; Yuan, P.; Yu, L. Assessment of Landslide Susceptibility Mapping Based on XGBoost Model: A Case Study of Yanshan Township. Chin. J. Geol. Hazard Control 2023, 34, 141–152. [Google Scholar] [CrossRef]
- Zeng, T.; Wu, L.; Hayakawa, Y.S.; Yin, K.; Gui, L.; Jin, B.; Guo, Z.; Peduto, D. Advanced Integration of Ensemble Learning and MT-InSAR for Enhanced Slow-Moving Landslide Susceptibility Zoning. Eng. Geol. 2024, 331, 107436. [Google Scholar] [CrossRef]
- Yan, C.; Gong, D. Assessing Framework of Rainfall-Induced Landslide Hazard Considering Spatiotemporal Asymmetry in Extreme Precipitation Indices under Climate Change. Theor. Appl. Climatol. 2024, 155, 7961–7975. [Google Scholar] [CrossRef]
- Guo, Z.; Cheng, M.; Wang, Y.; Xu, G.; Zhang, Y.; Xu, C. Landslide Hazard Prediction under an Extreme Rainfall Scenario by Considering Multiple Timescale Rainfalls and Effective Recharge. Georisk Assess. Manag. Risk Eng. Syst. Geohazards 2025, 19, 751–754. [Google Scholar] [CrossRef]
- Chen, H.X.; Zhang, S.; Peng, M.; Zhang, L.M. A Physically-Based Multi-Hazard Risk Assessment Platform for Regional Rainfall-Induced Slope Failures and Debris Flows. Eng. Geol. 2016, 203, 15–29. [Google Scholar] [CrossRef]
- Feng, W.; Tang, Y.; Hong, B. Landslide Hazard Assessment Methods along Fault Zones Based on Multiple Working Conditions: A Case Study of the Lixian–Luojiabu Fault Zone in Gansu Province (China). Sustainability 2022, 14, 8098. [Google Scholar] [CrossRef]
- Huang, F.; Chen, J.; Liu, W.; Huang, J.; Hong, H.; Chen, W. Regional Rainfall-Induced Landslide Hazard Warning Based on Landslide Susceptibility Mapping and a Critical Rainfall Threshold. Geomorphology 2022, 408, 108236. [Google Scholar] [CrossRef]
- Zeng, T.; Gong, Q.; Wu, L.; Zhu, Y.; Yin, K.; Peduto, D. Double-Index Rainfall Warning and Probabilistic Physically Based Model for Fast-Moving Landslide Hazard Analysis in Subtropical-Typhoon Area. Landslides 2024, 21, 753–773. [Google Scholar] [CrossRef]
- Nguyen, H.-H.-D.; Pradhan, A.M.S.; Song, C.-H.; Lee, J.-S.; Kim, Y.-T. A Hybrid Approach Combining Physics-Based Model with Extreme Value Analysis for Temporal Probability of Rainfall-Triggered Landslide. Landslides 2025, 22, 149–168. [Google Scholar] [CrossRef]
- Zhang, Y.; Ayyub, B.M.; Gong, W.; Tang, H. Risk Assessment of Roadway Networks Exposed to Landslides in Mountainous Regions—A Case Study in Fengjie County, China. Landslides 2023, 20, 1419–1431. [Google Scholar] [CrossRef]
- Chen, X.; Wang, Y.; Wang, X.; Li, Y.; Qi, J.; Lin, Q. Risk Assessment of Landslide Casualty under Incomplete Information—Tienshan and Kunlun Mountainous Regions of Central Asia. Int. J. Disaster Risk Reduct. 2025, 116, 105057. [Google Scholar] [CrossRef]
- Zhang, J.; Ma, X.; Zhang, J.; Sun, D.; Zhou, X.; Mi, C.; Wen, H. Insights into Geospatial Heterogeneity of Landslide Susceptibility Based on the SHAP-XGBoost Model. J. Environ. Manag. 2023, 332, 117357. [Google Scholar] [CrossRef]
- Pawłuszek-Filipiak, K.; Lewandowski, T. The Impact of Feature Selection on XGBoost Performance in Landslide Susceptibility Mapping Using an Extended Set of Features: A Case Study from Southern Poland. Appl. Sci. 2025, 15, 8955. [Google Scholar] [CrossRef]
- Papa, M.N.; Medina, V.; Ciervo, F.; Bateman, A. Derivation of Critical Rainfall Thresholds for Shallow Landslides as a Tool for Debris Flow Early Warning Systems. Hydrol. Earth Syst. Sci. 2013, 17, 4095–4107. [Google Scholar] [CrossRef]
- Breiman, L. Random Forests. Mach. Learn. 2001, 45, 5–32. [Google Scholar] [CrossRef]
- Hastie, T.; Tibshirani, R.; Friedman, J. Random Forests. In The Elements of Statistical Learning: Data Mining, Inference, and Prediction; Hastie, T., Tibshirani, R., Friedman, J., Eds.; Springer: New York, NY, USA, 2009; pp. 587–604. ISBN 978-0-387-84858-7. [Google Scholar]
- Nasien, D.; Yuhaniz, S.S.; Haron, H. Statistical Learning Theory and Support Vector Machines. In Proceedings of the 2010 Second International Conference on Computer Research and Development, Kuala Lumpur, Malaysia, 7–10 May 2010; pp. 760–764. [Google Scholar]
- Hong, H.; Pradhan, B.; Bui, D.T.; Xu, C.; Youssef, A.M.; Chen, W. Comparison of Four Kernel Functions Used in Support Vector Machines for Landslide Susceptibility Mapping: A Case Study at Suichuan Area (China). Geomat. Nat. Hazards Risk 2017, 8, 544–569. [Google Scholar] [CrossRef]
- Ado, M.; Amitab, K.; Maji, A.K.; Jasińska, E.; Gono, R.; Leonowicz, Z.; Jasiński, M. Landslide Susceptibility Mapping Using Machine Learning: A Literature Survey. Remote Sens. 2022, 14, 3029. [Google Scholar] [CrossRef]
- Zhou, S.; Fang, L. Support Vector Machine Modeling of Earthquake-Induced Landslides Susceptibility in Central Part of Sichuan Province, China. Geoenviron. Disasters 2015, 2, 2. [Google Scholar] [CrossRef]
- Chen, T.; Guestrin, C. XGBoost: A Scalable Tree Boosting System. In Proceedings of the 22nd ACM SIGKDD International Conference on Knowledge Discovery and Data Mining, San Francisco, CA, USA, 13–17 August 2016; Association for Computing Machinery: New York, NY, USA, 2016; pp. 785–794. [Google Scholar]
- Rondinone, M.; Dal Sasso, S.F.; Aung, H.H.; Contillo, L.; Dimola, G.; Schiattarella, M.; Fiorentino, M.; Telesca, V. Assessing Flood and Landslide Susceptibility Using XGBoost: Case Study of the Basento River in Southern Italy. Appl. Sci. 2025, 15, 5290. [Google Scholar] [CrossRef]
- Tang, Z.; Qiu, S.; Xia, H.; Lin, D.; Bai, M. Comparative Performance of Machine Learning Models for Landslide Susceptibility Assessment: Impact of Sampling Strategies in Highway Buffer Zone. Appl. Sci. 2025, 15, 8416. [Google Scholar] [CrossRef]
- Hua, Y.; Wang, X.; Li, Y.; Xu, P.; Xia, W. Dynamic Development of Landslide Susceptibility Based on Slope Unit and Deep Neural Networks. Landslides 2021, 18, 281–302. [Google Scholar] [CrossRef]
- Jiang, J.; Hu, Y.; Zheng, D.; Lyu, L. Disaster Risk Assessment of Collapses and Landslides in a Hilly Coastal City: The Role of Rainfall Triggers and the Disaster-Inducing Environment. Nat. Hazards 2025, 121, 21683–21704. [Google Scholar] [CrossRef]
- Liu, S.; Wang, L.; Zhang, W.; Sun, W.; Fu, J.; Xiao, T.; Dai, Z. A Physics-Informed Data-Driven Model for Landslide Susceptibility Assessment in the Three Gorges Reservoir Area. Geosci. Front. 2023, 14, 101621. [Google Scholar] [CrossRef]
- Aiswarya, L.; Rema, K.P.; Shyla, J.; Brijesh, V.K.; Vaisakh, V. Landslide Susceptibility Mapping of Chaliyar River Basin by Multivariate Statistical Model. J. Exp. Agric. Int. 2023, 45, 23–35. [Google Scholar] [CrossRef]
- Tang, Y.; Feng, F.; Guo, Z.; Feng, W.; Li, Z.; Wang, J.; Sun, Q.; Ma, H.; Li, Y. Integrating Principal Component Analysis with Statistically-Based Models for Analysis of Causal Factors and Landslide Susceptibility Mapping: A Comparative Study from the Loess Plateau Area in Shanxi (China). J. Clean. Prod. 2020, 277, 124159. [Google Scholar] [CrossRef]
- Zhou, H.; Che, A.; Li, G. Characteristics and Failure Mechanism of Landslides along Highways Triggered by 2021 Ms6.4 Yangbi Earthquake. Landslides 2022, 19, 165–176. [Google Scholar] [CrossRef]
- Kong, D.; Wu, F.; Saroglou, C. Automatic Identification and Characterization of Discontinuities in Rock Masses from 3D Point Clouds. Eng. Geol. 2020, 265, 105442. [Google Scholar] [CrossRef]
- Zhang, L.; Guo, Z.; Qi, S.; Zhao, T.; Wu, B.; Li, P. Landslide Susceptibility Evaluation and Determination of Critical Influencing Factors in Eastern Sichuan Mountainous Area, China. Ecol. Indic. 2024, 169, 112911. [Google Scholar] [CrossRef]
- Zhu, L.; He, S.; Qin, H.; He, W.; Zhang, H.; Zhang, Y.; Jian, J.; Li, J.; Su, P. Analyzing the Multi-Hazard Chain Induced by a Debris Flow in Xiaojinchuan River, Sichuan, China. Eng. Geol. 2021, 293, 106280. [Google Scholar] [CrossRef]
- Huang, Y.; Lin, J.; He, X.; Lin, Z.; Wu, Z.; Zhang, X. Assessing the Scale Effect of Urban Vertical Patterns on Urban Waterlogging: An Empirical Study in Shenzhen. Environ. Impact Assess. Rev. 2024, 106, 107486. [Google Scholar] [CrossRef]
- Yang, L.; Cui, Y.; Xu, C.; Ma, S. Application of Coupling Physics–Based Model TRIGRS with Random Forest in Rainfall-Induced Landslide-Susceptibility Assessment. Landslides 2024, 21, 2179–2193. [Google Scholar] [CrossRef]
- Lin, G.-F.; Chang, M.-J.; Huang, Y.-C.; Ho, J.-Y. Assessment of Susceptibility to Rainfall-Induced Landslides Using Improved Self-Organizing Linear Output Map, Support Vector Machine, and Logistic Regression. Eng. Geol. 2017, 224, 62–74. [Google Scholar] [CrossRef]
- Sunil, L.S.; Abraham, M.T.; Satyam, N. Mapping Built-up Area Expansion in Landslide Susceptible Zones Using Automatic Land Use/Land Cover Classification. J. Earth Syst. Sci. 2024, 133, 132. [Google Scholar] [CrossRef]
- Zhao, F.; Miao, F.; Wu, Y.; Ke, C.; Gong, S.; Ding, Y. Refined Landslide Susceptibility Mapping in Township Area Using Ensemble Machine Learning Method under Dataset Replenishment Strategy. Gondwana Res. 2024, 131, 20–37. [Google Scholar] [CrossRef]
- Zhao, Z.; Xu, Z.; Hu, C.; Wang, K.; Ding, X. Geographically Weighted Neural Network Considering Spatial Heterogeneity for Landslide Susceptibility Mapping: A Case Study of Yichang City, China. CATENA 2024, 234, 107590. [Google Scholar] [CrossRef]
- Wei, R.; Ye, C.; Ge, Y.; Li, Y. An Attention-Constrained Neural Network with Overall Cognition for Landslide Spatial Prediction. Landslides 2022, 19, 1087–1099. [Google Scholar] [CrossRef]
- Ghasemi, M.; Ghaffarian, S.; Karimzadeh, S.; Matsuoka, M.; Miura, H.; Feizizadeh, B. Evaluating Multi-Hazard Preparedness for a Major Earthquake: A Case Study of Tabriz City (NW Iran). Int. J. Disaster Risk Reduct. 2025, 116, 105086. [Google Scholar] [CrossRef]
- Zhang, S.; Tan, S.; Geng, H.; Li, R.; Sun, Y.; Li, J. Evaluation of Geological Hazard Risk in Yiliang County, Yunnan Province, Using Combined Assignment Method. Sustainability 2023, 15, 13978. [Google Scholar] [CrossRef]
- Wu, W.; Guo, S.; Shao, Z. Landslide Risk Evaluation and Its Causative Factors in Typical Mountain Environment of China: A Case Study of Yunfu City. Ecol. Indic. 2023, 154, 110821. [Google Scholar] [CrossRef]
- Singh, M.; Khajuria, V.; Singh, S.; Singh, K. Landslide Susceptibility Evaluation in the Beas River Basin of North-Western Himalaya: A Geospatial Analysis Employing the Analytical Hierarchy Process (AHP) Method. Quat. Sci. Adv. 2024, 14, 100180. [Google Scholar] [CrossRef]
- Ge, Y.; Liu, G.; Tang, H.; Zhao, B.; Xiong, C. Comparative Analysis of Five Convolutional Neural Networks for Landslide Susceptibility Assessment. Bull. Eng. Geol. Environ. 2023, 82, 377. [Google Scholar] [CrossRef]
- Ahmed, M.; Tanyas, H.; Huser, R.; Dahal, A.; Titti, G.; Borgatti, L.; Francioni, M.; Lombardo, L. Dynamic Rainfall-Induced Landslide Susceptibility: A Step towards a Unified Forecasting System. Int. J. Appl. Earth Obs. Geoinf. 2023, 125, 103593. [Google Scholar] [CrossRef]
- Lee, S.-M.; Lee, S.-J. Landslide Susceptibility Assessment of South Korea Using Stacking Ensemble Machine Learning. Geoenviron. Disasters 2024, 11, 7. [Google Scholar] [CrossRef]
- Hürlimann, M.; Guo, Z.; Puig-Polo, C.; Medina, V. Impacts of Future Climate and Land Cover Changes on Landslide Susceptibility: Regional Scale Modelling in the Val d’aran Region (Pyrenees, Spain). Landslides 2022, 19, 99–118. [Google Scholar] [CrossRef]
- Zhang, A.; Zhao, X.; Zhao, X.; Zheng, X.; Zeng, M.; Huang, X.; Wu, P.; Jiang, T.; Wang, S.; He, J.; et al. Comparative Study of Different Machine Learning Models in Landslide Susceptibility Assessment: A Case Study of Conghua District, Guangzhou, China. China Geol. 2024, 7, 104–115. Available online: https://www.sciencedirect.com/science/article/pii/S2096519224000594 (accessed on 10 June 2025).
- Wu, Y.; Lan, H.; Gao, X.; Li, L.; Yang, Z. A Simplified Physically Based Coupled Rainfall Threshold Model for Triggering Landslides. Eng. Geol. 2015, 195, 63–69. [Google Scholar] [CrossRef]
- Wang, S.; Cui, Y.; Wei, M.; Zhang, L.; Ran, D. Research Progress on the Impact of Rainfall on Slope Stability. Adv. Porous Flow 2023, 12, 21–31. [Google Scholar] [CrossRef]
- Monsieurs, E.; Dewitte, O.; Demoulin, A. A Susceptibility-Based Rainfall Threshold Approach for Landslide Occurrence. Nat. Hazards Earth Syst. Sci. 2019, 19, 775–789. [Google Scholar] [CrossRef]
- Xu, Z.; Xiao, Z.; Zhao, X.; Ma, Z.; Zhang, Q.; Zeng, P.; Zhang, X. Derivation of Landslide Rainfall Thresholds by Geostatistical Methods in Southwest China. Sustainability 2024, 16, 4044. [Google Scholar] [CrossRef]
Disclaimer/Publisher’s Note: The statements, opinions and data contained in all publications are solely those of the individual author(s) and contributor(s) and not of MDPI and/or the editor(s). MDPI and/or the editor(s) disclaim responsibility for any injury to people or property resulting from any ideas, methods, instructions or products referred to in the content. |
© 2025 by the authors. Licensee MDPI, Basel, Switzerland. This article is an open access article distributed under the terms and conditions of the Creative Commons Attribution (CC BY) license (https://creativecommons.org/licenses/by/4.0/).