Abstract
Decarbonizing heavy-duty freight transport is essential for achieving climate neutrality targets. Although internal combustion engine (ICE) trucks currently dominate logistics, they contribute substantially to greenhouse gas emissions. Zero-emission alternatives, such as battery electric vehicles (BEVs) and hydrogen fuel cell vehicles (H2), provide different decarbonization pathways; however, their relative roles remain contested, particularly in small economies. While BEVs benefit from technological maturity and declining costs, hydrogen offers advantages for high-payload, long-haul operations, especially within energy-intensive cold supply chains. The aim of this paper is to examine the gradual transition from ICE trucks to hydrogen-powered vehicles with a specific focus on cold-chain logistics, where reliability and energy intensity are critical. The hypothesis is that applying a system dynamics forecasting approach, incorporating investment costs, infrastructure coverage, government support, and technological progress, can more effectively guide transition planning than traditional linear methods. To address this, the study develops a system dynamics economic model tailored to the structural characteristics of a small economy, using a European case context. Small markets face distinct constraints: limited fleet sizes reduce economies of scale, infrastructure deployment is disproportionately costly, and fiscal capacity to support subsidies is restricted. These conditions increase the risk of technology lock-in and emphasize the need for coordinated, adaptive policy design. The model integrates acquisition and maintenance costs, fuel consumption, infrastructure rollout, subsidy schemes, industrial hydrogen demand, and technology learning rates. It incorporates subsystems for fleet renewal, hydrogen refueling network expansion, operating costs, industrial demand linkages, and attractiveness functions weighted by operator decision preferences. Reinforcing and balancing feedback loops capture the dynamic interactions between fleet adoption and infrastructure availability. Inputs combine fixed baseline parameters with variable policy levers such as subsidies, elasticity values, and hydrogen cost reduction rates. Results indicate that BEVs are structurally more favorable in small economies due to lower entry costs and simpler infrastructure requirements. Hydrogen adoption becomes viable only under scenarios with strong, sustained subsidies, accelerated station deployment, and sufficient cross-sectoral demand. Under favorable conditions, hydrogen can approach cost and attractiveness parity with BEVs. Overall, market forces alone are insufficient to ensure a balanced zero-emission transition in small markets; proactive and continuous government intervention is required for hydrogen to complement rather than remain secondary to BEV uptake. The novelty of this study lies in the development of a system dynamics model specifically designed for small-economy conditions, integrating industrial hydrogen demand, policy elasticity, and infrastructure coverage limitations, factors largely absent from the existing literature. Unlike models focused on large markets or single-sector applications, this approach captures cross-sector synergies, small-scale cost dynamics, and subsidy-driven points, offering a more realistic framework for hydrogen truck deployment in small-country environments. The model highlights key leverage points for policymakers and provides a transferable tool for guiding freight decarbonization strategies in comparable small-market contexts.
1. Introduction
Freight transport decarbonization is one of the most pressing challenges for achieving climate neutrality in Europe and globally. Heavy-duty trucks account for a significant share of greenhouse gas (GHG) emissions and rely almost exclusively on diesel-powered internal combustion engines (ICEs). Zero-emission technologies, particularly battery electric vehicles (BEVs) and hydrogen fuel cell vehicles (H2), will play a crucial role in reducing emissions. While both options hold promise, the path forward remains contested, especially for freight sectors where long range, high payload, and reliability are essential, such as the cold supply chain.
This study focuses on small economies, where transition dynamics differ from larger markets. Countries with limited fleet sizes and constrained fiscal capacities face unique challenges; infrastructure investment is disproportionately expensive, subsidies cannot be maintained indefinitely, and economies of scale are harder to achieve. In such contexts, carefully designed policies and forecasting models are essential for avoiding technology lock-in and ensuring efficient use of limited resources. By examining the specific case of heavy-duty transport in a small country, this study contributes insights that are broadly applicable across Europe’s smaller markets, which represent a substantial portion of the transport sector.
Hydrogen fuel cell technology has attracted growing interest due to its potential to combine long driving range, short refueling times, and compatibility with high-intensity freight operations. However, high initial investment costs, lack of refueling infrastructure, and uncertain production costs remain significant barriers. In contrast, BEVs benefit from faster technological maturation, declining battery costs, and expanding charging networks, making them more attractive in urban and regional applications. These differences raise questions regarding hydrogen’s ability to compete with electric alternatives and whether its role will remain niche. Some researchers argue that BEVs will dominate due to superior efficiency and cost trajectories, while others highlight hydrogen’s unique suitability for heavy-duty, long-haul, and multi-shift operations. This controversy underscores the need for model-based approaches that can capture complex interactions between technology, infrastructure, and policy.
The purpose of this study is to develop an economic model for the gradual transition from ICE trucks to hydrogen fuel cell vehicles. The significance of this work lies not only in its relevance to Latvia and the Baltic region but also in demonstrating how small economies can design transition strategies that balance limited fiscal capacity with ambitious decarbonization goals.
The central hypothesis is that the application of economic forecasting methods based on a system dynamics approach, considering initial investment costs, infrastructure development, government policies, and technological advancements, enhances the efficiency of the transition process from ICE trucks to hydrogen vehicles. By modeling reinforcing and balancing feedback loops, the system dynamics framework enables the capture of interdependencies that shape adoption trajectories.
The main aim of the study is to simulate alternative policy and market scenarios to identify the conditions under which hydrogen could emerge as a competitive or complementary zero-emission technology. By doing so, the model provides policymakers and industry stakeholders with insights into leverage points, risks, and trade-offs in the transition process. The proposed system dynamics model differs from existing hydrogen transition studies by explicitly incorporating small-market constraints, cross-sectoral hydrogen demand interactions, and policy elasticity effects often absent in large-market analyses. Unlike previous models that assume strong economies of scale or fully developed infrastructure, this approach captures the structural limitations of small economies, where investment capacity is low and infrastructure coverage requirements are disproportionate.
Although previous studies have examined hydrogen vehicle adoption, refueling infrastructure planning, and total-cost-of-ownership comparisons, existing models rarely capture the structural conditions specific to small economies. Most forecasting approaches assume large markets with strong economies of scale, linear demand growth, or uniform consumer behavior, overlooking constraints such as limited fleet sizes, high per-station infrastructure costs, and fiscally restricted subsidy schemes. Moreover, model-based studies seldom integrate cross-sectoral hydrogen demand, policy elasticity, or dynamic interactions between industrial and transport uses of hydrogen. This creates a gap in understanding how hydrogen competitiveness evolves when scale effects are weak and policy interventions are intermittent. The present study addresses this gap by developing a system dynamics model that explicitly incorporates small-market constraints, industrial hydrogen linkages, and policy-driven feedback loops that shape long-term technology adoption.
The results show that hydrogen adoption in small economies is highly sensitive to government subsidies, infrastructure rollout speed, and industrial demand synergies. Without strong and sustained policy support, BEVs are likely to dominate due to lower initial costs and faster technology learning. However, targeted subsidies, coordinated infrastructure planning, and cross-sectoral hydrogen use can enable hydrogen to become a viable co-dominant technology. Importantly, the study illustrates that in small markets, transition outcomes cannot be left to market forces alone, as proactive interventions are essential for shaping balanced technological pathways.
In summary, this study situates the hydrogen truck transition within the broader context of climate policy and freight decarbonization, highlights the challenges faced by small economies, and advances a novel system dynamics model tailored to these conditions. The insights generated are intended to inform both national policy and EU-wide strategies for achieving sustainable freight transport.
2. Literature Review
2.1. Model-Based Adoption of H2 Freight Vehicles
This subsection summarizes the literature on H2 freight transport adoption trends and challenges, focusing on technological efficiency, government support mechanisms, production and infrastructure challenges, and competitiveness. The development of hydrogen technologies in the freight sector is increasingly analyzed using model-based approaches, which make it possible to understand both adoption barriers and potential benefits. The literature indicates that this process depends on the interaction of multiple factors, including environmental requirements, technological innovations, economic costs, and policy instruments. For this reason, system dynamics and other modeling tools have become essential, as they help uncover feedback loops, forecast demand development, and identify scenarios in which hydrogen freight vehicles may become competitive compared to traditional or battery electric vehicles.
The adoption of hydrogen freight vehicles in logistics and freight transport is determined by environmental, technological, and economic factors. Researchers consistently emphasize that environmental goals, particularly greenhouse gas (GHG) reduction requirements, create a strong incentive for the development of low-carbon freight transport technologies [1,2,3,4]. Hydrogen freight vehicles can reduce GHG emissions by 20–45% compared to diesel vehicles, with the potential for even greater reductions if hydrogen is produced from renewable resources [1,2]. At the same time, significant barriers remain, e.g., high upfront costs, insufficient refueling infrastructure, and competition with battery electric vehicles [5,6,7,8,9]. These trade-offs make H2 adoption a systemic issue requiring coordinated policy and industry actions, rendering it particularly suitable for model-based exploration of feedback loops and adoption curves. The following sections examine specific aspects necessary for modeling.
Autonomy and efficiency of H2 freight vehicles and trends in H2 production. Hydrogen freight vehicles have specific performance advantages in terms of driving range and suitability for long-distance transport. Studies show that H2-powered engines and fuel cells in optimized systems achieve efficiencies of up to 50%, while hybridization improves average efficiency above 35% in driving cycles [10]. Moreover, polymer electrolyte membrane fuel cells, originally developed for light-duty vehicles, are being adapted for heavy-duty applications, increasing both durability and efficiency [11]. Compared to BEVs, hydrogen freight vehicles provide longer driving ranges (up to 570 km per refueling), while BEVs with comparable payload capacity reach only 200–250 km [12]. This autonomy makes hydrogen competitive in freight sectors with high mileage and low tolerance for downtime.
The competitiveness of hydrogen freight vehicles is closely linked to hydrogen’s production and development. Costs are declining due to improvements in electrolysis technologies and integration with renewable energy. Forecasts indicate that by 2050, renewable hydrogen could reach USD 70–80/MWh, making it competitive with fossil-based production [13]. Solid oxide electrolysis cells and other high-efficiency methods could reduce costs to as low as USD 5/GJ [14]. Geographic factors are significant; for example, in Germany and Texas, renewable hydrogen is already approaching competitiveness in niche markets [15]. Therefore, production cost reduction is a cornerstone in most forward-looking adoption models.
Ref. [9] provides a comprehensive global assessment of hydrogen fuel cell vehicle technologies, covering fuel cell types, hydrogen storage methods, refueling infrastructure, and emerging trends such as AI and quantum-enhanced optimization. It highlights the rapid technological progress and the current dominance of passenger H2 vehicles in markets such as South Korea and the United States, and the persistent barriers related to infrastructure costs, component durability, and system efficiency. The review underscores that large-scale H2 adoption will require sustained investment, coordinated policy support, and cross-sector collaboration, reinforcing the broader systemic challenges associated with hydrogen mobility.
H2 refueling infrastructure and competitiveness against other vehicle types. The location and density of hydrogen refueling stations (HRSs) directly affect adoption curves. Strategic placement along intercity freight corridors is critically important, as long-haul operators require reliable systems with minimal detours [16]. Pipeline-based supply approaches provide long-term stability, while truck-delivered hydrogen reduces initial investment in early adoption stages [17,18]. Studies confirm that adoption is closely tied to a bidirectional feedback loop between infrastructure availability and fleet expansion [19]. However, building a nationwide refueling station network is financially challenging, requiring public–private partnerships and innovative financing models to share risks [20]. Early infrastructure rollout success is thus essential for overcoming adoption inertia.
Hydrogen freight vehicles’ main competitors are BEVs, which currently offer lower ownership costs, especially in urban and regional transport, where mileage requirements are moderate [7,21]. BEVs’ advantages include rapidly advancing battery technologies and expanding charging infrastructure [7]. Therefore, hydrogen’s relative competitiveness is not universal. Instead, it depends on the type of application, infrastructure readiness, and the structure of energy costs. This dynamic competitiveness is a central element in modeling future adoption pathways.
The role of government support and research supporting technological development. Government policy is a key factor in the adoption of hydrogen freight vehicles. Purchase subsidies and refueling station expansion directly affect the pace of market diffusion, and dynamic incentive schemes outperform static subsidies in promoting adoption [3]. Infrastructure investments in countries like Japan, South Korea, and Germany illustrate how coordinated strategies can accelerate deployment [22,23,24]. Moreover, policy measures that integrate hydrogen development with electricity systems, such as spatially optimized subsidies or carbon pricing, can reduce costs and emissions [16]. Without such targeted support, adoption risks becoming stuck between demand and infrastructure [19].
Academic and industrial research continues to strengthen the technological foundations of hydrogen freight transport. Significant attention has been devoted to improving fuel cell durability, refining hybrid powertrain integration, and optimizing energy management systems [11,25]. Infrastructure studies emphasize the development of cost-effective refueling systems and optimized supply chains [9,18]. These findings support both gradual deployment strategies and the long-term technological viability of hydrogen freight transport.
Other relevant studies reinforce the importance of integrated, cross-sector approaches in energy and transport transitions. Advanced renewable systems for co-producing hydrogen and ammonia demonstrate significant thermodynamic and economic potential [4]. Socio-ecological analyses show how adaptive policies shape multi-sector development outcomes [26], while low-carbon dispatching strategies enhance flexibility in renewable-rich energy systems [27]. Additionally, multimodal accessibility models highlight the need for holistic transport planning in complex urban environments [28].
2.2. Review of Modeling Methodologies
This subsection critically evaluates existing research dedicated to hydrogen fuel cell vehicle adoption, infrastructure planning, energy efficiency, and technological modeling, identifying key advancements, methodological approaches, and unresolved challenges. By synthesizing insights across different areas, this review aims to highlight research gaps, assess hydrogen’s competitiveness against alternative technologies, and propose future research directions to support policymaking and strategic investments in hydrogen-based transport systems. The reviewed studies on modeling hydrogen fuel cell technology for transportation can be classified into four thematic groups:
- Market adoption and consumer behavior. These studies emphasize behavioral and policy factors influencing H2 adoption, highlighting the importance of subsidies, taxation, and public awareness campaigns.
- Infrastructure planning and optimization. These studies focus on hydrogen refueling station placement models, emphasizing the need for decentralized green hydrogen production but often assuming static demand growth.
- Energy efficiency and environmental impact. These studies compare hydrogen’s lifecycle performance with battery electric vehicles and internal combustion engine vehicles, revealing that hydrogen’s sustainability is highly dependent on its production.
- Technological development. These studies present advanced optimization frameworks for energy consumption and supply chain management but often rely on hypothetical cost projections.
The following overview presents key studies, highlighting the issues analyzed, the modeling methodologies used, main conclusions, limitations, and identified research gaps.
Ref. [29] addresses the gap in H2 energy consumption modeling, which is essential for transport planning and infrastructure development. They develop a microscopic model estimating instantaneous consumption based on speed, acceleration, and road grade. The results show that H2 can consume less energy than ICEs under certain conditions (e.g., highways). However, the model omits factors like temperature variation and fuel cell degradation, which affect long-term efficiency. The study concludes that the model can support policymakers and engineers but requires refinement for real-world application.
Ref. [30] addresses hydrogen supply chain optimization in Turkey, balancing economic feasibility, carbon emissions, and safety risks. The authors develop a MILP model to test different network configurations. Five scenarios are assessed, including centralized and decentralized networks using both steam methane reforming (SMR) and electrolysis. Results show that decentralized networks with distributed SMR and electrolysis achieve the best balance, reducing costs by 88%, emissions by 10%, and safety risks by 2%. However, assumptions regarding demand growth and policy stability may limit practical applicability, as geopolitical and economic fluctuations are not considered.
Ref. [16] develops a mathematical model for HRS placement for long-haul H2 trucks, addressing infrastructure gaps hindering freight adoption. Using GIS data and MILP methods, the authors optimize station siting along intercity and interstate corridors. The model incorporates hydrogen production technologies, comparing centralized versus on-site solar-to-hydrogen approaches. A North American case study suggests that decentralized renewable HRS networks can reduce operational costs and emissions. However, the model assumes steady demand growth, which may not align with real-world adoption.
Ref. [31] integrates hydrogen supply chain network design with refueling station planning to develop a comprehensive infrastructure model. The key issue addressed is the lack of coordination between production, distribution, and station placement, which hampers large-scale adoption. Using a MILP framework, the study simultaneously optimizes feedstock supply, facility siting, transport logistics, and CCS considerations. A case study in France demonstrates that integration produces a more efficient and lower-cost supply network. However, the study assumes predictable demand growth, which may not reflect actual adoption rates, and it does not account for potential breakthroughs in alternative fuel technologies.
Ref. [5] analyzes the hydrogen adoption dilemma, wherein consumers are reluctant to buy H2 vehicles due to insufficient refueling infrastructure and investors hesitate to build infrastructure because of low demand. The authors develop a system dynamics model to analyze this interdependence and evaluate policy interventions. Four scenarios are tested, considering adoption, infrastructure development, and market conditions. Results show that coordinated policy, simultaneously incentivizing both vehicle uptake and infrastructure expansion, is the most effective way to accelerate hydrogen market growth. However, the model’s reliance on historical data and theoretical assumptions limits predictive accuracy.
Ref. [32] focuses on optimizing hydrogen infrastructure to enable the transition to a low-carbon transport system in the UK. The primary challenge is the high initial investment required for supply chain infrastructure, including production, storage, and transport. Using a multi-period, spatially explicit mixed-integer linear programming (MILP) model, the authors optimize infrastructure investments over time. The model accounts for economies of scale, transport modes (road and pipeline), and carbon capture and storage (CCS) technologies. It minimizes total costs while ensuring a gradual transition to a sustainable hydrogen economy. Results indicate that a phased approach integrating multiple technologies and transport methods optimizes cost reduction. However, the study does not account for unpredictable market fluctuations or policy changes, nor the uncertainty inherent in long-term cost forecasts.
Ref. [33] investigates consumer acceptance of H2 using a behavioral modeling approach, combining the theory of planned behavior (TPB) and norm activation theory (NAT). Key factors include attitudes, norms, perceived control, and personal norms. Results show the strong influence of perceived benefits (environmental gains, fuel efficiency) and perceived risks (high cost, limited infrastructure). Government interventions, such as subsidies and awareness campaigns, play a crucial role. However, the study relies solely on Malaysian survey data, limiting generalizability, and it does not assess how attitudes evolve over time.
Ref. [34] develops a forecasting model for H2 adoption in South Korea, integrating infrastructure availability and cost reduction effects. Using the generalized Bass diffusion model and a system dynamics simulation, the study assesses how external factors (government subsidies, cost reductions, and station deployment) influence adoption. Sensitivity analysis shows that vehicle cost reduction and denser station networks significantly accelerate uptake. The study offers valuable policy insights but is limited by diffusion models assuming homogeneous consumer behavior, without accounting for BEV competition.
Ref. [35] uses agent-based modeling (ABM) to analyze ICE diffusion in the automotive market. The challenge is consumer reluctance due to inadequate infrastructure, while investors hesitate because of low demand. The model simulates interactions between manufacturers, consumers, and station operators, enabling policy simulations. Results suggest that targeted taxes on conventional cars may be more effective than direct subsidies for ICE adoption. The study highlights the importance of cooperation between manufacturers and operators to accelerate infrastructure rollout. However, it does not account for competing technologies, such as BEVs, and assumes uniform consumer preferences.
Ref. [22] explores regional heterogeneity in ICE adoption in Tokyo, a key factor in effective hydrogen mobility policy. The authors apply an innovative approach, combining real adoption data with the analytic hierarchy process (AHP) to rank factors like performance, cost, fuel availability, and policy support. The methodology is validated with actual ICE sales data, improving credibility. Results reveal substantial regional differences in consumer attitudes and infrastructure development, shaping adoption rates. The study underscores the need for region-specific policies rather than a one-size-fits-all national strategy. It is limited by its narrow geographical scope, which restricts generalization to other contexts.
The reviewed studies provide important insights into H2 adoption, infrastructure planning, energy efficiency, and technological modeling. However, several major gaps remain. A key issue is the lack of empirical validation for many forecasting models. Studies predicting H2 adoption [33,35] rely heavily on theoretical frameworks (e.g., TPB, ABM) without incorporating large-scale consumer or historical adoption data. Similarly, infrastructure planning studies [16,36] use optimization models assuming static or linear demand growth, ignoring unexpected shifts in technology, economics, and policy. Moreover, BEV competition is often overlooked. Many studies compare H2 to ICEs [22,29] but fail to account for rapid battery advancements, expanding charging infrastructure, and declining BEV costs, which directly impact competitiveness. Another gap is the limited evaluation of hydrogen’s economic viability. Some studies assess sustainability but insufficiently address high production, storage, and distribution costs at scale. Even infrastructure models [16,32] focus on optimization while assuming investments will materialize and without analyzing financing models, public–private partnerships, or subsidy schemes. Furthermore, hydrogen production methods are not uniformly assessed; while some highlight renewable hydrogen, few comprehensively compare centralized versus decentralized approaches in real deployment contexts.
3. Methodology and Research Design
This study’s methodology combines qualitative insights from expert interviews with quantitative system dynamics modeling to capture the complexity of transitioning to hydrogen-powered freight transport in a small economy. This mixed-methods approach ensures that both real-world industry perspectives and dynamic economic–technical interactions are integrated into the model’s design and the scenario analysis.
3.1. Expert Interview
Based on a structured interview conducted with three industry experts, several key findings emerged regarding the current state and prospects of hydrogen fuel cell technologies in Latvia and the Baltic region. The insights gained represent typical conditions of a small economy and provide valuable input for the development of a system dynamics model aimed at supporting the transition from internal combustion engine trucks to hydrogen-powered alternatives.
The interview revealed that hydrogen technology in the transport sector is still in its earliest stage in Latvia and the broader Baltic region. Despite the establishment of a hydrogen production facility in one country, utilization remains limited, and the technology in use is already considered outdated. This underscores a broader regional pattern of low development and adoption rates. The lack of clarity on whether supply or demand should be prioritized creates hesitation in investment and development. Experts emphasized the importance of pilot projects to generate data and confidence, as well as the need to articulate clear value propositions for adopting hydrogen technologies.
A critical point raised in the discussion was the comparative positioning of hydrogen versus electric vehicles, particularly for freight transport. While BEVs may have a firmer foothold in urban areas, hydrogen offers distinct advantages in sectors requiring long range, rapid refueling, and continuous use, such as forestry, airports, and mining. Participants agreed that hydrogen infrastructure must serve multiple purposes, including government or municipal needs and those of commercial operations, to be economically viable. Efficient use of infrastructure was repeatedly highlighted, including the importance of minimizing idle times in hydrogen production and distribution systems to achieve economies of scale.
Barriers to wider adoption were identified at both technological and systemic levels. These include high vehicle and fuel costs, insufficient maintenance infrastructure, lack of trained personnel, and underdeveloped certification systems. Hydrogen systems require specialized handling, requiring investment in training and regulatory frameworks. From a technological standpoint, challenges include improving the energy efficiency of hydrogen production (currently around 30–40%) and increasing the availability and utilization of refueling infrastructure. Experts advocated for cross-sector collaboration to boost demand and reduce unit costs, stressing the need for coordinated action across government, industry, and academia.
Policy recommendations included financial incentives, such as road tax reductions and increased CO2 emission penalties for fossil-fueled vehicles. Additionally, experts pointed out the necessity of updating CO2 accounting methodologies to reflect a full “well-to-wheel” perspective. A reliable model must therefore include not only technological parameters but also economic considerations, such as lifecycle costs, energy prices, and total costs of ownership for hydrogen vehicles. Market demand forecasting emerged as a crucial modeling factor, especially given the stagnation in demand growth despite available supply. Finally, to maximize effectiveness and reflect real-world dynamics, the model should integrate hydrogen consumption across both transport and industrial sectors. The concept of a “hydrogen valley,” where multiple consumers in transportation, chemical production, or food processing industries co-locate, was identified as a particularly strategic approach.
In conclusion, the transition to hydrogen-based freight transport in Latvia and the Baltics is technically feasible but will require systemic coordination, policy support, and infrastructure optimization. The system dynamics model should account for infrastructure utilization rates, multi-sector hydrogen demand, lifecycle economics, and evolving policy frameworks. Such a model will serve not only as a research output but also as a strategic tool for guiding stakeholders through a complex and capital-intensive transition towards carbon-neutral logistics systems.
3.2. System Dynamics Model and Causal Diagram
System dynamics provides a methodological framework to capture complex interactions, feedback loops, and time delays that characterize technological transitions in the transport sector. In this study, Vensim PLE 10.1.5. software is employed to design and simulate a dynamic model that links fleet renewal, infrastructure rollout, cost evolution, and policy interventions. Unlike static or linear models, this approach enables the analysis of long-term transition pathways under alternative policy and market scenarios, making it an effective tool to evaluate how small-scale markets can manage the shift from internal combustion engine trucks to hydrogen and electric alternatives.
The causal loop diagram (Figure 1) provides a high-level representation of the dynamic interactions between fleet sizes, costs, infrastructure, and attractiveness of ICEs, BEVs, and H2 heavy trucks in the context of a small economy. The model reflects the fact that small markets face unique challenges compared to larger ones, particularly in terms of limited fleet sizes, constrained infrastructure investment capacity, and stronger reliance on subsidies or co-funding to stimulate technological transitions.
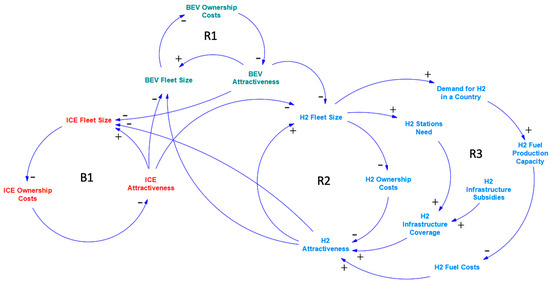
Figure 1.
Causal loop diagram.
The diagram reveals three core feedback structures reflecting specific dynamics in a small economy:
- Reinforcing innovation loops—R1 and R2, as shown in Figure 1 (for BEVs and H2). In small economies, these loops depend heavily on external technological progress and government subsidies, as domestic fleet volumes are insufficient to generate strong cost reductions on their own.
- Balancing legacy loop—B1 (for ICE). Compliance costs and shrinking support infrastructure increase ICE ownership costs more quickly in small markets.
- Infrastructure constraint loop—R3 (for H2). Infrastructure rollout is disproportionately expensive in small economies, and insufficient coverage rapidly undermines hydrogen’s attractiveness.
Together, these loops highlight how scale limitations, fiscal constraints, and coverage requirements shape the transition dynamics in small economies. The model shows that without carefully designed subsidies and coordinated infrastructure planning, small countries risk being locked into ICE dominance or limited to BEVs, while hydrogen adoption may stagnate due to infrastructure bottlenecks. On the other hand, well-planned interventions can generate reinforcing cycles of adoption and cost reduction, even in small markets.
The diagram reflects the following interrelations. ICE fleet size is linked to ICE ownership costs through a balancing feedback loop. In a small economy, the elasticity of acquisition costs is higher (as the ICE fleet shrinks, maintenance service, parts availability, and compliance with emission regulations become disproportionately expensive due to reduced economies of scale). This is explicitly reflected further in the model through the emission regulation compliance costs multiplier, which amplifies cost increases more strongly than in larger markets. As a result, ICE attractiveness declines faster, reducing renewal demand for ICE trucks and accelerating phase-out. This structure captures how small economies may experience sharper cost-driven declines in legacy technologies.
For BEVs, the feedback loop between BEV fleet size and BEV ownership costs captures the role of scale effects in lowering costs. However, in small economies, the adoption curve is shallower because the fleet size is relatively small compared to global manufacturers’ production volumes. Thus, the BEV cost multiplier is less driven by local fleet size and more dependent on exogenous technological progress (modeled via technology multipliers and subsidies). Government subsidies per BEV truck therefore play a proportionally greater role in small economies, where early adoption volumes alone are insufficient to trigger cost reductions. This highlights the reliance of small markets on public policy rather than market size to stimulate BEVs’ competitiveness.
The hydrogen sub-system reflects the most pronounced small economy challenges. Growth in H2 fleet size increases the demand for H2 in a country, which drives the need for H2 stations. However, in small economies, the number of required H2 fueling stations per 100 km (e.g., the TEN-T regulation) quickly translates into high relative infrastructure costs, as the absolute number of trucks is low but the geographic coverage requirements are fixed. This is further represented in the model through H2 infrastructure coverage and the H2 infrastructure penalty multiplier, which directly reduce attractiveness when coverage falls behind requirements. To mitigate this, the model explicitly includes H2 fueling station government subsidies per year and private co-funding as critical enablers of infrastructure rollout. Given the limited fiscal capacity of small economies, subsidy budgets ramp down over time, testing the system’s ability to self-sustain hydrogen adoption. This reflects a real-world situation in which small markets cannot indefinitely maintain high subsidy levels, making early momentum crucial. In addition, H2 fuel costs are modeled with strong sensitivity to demand (via economies of scale), as small economies cannot rely on large-scale domestic production. Instead, small increases in demand can either unlock cost reductions or keep costs high if adoption stalls.
The model also considers cross-technology competition. Competition between ICE, BEV, and H2 fleets is explicitly modeled through the general attractiveness indicators. Because the total renewal demand is relatively low in small economies, even modest shifts in attractiveness (caused by costs, infrastructure, or subsidies) can lead to disproportionately large swings in fleet composition. For instance, if hydrogen’s attractiveness is penalized by lack of infrastructure, renewal demand quickly shifts to ICEs or BEVs. This behavior is more visible in small markets, where fleet renewal opportunities are fewer and less evenly distributed. Additional aspects of the model will be presented and discussed in detail.
3.2.1. Sub-Models: Fleet Renewal and Acquisition
The H2 fleet and infrastructure sub-model (Figure 2) reflects the co-evolution of hydrogen-powered heavy trucks and the refueling infrastructure required to support them. It formalizes the interdependencies between fleet growth, infrastructure sufficiency, government policy support, and cost evolution, with the aim of identifying bottlenecks and leverage points for accelerating hydrogen adoption.
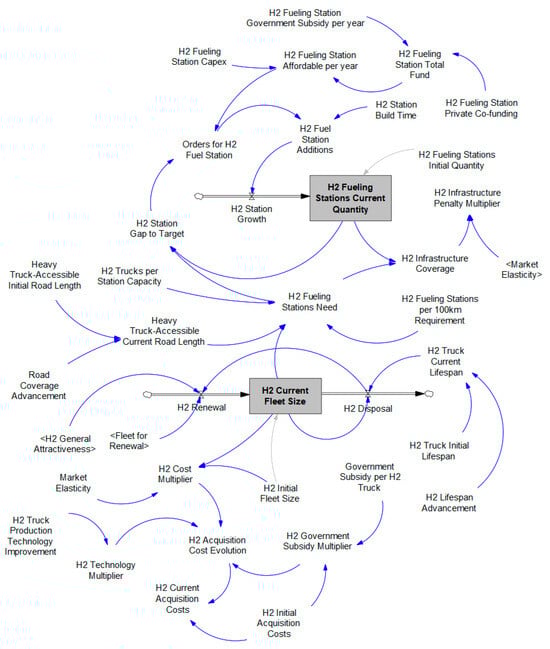
Figure 2.
H2 fleet and infrastructure sub-model.
At the center of the sub-model are two stock variables: current H2 fleet size and H2 fueling stations’ current quantity. The model assumes that the pace of hydrogen fleet expansion is constrained not only by costs and policy incentives but also by the timely rollout of sufficient fueling infrastructure. The fleet of H2 trucks evolves through H2 renewal (inflow) and H2 disposal (outflow). Renewal depends on the pool of vehicles available for replacement (fleet for renewal), moderated by the H2 general attractiveness index. Disposal is determined by the interaction between H2 trucks’ initial lifespan and H2 trucks’ current lifespan, allowing the model to capture expected improvements in vehicle durability over time. Government subsidies per H2 truck reduce effective acquisition costs through the H2 government subsidy multiplier, further influencing renewal rates. Fleet stock thus reflects both market-driven and policy-driven adoption of hydrogen trucks.
Acquisition costs are determined by three interacting multipliers: the H2 cost multiplier (representing economies of scale), the H2 technology multiplier (representing technological progress and production improvements), and the H2 government subsidy multiplier (representing direct financial support). Together, they define H2 acquisition cost evolution, which scales initial H2 acquisition costs into current H2 acquisition costs. These costs feed back into adoption attractiveness and thus affect renewal dynamics.
Fueling infrastructure evolves via the current stock of H2 fueling stations, which increases through H2 fuel station additions. Station growth is constrained by the H2 fueling station capex, government subsidies per year, and possible private co-funding. The construction process includes H2 station build time delays, reflecting real-world lags between investment decisions and operational stations. Infrastructure sufficiency is assessed based on H2 fueling station needs, which are determined jointly by fleet demand (via H2 trucks per station capacity) and regulatory requirements (via the requirement for H2 fueling stations per 100 km across the current road lengths accessible to heavy trucks). The ratio of actual stations to required stations defines H2 infrastructure coverage. If station rollout lags behind demand, the H2 infrastructure penalty multiplier reduces fleet attractiveness, thereby balancing adoption rates.
Thus, there are two core feedback loops representing H2 fleet and infrastructure sub-models: the reinforcing loop, where growth in the H2 fleet increases station demand, and the balancing loop, where insufficient fueling infrastructure relative to fleet size reduces attractiveness, decreasing the rate of renewal until investment catches up. These loops reflect the nature of H2 adoption. Strong early investments in infrastructure and subsidies can generate strong growth, while delays may lock the system into persistent underdevelopment.
The BEV fleet sub-model (Figure 3) represents the dynamics of battery electric heavy truck adoption, replacement, and cost evolution. Its purpose is to capture how economic factors, technological improvements, and government subsidies jointly determine the scale and pace of BEV penetration into the national heavy-duty transport fleet.
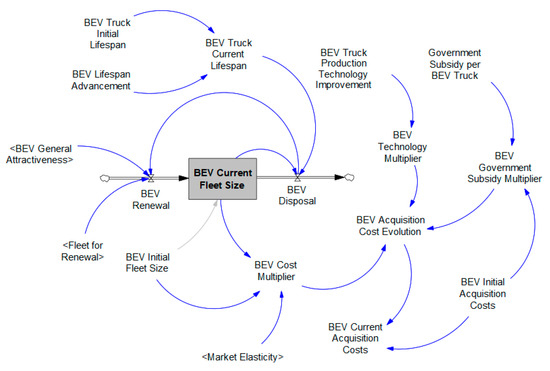
Figure 3.
BEV fleet sub-model.
At the center of the sub-model is the current stock BEV fleet size, which changes through two main flows: BEV renewal (inflow) and BEV disposal (outflow). Together, these flows represent the replacement of retired internal combustion or aging BEVs with new BEV trucks, as well as the retirement of BEVs at the end of their lifespan. Fleet growth occurs through BEV renewal, which is influenced by the attractiveness of BEVs relative to competing technologies (ICEs and H2). The pool of vehicles eligible for replacement (fleet for renewal) interacts with the BEV general attractiveness coefficient, which allocates shares of renewals to BEVs. The BEV disposal flow is determined by BEV trucks’ initial lifespan and their dynamic adjustment via BEVs’ lifespan advancement, capturing technological progress in durability. This allows the model to reflect longer lifetimes expected from maturing BEV technologies.
The decision to adopt BEVs is significantly influenced by acquisition costs. These costs evolve through three multipliers: the BEV cost multiplier, the BEV technology multiplier, and the BEV government subsidy multiplier. Together, they define BEVs’ acquisition cost evolution, which adjusts BEVs’ initial acquisition costs to BEVs’ current acquisition costs. This cost feeds directly back into fleet attractiveness and renewal dynamics. The sub-model includes reinforcing and balancing feedback structures, including a reinforcing adoption loop (growth in the BEV fleet drives economies of scale, reduces acquisition costs, and increases attractiveness, thereby stimulating further adoption) and a balancing durability loop (as lifespans extend, disposal rates decline, slowing the renewal cycle).
The ICE fleet sub-model (Figure 4) represents the dynamics of internal combustion engine heavy trucks, which currently dominate freight transport but are expected to decline as alternative technologies penetrate the market. This sub-model captures both the inertia of the existing ICE fleet and the pressures driving its gradual reduction, including technological substitution, cost increases, and regulatory constraints.
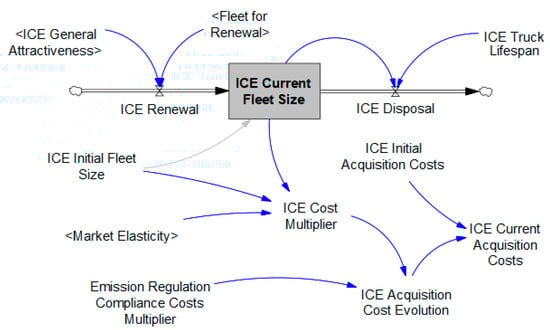
Figure 4.
ICE fleet sub-model.
At the center of the model is the current stock ICE fleet size, which is regulated by ICE renewal (inflow) and ICE disposal (outflow). These flows determine how the existing ICE stock is maintained, replaced, or phased out in response to changing economic and regulatory conditions. The ICE fleet increases through ICE renewal, which is influenced by the pool of vehicles eligible for replacement (fleet for renewal) and the ICE general attractiveness coefficient. This attractiveness index reflects the comparative competitiveness of ICE vehicles relative to BEV and H2 alternatives. At the same time, the stock decreases through ICE disposal, which is determined by ICE trucks’ lifespan. Together, these dynamics reflect the gradual turnover of the fleet as trucks reach their end of life and are replaced by either new ICE vehicles or alternative technologies.
The sub-model incorporates cost pressures that make ICE trucks less attractive over time. ICE initial acquisition costs serve as a baseline adjusted by two multipliers: the ICE cost multiplier, which reflects general market effects, such as scale and elasticity, and the emission regulation compliance costs multiplier, which captures the impact of increasingly stringent environmental policies that impose additional costs on ICE vehicles. Together, these define ICEs’ acquisition cost evolution, which generates ICEs’ current acquisition costs. Rising compliance costs are particularly important, as they represent external pressures from regulation that accelerate the relative decline of ICEs’ viability compared to BEV and H2 alternatives.
The sub-model contains two key feedback loops: a reinforcing loop, in which a large existing ICE fleet moves to continued renewal and slower decline, delaying the uptake of alternatives, and a balancing loop of regulation and costs, where increasing compliance costs reduce attractiveness, accelerating substitution with BEV and H2 trucks.
The general fleet renewal process sub-model (Figure 5) establishes the mechanism through which the overall heavy truck fleet is replaced and expanded over time. It links the evolution of the total fleet size with the renewal demand that drives the adoption of ICE, BEV, and H2 trucks. This structure ensures that technology-specific fleet dynamics are embedded within the broader system of fleet turnover and growth.
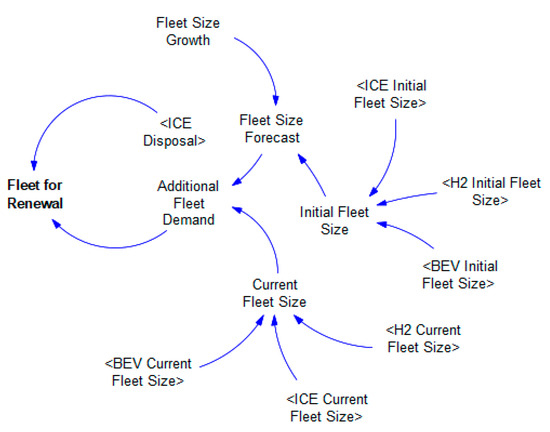
Figure 5.
General fleet renewal sub-model.
The sub-model centers around the fleet for renewal, which represents the number of vehicles eligible to be replaced in any given period. This pool is shaped by two main drivers: fleet growth and vehicle disposal. The fleet size forecast determines how many new vehicles are required to meet increasing transportation demand. Meanwhile, ICE disposal, BEV disposal, and H2 disposal contribute to the stock of vehicles that reach their end of life and must be replaced. Fleet renewal demand arises through two channels: end-of-life replacement and additional demand from fleet growth. Together, these components generate the flow of vehicles available for replacement each year.
The initial fleet size is composed of three technology-specific initial stocks: ICE initial fleet size, BEV initial fleet size, and H2 initial fleet size. These serve as the starting point for the total fleet in the simulation. The current fleet size is calculated as the sum of the three technology-specific fleet stocks (current ICE fleet size, current BEV fleet size, and current H2 fleet size). This ensures consistency between the technology sub-models and the overall fleet structure.
The fleet for renewal feeds into the renewal inflows of each technology-specific fleet sub-model (ICE renewal, BEV renewal, and H2 renewal). The share of renewal allocated to each drivetrain is determined by its respective attractiveness indices (acquisition, maintenance, and fuel factors). This creates a dynamic allocation mechanism wherein the composition of the new fleet reflects the relative competitiveness of the three technologies.
This sub-model acts as the interface between overall fleet dynamics and technology-specific adoption pathways. Without it, each technology could be modeled in isolation, but the renewal structure ensures that adoption is constrained by real-world fleet turnover cycles. It also enables scenario analysis of demand-side drivers, such as higher or lower rates of fleet growth, and their interaction with technology.
The acquisition factor attractiveness sub-model (Figure 6) captures the comparative role of purchase costs in shaping technology choice between ICE, H2, and BEV heavy trucks. Because acquisition costs represent one of the largest upfront barriers to technology adoption, this sub-model is a key component in determining the distribution of new fleet purchases across the three competing drivetrain options.
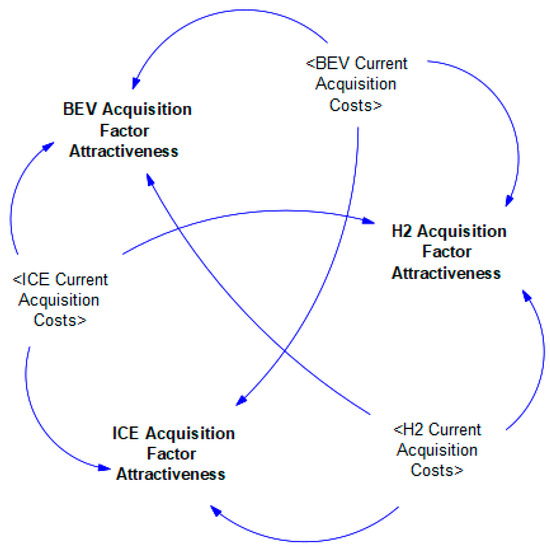
Figure 6.
Acquisition factor attractiveness sub-model.
The sub-model allocates attractiveness shares to each technology by comparing its current acquisition costs. Three variables (ICE acquisition factor attractiveness, H2 acquisition factor attractiveness, and BEV acquisition factor attractiveness) are calculated in relative terms. This means that a reduction in one technology’s acquisition costs increases its attractiveness while simultaneously decreasing the attractiveness of the alternatives. The three factors always sum to unity, ensuring that all fleet renewal demand is allocated among ICE, BEV, and H2 options. Each attractiveness variable is directly linked to the respective current acquisition costs. For example, when H2 current acquisition costs decline due to government subsidies, technological learning, or economies of scale, H2 acquisition factor attractiveness increases. This change reallocates part of the renewal demand away from ICEs and BEVs towards hydrogen trucks. Similarly, rising ICE current acquisition costs, driven by compliance costs or elasticity effects, reduce ICE acquisition factor attractiveness and redirect demand to alternatives.
This sub-model introduces a competitive balancing mechanism between the three technologies. Unlike isolated fleet sub-models, where adoption dynamics are determined independently, the acquisition attractiveness structure forces direct interaction. A change in one technology’s acquisition costs always redistributes attractiveness among all three options, ensuring that competition for market share is important to the system. The following formulas demonstrate the approach to calculating the most important variables within the fleet renewal and acquisition sub-model.
where is the government subsidy multiplier; is government subsidies per H2 truck (EUR per truck); is the initial acquisition cost of an H2 truck (EUR per truck); is the cost multiplier from fleet scaling effects; is the technology improvement multiplier; is the H2 acquisition cost evolution factor; is the current acquisition cost of an H2 truck (EUR per truck); is the current acquisition cost of a BEV truck (EUR per truck); is the current acquisition cost of an ICE truck (EUR per truck); and is the acquisition factor attractiveness of H2 trucks.
3.2.2. Sub-Model: Fuel-Factor Attractiveness
The fuel-factor attractiveness sub-model (Figure 7) represents the impact of energy costs on the relative competitiveness of ICE, BEV, and H2 trucks. Because fuel expenditures constitute a significant share of total cost of ownership in heavy freight transport, their dynamic evolution strongly influences technology adoption. This sub-model links demand for energy carriers with fuel price evolution, cost reductions, and final attractiveness indices that directly affect fleet renewal decisions.
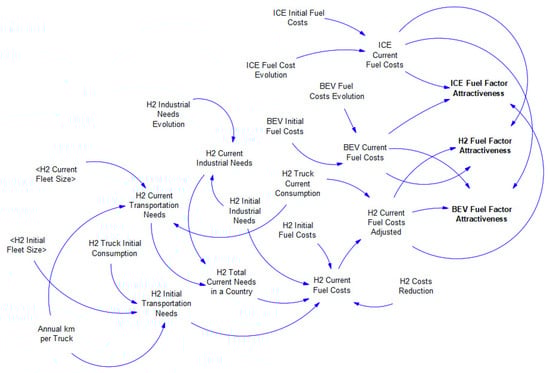
Figure 7.
Fuel-factor attractiveness sub-model.
Hydrogen demand arises from two primary sources: industrial uses and transportation needs. H2 current industrial needs evolve over time from an initial baseline (H2 initial industrial needs) and represent non-transport uses, such as steel or chemical production. H2 current transportation needs are determined by the size of the hydrogen truck fleet (current H2 fleet size), their annual mileage (annual km per truck), and specific energy consumption per distance traveled (H2 trucks’ current consumption). Together, these demands sum into the H2 total current needs of a country. The total demand is then used to determine H2 current fuel costs, which are modeled as a function of the initial fuel price (H2 initial fuel costs) and cumulative demand. This structure incorporates a cost-reduction mechanism; as demand doubles, costs decline according to a specified H2 cost reduction learning parameter. This captures economies of scale, technological advancement, and infrastructure deployment effects that are typical in energy transition pathways. An additional refinement is applied for hydrogen, where current adjusted H2 fuel costs reflect not only the per-kilogram fuel price but also the per-distance consumption rate of trucks. This enables direct comparison with ICE and BEV costs expressed per 100 km traveled, aligning fuel factors with real-world operational expenditure.
For internal combustion engine trucks, ICE current fuel costs are derived from ICE initial fuel costs and an exogenous ICE fuel cost evolution trajectory. Similarly, BEV current fuel costs are determined by BEV initial fuel costs adjusted by BEV fuel costs’ evolution. These trajectories capture expected long-term changes in fuel and electricity prices, including possible volatility in fossil fuels and gradual declines in electricity generation costs.
The sub-model calculates three attractiveness indices: ICE fuel-factor attractiveness, BEV fuel-factor attractiveness, and H2 fuel-factor attractiveness. Each index is expressed in relative terms, with the sum of the three equal to unity. This ensures that as one technology’s fuel costs decrease, its attractiveness increases proportionally, while the others decline. These indices are then fed into the fleet renewal sub-model to determine the allocation of new vehicles.
The sub-model introduces a crucial reinforcing feedback loop for hydrogen. As the H2 fleet expands, transportation demand grows, increasing total hydrogen demand. Higher demand leads to cost reductions (via the learning curve), which further enhance the attractiveness of hydrogen trucks. Conversely, if adoption remains low, hydrogen costs decline more slowly, reducing competitiveness and potentially delaying market penetration. For ICE trucks, balancing feedback is present. Rising fossil fuel costs reduce attractiveness over time, favoring a transition to alternatives. The sub-model ensures that technology competition accounts for operational costs, not just acquisition or maintenance. By embedding learning effects, demand interactions, and energy market trajectories, it provides a realistic mechanism for simulating how the total cost of ownership influences adoption. The following formulas demonstrate the approach to calculating the most important variables within the sub-model.
where is the H2 truck fleet size (vehicles); K is the annual distance per truck (km); is H2 consumption (kg per 100 km); is hydrogen demand in transport (kt per year); is hydrogen demand in industry (kt per year); is total hydrogen demand (kt per year); is the initial hydrogen fuel price (EUR per kg); is the current hydrogen fuel price (EUR per kg); λ is the learning rate; is the H2 fuel cost per 100 km (EUR per 100 km); is the BEV fuel cost per 100 km (EUR per 100 km); is the ICE fuel cost per 100 km (EUR per 100 km); and is the H2 fuel-factor attractiveness share.
3.2.3. Sub-Model: Maintenance Factor Attractiveness
The maintenance factor attractiveness sub-model (Figure 8) accounts for differences in upkeep and service costs between ICE, BEV, and H2 trucks and translates these costs into relative attractiveness indices. Maintenance expenditures are a major component of total cost of ownership in heavy freight, and they evolve differently across technologies depending on technological maturity, fleet size effects, and economies of scale. By capturing these dynamics, this sub-model provides another dimension of competitiveness beyond acquisition and fuel costs.
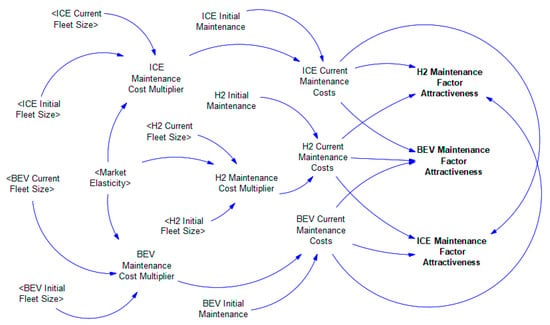
Figure 8.
Maintenance factor attractiveness sub-model.
The sub-model begins with baseline parameters for initial maintenance, BEV initial maintenance, and H2 initial maintenance. These are adjusted by cost multipliers that reflect changes over time due to fleet scale and learning effects. Specifically, the ICE maintenance cost multiplier, the BEV maintenance cost multiplier, and the H2 maintenance cost multiplier are functions of the ratio between current fleet size and initial fleet size, moderated by a market elasticity parameter. This structure reflects the expectation that as fleets expand, per-vehicle maintenance costs decline through economies of scale, specialized services, and supply chain learning. Conversely, small or shrinking fleets may experience relatively higher costs due to limited-service networks.
Applying the multipliers impacts ICE current maintenance costs, BEV current maintenance costs, and H2 current maintenance costs. These represent the per-vehicle annual expenditure associated with upkeep, repairs, and service contracts under evolving conditions of fleet size and technological advancement. The framework ensures that these costs remain endogenous to fleet dynamics, rather than exogenous assumptions.
Based on current costs, the sub-model derives attractiveness indices: ICE maintenance factor attractiveness, BEV maintenance factor attractiveness, and H2 maintenance factor attractiveness. As in the acquisition and fuel sub-models, these indices are expressed in relative terms such that they sum to one. This ensures direct competition—a decline in BEV maintenance costs not only increases BEVs’ attractiveness but simultaneously reduces the shares of ICE and H2.
This sub-model contains reinforcing loops that support technology diffusion. For example, as the H2 fleet expands, the H2 maintenance cost multiplier decreases, lowering H2 current maintenance costs and increasing attractiveness. This, in turn, promotes further adoption. The same mechanism applies for BEV2. In contrast, if ICE fleets decline, the shrinking scale can increase maintenance costs, lowering attractiveness and reinforcing the shift to alternatives. The following formulas demonstrate the approach to calculating the most important variables within the sub-model.
where is the current fleet size of hydrogen (H2) heavy trucks (vehicles); is the initial fleet size of hydrogen heavy trucks (vehicles); ε is the market elasticity parameter; is the current average annual maintenance cost per H2 truck (EUR); is the initial average annual maintenance cost per H2 truck (EUR); is the current average annual maintenance cost per ICE truck (EUR); is the current average annual maintenance cost per BEV truck (EUR); is the hydrogen truck maintenance cost multiplier; and is the maintenance factor attractiveness of H2 trucks.
3.2.4. Sub-Model: General Attractiveness
The general attractiveness sub-model (Figure 9) integrates the three key dimensions of competitiveness (acquisition costs, fuel costs, and maintenance costs) into overall attractiveness indices for ICE, BEV, and H2 trucks. These indices act as the decisive variables that allocate the fleet for renewal across technologies, making this sub-model the central decision-making layer of the system.
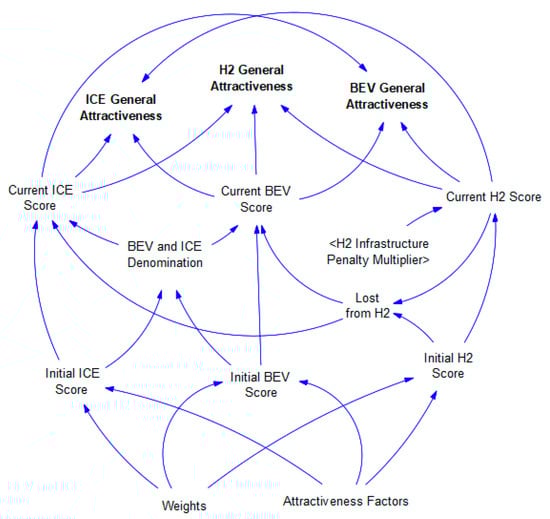
Figure 9.
General attractiveness sub-model.
The sub-model begins by calculating initial scores for each technology: initial ICE score, initial BEV score, and initial H2 score. These scores are weighted sums of the three attractiveness factors (acquisition, fuel, and maintenance), each adjusted by technology-specific weighting parameters. The weights allow policymakers or analysts to emphasize certain cost categories over others, reflecting differing priorities across scenarios (e.g., fuel costs under volatile energy markets, acquisition costs under high subsidy policies).
For H2 trucks, attractiveness is additionally moderated by the H2 infrastructure penalty multiplier. This penalty reflects the reality that even if hydrogen trucks are cost-competitive, their attractiveness declines if fueling infrastructure is insufficient. The result is a current H2 score that may be lower than the initial score if infrastructure development lags behind fleet expansion. This ensures that physical limitations constrain adoption pathways in a realistic manner.
Once adjusted, each technology receives a current score: a current ICE score, a current BEV score, and a current H2 score. These scores represent the effective attractiveness of each indicator, incorporating both cost competitiveness and infrastructure availability. For BEV and ICE, scores are normalized through the BEV and ICE denomination variable to maintain balance in their allocation when hydrogen’s attractiveness is penalized.
Finally, the sub-model calculates the general attractiveness indices: ICE general attractiveness, BEV general attractiveness, and H2 general attractiveness. These are expressed in relative terms and always sum to one, ensuring that all renewal demand is distributed across the three technologies. If hydrogen loses attractiveness due to high costs or poor infrastructure, the corresponding share is automatically reallocated to ICEs and BEVs. Conversely, if costs and infrastructure improve, hydrogen can capture an increasing share of renewals.
The structure introduces an important balancing mechanism: lost from H2. If hydrogen’s attractiveness is reduced by the infrastructure penalty, the “lost” attractiveness is redistributed to BEVs and ICEs. This ensures that renewal demand is never left unallocated while simultaneously highlighting the competitive dynamics between drivetrains.
This sub-model functions as the integrative hub of the entire system. It brings together the outputs of the acquisition, fuel-factor, and maintenance attractiveness sub-models, adjusts them for infrastructure availability, and produces the final attractiveness indices that determine technology adoption. In doing so, it ensures that adoption pathways reflect a realistic combination of cost, infrastructure, and serviceability considerations. In scenario simulations, the general attractiveness framework enables exploration of how shifts in weights, infrastructure investments, or cost trajectories alter the relative competitiveness of ICE, BEV, and H2 trucks and thus the overall pace of fleet transition. The following formulas demonstrate the approach to calculating the most important variables within the sub-model.
where is infrastructure coverage; is the current number of H2 fueling stations (stations); is the required number of H2 fueling stations (stations); ε is the market elasticity parameter; is the infrastructure penalty multiplier; is the initial H2 score before infrastructure adjustment; are weights for fuel, maintenance, and acquisition attractiveness factors; is the fuel-factor attractiveness of H2 trucks; is the maintenance factor attractiveness of H2 trucks; is the acquisition factor attractiveness of H2 trucks; is the current H2 score adjusted for infrastructure; are current BEV and ICE scores; and is the general attractiveness of H2 trucks.
4. Scenario Simulations
This section presents scenario simulations designed to explore possible transition pathways for heavy-duty truck fleets in a small economy. The model distinguishes between fixed variables, which define the structural baseline of the sector, and simulation variables, which reflect policy choices, market uncertainties, and technological developments. By systematically varying these inputs across three scenarios (H2-favorable, balanced, and market-led), the analysis highlights how different strategies and policy intensities can shape the pace and structure of fleet decarbonization. This approach allows for a comparative assessment of the roles of hydrogen and battery electric technologies under realistic economic and infrastructural constraints.
4.1. Fixed Variables
The first group of variables in the model defines the baseline conditions of the heavy-duty truck sector in a small economy (Table 1). These inputs establish the structural and technological context from which all scenario simulations evolve. They are considered fixed because they represent fundamental characteristics of the market and technologies, rather than policy instruments or uncertain future dynamics.

Table 1.
Model fixed variables.
Several variables capture the costs of ownership related to maintenance. The initial maintenance costs for ICE, BEV, and H2 trucks are essential for reflecting differences in technological maturity and service infrastructure. ICE trucks benefit from established service networks, whereas BEVs typically incur lower maintenance due to fewer moving parts. In contrast, hydrogen trucks face higher costs in early stages, owing to limited-service capacity and supply chain immaturity.
Another set of variables focuses on vehicle lifespans and technological improvements. The advancement of BEV lifespans captures expectations that electric trucks will gradually achieve greater durability as battery technologies mature. Similarly, production technology improvement rates for BEV and H2 trucks represent learning by doing and manufacturing efficiency gains that reduce costs over time.
Acquisition costs for ICE, BEV, and H2 trucks serve as critical baseline indicators of capital expenditure for fleet operators. These values set the starting point for attractiveness comparisons and strongly influence adoption decisions. ICE acquisition costs reflect current market averages, while BEV and H2 costs are associated with early-stage technologies.
The infrastructure-related variables include the time required to build a hydrogen refueling station and the initial number of stations available. The station building time introduces delays that constrain the pace of infrastructure rollout, while the initial station quantity reflects the very limited coverage typical of small economies. Road coverage advancement represents the gradual expansion of truck-accessible road networks, influencing long-term infrastructure requirements.
Two variables account for regulatory and market dynamics. The emission regulation compliance costs multiplier represents the effect of tightening EU standards on ICE truck ownership costs, ensuring that regulatory pressure is reflected in long-term adoption patterns. Market elasticity captures how maintenance and acquisition costs respond to changes in fleet size, an important factor in small economies, where scale effects are amplified.
Finally, fleet size and growth variables provide the baseline composition and expansion of the heavy truck sector. Initial fleet sizes for ICEs, BEVs, and H2 define the starting conditions of the model, while fleet size growth reflects long-term increases in freight demand.
It should be noted that not all input variables are directly available from official statistics, databases, or prior research. In system dynamics modeling, it is common to combine empirically observed data with carefully reasoned estimates. In such cases, values were estimated based on international benchmarks and adapted to reflect the specific economic and infrastructural conditions of a small economy like Latvia. These assumptions ensure the internal consistency of the model while maintaining plausibility within the context of European heavy-duty transport markets.
4.2. Simulation Variables
The second group of variables in the model captures inputs that are subject to policy decisions, market uncertainties, or technological development trajectories (Table 2). Unlike fixed parameters, these variables are varied in scenario simulations to explore how different policy pathways and market conditions may influence the transition of the heavy truck fleet in a small economy.
Table 2.
Model simulation variables.
The first category relates to direct subsidies for vehicle acquisition. Government subsidies for BEV and H2 trucks play a crucial role in bridging the cost gap between new technologies and conventional ICE trucks. By reducing purchase costs, subsidies accelerate adoption, particularly in small markets where operators are highly sensitive to capital expenditure. These variables belong to the BEV and H2 fleet sub-models, respectively.
The second category addresses support for hydrogen infrastructure. The annual government subsidy for fueling station deployment represents the state’s role in covering the high fixed costs of building a hydrogen refueling network. In small economies, public funding is essential to overcome low initial demand and limited private investment appetite. Private co-funding captures the share of investment provided by industry stakeholders, such as energy utilities, fuel suppliers, or logistics operators. Together, these two variables determine the pace and scale of hydrogen station rollout.
Another important driver is industrial hydrogen demand evolution, which represents the rate at which non-transport sectors increase their use of hydrogen. Industrial demand is critical because it creates economies of scale that can lower hydrogen costs for transport applications. This variable belongs to the fuel-factor attractiveness sub-model.
The hydrogen cost reduction rate is closely related, representing the extent to which hydrogen fuel prices decline as cumulative demand increases. This variable captures global technological progress, scale-up of production, and infrastructure learning. It is particularly relevant in small economies, where domestic demand alone is insufficient to drive cost reductions, making international development crucial.
Finally, the model incorporates weights for acquisition, maintenance, and fuel costs. These three variables determine the relative importance assigned to different cost categories in the calculation of general attractiveness. They reflect fleet operator decision-making behavior and vary across contexts depending on operator priorities, market conditions, and fuel price volatility. These variables belong to the general attractiveness sub-model.
Together, these scenario variables enable the model to explore a range of possible futures. By adjusting subsidy levels, infrastructure funding, industrial demand growth, learning rates, and decision-making weights, it becomes possible to simulate how small economies might follow divergent pathways in transitioning their heavy truck fleets to alternative technologies.
4.3. Simulation Results
Three scenarios are reviewed for simulation purposes: an H2-favorable scenario with accelerated infrastructure rollout, a balanced scenario with dual-track push (BEV and H2 support), and a market-led scenario with fiscal tightening (Table 3).
Table 3.
Simulation scenarios.
The H2-favorable scenario reflects a strategic policy push in a small economy context, where hydrogen is prioritized as a key technology for decarbonizing heavy transport. Hydrogen trucks receive the highest and longest-lasting subsidies, complemented by substantial public and private investment in fueling infrastructure. Industrial hydrogen demand grows rapidly, creating economies of scale that accelerate cost reductions, while market elasticity ensures that unit costs decline significantly as fleet size expands. Battery electric trucks receive more limited and short-lived support, resulting in slower relative growth compared to hydrogen. Fleet attractiveness is increasingly shaped by acquisition incentives and technology improvements, which make H2 trucks competitive within the simulation horizon. This scenario illustrates a market outcome where hydrogen emerges as a dominant or co-dominant zero-emission option, supported by strong policy frameworks and industrial synergies, even within the constraints of a small economy.
The balanced scenario pursues an ambitious decarbonization pathway. Strong subsidies for both BEV and H2 trucks are provided until 2035, gradually tapering by 2040. Substantial public funding and private co-investment drive accelerated deployment of H2 refueling infrastructure, while industrial hydrogen demand grows steadily. Faster technology learning and stronger economies of scale (higher elasticity) lead to significant reductions in acquisition and maintenance costs. As a result, both BEV and H2 trucks become competitive alternatives to ICE, creating a balanced market transition.
The market-led scenario reflects a future where government support for zero-emission trucks is reduced earlier due to fiscal constraints or shifting policy priorities. Subsidies for BEV and H2 trucks decline rapidly, and infrastructure development relies more on private co-funding, which limits expansion speed. Industrial hydrogen demand grows more slowly, resulting in weaker cost reductions (low elasticity). Acquisition costs remain relatively high, slowing adoption of new technologies. In this context, ICE trucks retain a stronger market presence for longer, and the transition to zero-emission fleets is delayed compared to other scenarios.
In the H2-favorable scenario (Figure 10), the country pursues an ambitious hydrogen strategy backed by strong subsidies, accelerated infrastructure rollout, and rapid industrial demand growth. ICE trucks decline steadily, with general attractiveness falling from 0.48 in 2025 to just 0.07 by 2055, reflecting tightening regulations and competitiveness. BEVs initially dominate the zero-emission market due to technological maturity and operating cost advantages. Their attractiveness peaks at 0.73 in the early 2030s but begins to decline as hydrogen infrastructure expands and acquisition incentives remain favorable. By 2055, BEVs’ attractiveness stabilizes around 0.51, leaving them in a balanced position with hydrogen. H2 emerges as a credible competitor from the mid-2030s onward. General attractiveness rises from near 0 in 2025 to 0.42 by 2055, driven by significant cost reductions, high market elasticity, and an expanding network of fueling stations, which grows from a single site in 2025 to 34 by 2043. This infrastructure ensures reliability and removes one of the key adoption barriers in small economies. Economically, this scenario demonstrates that strong government commitment can shift the market trajectory away from a BEV-dominated pathway towards a dual-technology outcome. In a small country, where limited market size constrains private investment, coordinated subsidies and industrial synergies enable hydrogen trucks to achieve meaningful scale, ultimately balancing the fleet between BEVs and H2.
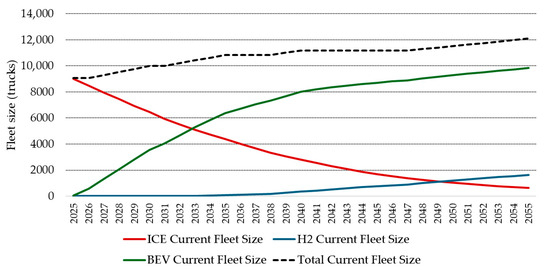
Figure 10.
Fleet size evolution under H2-favorable scenario.
In the balanced scenario (Figure 11), stronger government intervention and sustained co-funding significantly accelerate the diversification of the heavy truck fleet. ICE trucks decline more rapidly than in the conservative case, falling from 9000 in 2025 to below 700 units by 2055, while their general attractiveness drops from 0.45 to below 0.10. This reflects rising compliance costs and declining competitiveness. BEVs remain the dominant technology for most of the simulation period. Their attractiveness coefficient starts at 0.55 in 2025 and remains above 0.70 through the early 2030s. However, as hydrogen infrastructure expands and production costs decrease, BEVs lose some of their relative advantage. By 2050, their attractiveness stabilizes around 0.52, with a fleet size just under 10,000 units. Hydrogen trucks achieve meaningful adoption under this scenario, expanding from 5 units in 2025 to nearly 1500 by 2055. The decisive factor is infrastructure availability. The number of fueling stations rises steadily from 1 in 2025 to 33 by 2043, after which it stabilizes. The H2 general attractiveness coefficient follows the same trajectory, starting at near 0 but reaching 0.39 by 2055. This shows that sustained policy support and infrastructure development are essential preconditions for hydrogen to become a viable alternative in a small economy, where market size alone cannot trigger scale effects. Economically, this scenario illustrates that in small economies, balanced public investment can create space for both BEV and hydrogen trucks. While BEVs continue to dominate due to lower operating costs and mature technology, hydrogen gradually emerges as a complementary option. The key implication is that policy choices, not market size alone, determine whether hydrogen will remain marginal or become a competitive part of the fleet mix.
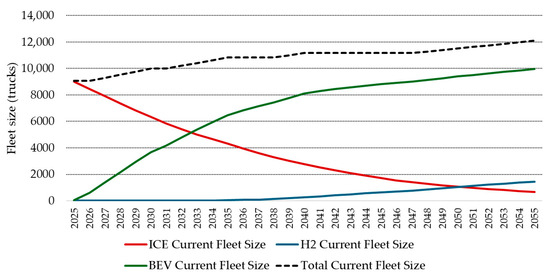
Figure 11.
Fleet size evolution under balanced scenario.
In the market-led scenario (Figure 12), the heavy truck sector transitions more slowly, with government support weakening early and infrastructure development relying mainly on private investment. ICE trucks maintain a stronger presence for longer, with general attractiveness remaining above 0.30 even by 2055. Fleet size decreases gradually, but not as sharply as in other scenarios, reflecting both the residual competitiveness of ICE technology and limited policy-driven disincentives. BEVs capture most of the market growth, with attractiveness rising from 0.51 in 2025 to nearly 0.68 by 2055. Their fleet expands consistently, supported by lower operating costs and the relative ease of infrastructure deployment compared to hydrogen. The model suggests that in the absence of strong subsidies, BEVs remain the default zero-emission option, though adoption occurs at a moderate pace due to higher acquisition costs and slower cost reductions. H2 trucks, in contrast, fail to establish a significant market share. Their attractiveness coefficient remains effectively zero across the entire period, and the H2 fueling station network stagnates at only six units by 2035, with no further expansion. This highlights the difficulty of achieving economies of scale for hydrogen in small economies without substantial public investment. Despite rising industrial hydrogen demand, the lack of infrastructure and weak policy signals leave H2 trucks economically unattractive. Economically, this scenario demonstrates that without government intervention, small markets will struggle to diversify their zero-emission fleet beyond BEVs. The risk is a single-technology pathway dominated by battery electric trucks, with ICE trucks persisting as a fallback option. H2 remains locked out of the market, underscoring the need for subsidies and infrastructure planning if policymakers wish to promote a multi-technology transition.
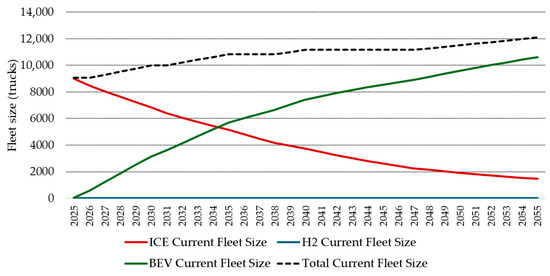
Figure 12.
Fleet size evolution under market-led scenario.
The scenario analysis highlights how policy design shapes heavy truck decarbonization in a small economy. In the market-led case, limited subsidies and infrastructure investment leave H2 marginal, with BEVs dominating the zero-emission fleet. The balanced scenario achieves diversification; BEVs remain strong, but H2 gradually expand as subsidies and station deployment provide sufficient momentum. In the H2-favorable scenario, sustained subsidies, rapid fueling infrastructure growth, and industrial synergies make hydrogen a co-dominant technology by 2055, with BEV and H2 attractiveness becoming comparable. Across all scenarios, ICE trucks steadily decline, but the speed and extent of the transition depend on policy intensity. The results demonstrate that small economies cannot rely on market forces alone to create a balanced technological mix. Proactive and consistent state intervention is critical if H2 are to complement BEVs rather than remaining a niche option.
4.4. Sensitivity Analysis
The sensitivity analysis was conducted to assess the robustness of the model across the three policy scenarios by varying key parameters that directly influence hydrogen adoption dynamics. The selected inputs include subsidies for BEV and H2 trucks, government and private investment in hydrogen infrastructure, the evolution of industrial hydrogen demand, cost-reduction rates, and market elasticity. These parameters were adjusted within realistic ranges for each scenario to reflect uncertainty in policy intensity, technological progress, and market development. The analysis focuses exclusively on the output variable H2 Current Fleet Size, as it represents the central objective of the study, the feasibility and scale of hydrogen truck deployment in a small economy. By isolating this indicator, the sensitivity analysis highlights how changes in policy and market conditions impact the core transition pathway the model is designed to evaluate.
The sensitivity analysis for the H2-favorable scenario (Figure 13) illustrates how variations in key policy and market parameters influence the growth of the hydrogen truck fleet. Using system dynamics sensitivity logic, multiple simulations were run by varying subsidy levels, industrial hydrogen demand, and market elasticity within the defined ranges. The results show a relatively narrow spread in early years, reflecting the system’s dependency on strong initial policy support and limited infrastructure. After 2035, dispersion increases as reinforcing loops, particularly cost-reduction effects and infrastructure-driven attractiveness, begin to dominate. Higher industrial demand growth and stronger infrastructure subsidies produce the upper trajectories, while reduced subsidies and slower cost learning form the lower band. Overall, the scenario demonstrates that hydrogen adoption in small economies remains highly sensitive to early public investment intensity and the timing of infrastructure rollout.
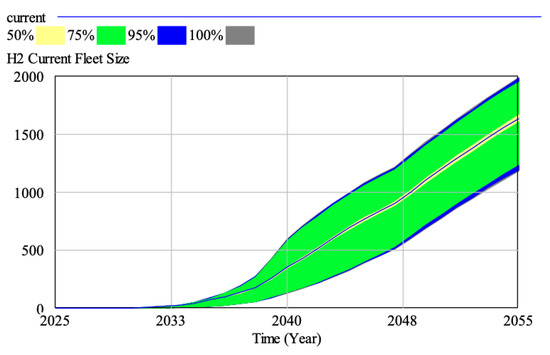
Figure 13.
H2-favorable scenario sensitivity.
The sensitivity analysis for the balanced scenario (Figure 14) shows a wider dispersion of outcomes compared to the H2-favorable case, reflecting the more moderate and evenly distributed policy incentives. Under system dynamics logic, the model responds with greater structural uncertainty because neither BEV nor H2 receives dominant support, and multiple reinforcing and balancing loops compete for influence. The widening bands after 2035 illustrate the system’s sensitivity to variations in H2 industrial demand growth, infrastructure subsidies, and market elasticity. Higher values accelerate cost-reduction feedback and station deployment, generating the upper trajectories, while weaker policy inputs result in flatter adoption curves. The results highlight that in a small economy, hydrogen uptake under a dual-technology strategy is highly dependent on consistent mid-term support. Without it, the system gravitates toward slower H2 growth despite early incentives.
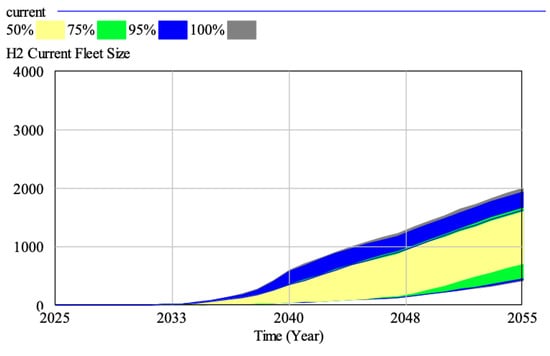
Figure 14.
Balanced scenario sensitivity.
The sensitivity analysis for the market-led scenario (Figure 15) demonstrates very narrow variation bands, indicating that the system is structurally insensitive to changes in the selected parameters under weak policy support. According to system dynamics logic, the reinforcing loops that normally accelerate hydrogen adoption remain largely inactive because subsidies diminish early, infrastructure expansion is minimal, and industrial hydrogen demand grows slowly. As a result, the H2 fleet trajectory remains nearly identical across the entire parameter range. The limited dispersion reflects a system constrained by dominant balancing loops, particularly high acquisition costs, sparse refueling infrastructure, and low economies of scale, which prevent significant divergence in outcomes. This scenario confirms that in small economies, hydrogen adoption will remain marginal unless substantial, sustained policy interventions activate the reinforcing mechanisms necessary for scale-up.
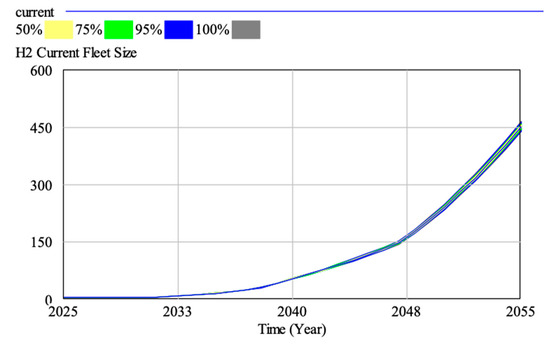
Figure 15.
Market-led scenario sensitivity.
5. Conclusions
This study has investigated the prospects and challenges of transitioning from internal combustion engine trucks to zero-emission technologies, with a particular focus on hydrogen and battery electric vehicles in the context of a small economy.
- Based on the literature review, H2 vehicles offer distinct advantages in range, payload, and rapid refueling, which make them particularly suitable for heavy-duty, long-haul, and energy-intensive operations. However, hydrogen adoption faces persistent barriers, including high acquisition costs, immature refueling infrastructure, and competition with BEVs, which have faster technological maturity and declining costs. Government intervention, research support, and coordinated infrastructure deployment consistently emerge as decisive factors shaping hydrogen’s competitiveness.
- The expert interviews confirmed that in Latvia and the broader Baltic region, hydrogen technology in transport is still in its earliest stages, with production facilities underutilized and outdated equipment in operation. Experts highlighted the lack of clarity on whether to prioritize supply or demand, leading to hesitation in investment. They emphasized the importance of pilot projects, cross-sector cooperation, and clear policy incentives, including tax reductions and stricter CO2 penalties for fossil fuels. Importantly, experts stressed that hydrogen infrastructure must serve multiple sectors to be viable and that efficiency in utilization (minimizing idle capacity) will be essential in small economies.
- The analysis shows that in small economies, hydrogen adoption requires conditions that differ substantially from those of larger markets. Small fleet sizes and limited fiscal capacity make infrastructure disproportionately costly, and subsidies cannot be maintained indefinitely. As a result, hydrogen can only succeed if infrastructure is planned in a coordinated manner, serving both transport and industrial sectors to generate economies of scale. Industrial hydrogen demand thus becomes a critical enabler for lowering costs and justifying infrastructure rollout.
- At present, BEVs remain more favorable in small economies, largely due to their lower entry costs, wider technological maturity, and simpler charging infrastructure. This finding is consistent with the broader literature and simulation results. In markets with limited fleets, BEV adoption benefits from global cost trends and requires fewer dedicated national investments compared to hydrogen. This explains why BEVs are structurally more attractive in smaller markets, where economies of scale for hydrogen are harder to achieve.
- For hydrogen to play a meaningful role, several conditions must change. These include strong, sustained government subsidies in the early phases, accelerated and coordinated deployment of refueling stations, and policies that link transport hydrogen demand with industrial applications. Updating CO2 accounting methods to reflect full “well-to-wheel” impacts and implementing stronger carbon penalties for ICEs are also necessary to shift competitiveness. Without these measures, hydrogen risks remain marginal in small economies.
- Simulation results confirm that the intensity and continuity of policy intervention determine transition outcomes. In a market-led scenario with weak support, BEVs dominate, and hydrogen adoption stagnates. A balanced policy mix allows both BEVs and hydrogen to coexist, while an ambitious hydrogen-focused strategy (combining subsidies, infrastructure rollout, and industrial demand growth) can make hydrogen a co-dominant technology.
In conclusion, this study shows that small economies cannot rely solely on market forces to achieve a balanced zero-emission truck transition. Proactive and carefully designed policies are essential to create the conditions in which hydrogen can complement BEVs, rather than remaining marginal. The developed system dynamics model provides a valuable tool for identifying leverage points, testing alternative strategies, and guiding policymakers in designing transition pathways suited to the structural realities of small markets.
While this study focuses on the conditions of a small European economy, the model’s structure and insights are transferable to other small-market contexts with comparable limitations in fleet size, fiscal capacity, and infrastructure investment potential. Countries with dispersed geography, modest freight volumes, or emerging hydrogen sectors, such as Estonia, Lithuania, Slovenia, face similar constraints that restrict economies of scale and slow technology diffusion. Although specific parameter values would differ, the underlying dynamics captured by the model, particularly the dependence on coordinated subsidies, cross-sector demand, and infrastructure coverage, remain relevant and can be adapted to guide policy design in comparable settings.
Future research could extend this model by conducting cross-country comparisons to evaluate how different small economies respond to similar policy levers and technological trends. Incorporating life-cycle emissions, supply-chain constraints, and upstream hydrogen production pathways would further enhance realism. Additionally, integrating behavioral factors or agent-based components could deepen understanding of fleet-operator decision-making under uncertainty.
Author Contributions
Conceptualization, A.K. and J.S.; Methodology, A.K.; Software, A.K.; Formal analysis, J.H. and J.S.; Investigation, J.H.; Writing—original draft, A.K.; Writing—review & editing, M.G., I.K. and A.B.; Visualization, A.K.; Project administration, A.K. and I.J.-K. All authors have read and agreed to the published version of the manuscript.
Funding
This research is supported by the project “Perspectives of using hydrogen technology for cold supply chain freight transportation” under the scientist grant No. RTU-ZG-2024/1-0019.
Institutional Review Board Statement
The research was approved by the Research Ethics Committee of Riga Technical University, with the approval code 04000-10.2.3-e/23 2025-05-15.
Informed Consent Statement
Informed consent was obtained from all subjects involved in the study.
Data Availability Statement
The original contributions presented in this study are included in the article. Further inquiries can be directed to the corresponding author(s). The raw data supporting the conclusions of this article will be made available by the authors upon request.
Conflicts of Interest
The authors declare no conflicts of interest.
Abbreviations
The following abbreviations are used in this manuscript:
| ABM | Agent-based modeling |
| AHP | Analytic hierarchy process |
| BEV | Battery electric vehicle |
| CCS | Capture and storage |
| EU | European Union |
| GHG | Greenhouse gas |
| H2 | Hydrogen fuel cell vehicles |
| HRS | Hydrogen refueling stations |
| ICE | Internal combustion engine |
| MILP | Mixed-integer linear programming |
| NSGA-III | Nondominated sorting genetic algorithm III |
| NAT | Norm activation theory |
| SMR | Steam methane reforming |
| TOPSIS | Technique for order preference by similarity to ideal solution |
| TPB | Theory of planned behavior |
References
- Bicer, Y.; Dincer, I. Life cycle environmental impact assessments and comparisons of alternative fuels for clean vehicles. Resour. Conserv. Recycl. 2018, 132, 141–157. [Google Scholar] [CrossRef]
- Lee, D.; Elgowainy, A.; Kotz, A.; Vijayagopal, R.; Marcinkoski, J. Life-cycle implications of hydrogen fuel cell electric vehicle technology for medium- and heavy-duty trucks. J. Power Sources 2018, 393, 217–229. [Google Scholar] [CrossRef]
- Li, J. The Analysis of Government Policies for Hydrogen Fuel Cell. Highlights Sci. Eng. Technol. 2023, 73, 165–168. [Google Scholar] [CrossRef]
- Jiang, C.; Wang, Y.; Yang, Z.; Zhao, Y. Do adaptive policy adjustments deliver ecosystem-agriculture-economy co-benefits in land degradation neutrality efforts? Evidence from southeast coast of China. Environ. Monit. Assess. 2023, 195, 1215. [Google Scholar] [CrossRef] [PubMed]
- Meyer, P.; Winebrake, J.J. Modeling technology diffusion of complementary goods: The case of hydrogen vehicles and refueling infrastructure. Technol. Forecast. Soc. Change 2009, 76, 1105–1114. [Google Scholar] [CrossRef]
- Ajanovic, A.; Haas, R. Prospects and impediments for hydrogen and fuel cell vehicles in the transport sector. Int. J. Hydrogen Energy 2021, 46, 10049–10058. [Google Scholar] [CrossRef]
- Albatayneh, A.; Juaidi, A.; Jaradat, M.; Manzano-Agugliaro, F. Future of Electric and Hydrogen Cars and Trucks: An Overview. Energies 2023, 16, 3230. [Google Scholar] [CrossRef]
- Lahnaoui, A.; Wulf, C.; Heinrichs, H.; Dalmazzone, D. Optimizing hydrogen transportation system for mobility via compressed hydrogen trucks. Int. J. Hydrogen Energy 2019, 44, 19302–19312. [Google Scholar] [CrossRef]
- Soleimani, A.; Dolatabadi, S.H.H.; Heidari, M.; Pinnarelli, A.; Khorrami, B.M.; Luo, Y.; Vizza, P.; Brusco, G. Progress in Hydrogen Fuel Cell Vehicles and Up-And-Coming Technologies for Eco-Friendly Transportation: An International Assessment. Multiscale Multidiscip. Model. Exp. Des. 2024, 7, 3153–3172. [Google Scholar] [CrossRef]
- Boretti, A. Hydrogen Internal Combustion Engines to 2030. Int. J. Hydrogen Energy 2020, 45, 23692–23703. [Google Scholar] [CrossRef]
- Cullen, D.A.; Neyerlin, K.C.; Ahluwalia, R.K.; Mukundan, R.; More, K.L.; Borup, R.L.; Weber, A.Z.; Myers, D.J.; Kusoglu, A. New Roads and Challenges for Fuel Cells in Heavy-Duty Transportation. Nat. Energy 2021, 6, 462–474. [Google Scholar] [CrossRef]
- Salek, F.; Abouelkhair, E.; Babaie, M.; Cunliffe, F.; Nock, W. Multi-Objective Optimization of the Fuel Cell Hybrid Electric Powertrain for a Class 8 Heavy-Duty Truck. SAE Tech. Pap. 2023, 2023-01-0473, 1–10. [Google Scholar] [CrossRef]
- Mao, J.; Zhang, G.; Ling, Z.; Yuan, D.; Liu, M.; Xu, J. Potentials of Mixed-Integer Linear Programming (MILP)-Based Optimization for Low-Carbon Hydrogen Production and Development Pathways in China. Energies 2024, 17, 1694. [Google Scholar] [CrossRef]
- Jensen, S.H.; Larsen, P.H.; Mogensen, M. Hydrogen and Synthetic Fuel Production from Renewable Energy Sources. Int. J. Hydrogen Energy 2007, 32, 3253–3257. [Google Scholar] [CrossRef]
- Glenk, G.; Reichelstein, S. Economics of converting renewable power to hydrogen. Nat. Energy 2019, 4, 216–222. [Google Scholar] [CrossRef]
- Hernández, B.; Alkayas, A.; Azar, E.; Mayyas, A.T. Mathematical model for the placement of hydrogen refueling stations to support future fuel cell trucks. IEEE Access 2021, 9, 148118–148134. [Google Scholar] [CrossRef]
- Yaïci, W.; Longo, M. Hydrogen Gas Refueling Infrastructure for Heavy-Duty Trucks: A Feasibility Analysis. J. Energy Resour. Technol. 2022, 144, 070906. [Google Scholar] [CrossRef]
- Yaïci, W.; Longo, M. Feasibility Investigation of Hydrogen Refueling Infrastructure for Heavy-Duty Vehicles in Canada. Energies 2022, 15, 2848. [Google Scholar] [CrossRef]
- Apostolou, D.; Xydis, G. A literature review on hydrogen refueling stations and infrastructure. Current status and future prospects. Renew. Sustain. Energy Rev. 2019, 113, 109292. [Google Scholar] [CrossRef]
- Bai, W.; Zhang, L. How to Finance for Establishing Hydrogen Refueling Stations in China? An Analysis Based on Fuzzy AHP and PROMETHEE. Int. J. Hydrogen Energy 2020, 45, 34354–34370. [Google Scholar] [CrossRef]
- Sacchi, R.; Bauer, C.; Cox, B.L. Does Size Matter? The Influence of Size, Load Factor, Range Autonomy, and Application Type on the Life Cycle Assessment of Current and Future Medium- and Heavy-Duty Vehicles. Environ. Sci. Technol. 2021, 20, 5224–5235. [Google Scholar] [CrossRef] [PubMed]
- Zhou, Y.; Qin, X.; Mei, W.; Yang, W.; Ni, M. Multi-Period Urban Hydrogen Refueling Stations Site Selection and Capacity Planning with Many-Objective Optimization for Hydrogen Supply Chain. Int. J. Hydrogen Energy 2024, 79, 1427–1441. [Google Scholar] [CrossRef]
- Ball, M.; Wietschel, M.; Rentz, O. Integration of a hydrogen economy into the German energy system: An optimizing modelling approach. Int. J. Hydrogen Energy 2007, 32, 1355–1368. [Google Scholar] [CrossRef]
- Stangarone, T. South Korean efforts to transition to a hydrogen economy. Clean Technol. Environ. Policy 2021, 23, 509–516. [Google Scholar] [CrossRef]
- Çabukoglu, E.; Georges, G.; Küng, L.; Pareschi, G.; Boulouchos, K. Fuel cell electric vehicles: An option to decarbonize heavy-duty transport? Results from a Swiss case-study. Transp. Res. Part D Transp. Environ. 2019, 70, 35–48. [Google Scholar] [CrossRef]
- Dou, Z.; Ye, Z.; Zhang, C.; Liu, H. Development and process simulation of a biomass driven SOFC-based electricity and ammonia production plant using green hydrogen; AI-based machine learning-assisted tri-objective optimization. Int. J. Hydrogen Energy 2025, 133, 440–457. [Google Scholar] [CrossRef]
- Meng, Q.; Zu, G.; Ge, L.; Li, S.; Xu, L.; Wang, R.; Jin, S. Dispatching Strategy for Low-Carbon Flexible Operation of Park-Level Integrated Energy System. Appl. Sci. 2022, 12, 12309. [Google Scholar] [CrossRef]
- Song, M.; Zhang, Y.; Li, M.; Zhang, Y. Accessibility of Transit Stops with Multiple Feeder Modes: Walking and Private-Bike Cycling. Sustainability 2021, 13, 3522. [Google Scholar] [CrossRef]
- Ahn, K.; Rakha, H.A. Developing a hydrogen fuel cell vehicle (HFCV) energy consumption model for transportation applications. Energies 2022, 15, 529. [Google Scholar] [CrossRef]
- Erdoğan, B.; Alkayas, A.; Azar, E.; Mayyas, A.T. Design of a future hydrogen supply chain: A multi-objective model for Turkey. Int. J. Hydrogen Energy 2023, 48, 5421–5438. [Google Scholar] [CrossRef]
- Li, L.; Manier, H.; Manier, M.-A. Integrated Optimization Model for Hydrogen Supply Chain Network Design and Hydrogen Fueling Station Planning. Comput. Chem. Eng. 2020, 134, 106683. [Google Scholar] [CrossRef]
- Moreno-Benito, M.; Agnolucci, P.; Papageorgiou, L.G. Towards a sustainable hydrogen economy: Optimization-based framework for hydrogen infrastructure development. Comput. Chem. Eng. 2017, 102, 110–127. [Google Scholar] [CrossRef]
- Noor Imanina, N.H.; Lu, T.K.; Fadhilah, A.R. A proposed model of factors influencing hydrogen fuel cell vehicle acceptance. IOP Conf. Ser. Earth Environ. Sci. 2016, 32, 012052. [Google Scholar] [CrossRef]
- Park, S.Y.; Kim, J.W.; Lee, D.H. Development of a Market Penetration Forecasting Model for Hydrogen Fuel Cell Vehicles Considering Infrastructure and Cost Reduction Effects. Energy Policy 2011, 39, 3307–3315. [Google Scholar] [CrossRef]
- Schwoon, M. Simulating the adoption of fuel cell vehicles. J. Evol. Econ. 2006, 16, 435–472. [Google Scholar] [CrossRef]
- Zhang, W.; Zhanguo, S.; Abdulwahab, A.; Saleem, S.; Yao, Y.; Deifalla, A.; Taghavi, M. Comparison of Gasoline and Hydrogen Pathways in Order to Reduce the Environmental Hazards of a Solar-Hydrogen Refueling Station: Evaluation Based on Life Cycle Cost and Well-To-Wheel Models. Process Saf. Environ. Prot. 2023, 173, 317–331. [Google Scholar] [CrossRef]
- International Council on Clean Transportation (ICCT). Total Cost of Ownership for Tractor-Trailers in Europe: Battery Electric Versus Diesel. 2021. Available online: https://theicct.org/wp-content/uploads/2021/11/tco-bets-europe-1-nov21.pdf (accessed on 12 September 2025).
- International Council on Clean Transportation (ICCT). Fuel-Cell Hydrogen Long-Haul Trucks in Europe: A Total Cost of Ownership Analysis. 2022. Available online: https://theicct.org/wp-content/uploads/2022/09/eu-hvs-fuels-evs-fuel-cell-hdvs-europe-sep22.pdf (accessed on 12 September 2025).
- ECG Business Intelligence. On Costs for Electric Trucks: The Realities of Going Green for Europe’s FVL Trucks; European Association of Automotive Logistics: Brussels, Belgium, 2022; Available online: https://www.ecgassociation.eu/wp-content/uploads/2022/04/ECG-Business-Intelligence-22.04-Cost-of-going-electric.pdf (accessed on 12 September 2025).
- Vidzeme Planning Region. Final Report: Planning and Deployment of Hydrogen Refuelling Stations in Latvia [PDF]. Valmiera: Vidzeme Planning Region. 2024. Available online: https://www.vidzeme.lv/wp-content/uploads/2024/12/20241104-Final-report-ENG.pdf (accessed on 12 September 2025).
- Latvian State Roads. Roads in Latvia [Statistical Overview]. Latvijas Valsts Ceļi. 2023. Available online: https://lad.lv/EN/?i=15 (accessed on 12 September 2025).
- European Commission. Monitoring of CO2 Emissions from Heavy-Duty Vehicles (VECTO Framework); European Commission: Brussels, Belgium, 2020. [Google Scholar]
- International Council on Clean Transportation (ICCT). A Meta-Study of Purchase Costs for Zero-Emission Trucks. 2022. Available online: https://theicct.org/publication/purchase-cost-ze-trucks-feb22/ (accessed on 12 September 2025).
- Central Statistical Bureau of Latvia (CSB). Road Freight Transport Statistics; CSB: Riga, Latvia, 2023. Available online: https://stat.gov.lv (accessed on 12 September 2025).
- Latvian Road Transport Directorate (LRVK). Annual Report 2020. 2020. Available online: https://lrvk.gov.lv/uploads/files/Dokumenti/Par%20mums/Gadap%C4%81rskati/P%C4%81rskati%20ENG/2020.pdf (accessed on 12 September 2025).
- European Alternative Fuels Observatory. Vehicles and Fleet—Latvia. Available online: https://alternative-fuels-observatory.ec.europa.eu/transport-mode/road/latvia/vehicles-and-fleet (accessed on 12 September 2025).
- Clean Hydrogen Observatory. Hydrogen Refuelling Infrastructure and AFIR Requirements. Brussels: European Commission. 2023. Available online: https://www.clean-hydrogen.europa.eu (accessed on 12 September 2025).


Disclaimer/Publisher’s Note: The statements, opinions and data contained in all publications are solely those of the individual author(s) and contributor(s) and not of MDPI and/or the editor(s). MDPI and/or the editor(s) disclaim responsibility for any injury to people or property resulting from any ideas, methods, instructions or products referred to in the content. |
© 2025 by the authors. Licensee MDPI, Basel, Switzerland. This article is an open access article distributed under the terms and conditions of the Creative Commons Attribution (CC BY) license (https://creativecommons.org/licenses/by/4.0/).