Abstract
Against the backdrop of China’s vigorous pursuit of its “carbon peaking and carbon neutrality” goals, transition finance has emerged as a critical instrument to tackle the financing constraints faced by high-carbon industries. However, the lack of a standardized evaluation system significantly impedes its effective implementation and sustainable development. This paper constructs an evaluation system for transition finance in China’s power sector, incorporating 15 indicators across three logical dimensions: external driving force, internal state, and management response. Using objective weighting and comprehensive ranking methods, the study assesses the transition finance performance of 64 Chinese power enterprises. Furthermore, a variance decomposition index is employed to analyze disparities and imbalances in transition finance development level. Results indicate: (1) the key to enhancing the level of power enterprises’ transition finance development lies in strengthening external policy support intensity and improving capital allocation efficiency; (2) China’s power sector exhibits slow growth in transition finance development, with pronounced internal divergence and uneven progress; and (3) the primary constraint on the development of transition finance in China’s power sector stems from the internal imbalances between two distinct types of enterprises: those heavily dependent on thermal power and those focused on renewable energy. This study proposes a quantifiable methodological framework to facilitate the development of transition finance in the power sector, while also constructing a reference evaluation paradigm to assist high-carbon industries in planning transition pathways and allocating transition capital.
1. Introduction
In 2019, the Organization for Economic Co-operation and Development (OECD) formally conceptualized transition finance as financial activities aimed at supporting the low-carbon transformation of high-carbon industries. Since then, it has forged an international consensus on the development of transition finance. In this context, the Seville Development Finance Conference pledged to scale up financing for more sustainable development in developing nations. In fact, by the end of 2024, the cumulative issuance volume of global green, social responsibility, and sustainability-linked bonds (GSS+ bonds) reached a remarkable 5.6 trillion US dollars. China’s related efforts are substantial, with its cumulative GSS+ bond issuance amounting to approximately 555.5 billion US dollars, accounting for about 9.92% of the total market share. China’s actions are pivotal in accelerating the global transition of enterprises toward a low-carbon future [1]. Against this backdrop, scientifically assessing the actual developmental outcomes of transition finance in typical high-carbon industries has emerged as a pivotal concern for advancing its effective implementation and sustainable growth. In China, the power sector is responsible for more than 40% of the country’s carbon dioxide emissions, ranking highest among the eight major high-carbon industries. Consequently, its transition is especially urgent, and its corresponding financing demands are particularly acute [2,3].
Research on the development of transition finance, both domestically and internationally, has predominantly focused on theoretical studies. Scholars have examined transition finance through various perspectives. Firstly, from the perspective of application, studies are grounded in theoretical foundations, including connotations and frameworks [4], effect mechanisms [5], and practical experiences [6]. Gao J. et al. (2023) [7] contend that the development of green transition finance contributes to enhancing carbon emission performance in local cities. Similarly, Fan S et al. (2024) [8] demonstrate that transition finance can reduce the economic costs for high-carbon industries to achieve their carbon emission reduction targets. Secondly, from the perspective of risk, scholarly attention has been directed toward international comparisons of transition finance risk [9], its operational mechanisms [10], and risk transmission channels [11]. Hao et al. (2023) [12] contend that corporate low-carbon transitions inevitably result in stranded asset risks, which exert significant adverse effects on firm value. Meanwhile, Feng et al. (2025) [13] posit that climate-related transition risks act as a long-term driver of extreme risk spillovers, functioning as a critical catalyst for risk contagion. Thirdly, from the perspective of product, studies by scholars such as Li Ruijie [14] and Xu Hongfeng [15] have systematically analyzed linked transition finance instruments, highlighting the difficulties and challenges inherent in developing such financial products.
In recent years, empirical studies on the measurement and mechanisms of transition finance have become a significant area of inquiry. On one hand, transition finance is measured through principal component analysis applied to provincial-level green finance and carbon finance indices [16,17,18]. On the other hand, another approach employs text analysis to identify firm-level transition finance terminology, where keyword frequencies are aggregated to measure the transition finance of micro-enterprises [19]. Furthermore, dual difference-in-differences (DID) models have been developed to investigate the causal mechanisms underlying the effects of transition finance policies [20,21]. However, existing quantitative studies predominantly rely on macro-aggregated data and employ provincial index methods. Although such approaches can reveal general regional trends, they tend to obscure the distinctive features of different high-carbon industries, such as their transition pathways, technological bottlenecks, and financing needs, which fail to reflect the significant disparities within industries. While text analysis methods can extract relevant information from enterprise disclosures, they often fall short in directly measuring substantive transition activities at the micro-enterprise level. Moreover, this approach is susceptible to distorted outcomes due to enterprises’ “greenwashing” practices.
Therefore, this paper proposes the DFSR model framework. Utilizing balanced panel data from 64 power enterprises spanning 2019 to 2022, the study applies the entropy weight-TOPSIS method and the Theil Index to conduct a comprehensive evaluation and differential analysis of the development level of transition finance in China’s power sector. The findings are intended to offer useful insights for subsequent research in this field. This study’s research contributions are as follows: First, the DFSR model, originally from the field of environmental management, is introduced into transition finance evaluation and restructured for the first time. This study thus constructs a 15-indicator transition finance evaluation system for the power sector, thereby more accurately capturing the proactive driving mechanism of transition finance. Second, the entropy weight-TOPSIS method is adopted as a weighted integration for comprehensive measurement, balancing the objectivity of weighting with the intuition of ranking results. Third, enterprises are innovatively grouped using the Theil Index based on “energy dominance”, which directly identifies the primary drivers of structural imbalances in the power sector.
2. Construction of the Transition Finance Evaluation Indicator System and Research Methodology
2.1. Indicator Construction
The Driving Force-State-Response (DFSR) model was proposed in 1996 by institutions such as the United Nations Commission on Sustainable Development (UNCSD) and the United Nations Department for Policy Coordination and Sustainable Development (DPCSD). Based on the Pressure-State-Response (PSR) model, it is a core indicator system for sustainable development, which expands environmental indicators to include economic and social indicators [22]. The essence of transition finance lies in leveraging financial instruments to proactively drive transformation and enhance transformative dynamics. In contrast to the passive responsive logic of the PSR model—where environmental “state” and social “response” are derived from the “pressure” exerted by human activities on the environment—the DFSR model reflects the proactive driving logic of transition finance more accurately and comprehensively. By incorporating core “driving force”, namely policies, markets, and technologies, as priorities within its indicator system, the model achieves a high degree of conceptual consistency between its framework and the research subject. This study upholds the principles of scientific systematicness, industrial applicability, and data verifiability. By closely integrating the specific context and core connotation of the power sector’s low-carbon transition, it pioneers the introduction and reconstruction of the DFSR model from the field of environmental management into transition finance evaluation. A 15-indicator evaluation system for the transition finance of power sector is constructed, covering three dimensions: Driving Force (D), State (S), and Response (R). The theoretical framework of this system is presented in Figure 1. This model innovatively articulates the inherent dynamic mechanism of transition finance: “external resource drivers→corporate environmental performance→corporate response actions.” It links the national macro “dual carbon” orientation with actionable, quantifiable micro-level corporate indicators, bridging the gap between macro policy goals and micro implementation metrics.
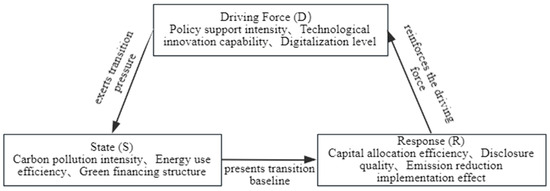
Figure 1.
DFSR Theoretical Framework.
First, we systematically review authoritative literature in domains including transition finance [23,24,25], green finance [26,27], and low-carbon transition of the power sector [28,29]. Drawing on international consensus documents such as the G20 Transition Finance Framework, we preliminarily select a series of potential evaluation indicators. Second, subsequent to expert evaluations of the indicators’ logical consistency, representativeness, and data availability, we refine the indicator set via screening, elimination, and adjustment. Finally, we incorporate high-consensus core indicators into the multi-tiered indicator structure of the DFSR model, thus constructing an evaluation system for transition finance in the power sector.
Driving force indicators denote external pressures and internal motivations driving power enterprises toward low-carbon transition. (1) Policy Support Intensity: Carbon trading market participation indicates whether enterprises operate in a well-defined carbon-constrained policy environment. Given that most enterprises do not publicly disclose detailed carbon asset transaction data, the proxy variable “whether the enterprise’s registered location has launched a carbon trading market” serves as a direct indicator of policy coverage and support intensity. The green subsidy intensity per unit of power generated reflects the government’s economic incentive policies for green power and renewable energy, which is measured as “annual green subsidy received/total power generation”. (2) Technological Innovation Capability: Carbon performance reflects an enterprise’s capacity to reduce carbon emissions for a given level of output, measured as the “inverse of carbon emissions per net sales revenue”. The clean technology R&D expenditure ratio indicates an enterprise’s actual investment in low-carbon technology research and development, measured as “annual R&D expenditure/total operating revenue”. (3) Digitalization Level: The digital technology application level directly influences an enterprise’s capacity for the adoption and innovation of such technologies. Given that digital investments and specialized R&D expenditures are non-public internal corporate data characterized by inconsistent statistical methodologies, the “frequency of digital technology-related terms in corporate annual reports” is employed as a proxy variable. Extensive scholarly research has validated via text analysis [30,31] that this proxy effectively measures an enterprise’s strategic shift toward digital transformation.
State indicators are tangible reflections of changes in an enterprise’s current environmental performance. (1) Carbon Pollution Intensity: Carbon emission intensity and pollutant emission intensity reflect the environmental pressure imposed by an enterprise’s production activities, measured, respectively, as “total carbon emissions/total power generation” and “total pollutant emissions/total power generation”. (2) Energy Use Efficiency: Coal consumption rate of power generation serves as the core indicator to measure the energy conversion efficiency of thermal power enterprises, which is measured as “standard coal consumption for power generation/total power generation”. (3) Green Financing Structure: The share of green credit reflects the greening level of an enterprise’s financing structure, measured as “green credit balance/total credit balance”.
Response indicators refer to specific measures adopted to respond to external drivers and improve internal conditions, as well as their corresponding outcomes. (1) Capital allocation efficiency: The share of environmental governance expenditures reflects an enterprise’s willingness and intensity in allocating operating revenue to environmental improvement, measured as “annual environmental governance expenditures/total operating revenue”. The green outcome transformation efficiency reflects the overall effectiveness of an enterprise’s green innovation, measured via the DEA-SBM model to estimate the efficiency value of transforming green innovation inputs into economic and environmental benefits [32]. (2) Disclosure Quality: ESG score and green information disclosure quality reflect an enterprise’s efforts and achievements in non-financial performance management. While ESG scores are comprehensive, they are not static; rather, they reflect market assessments derived from a series of corporate management initiatives, including proactively improving overall disclosure quality, optimizing internal governance structures, and diligently fulfilling social responsibilities. These scores directly mirror the effectiveness of such response actions and are measured by the “Huazheng Index ESG Score”. Green information disclosure quality is measured by the “total score of 25 environmental disclosure items covering five corporate dimensions” [33]. (3) Emission Reduction Implementation Effect: The carbon intensity reduction rate reflects the practical progress attained via corporate emissions reduction initiatives, measured as “1 − current period carbon intensity/base period carbon intensity”. Meanwhile, carbon asset efficiency denotes the economic output per unit of carbon emissions, measured as “total operating revenue/carbon emissions”. In summary, the evaluation indicator system for transition finance in the power sector is presented in Table 1.

Table 1.
Evaluation Indicator System for Transition Finance in the Power Sector.
2.2. Research Methodology
2.2.1. Entropy Weight-TOPSIS Method
When constructing a multi-indicator evaluation system that is theoretically consistent, procedurally transparent, and outcome-interpretable, it is critical for us to select a mathematical method capable of appropriately addressing indicator weights and performing effective ranking. In terms of existing composite indicator construction methods, Principal Component Analysis (PCA) can reduce data dimensionality but undermines the economic significance of original indicators, thereby weakening the interpretability of evaluation outcomes. Data Envelopment Analysis (DEA) relies strictly on clearly defined inputs and outputs, rendering it challenging to align with the “driving force→state→response” causal logic of the DFSR model. Machine learning methods are characterized by complex models and inadequate interpretability. Their inherent “black box” nature results in opaque procedures, making it difficult to trace the specific contribution pathways of individual indicators to the final evaluation outcomes. This substantially diminishes the policy relevance and communicability of the evaluation outcomes. However, the entropy weight method is a robust method that determines weights based on the variability of individual indicators, thereby effectively mitigating interference from subjective human biases. In parallel, the TOPSIS method derives the comprehensive evaluation index for each evaluation object by constructing a normalized decision matrix. The evaluation process is transparent and reproducible, facilitating a clear and objective ranking of research samples. Therefore, this study employs the entropy weight-TOPSIS method to compute the transition finance development index for listed enterprises in China’s power sector, thereby facilitating an accurate evaluation of the levels and trends of transition finance development within the power sector. First, the entropy weight method incorporating a time variable is used to assign weights and calculate entropy values for each indicator, thereby identifying the primary indicators influencing the development of transition finance in the power sector. Second, building upon the entropy weight method, a weighted standardized matrix is constructed. The TOPSIS method is then applied to calculate the relative proximity of China’s power sector to the ideal solution for each year so as to conduct sub-item evaluations and a comprehensive evaluation of the development level of transition finance in the power sector.
There are m research subjects and n evaluation indicators; let Xij denote the original value of the j-th indicator for enterprise i.
To eliminate differences in data units and dimensions, this study applies separate standardization processes to positive and negative indicators. Meanwhile, to avoid the presence of zero values and negative values from affecting subsequent calculations, a minimum unit value α is added to the standardized data, with α = 0.0001. Specific indicator processing is as follows:
First, standardization:
Positive indicator:
Negative indicators:
Herein, Xij’ denotes the standardized value of the j-th indicator for enterprise i; maxXij denotes the maximum value of the j-th indicator; minXij denotes the minimum value of the j-th indicator.
Second, calculate the proportion of each indicator:
Third, calculate the entropy value for each indicator:
Fourth, calculate the weights for each indicator:
Fifth, construct the weighted standardized matrix:
Sixth, compute positive and negative ideal solutions:
Positive ideal solution:
Negative ideal solution:
Seventh, calculate the Euclidean distance:
Distance from the optimal solution:
Distance from the worst solution:
Finally, calculate the relative proximity of company i for each year:
Relative proximity Ci represents the comprehensive evaluation index for each sample. Its value ranges from (0, 1). The closer Ci is to 1, the better the evaluation subject performs, indicating a higher level of transition finance development for that enterprise, and vice versa. The ranking of Ci values reflects the hierarchical order of transition finance development levels among enterprises.
2.2.2. Theil Index
The Theil Index is a metric for measuring data imbalance between individuals or regions, reflecting disparities in transition finance development levels among enterprises in China’s power sector. Its value ranges from 0 to 1, where a higher index indicates greater disparity and a lower index indicates lesser disparity. In selecting grouping methods, this study moves beyond traditional approaches that rely on enterprise size, geography, or ownership structure. Instead, it innovatively classifies the 64 research samples into thermal power and renewable energy groups based on the power generation mix and installed capacity structure of power enterprises. This classification is anchored in “energy dominance”—namely, whether thermal power or renewable energy predominates. This stems from the core contradiction in the transformation of China’s power enterprises: balancing existing thermal power assets against the expansion of renewable energy capacity. Thermal power and renewable energy constitute inherently opposing options within the energy structure. They exhibit fundamental differences in transformation starting points, technological pathways, financing requirements, and risk exposures. Such inherent differences directly shape the accessibility to transition finance and its application pathways. Therefore, this categorization aligns with the intrinsic logic of transition finance, thus uncovering structural imbalances in the development of transition finance across enterprises with distinct core production assets. The thermal power group includes 32 power enterprises such as Shenzhen Energy, Shennan Power, and Hengyun enterprises. The renewable energy group includes 32 power enterprises such as Tunghsu Azure, Sichuan New Energy Power, and CECEP Solar Energy. Furthermore, the transition finance evaluation index for power enterprises is selected as the core variable of the Theil Index, with total power generation as the weight variable. This is because the distribution of power generation inherently exhibits spatial imbalance, which serves to directly reflect the core output scale of power enterprises. The specific calculation formulas are as follows:
Grouped Theil Index:
Within-group disparity:
Between-group disparity:
Overall Theil Index:
In Equations (12)–(15), the entire sample is divided into i groups. Cij denotes the comprehensive transition finance evaluation index of the j-th enterprise in group i, Ci denotes the sum of comprehensive evaluation indices for all enterprises in group i, and C denotes the sum of comprehensive evaluation indices for all power enterprises. Eij denotes the power generation volume of the j-th enterprise in group i, Ei denotes the sum of power generation volumes for all enterprises in group i, and E denotes the sum of power generation volumes for all power enterprises.
2.3. Data Sources
This study selects A-share listed enterprises in the power sector that were listed prior to 2019 and not designated as ST, *ST, or PT as the research sample, while excluding those with missing variables during the sample period. The final dataset comprises balanced panel data on the transition finance development levels of 64 Chinese power enterprises from 2019 to 2022, containing 256 annual sample observations. Primarily, data regarding green subsidies, digital technology adoption, and environmental governance expenditures are sourced from the annual reports, corporate social responsibility (CSR) reports, and sustainability reports of listed enterprises. ESG scores are derived from the Huazheng Index ESG Rating System. Other foundational data are obtained from the Guotai An (CSMAR) Database. For partially missing data, linear regression is employed for imputation, specifically through the construction of a linear regression model with year as the independent variable and indicator values as the dependent variable. Data processing and empirical analysis are conducted using Stata 18.
3. Analysis of Transition Finance Development Levels
3.1. Indicator Weight Analysis
This study employs the entropy weight method to calculate the weights of each indicator at all levels, with results presented in Table 2. Within the first-level indicator dimension of the power sector’s transition finance evaluation system, Driving Force (D) exerts the greatest influence on transition finance development, with a weight of 0.5330, followed by Response (R) at 0.4353. While State (S) has the least impact, with a weight of only 0.0318. The results indicate that Driving Force (D) and Response (R) are the core dimensions influencing the development level of transition finance across enterprises in the power sector, accounting for a combined weight of 96%. At the second-level indicator dimension, capital allocation efficiency, policy support intensity, technological innovation capability, and emission reduction implementation effect ranked highest in weight, at 0.3165, 0.3064, 0.2173, and 0.0998, respectively. All these indicators belong to the first-level indicator dimension of Driving Force (D) and Response (R). The results indicate that these four indicators are key factors influencing the development level of transition finance in the power sector. At the third-level indicator dimension, the largest weights are assigned to share of environmental governance expenditures, green subsidy intensity per unit of power generated, clean technology R&D expenditure ratio, carbon trading market participation, and carbon asset efficiency, with weights of 0.2942, 0.2070, 0.1186, 0.0994, and 0.0988, respectively. These indicators belong to the second-level indicator dimension of capital allocation efficiency, policy support intensity, technological innovation capability, and emission reduction implementation effect, as well as the first-level indicator dimension of Driving Force (D) and Response (R). The results indicate that these five factors are key indicators influencing the development level of transition finance in the power sector. In addition, it further shows that strengthening policy guidance and effective capital investment remain the two core engines driving China’s power sector toward low-carbon transition.
Table 2.
Indicator Weights in the Transition Finance Evaluation System for the Power Sector.
3.2. Analysis of Transition Finance Development Level
3.2.1. Comprehensive Evaluation of Transition Finance Development Level
Based on the indicator weights calculated using the entropy weight method, this paper employs the TOPSIS method to derive the evaluation indices and rankings for the transition finance development levels of 64 power enterprises from 2019 to 2022. The annual averages represent the comprehensive evaluation indices for transition finance development in China’s power sector. Furthermore, the top six power enterprises with the highest transition finance evaluation indices in 2022—Shenzhen Energy, Shennan Power, Jiangxi Ganneng, Hengyun Enterprises, Devotion, and Meiyan Jixiang—are compared with the annual comprehensive evaluation indices of China’s power sector, with results shown in Table 3.
Table 3.
Comprehensive Evaluation Index and Ranking of Transition Finance Development Level in the Power Sector.
Among power enterprises, Shenzhen Energy’s transition finance evaluation index shows significant fluctuations: it declined by 27.34% from 2019 to 2020, rebounded by 13.83% from 2020 to 2021, and remained stable at 0.3326 in 2022. Its ranking has consistently held within the top two positions, reflecting Shenzhen Energy’s sustained leadership in transition finance development within the sector. Shennan Power’s index slightly decreased from 2019 to 2020 but surged significantly to 0.3287 from 2020 to 2021, representing a 55.56% growth rate. It reached 0.3235 in 2022, climbing to second place. This demonstrates Shennan Power’s notable progress in transition finance development. Although Jiangxi Ganneng’s evaluation index has declined annually, its absolute values remain consistently high. It ranked as the top enterprise in the power sector for transition finance development from 2019 to 2021, with a peak index of 0.5009. Its 2022 index of 0.3187 placed it third, indicating a deceleration in its transition finance development pace. Hengyun Enterprises’ evaluation index has shown continuous growth, particularly with a significant increase in 2022. It rose from 0.2362 in 2021 to 0.2969, representing a growth rate of 25.70%. Its ranking fluctuated but rose to fourth place in 2022, reflecting further improvement in Hengyun Enterprises’s performance in transition finance development. Devotion’s evaluation index rose steadily from 0.2461 in 2019 to 0.2480, 0.2779, and 0.2903. Although its ranking declined slightly in 2022, it remains in the upper tier overall, indicating a relatively steady improvement in Devotion’s transition finance development level. Meiyan Jixiang maintains high growth rates, rising 21.38% from 2020 to 2021 and continuing to increase by 17.00% from 2021 to 2022, consistently ranking sixth. This reflects Meiyan Jixiang’s persistent efforts in advancing transition finance. Within the power sector, China’s transition finance development level shows annual growth from 2019 to 2022, though at a relatively slow pace. It increased from 0.1406 to 0.1695, representing a growth rate of only 20.56%. The 2022 comprehensive evaluation index reached its peak at 0.1695, yet it remained significantly below the transition finance evaluation indices of the top six power enterprises. This indicates pronounced differentiation within China’s power sector regarding transition finance development, with leading enterprises standing out distinctly. The sector as a whole is currently in a critical transitional phase, shifting from “initial development” to “rapid growth”. Comparative analysis reveals pronounced disparities among enterprises in the power sector regarding transition finance development. While a few companies maintain steady progress, most lag behind, exhibit insufficient momentum, or experience intermittent setbacks in transition finance development. This results in a relatively low overall level of transition finance development within China’s power sector.
3.2.2. Itemized Evaluation of Transition Finance Development Level
Building upon the comprehensive evaluation of China’s power sector transition finance development, this study conducts an itemized evaluation at the first-level indicator dimension. First, the top six power enterprises with the highest transition finance evaluation indices in 2022 are selected as research subjects: Shenzhen Energy, Shennan Power, Jiangxi Ganneng, Hengyun Enterprises, Devotion, and Meiyan Jixiang. Second, Equation (6) is applied to the indicator data and weights at the levels of Driving Force (D), State (S), and Response (R). Ultimately, this study yields the itemized evaluation indices and rankings for the development level of transition finance among these six power enterprises from 2019 to 2022. The results are shown in Table 4 and Figure 2.
Table 4.
Itemized Evaluation Index and Ranking for the Transition Finance Development Level of Power Enterprises.
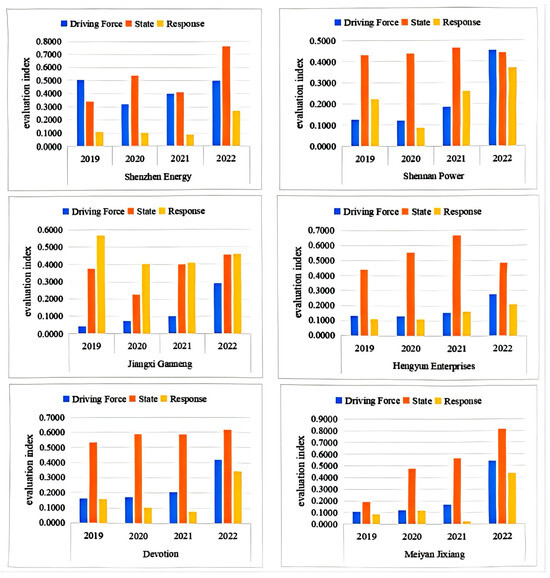
Figure 2.
Itemized Evaluation Results for the Transition Finance Development Level of Power Enterprises.
Overall, from 2019 to 2022, the evaluation indices for driving force, state, and response across the six power enterprises show fluctuating upward trends. The development level of transition finance in the power sector is gradually improving, but significant imbalances persist across different indicators and enterprises.
At the Driving Force (D) level, most enterprises show accelerated growth in their evaluation indices starting in 2021. Shenzhen Energy maintains a consistently high index throughout the four-year period, while Shennan Power and Meiyan Jixiang demonstrate the most significant improvement trends, emerging as leading enterprises in driving force. Regarding the State (S) dimension, the state evaluation indices exhibit overall greater volatility and are notably higher than the driving force and response evaluation indices across all companies. This indicates that power enterprises generally possess a solid foundational level and a favorable current status in the state dimension. Given that the combined weight of driving force and response indicators significantly exceeds that of the state dimension, it further suggests that disparities in the development of transition finance among enterprises primarily stem from the driving force and response dimensions. These two dimensions are the key decisive factors in evaluating the development of transition finance within power enterprises. At the Response (R) level, the response evaluation indices exhibit scattered and relatively low variations. Jiangxi Gannen demonstrates the strongest response capability, maintaining a leading evaluation index for four consecutive years. Other enterprises show a trend of initial decline followed by rapid improvement, particularly Shennan Power and Meiyan Jixiang, which achieved the fastest progress in 2021–2022. Nevertheless, the overall response capability of power enterprises remains relatively weak.
Individually, Shenzhen Energy, Shennan Power, and Jiangxi Ganneng stand out as the three power enterprises with the highest transition levels, demonstrating strengths across all three dimensions: driving force, state, and response. Meiyan Jixiang shows the most prominent performance in transition finance development, exhibiting the most significant growth trend. In contrast, Hengyun Enterprises and Devotion perform poorly in both driving force and response dimensions.
3.3. Disparities in Transition Finance Development Level
To further analyze disparities and imbalances in transition finance development among China’s power enterprises, the Theil Index is applied to calculate within-group disparity, between-group disparity, total disparity, and group disparity, with results shown in Table 5.
Table 5.
Theil Index of Transition Finance Development in the Power Sector.
The results for within-group disparity and between-group disparity reveal that the within-group Theil Index has consistently far exceeded the between-group Theil Index year after year. This indicates that the imbalance in transition finance development within the power sector primarily manifests as severe disparities among enterprises within the thermal power group and the renewable energy group. Although the within-group Theil Index has shown a declining trend in recent years, it remains the absolutely dominant source of overall variation within China’s power sector.
Regarding the overall Theil Index, it decreased from 0.2142 in 2019 to 0.1285 in 2022, representing a cumulative reduction of 40.01%. This indicates that disparities and imbalances in the development of transition finance within China’s power sector have been effectively mitigated, with the entire industry progressing toward greater coordination and equilibrium. Compared to both within-group disparity and between-group disparity, the reduction in the within-group Theil Index has made a more significant contribution to the downward trend in the overall Theil Index. This further demonstrates that addressing internal imbalances is crucial for promoting overall equilibrium within the power sector.
Regarding group disparity, the Theil Index for the thermal power group decreased from 0.2237 in 2019 to 0.1172 in 2022, a 47.61% reduction. This reflects the sustained and rapid narrowing of internal gaps among thermal power-dominated enterprises. This trend stems from leading central state-owned enterprises like Guodian Power and Huaneng International taking the initiative in practicing transition finance, thereby establishing a demonstration effect among top-tier enterprises. The Theil Index for the renewable energy group first rose from 0.1836 in 2019 to 0.2558 in 2021, then declined to 0.1395 in 2022. This indicates that the internal disparity among renewable energy-focused enterprises first widened before narrowing, yet remains overall higher than that of the thermal power group. Therefore, the internal development imbalance within the renewable energy group represents a new issue requiring focused attention at this stage.
Finally, to validate the robustness of the aforementioned evaluation system and measurement results, this study further applies tail trimming at the 1% and 99% percentiles to the 13 third-level indicators excluding dummy variables and discrete variables, and fully replicates the calculation procedures of the entropy weight-TOPSIS method and the Theil Index. Robustness tests yield the following key findings: First, despite minor numerical fluctuations in indicator weights, the core position of the “Driving Force (D)” dimension remains unshaken, with its weight exhibiting a steady upward trend. This underscores that policy support and technological innovation underpin the most fundamental drivers of transition finance development. Second, neither the ranking structure of enterprise comprehensive evaluation indices nor the core conclusion of the Theil Index—namely, that “within-group disparities dominate overall disparities”—underwent fundamental changes. This confirms that after mitigating the interference of outliers, the indicator system constructed in this study and its primary conclusions exhibit high consistency and explanatory power, thus verifying the robustness and reliability of the research findings.
4. Research Conclusions and Discussion
4.1. Research Conclusions
In terms of the temporal characteristics of transition finance development, the development level of transition finance in China’s power sector shows a slow growth trend. First, the indicator weight reveals that Driving Force (D) and Response (R) are the core dimensions influencing transition finance maturity in the power sector, while capital allocation efficiency and policy support intensity are the most critical indicators affecting power enterprises’ transition finance maturity. Second, the comprehensive evaluation indicates that China’s power sector transition finance is in a critical transitional phase, with an overall low development level and significant disparities and imbalances within the sector. Third, the itemized evaluation reveals that power enterprises generally have a good foundational level and current status at the state level but exhibit notable shortcomings in the driving force and response dimensions, which are the two decisive factors in evaluating their transition finance development. Fourth, the Theil Index indicates that disparities and imbalances in China’s power sector transition finance are gradually improving annually. However, these imbalances primarily stem from severe developmental disparities among enterprises within thermal power and renewable energy groups.
Furthermore, it is important to acknowledge that the study period of this research largely coincided with the global COVID-19 pandemic. During this period, global energy demand experienced unprecedented disruptions. Motivated by the need to preserve cash flow and ensure survival, many power enterprises may have postponed or reduced specific medium-to-long-term low-carbon transition-related investments. This partly accounts for the relatively slow growth trend of transition finance overall. Nevertheless, it is worth highlighting that even under such intense external pressures, the comprehensive evaluation indices for transition finance in China’s power sector still record modest growth. Specifically, leading enterprises sustain a high level of transition finance-related development, underscoring the remarkable resilience of China’s power sector leaders in their pursuit of low-carbon transition strategies. Finally, based on the above findings, this study offers the following policy implications:
- (1)
- Improve the accuracy and equity of policy-driven measures. It is advisable to require enterprises to participate in the carbon trading market as a precondition for receiving transition finance support. Additionally, a dedicated “Just Transition Support Fund” should be established to assist small and medium-sized enterprises, thereby mitigating potential structural financing barriers that may result from policy implementation.
- (2)
- Optimize the management mechanisms governing capital allocation and performance evaluation. Financial institutions should develop financing instruments explicitly linked to key performance indicators (KPIs) for the sustainability transition. These KPIs must be tailored to enterprise types and respective stages of transition so as to align incentives effectively. Meanwhile, stringent financial constraints should be imposed on enterprises that fail to achieve the agreed-upon targets.
- (3)
- Establish a transformation ecosystem spearheaded by leading enterprises to facilitate cross-industry collaboration. It is advisable for energy management authorities to take the lead in creating a “Transformation Technology and Funding Collaboration Platform”. This platform would promote the transfer of mature energy-saving and carbon-reduction technologies from large corporations to small and medium-sized enterprises within the same industry. Meanwhile, it also offers complementary financing channels to address structural bottlenecks.
4.2. Discussion
In terms of model integration and indicator selection, this paper introduces and reconstructs the DFSR model into transition finance evaluation for the first time, which is originally from the field of environmental management. In contrast to the passive responsive logic of the PSR model, the DFSR model more accurately reflects the proactive driving logic of transition finance and constructs an evaluation indicator system featuring distinct transition finance attributes. This is consistent with the transition finance Key Performance Indicator (KPI) conceptualized by scholars including Ma Jun [23]. In terms of measurement methodology, in contrast to prior studies that rely on provincial-level macrodata and employ principal component analysis [16,17,18] or text analysis [19], this paper adopts the entropy weight-TOPSIS method and the Theil Index to conduct a comprehensive evaluation and ranking of transition finance in the power sector using enterprise-level microdata. This approach uncovers deeper structural disparities within the sector and captures substantive transition activities rather than merely declarative intentions. Regarding variance decomposition, this study innovatively categorizes cases based on the criterion of “energy dominance”, thereby directly identifying the key drivers of structural imbalances within the sector and thus offering policymakers more targeted analytical tools.
While this study focuses on China’s power sector, its methodological approach and core findings possess substantial comparative value and implications for developing economies endowed with abundant conventional energy assets. The limitations are primarily reflected in: First and foremost, the research sample is confined exclusively to listed enterprises in China’s A-share power sector. This limitation implies that the findings may not be generalizable to the numerous small and medium-sized unlisted enterprises confronted with more acute financing and technological constraints during the low-carbon transition, thereby compromising the sample’s representativeness. Second, the measurement of green outcome transformation efficiency is inherently afflicted with temporal lags. Patent application and authorization processes are protracted, and there is a substantial time lag between these phases and the practical application of technologies or the attainment of commercial value. Finally, the data employed in this study is up to date as of 2022 and thus fails to capture recent pivotal policy developments, resulting in limitations regarding timeliness. Going forward, we will continue to track and integrate the latest post-2022 data, explore more advanced econometric methodologies—including machine learning algorithms and dynamic panel models—coupled with state-of-the-art technologies, and extend the application and research scope to other high-carbon sectors.
Author Contributions
Conceptualization, Z.X. and X.X.; Methodology, X.X.; Software, X.X.; Validation, X.X., Y.L., and Q.H.; Formal analysis, X.X.; Investigation, X.X.; Resources, Y.L. and Q.H.; Data curation, X.X.; Writing—original draft preparation, X.X.; Writing—review and editing, Z.X. and X.X.; Visualization, X.X.; Supervision, Z.X.; Project administration, Z.X. All authors have read and agreed to the published version of the manuscript.
Funding
This research received no external funding.
Institutional Review Board Statement
Not applicable.
Informed Consent Statement
Not applicable.
Data Availability Statement
The data presented in this study can be obtained from the corresponding author upon reasonable request.
Conflicts of Interest
The authors declare no conflicts of interest.
References
- Mariani, M.; D’eRcole, F.; Frascati, D.; Fraccalvieri, G. Sustainability-linked bonds, corporate commitment and the cost of debt. Res. Int. Bus. Financ. 2025, 74, 102658. [Google Scholar] [CrossRef]
- Liu, Y.; Gao, C.; Yang, X.; Yuan, J.; Ren, Y. Credible transition plans for coal power sector: Current disclosure framework and considerations for transition finance. Carbon Footpr. 2023, 3, 1. [Google Scholar] [CrossRef]
- Tandon, A. Transition Finance: Investigating the State of Play: A Stocktake of Emerging Approaches and Financial Instruments; OECD Environment Working Papers; OECD: Paris, France, 2021. [Google Scholar]
- Wang, Y.; Zhang, G. Transition Finance: Connotation, Framework and Future Prospects. Contemp. Econ. Sci. 2024, 46, 1–17. [Google Scholar]
- Xiao, H. Cultivation of new quality productivity and risk management of stranded assets: A dual-effect mechanism of transition finance. Reg. Financ. Res. 2024, 46, 32–39. [Google Scholar]
- Wei, T.; Wang, H. Theoretical basis, practical experience and countermeasures of transition finance. Enterp. Econ. 2023, 42, 141–149. [Google Scholar]
- Gao, J.; Hua, G.; Mahamane, F.; Li, Z. Can green transformation finance contribute to urban carbon emission performance? An empirical analysis based on a spatiotemporal bi-fixed SPDM model. Environ. Sci. Pollut. Res. Int. 2023, 30, 102947–102971. [Google Scholar] [CrossRef]
- Fan, S.; Wang, C. Transition finance facilitates lower-cost achievement of climate targets: A case study of China. Struct. Change Econ. Dyn. 2024, 71, 617–629. [Google Scholar] [CrossRef]
- Wang, B.; Lin, L. Progress and Lessons from Domestic and International Practices in Managing Financial Risks during Transformation. Mod. Financ. 2024, 9, 2722–2734. [Google Scholar]
- Kang, J. Theoretical Research and Mechanism Analysis of Financial Risks in Transformation. West. Financ. 2024, 27–32, 37. [Google Scholar]
- Wei, H.; Liao, Y. Financial risk transmission mechanism and empirical simulation of transition finance. Heilongjiang Financ. 2023, 8, 33–40. [Google Scholar]
- Hao, S.; Ping, W.; Ao, B. The impact of stranded asset risk on corporate value in the context of transition finance. Financ. Econ. Res. 2023, 38, 66–81. [Google Scholar]
- Feng, A.; Chen, Y. Quantile time–frequency connectedness between green finance and shipping markets: The role of climate transition and physical risks. Int. Rev. Econ. Financ. 2025, 104, 104704. [Google Scholar] [CrossRef]
- Li, R.; Can, W. Research on the challenges and countermeasures of linked transition financial instruments to support the low-carbon transformation of enterprises. China Environ. Manag. 2024, 16, 57–62. [Google Scholar]
- Xu, H.; Yi, L. Innovation, comparative analysis and development suggestions of transition financial products at home and abroad. Southwest Financ. 2023, 9, 15–31. [Google Scholar]
- Liu, C.; Yang, Y.; Chen, S. How does transition finance influence green innovation of high-polluting and high-energy-consuming enterprises? Evidence from China. Environ. Sci. Pollut. Res. Int. 2024, 31, 8026–8045. [Google Scholar] [CrossRef] [PubMed]
- Khan, S.; Pinglu, C.; Ullah, A.; Qian, N. Facilitating sustainable corporate growth in China: Examining the role of transition finance, green technology innovation, and ESG strategies in the path to sustainability. J. Environ. Manag. 2025, 389, 126085. [Google Scholar] [CrossRef]
- Khan, S.; Ullah, A.; Pinglu, C.; Kashif, M. Impact of financial technology innovation on sustainable transition finance: The moderating role of globalization in BRI, advanced and emerging economies. Clean Technol. Environ. Policy 2024, 27, 1479–1503. [Google Scholar] [CrossRef]
- Wang, Y. Greenwashing or green evolution: Can transition finance empower green innovation in carbon-intensive enterprise? Int. Rev. Financ. Anal. 2025, 97, 103826. [Google Scholar] [CrossRef]
- Yang, T.; Zhou, B. Does transition finance policies persistently fuel green innovation in brown firms? Investigating the roles of ESG rating and bank connection. Pac. Basin Financ. J. 2025, 90, 102674. [Google Scholar] [CrossRef]
- Chen, P.; Yao, X.; Li, J.; Wang, Y. Does the transition finance policy facilitate lending for heavy polluters? Insights from China. Financ. Res. Lett. 2025, 83, 107625. [Google Scholar] [CrossRef]
- Xuan, Z. Research on the Impact of Real Estate Tax Policy on Housing Prices Based on DFSR Model: A Case Study of Shanghai. China Real Estate 2014, 10, 33–40. [Google Scholar]
- Ma, J.; Guo, J.; Zhao, G. Key Performance Indicators of Transition Financial Instruments. China Financ. 2023, 15, 27–29. [Google Scholar]
- Kasdan, M.; Kuhl, L.; Kurukulasuriya, P. The evolution of transformational change in multilateral funds dedicated to financing adaptation to climate change. Clim. Dev. 2021, 13, 427–442. [Google Scholar] [CrossRef]
- Liu, H.; Liu, Z.; Zhang, C.; Li, T. Transformational insurance and green credit incentive policies as financial mechanisms for green energy transitions and low-carbon economic development. Energy Econ. 2023, 126, 107016. [Google Scholar] [CrossRef]
- Li, C.; Bao, Y.; Li, Y.; Yue, M.; Wu, L.; Mao, Y.; Yang, T. Assessment of the coupling coordination relationship between the green financial system and the sustainable development system across China. Sci. Rep. 2024, 14, 11534. [Google Scholar] [CrossRef]
- Bai, X. Exploring the Sustainable Development Path of a Green Financial System in the Context of Carbon Neutrality and Carbon Peaking: Evidence from China. Sustainability 2022, 14, 15710. [Google Scholar] [CrossRef]
- Xie, N.; Hu, H.; Fang, D.; Shi, X.; Luo, S.; Burns, K. An empirical analysis of financial markets and instruments influencing the low-carbon electricity production transition. J. Clean. Prod. 2021, 280, 2. [Google Scholar] [CrossRef]
- Zhou, D.; Zhao, S.; Ding, H.; Wang, Q. Optimal transition pathways toward carbon neutrality in Chinese power sector: Considering regional heterogeneity and technological change. Comput. Ind. Eng. 2023, 183, 109553. [Google Scholar] [CrossRef]
- Jin, S.; Deng, F. Research on Sustainable Economic Dynamics: Digital Technology Development and Relative Poverty of Urban Households. Sustainability 2024, 16, 3407. [Google Scholar] [CrossRef]
- Qi, Y.; Han, M.; Zhang, C. The Synergistic Effects of Digital Technology Application and ESG Performance on Corporate Performance. Financ. Res. Lett. 2024, 61, 105007. [Google Scholar] [CrossRef]
- Xiao, R.; Chen, X.; Qian, L. Heterogeneous Environmental Regulation, Government Support and Enterprise Green Innovation Efficiency: Based on the Perspective of Two-stage Value Chain. Financ. Trade Res. 2022, 33, 79–93. [Google Scholar]
- Kong, D.; Wei, Y.; Ji, M. Research on the impact of environmental protection fee tax reform on enterprise green information disclosure. Secur. Mark. Herald. 2021, 8, 2–14. [Google Scholar]
Disclaimer/Publisher’s Note: The statements, opinions and data contained in all publications are solely those of the individual author(s) and contributor(s) and not of MDPI and/or the editor(s). MDPI and/or the editor(s) disclaim responsibility for any injury to people or property resulting from any ideas, methods, instructions or products referred to in the content. |
© 2025 by the authors. Licensee MDPI, Basel, Switzerland. This article is an open access article distributed under the terms and conditions of the Creative Commons Attribution (CC BY) license (https://creativecommons.org/licenses/by/4.0/).