Abstract
Addressing the urgent challenges of plastic pollution and food waste, this study develops a high-performance, fully biodegradable bio-nanocomposite film from renewable agricultural resources through a data-driven optimization approach. The ternary system combines cassava starch (matrix), cellulose nanofibrils (CNFs for reinforcement), and nano-silica materials (SiO2-NPs as barrier enhancer). Response Surface Methodology synergistically coupled with the Firefly Algorithm—a metaheuristic optimization technique—systematically determined the optimal formulation (1.99% w/v starch, 1.38% w/v CNF, 0.30% w/v SiO2-NPs). The optimized film achieved exceptional performance: tensile strength of 5.813 MPa, elongation at break of 12.37%, and water vapor permeability of 5.395 × 10⁻⁶ g·cm−1·s−1·Pa−1. Critically, the film demonstrated over 80% biodegradation within 60 days and superior UV-shielding capabilities (>90%), effectively extending food shelf-life while minimizing environmental impact. This work establishes a robust strategy for designing sustainable packaging materials through intelligent optimization, valorizing agricultural by-products, and contributing to circular economy principles and UN Sustainable Development Goals. The integration of renewable resources with metaheuristic algorithms represents a significant advancement toward sustainable food packaging solutions.
1. Introduction
With the escalating severity of global plastic pollution and the progressive depletion of non-renewable fossil resources [1], the development of biodegradable and environmentally friendly green packaging materials has become an urgent imperative for both scientific research and industrial advancement [2]. In this context, biodegradable films derived from natural polymers, particularly starch-based films, have demonstrated immense application potential owing to their renewable nature, complete biodegradability, and wide availability [3].
In recent years, research in the field of bio-based packaging materials has shown rapid growth [4,5,6]. Analysis of the literature indicates that starch-based films and their composite systems with other natural polymers (such as chitosan) have emerged as prominent research hotspots [7,8], with research focus concentrated on food preservation applications, intelligent packaging, and edible films. Among these, the selection of starch sources [9,10,11], composite modification with chitosan [12,13,14], and enhancement of mechanical properties [15] represent core research themes in this field.
Among the various starch sources, cassava starch is regarded as an ideal substrate for preparing preservative films due to its relatively high amylopectin content, low cost, and ease of gelatinization [16,17,18]. Despite its excellent film-forming properties, pure starch films exhibit inherent deficiencies that severely limit their practical applications [19,20,21]. Specifically, these limitations manifest as follows: firstly, starch films possess poor mechanical strength, characterized by high brittleness and insufficient flexibility [22]. Secondly, as a hydrophilic polymer, starch films exhibit poor water resistance and a high water vapor permeability (WVP) [23]. Lastly, their oxygen barrier properties also require significant improvement. Collectively, these drawbacks constrain the widespread application of cassava starch-based preservative films.
To overcome these deficiencies, researchers have widely adopted modification strategies, such as blending with other natural polymers or incorporating nanomaterials to achieve synergistic performance enhancement through interfacial reinforcement and nano-effects. The application of nanotechnology in starch film modification has emerged as a research hotspot in recent years and represents an inevitable direction for development.
Among these nanomaterials, cellulose nanofibrils (CNFs), often derived from agricultural waste, are frequently utilized as reinforcing agents to enhance mechanical properties due to their high aspect ratio, exceptional mechanical strength, and good compatibility with starch [24]. Meanwhile, nano-silica (SiO2-NPs) has been proven to effectively improve the barrier properties of polymers, particularly in reducing WVP, owing to its high specific surface area and excellent hydrophobic characteristics [25].
Building upon the aforementioned research background and technological development trends, this study innovatively combines cassava starch, CNF, and SiO2-NPs to fabricate a high-performance composite preservative film. We hypothesize that the CNF network acts as a reinforcing skeleton to enhance the film’s mechanical strength, while the SiO2-NPs create physical cross-linking points and a hydrophobic barrier, synergistically improving the film’s water and oxygen resistance. Through the synergistic effects among these three components, we aim to systematically address the core deficiencies of single-component cassava starch films in terms of mechanical and barrier properties. This research not only provides a novel formulation strategy for developing fully biodegradable, high-performance food packaging materials but also holds significant practical implications for promoting the high-value utilization of agricultural by-products and achieving sustainable development.
2. Materials and Methods
2.1. Materials and Film Preparation
Cassava starch was purchased from Shanghai Fengwei Industrial Co., Ltd. (Shanghai, China) Cellulose nanofibrils (CNFs) were acquired from Tianjin Můjīnglíng Biotechnology Co., Ltd. (Tianjin, China) Nano-silica (SiO2-NPs, 7 nm) was sourced from Bohuas Nano Technology (Suzhou, China). Glycerol (analytical grade) was obtained from Beijing Reagent (Beijing, China).
The composite films were prepared using the solution casting method. The specific procedure was as follows: First, cassava starch was dispersed in deionized water to prepare starch solutions of 0.5%, 1%, 1.5%, 2%, and 3% (w/v). The solutions were heated to 80 °C and stirred continuously for 1 h on a temperature-controlled magnetic stirrer (HJ-6A) to ensure complete gelatinization. Subsequently, SiO2-NPs were added to concentrations of 0.1%, 0.2%, 0.3%, 0.4%, and 0.5% (w/v), and the mixture was stirred for another hour for uniform dispersion. Next, various concentrations of CNF were added after being ultrasonicated for 0.5 h at 150 W, followed by stirring at 8000 rpm for 1 h. Finally, glycerol (0.7% w/w, based on starch weight) was added as a plasticizer, and the mixture was stirred for 1 h to obtain a homogeneous film-forming solution. 10 mL of the solution was cast into a 9 cm diameter Petri dish and dried in an oven at 50 °C for 3 h to form the composite film samples.
2.2. Characterization of Physical Properties
- Mechanical Properties: The tensile strength (TS) and elongation at break (EB) of the composite films were measured using a Universal Testing Machine. Film samples were cut into 20 mm × 100 mm rectangular strips and conditioned at 25 ± 1 °C and 50 ± 2% relative humidity for 24 h before testing. The test parameters were set as follows: initial grip separation of 70 mm and a test speed of 2 mm/s. Five replicates were tested for each sample, and the average value was reported. TS and EB were calculated using Equations (1) and (2):where TS is the tensile strength (N/mm2), F is the maximum tension force at the point of film rupture (N), d is the thickness of the tested film (mm), and W is the width of the film (mm).where EB is the elongation at break (%), L is the distance between gauge marks at break (mm), and L0 is the initial distance between gauge marks (mm).
- 2.
- WVP: WVP is a critical indicator for evaluating the moisture barrier performance of preservative films [26,27]. In this study, the WVP was determined using the gravimetric method according to the ASTM E96/E96M-22 standard [28]. The specific testing procedure was as follows: 8.00 ± 0.01 g of anhydrous calcium chloride (desiccant) was placed in a polyethylene Petri dish with a diameter of 50 mm. The Petri dish was sealed with the composite film to be tested, and the initial weight was measured using an electronic analytical balance (accuracy: 0.0001 g). The sample was then placed in a constant temperature and humidity chamber, with the ambient temperature controlled at 25 ± 0.5 °C and the relative humidity at 50 ± 2%. The sample was weighed at 2 h intervals, and the mass change was recorded. The calculation formula is shown in Equation (3):where WVP is the water vapor permeability of the sample (g·m−1·s−1·Pa−1), Δm/Δt is the water vapor mass transfer rate per unit time (g/s), d is the average thickness of the film (m), A is the water vapor transmission area (m2), and Δp is the water vapor pressure difference between the two surfaces of the film, with a value of 1.5845 kPa.
- 3.
- Oxygen Permeability (OP): The oxygen permeability (OP) of the composite films was indirectly determined using Raman spectroscopy. 10.00 ± 0.05 mL of soybean oil was placed in a clean 50 mm diameter Petri dish, sealed with the test film, and subjected to accelerated oxidation in a 60 °C constant temperature oven for 7 days. Subsequently, Raman spectra of the oil samples were collected using a Raman spectrometer with the following parameters: excitation wavelength of 532 nm, laser power of 10 mW, temperature of 25 °C, single scan time of 10 s, and a scanning range of 500–2000 cm−1. The degree of oil oxidation was quantitatively assessed by analyzing the intensity changes in characteristic peaks (e.g., 1656 cm−1 C=C and 1746 cm−1 C=O stretching vibration peaks), which indirectly reflect the oxygen barrier performance of the film.
- 4.
- Film Thickness: The film thickness was measured using a handheld digital micrometer with an accuracy of ±0.001 mm. At least five random locations on each film sample were selected for measurement, and the results are expressed as mean ± standard deviation.
- 5.
- Surface morphology: Scanning electron microscopy (SEM) and energy-dispersive X-ray spectroscopy (EDX) analyses were performed using a JEOL IT-500 SEM (JEOL Ltd., Peabody, MA, USA) equipped with an EDS detector. Prior to observation, the samples were sputter-coated with gold to enhance surface conductivity. Imaging and elemental mapping were conducted at an accelerating voltage of 15 kV. A macroscopic image of the film was acquired using a smartphone within a light-sealed enclosure illuminated by tunable color temperature LED panel lights.
- 6.
- DSC: Differential scanning calorimetry (DSC) was employed to evaluate the thermal properties of the materials. Measurements were performed on a TA Instruments Q2000 DSC under a nitrogen atmosphere with a flow rate of 50 mL/min. Samples weighing 5–10 mg were placed in standard aluminum crucibles and heated from 25 °C to 400 °C at a rate of 10 °C/min.
- 7.
- XRD: X-ray diffraction (XRD) analysis was carried out using a Shimadzu XRD-6100 diffractometer. The samples were scanned over a range of 5–90° at a rate of 5°/min under Cu Kα radiation.
- 8.
- Light Transmittance: The light transmittance of the films was measured using a UV-Vis spectrophotometer. Film samples were cut into 10 mm × 30 mm rectangular strips and fixed flat against the inner transparent window of a cuvette. An empty cuvette was used as the reference. A full-wavelength scan was performed in the 200–800 nm range to measure the absorbance. Transmittance was calculated using Equation (4) [29]:where T is the transmittance (%), and A is the absorbance value.
- 9.
- Biodegradability: A 2 × 2 cm piece of the preservative film was weighed (W0), wrapped in a single layer of gauze, and buried 5 cm deep in soil with 45% humidity. The sample was retrieved every seven days, cleaned of surface soil, and its weight was recorded (W1). The rate of biodegradation was calculated using Equation (5):where ΔW is the biodegradation rate (%), W0 is the initial weight of the film (g), and W1 is the weight of the film after degradation (g).
2.3. Response Surface Methodology (RSM) Experimental Design
To optimize the film-forming process and identify the optimal formulation parameters, an RSM model was established using Design-Expert software (D-E, Version 13, Stat-Ease Inc., Minneapolis, MN, USA). A Box–Behnken design was employed to investigate the effects of three independent variables—starch, CNF, and SiO2-NPs concentrations—on the film’s properties (TS, EB, and WVP).
2.4. Objective Function Based on Desirability Function
The desirability function method is a multi-attribute decision analysis technique used to evaluate and select the best solution or product [30]. It requires the decision-maker to list all evaluation criteria or attributes and assign a weight to each. A satisfaction score, ranging from 0 to 1, is then assigned to each attribute [31]. These scores and weights are combined to form a weighted desirability value, which provides an intuitive measure of the overall performance of the solution across all criteria. The advantage of this method lies in its flexibility and systematic approach, transforming complex decision-making problems into an easily understandable and operable quantitative process, thereby improving the scientific rigor and accuracy of the decision. The transformation of desirability values depends on the nature of the response [32]. Typically, responses can be categorized into three types based on their quality characteristics: “the-smaller-the-better,” “the-larger-the-better,” and “the-nominal-the-best.” WVP corresponds to “the-smaller-the-better,” while TS and EB fit “the-larger-the-better.” The respective formulas are shown in Equations (6) and (7).
For the-smaller-the-better characteristic:
For the-larger-the-better characteristic:
where di is the individual desirability of the i-th response; is the response value for the i-th response as a function of process parameters; Ti is the target value for the i-th quality characteristic; Hi is the upper limit; Li is the lower limit; and Ki and hi are weight factors.
By transforming all response values, individual desirability values can be calculated. Based on practical production needs, appropriate weights are assigned to each individual desirability. The sum of all individual response weights must meet specific conditions. The overall desirability function is then obtained by calculating their geometric mean, as expressed in Equation (8).
where D is the overall desirability value, and Wi is the weight assigned to the i-th individual desirability.
2.5. Firefly Optimization Algorithm
The Firefly Algorithm (FA) is a swarm intelligence optimization algorithm based on the flashing behavior mechanisms of fireflies, proposed by Yang Xin-She in 2009 [33], primarily used for solving global optimization problems. Fireflies produce flashes through a biochemical luminescence reaction in their abdomens. This process is not only a key aspect of their courtship behavior but also a major medium for information exchange between males and females. Their flashing behavior serves multiple ecological functions: it can be used to attract mates or prey, assist in territory marking, and convey warning signals to predators to stay away from their habitat. The Firefly Algorithm is suitable for optimizing both unimodal and multimodal functions and possesses strong local search capabilities, enabling it to locate optimal solutions within limited regions. Furthermore, the algorithm offers advantages such as simple implementation, a small number of parameters, and low parameter sensitivity [34,35,36].
The attractiveness of an individual firefly is positively correlated with its light intensity [33]. For any pair of fireflies, the brighter individual will attract the less bright one, prompting the latter to move toward the former. Light intensity decays with increasing propagation distance. The flashing patterns of fireflies are species-specific: in some species, females use this characteristic to prey on fireflies of other species; in others, groups synchronize their flashes to enhance their attractiveness to prey. Female fireflies typically observe male flash signals from stationary positions. Upon recognizing specific flash patterns, they respond with their own flashes to initiate courtship behavior. Additionally, some females can mimic the flashing patterns of other species to lure and prey on males.
The FA model adopts a hermaphroditic assumption, meaning all individuals, regardless of sex, can attract each other. The algorithm is constructed based on two core concepts: individual light intensity and inter-individual attractiveness [37]. The specific implementation process is illustrated in Figure 1: First, initialize the algorithm parameters, including population size N, light absorption coefficient γ, step factor α, and maximum iteration count Maxgen. Then, randomly generate the initial spatial positions of the population, using the objective function value as the individual’s initial maximum brightness I0, and set the iteration count t = 1. After calculating the initial brightness, perform iterative loops until the termination condition (t ≤ Maxgen) is met: calculate the relative brightness I and attractiveness β of each firefly in the population, and determine the movement direction based on brightness relationships; update individual spatial positions (the individual at the current best position needs to perform a random perturbation operation); recalculate brightness I0 based on the new positions; set t = t + 1. After the iterations conclude, output the global extreme point and the corresponding optimal solution.
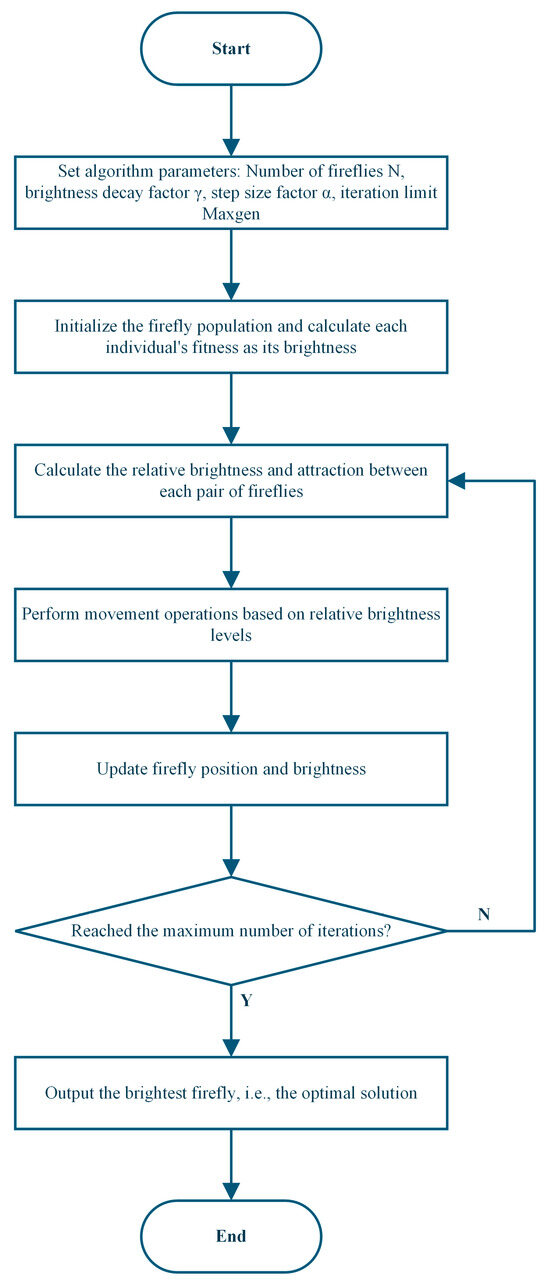
Figure 1.
Flowchart of the Firefly Algorithm.
3. Results and Discussion
3.1. Single-Factor Analysis of Film Properties
3.1.1. Effect of Starch Concentration on Physical Properties
The concentration of starch is a critical determinant of the quality and functional characteristics of the composite film. Within the film matrix, starch molecules can sufficiently entangle to form a uniform gel phase, which imparts adequate viscoelasticity to the wet film to withstand drying stresses, resulting in a film with both structural integrity and moderate barrier properties [23,38].
As shown in Figure 2A, the WVP of the 0.5% and 1% starch films were 5.05 × 10⁻⁶ g·cm−1·s−1·Pa−1 and 5.82 × 10⁻⁶ g·cm−1·s−1·Pa−1, respectively, which were significantly higher than those of samples with higher starch content. This is attributed to the looser film structure formed at lower starch concentrations, where starch molecules fail to create a dense three-dimensional network. This results in lower hydrogen bond density and weaker intermolecular forces, thereby providing more pathways for water vapor diffusion. When the starch content was increased to 2%, the WVP decreased to 1.13 × 10⁻⁶ g·cm−1·s−1·Pa−1, an approximate four-fold improvement in water barrier performance. This indicates that a higher starch concentration promotes the formation of a more continuous and dense matrix structure, effectively restricting the permeation paths of water molecules.
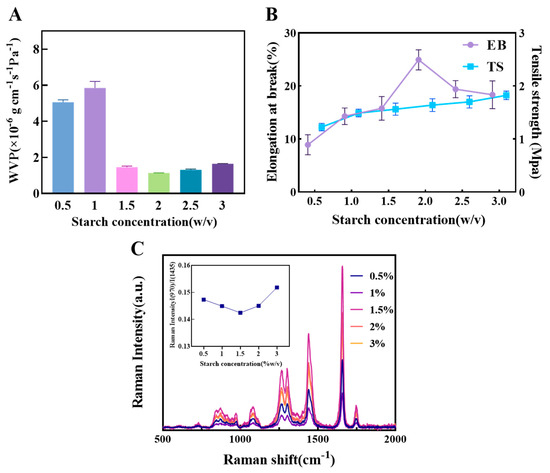
Figure 2.
The influence of different concentrations of starch on the physical properties of composite films. (A) The effect of starch concentration on composite film WVP. (B) The effect of starch concentration on composite film EB and TS. (C) Raman spectra of oil samples covered with composite films of different starch concentrations and the corresponding ratio of I(970)/I(1438).
Regarding mechanical properties (Figure 2B), the TS showed a linear upward trend with increasing starch concentration [39]. This is primarily due to the increased number of hydrogen bonds and higher entanglement density among starch molecular chains, which enhances the film’s tensile resistance. EB reached its maximum value at a starch content of 2%, suggesting that at this concentration, the film achieves a balance of strength and flexibility. As the starch content further increased, the EB decreased, likely because excessive starch content enhanced the film’s rigidity and reduced the mobility of chain segments, leading to increased microscopic brittleness and making the material more prone to fracture under tension.
Figure 2C displays the Raman spectra of oil samples covered by different composite films. The Raman peaks of oil mainly reflect the vibrational information of hydrocarbon chains and can be used to analyze the structure of molecular groups, including: 970 cm−1 (trans C-H bending), 1080 cm−1 ((CH2) stretching), 1264 cm−1 (cis C-H bending), 1300 cm−1 (CH2 in-phase bending), 1438 cm−1 (CH2 scissoring), 1656 cm−1 (cis C=C stretching), and 1746 cm−1 (C=O stretching) [40]. The results showed that the oil sample covered by the 1.5% starch film had the highest peak intensity at 1656 cm−1, indicating the lowest degree of soybean oil oxidation. Furthermore, the I₍960₎/I₍1438₎ ratio, often used as an indicator of the degree of unsaturation in oils [41], was lowest for the 1.5% starch film. This further confirms that the 1.5% film provides the optimal oxygen barrier, effectively retarding the oil oxidation process.
Based on these results, the film properties were found to be optimal within a starch concentration range of 1–3%. Therefore, this range was selected for the subsequent response surface experiments to systematically optimize and determine the best film-forming concentration.
3.1.2. Effect of CNF Concentration on Physical Properties
Uniformly dispersed CNF forms a continuous three-dimensional nano-reinforcement network through high-density hydrogen bond cross-linking and entanglement with polymer chains. This simultaneously enhances the film’s TS and EB and significantly reduces WVP due to the densified structure [13,14].
As shown in Figure 3A, the WVP reached its minimum value at a CNF content of 1%. This indicates that at this concentration, CNF can disperse uniformly in the matrix and form a continuous, dense nanofiber network, effectively extending the diffusion path of water molecules and improving barrier performance. When the content was increased to 1.5%, the WVP unexpectedly increased. This may be due to localized agglomeration of CNF beyond a critical concentration, creating interfacial defects and micro-channels that provide additional pathways for water vapor permeation. At 2% content, the WVP slightly decreased, suggesting a structural rearrangement where some areas reformed an effective barrier. However, as the content further increased to 2.5%, the WVP rose again, indicating that at high concentrations, CNF is difficult to disperse uniformly. The increased number of agglomerates leads to structural heterogeneity and reduced interfacial compatibility, thereby weakening its water barrier capacity.
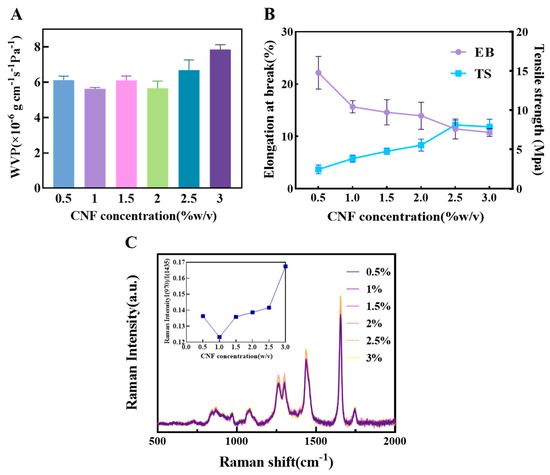
Figure 3.
The influence of different concentrations of CNF on the physical properties of composite films (A) The effect of CNF concentration on composite film WVP; (B) The effect of starch concentration on composite film EB and TS; (C) Raman spectra of oil samples covered with composite films of different CNF concentrations and the corresponding ratio of I(970)/I(1438).
In terms of mechanical properties (Figure 3B), the TS continuously increased with the addition of CNF. This is mainly attributed to the high specific strength and modulus of CNF itself, as well as the strong interfacial hydrogen bonding with the matrix, which allows for effective load transfer from the continuous phase to the reinforcing fibers, achieving uniform stress distribution. Conversely, the EB gradually decreased as the CNF content increased. This reflects that the addition of rigid fibers, while strengthening the material, also restricts the mobility of polymer chain segments. This reduces the material’s deformation capacity under stress, increases brittleness, and consequently lowers flexibility.
Analysis of the oxidation state of the encapsulated oil via Raman spectroscopy (Figure 3C) revealed that at a CNF content of 1%, the I₍960₎/I₍1438₎ ratio was the lowest. This indicates the best preservation of unsaturation, reflecting the film’s optimal overall oxygen barrier performance at this concentration, mainly due to the effective inhibition of oxygen permeation by the dense nanofiber network. Although at 2.5% CNF content, the C=C stretching vibration peak intensity at 1656 cm−1 was the highest, suggesting a low degree of oxidation, its increased WVP suggests that the antioxidant mechanism may not primarily rely on physical barrier properties. It is more likely attributable to the adsorption or scavenging of free radicals by CNF itself. In summary, the film performance was relatively optimal in the CNF concentration range of 0.5–1.5%, which was therefore selected for subsequent response surface experiments.
3.1.3. Effect of SiO2-NPs Concentration on Physical Properties
The silanol groups on the surface of SiO2-NPs form hydrogen bond cross-links with the polymer matrix. This interaction effectively fills the voids between molecular chains, increasing the film’s density [42,43].
As shown in Figure 4A, the WVP reached its minimum value at a SiO2-NPs content of 0.3%. This indicates that at this concentration, the nanoparticles can disperse uniformly within the matrix, creating an effective tortuous path that significantly hinders the diffusion of water molecules. When the content was increased to 0.4%, the WVP increased, likely due to nanoparticle agglomeration beyond a critical concentration. This creates interfacial voids and defects, forming rapid channels for water vapor migration. Although the WVP decreased thereafter, the change was not significant, suggesting that the structure of the agglomerates stabilized but could not restore the highly effective barrier network formed at initial uniform dispersion.
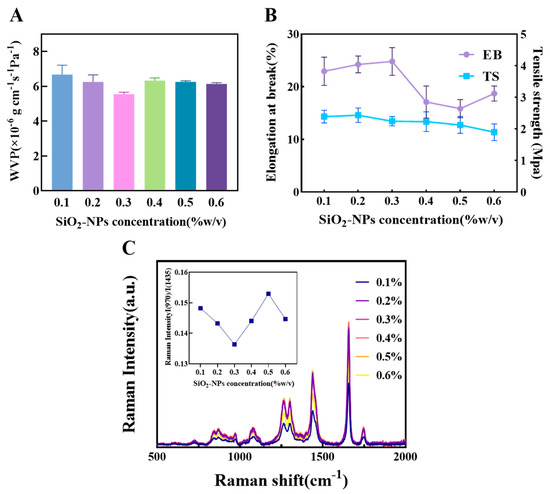
Figure 4.
The influence of different concentrations of SiO2 on the physical properties of composite films (A) The effect of SiO2 concentration on composite film WVP. (B) The effect of starch concentration on composite film EB and TS. (C) Raman spectra of oil samples covered with composite films of different SiO2 concentrations and the corresponding ratio of I(970)/I(1438).
Regarding mechanical properties (Figure 4B), the TS showed a slight downward trend with increasing SiO2-NPs content, which is distinctly different from the reinforcing effect of CNF. The main reason is the modulus mismatch between the rigid SiO2-NPs and the polymer matrix, as well as potentially weak interfacial bonding. Under stress, these particles can become stress concentration points, leading to premature interfacial debonding or micro-cracking, and thus a reduction in macroscopic strength. The EB peaked at 0.3% content, suggesting that an appropriate number of nanoparticles may enhance the material’s toughness by dissipating energy through plastic deformation mechanisms. Beyond this concentration, the EB decreased due to increased particle agglomeration, restricting the mobility of polymer chain segments. The slight recovery in EB at 0.6% might be related to the formation of agglomerate structures with some energy dissipation capacity, but its value remained lower than the initial level at 0.1%, indicating that the material’s initial flexibility was compromised by the introduction of rigid particles.
Raman spectroscopy analysis of the encapsulated oil (Figure 4C) showed that at 0.3% SiO2 content, the I(960)/I(1438) ratio was the lowest, indicating the best preservation of unsaturation and the most ideal oxygen barrier effect. This corroborates its optimal physical barrier performance as indicated by the lowest WVP. Although at 0.4% content the C=C characteristic peak intensity at 1656 cm−1 was the highest, showing excellent antioxidant properties, the WVP had already significantly increased by this point. Based on this comprehensive analysis, the film exhibited a better balance of properties in the SiO2-NPs range of 0.1% to 0.5%, particularly around 0.3%. Therefore, the range of 0.1–0.5% was selected for subsequent response surface experiments to study its synergistic effects.
3.2. Response Surface Analysis
3.2.1. Analysis of Response Surface Results
A Box–Behnken design was used for the experiment, with 17 runs for each film type, and each run repeated three times. The ranges for the factors starch, CNF, and SiO2-NPs were [1, 3], [0.5, 1.5], and [0.1, 0.5], respectively. The experimental design and results are shown in Table 1.

Table 1.
Response surface test design and results.
Within the selected parameter ranges, the TS of the films varied from 1.445 MPa to 7.127 MPa, EB from 6.7% to 38.7%, and WVP from 5.09 × 10⁻⁶ g·cm−1·s−1·Pa−1~7.39 × 10⁻⁶ g·cm−1·s−1·Pa−1.
Comparing runs 3 and 6 in Table 1, when the starch concentration increased from 1% to 3%, the film’s EB showed a remarkable increase of 172%, from 14.22% to 38.70%. In stark contrast, its TS significantly decreased by 59%, from 3.50 MPa to 1.45 MPa. This indicates that while the plasticizing effect of starch molecular chains effectively enhances the material’s ductility and flexibility, it inevitably weakens its original rigid structure.
Further comparing runs 3 and 8, when the CNF concentration was increased to 1.5%, the material’s TS was significantly enhanced by 104%, reaching 7.14 MPa. However, this enhancement came at the cost of ductility, as the EB decreased by 42%, from 14.22% to 8.21%. This phenomenon can be attributed to the dense three-dimensional nanonetwork formed by CNF, which, while effectively strengthening the composite, imposes significant steric hindrance on the movement of polymer chain segments.
The addition of SiO2-NPs exhibited a distinct threshold effect: at a concentration of 0.3% (as in run 10), it significantly improved the material’s WVP to 5.1 × 10⁻⁶ g·cm−1·s−1·Pa−1. However, once this critical concentration was exceeded (as in run 12), significant nanoparticle agglomeration occurred, leading to a notable decrease in the composite’s mechanical properties, particularly TS, which dropped from 4.80 MPa in run 10 to 3.50 MPa in run 12.
To verify the stability and reproducibility of the experimental system, five independent replicate experiments were conducted at a starch concentration of 2%, CNF concentration of 1%, and SiO2-NPs concentration of 0.3%. The results showed: an average TS of 5.10 MPa with a standard deviation of 0.22 MPa (RSD = 4.3%); an average EB of 16.84% with a standard deviation of 1.50% (RSD = 8.9%), which showed slightly larger fluctuations but was still acceptable; and an average WVP of 5.1 × 10⁻⁶ g·cm−1·s−1·Pa−1, with a standard deviation of 0.11 (RSD = 2.1%), demonstrating high precision.
Further analysis of the experimental data indicated that the system could achieve a maximum TS of 7.13 MPa when the starch concentration was adjusted to 1%, CNF to 1.5%, and SiO2-NPs were maintained at 0.3%, reflecting the enhancement of mechanical properties through component optimization. The optimal EB of 38.70% was obtained when the starch concentration was increased to 3%, CNF decreased to 0.5%, and SiO2-NPs remained at 0.3%, highlighting the critical role of component ratios in ductility. However, when a combination of high CNF and high SiO2-NPs concentrations was used, the EB significantly decreased to 6.7% due to increased material brittleness from rigidity overload. This phenomenon underscores the importance of component synergy and its potential negative effects on material toughness.
3.2.2. Regression Model and Analysis of Variance (ANOVA)
The experimental data in Table 1 were analyzed using D-E. A second-order polynomial model was fitted for the three key factors: starch (A), CNF (B), and SiO2-NPs (C). The final regression equations are shown in Equations (9)–(11). For the three response variables (TS, EB, and WVP), the “Adequate Precision” values were 29.51, 31.23, and 18.72, respectively. All are significantly greater than 4, indicating that the models have excellent predictive capability and signal-to-noise ratio. The coefficients of determination (R2) were 0.9882, 0.9883, and 0.9824; the adjusted R2 (Adj-R2) were 0.9731, 0.9733, and 0.9597; and the predicted R2 (Pred-R2) were 0.8775, 0.9487, and 0.7932. All statistical indicators are close to 1, demonstrating that the regression models are highly reliable and robust, and can effectively reflect the complex relationships between the factors and responses.
In Equations (9)–(11): A, B, and C are the coded values for starch, CNF, and SiO2-NPs concentrations; Y1, Y2, and Y3 are the responses for TS, EB, and WVP, respectively.
The ANOVA results (Table 2) for the film properties show that for TS, the p-values for starch (A) and CNF (B) were both <0.0001, indicating that these two factors had a highly significant effect. The p-value for SiO2-NPs (C) was 0.0015 (<0.05), indicating a significant effect. For EB, the p-values for starch (A) and CNF (B) were both <0.0001, showing a highly significant effect, while SiO2-NPs (C) and the interaction term AB had p-values <0.05, indicating significant effects. For WVP, the p-values for starch (A), CNF (B), and the interaction terms AB and BC were all <0.05, indicating these terms had significant effects.
Table 2.
Analysis of variance of response surface test results for composite film preparation.
3.2.3. Analysis of Response Surface Interactions
The interaction effects of different concentrations of starch, CNF, and SiO2-NPs on the physical properties (TS, EB, WVP) of the film are shown in the contour plots (Figure 5). According to the data in Table 1, the interaction AB had a significant effect on EB, while interactions AB and BC had significant effects on WVP. These interactions are discussed below.
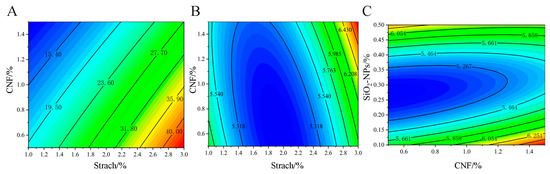
Figure 5.
Response surface interaction analysis of (A) starch and CNF concentration on EB; (B) the interactive impact of starch and CNF on WVP; and (C) the interactive impact of CNF and SiO2-NPs on WVP.
For EB, only the interaction between starch and CNF (AB) was significant. As shown in Figure 5A, at a fixed CNF concentration, EB increased with increasing starch concentration. However, at a fixed starch concentration, EB decreased as CNF concentration increased. The maximum EB of 40% was achieved when the CNF concentration was between 0.5 and 0.7% and the starch concentration was between 2.7 and 3.0%. This may be due to the enhanced hydrogen bonding between CNF and starch molecules, forming a more stable network structure. However, excessively high CNF concentration might reduce the intermolecular spacing, restricting the movement of starch molecules and thus decreasing EB.
The interaction effects on WVP are shown in Figure 5. From Figure 5B, at a fixed CNF concentration, WVP first decreased and then increased with increasing starch concentration. The minimum WVP of 5.318 × 10⁻⁶ g·cm−1·s−1·Pa−1 was achieved when the starch concentration was between 1.5 and 2.5%. This suggests that an appropriate amount of starch can effectively fill the voids between CNF fibers, reducing WVP, but excess starch may lead to a looser structure, thereby increasing permeability. The interaction between CNF and SiO2-NPs was also significant (Figure 5C). As the SiO2-NPs concentration increased, WVP showed a trend of first decreasing and then increasing, with the best effect observed when the SiO2-NPs concentration was between 0.2 and 0.35%. This is likely due to the particle-filling effect and surface adsorption of SiO2-NPs, which enhances the material’s barrier properties.
3.3. Optimization of Formulation Parameters
3.3.1. Objective Function
For the preservative film, a lower WVP indicates better quality (“the-smaller-the-better”), while higher TS and EB indicate better quality (“the-larger-the-better”). Therefore, a desirability function model was established for the film and used as the objective function for optimization with the Firefly Algorithm. Equations (12)–(14) represent the individual desirability functions.
The individual desirability Functions (12)–(14) were substituted into the overall desirability Formula (8) to calculate the composite desirability value, as shown in Equation (15), with the corresponding constraints given in Equation (16). A composite desirability value closer to 1 indicates higher satisfaction, reflecting superior physical properties of the composite film.
Constraints:
3.3.2. Optimization Results and Validation
The FA was used to optimize the objective function. The FA program was implemented in MATLAB (Version R2024a, The MathWorks, Inc., Natick, MA, USA) using the Sheffield Genetic Algorithm Toolbox [44]. The algorithm parameters were set as follows: light absorption coefficient = 1.0, initial attractiveness = 1.0, step factor = 0.25, number of fireflies = 100, and maximum iterations = 200.
The optimal concentrations for starch, CNF, and SiO2-NPs that maximized the overall desirability function were found to be 1.99%, 1.38%, and 0.30%, respectively. Under these parameters, the predicted values for TS, EB, and WVP were 6.164 MPa, 12.3203%, and 5.3287 × 10⁻⁶ g·cm−1·s−1·Pa−1. To validate the reliability of the optimization results, five replicate experiments were conducted under optimal conditions, and the average results are shown in Table 3. The experimental values for TS, EB, and WVP were 5.813 MPa, 12.3654%, and 5.3954 × 10⁻⁶ g·cm−1·s−1·Pa−1, respectively. The relative errors between the experimental and predicted values were 5.69%, −0.37%, and −1.25%, indicating good consistency between the predictive model and the experimental data.
Table 3.
Comparison between predicted value and validation test data under optimal process parameters.
The problem was also optimized using the numerical optimization module in D-E software. The constraints for starch, CNF, and SiO2-NPs were set to [1, 3], [0.5, 1.5], and [0.1, 0.5], respectively. The goals for TS and EB were set to “maximize,” and for WVP to “minimize.” The target ranges for Y1(TS), Y2(EB), and Y3(WVP) were set to [1.5, 7.5], [7, 39], and [5, 7.5], with weights of 2.5, 2.5, and 5, respectively. The resulting optimal parameter combination yielded predicted values of 4.4046 MPa, 20.6075%, and 5.1588 × 10⁻⁶ g·cm−1·s−1·Pa−1 for TS, EB, and WVP, respectively.
Range analysis was used to compare the robustness of the results from the FA-desirability function method and the D-E numerical optimization. The range R (fluctuation magnitude) for each response was calculated within an optimal region defined by a radius of σ = 0.1 around the optimal point. Using MATLAB software, calculate the range of each response within the optimal domain according to Equation (17) below.
In the equation, R is the fluctuation range; is the maximum value of the i-th response within the optimal domain; is the minimum value of the i-th response within the optimal domain.
As shown in Table 4, in the optimal region, the fluctuation ranges for the three responses at the FA optimal point were (0.2361, 3.0948, 0.3194), while for the D-E optimal point, they were (0.3476, 3.6924, 0.2378). For TS and EB, the fluctuation ranges for the FA method were smaller than those for D-E, indicating that the FA optimal point is more robust for these two responses. For WVP, the D-E method was more robust. Overall, the three responses obtained from the FA optimization method were more robust and reliable compared to the D-E optimization method.
Table 4.
Comparison of range analysis between the Firefly Algorithm (FA) and the Design-Expert numerical optimization method for the results.
Therefore, the optimal formulation for the composite film is starch concentration 1.99%, CNF concentration 1.38%, and SiO2-NPs concentration 0.30%. Under these conditions, the film’s TS is 5.813 MPa, EB is 12.3654%, and WVP is 5.3954 × 10⁻⁶ g·cm−1·s−1·Pa−1.
3.4. Surface Morphology of Films
The average thickness of the films was 0.087 ± 0.014 mm. The film surfaces were continuous, dense, and free of visible defects (Figure 6A,C), indicating good compatibility among starch, CNF, and SiO2-NPs and the absence of phase separation. EDX mapping (Figure 6A) showed a homogeneous distribution of C, corresponding to the continuous organic network formed by starch and CNF. Na was uniformly distributed, confirming that TEMPO-CNF was evenly dispersed within the film. Si was also uniformly distributed, suggesting that SiO2-NPs were well dispersed without noticeable aggregation, which is beneficial for enhancing the mechanical and barrier properties of the films. Cross-sectional SEM images (Figure 6B) revealed a uniform, dense, layered structure without pores, cracks, or delamination, demonstrating the formation of an integral three-dimensional network. Cross-sectional EDX mapping showed that C, O, Na, and Si were evenly distributed throughout the thickness of the films, further confirming the homogeneous dispersion of all components and the structural uniformity of the composite films.
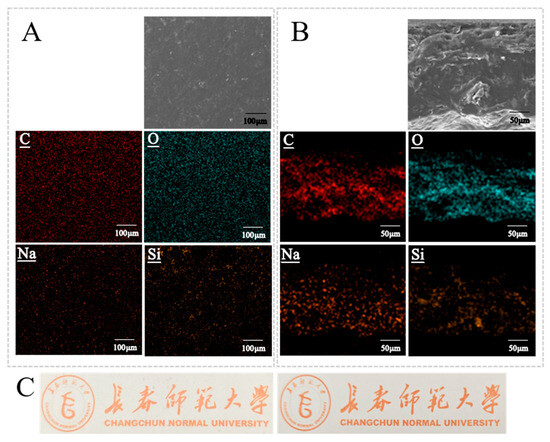
Figure 6.
Surface and cross-sectional morphology and elemental distribution of the films. (A) SEM image of the film surface and the corresponding EDX elemental mapping. (B) SEM image of the film cross-section and the corresponding EDX elemental mapping, illustrating the distribution of the various components along the film thickness. (C) Left: photograph of the starch/CNF/SiO2 composite preservative film; right: background without film, used as a reference to compare the appearance and transparency of the film.
3.5. DSC
As shown in Figure 7A, the three films exhibit only a gradual baseline shift in the range of 40–150 °C, and no obvious melting peak is observed, indicating that the systems possess good thermal stability within the practical application temperature range. When the temperature exceeds 200 °C, pronounced endothermic troughs appear for the S, SC, and SCS films, with minimum temperatures of approximately 226 °C, 222 °C, and 236 °C, respectively, corresponding to the main thermal degradation of starch and cellulose chains. Compared with the pure starch film, the main degradation peak of the SC film shifts slightly toward lower temperatures, suggesting that the incorporation of CNF makes the system more susceptible to thermal degradation. On this basis, further addition of SiO2-NPs causes the main degradation peak of the SCS film to shift markedly to higher temperatures (by about 14 °C), indicating that SiO2-NPs effectively improve the thermal stability of the composite films through hydrogen bonding and physical filling within the polysaccharide network.
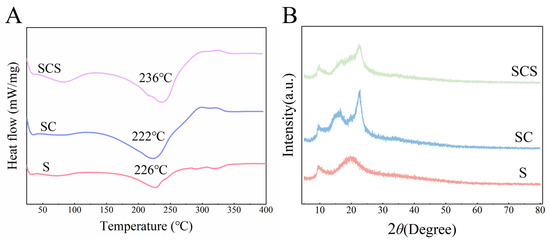
Figure 7.
Thermal properties and crystalline structure characterization of the films. (A) DSC curves of the starch film (S), starch/CNF film (SC), and starch/CNF/SiO2 composite film (SCS). (B) XRD patterns of S, SC, and SCS films were used to analyze the influence of different functional components on the crystalline structure of the films.
3.6. XRD
Analysis of the XRD patterns (Figure 7B) clearly reveals the pronounced influence of the functional components on the crystalline structure of the starch-based composite films. All samples exhibit characteristic diffraction peaks of starch at 2θ ≈ 17° and 23°, corresponding to their amorphous and semicrystalline features. Compared with the S film, the introduction of CNF in the SC film markedly increases the diffraction peak intensity, indicating that the highly crystalline CNF acts as a heterogeneous nucleating agent and effectively enhances the overall crystallinity of the composite film, which is consistent with the improvement in its mechanical properties. In the SCS film, the incorporation of amorphous SiO2-NPs leads to a slight dilution of crystallinity. This provides strong evidence that SiO2-NPs interact with the starch/CNF matrix through extensive hydrogen bonding, disturb the original crystalline order, and promote the formation of a compact amorphous network.
3.7. Optical Properties of the Composite Film
Effective UV shielding by the film can inhibit photo-oxidative reactions induced by UV radiation, thereby delaying the quality deterioration of fruits [45,46]. As shown in Figure 8A, the pure starch film (S film) exhibited the highest transmittance in the visible light region (300–800 nm). This is mainly due to its uniform and dense microstructure, with starch molecular chain dimensions much smaller than the wavelength of visible light, leading to limited Rayleigh scattering and thus excellent light transmission.
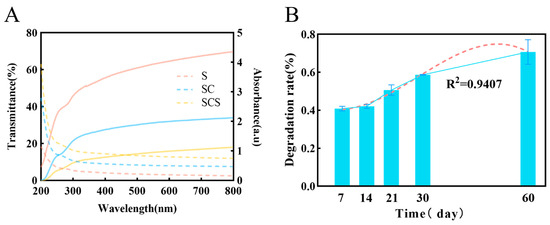
Figure 8.
(A) Optical properties of composite films. The solid line represents the transmittance (left Y-axis). The dashed line represents absorbance (right Y-axis). (B) Biodegradation kinetics of the composite film in soil, with the red dashed line showing the curve fitted to the 60-day data to project the long-term degradation trend.
However, with the incorporation of CNF and SiO2-NPs, the visible light transmittance of the ternary composite film (SCS film) significantly decreased. This phenomenon is attributed to the strong light scattering effect induced by the complex multiphase structure formed within the film. Specifically, first, there are significant differences in the refractive indices among starch (≈1.53), CNF (≈1.55), and SiO2-NPs (≈1.46), creating numerous phase interfaces in the composite system. Second, the one-dimensional CNF and zero-dimensional SiO2-NPs form a multi-scale scattering network in three-dimensional space. As light passes through this network, it undergoes repeated refraction, reflection, and scattering at countless fiber–matrix, particle–matrix, and fiber–particle interfaces, causing the light path to deviate severely from its original direction. Additionally, potential agglomeration of nanofillers can form larger scattering centers, further intensifying light scattering, which macroscopically manifests as a sharp drop in transmittance and an increase in haze.
Furthermore, the incorporation of SiO2-NPs endows the composite film with excellent UV-shielding functionality [18]. The composite film has extremely low transmittance in the UV region. Its shielding mechanism is a synergistic effect of physical scattering and intrinsic absorption. On one hand, the particle size of SiO2-NPs is close to the wavelength of UV light, producing strong Rayleigh scattering. On the other hand, as a wide-bandgap semiconductor material, it can effectively absorb UV photons and dissipate their energy through mechanisms like phonon excitation [47,48,49].
3.8. Biodegradability
The biodegradability of the composite film is a key indicator of its environmental friendliness [50,51,52]. Quantitative analysis under simulated natural degradation conditions showed that the composite film possesses good biodegradability (Figure 8B). The degradation kinetics data revealed that the degradation process in an activated sludge environment fits a first-order reaction kinetic model, with a coefficient of determination (R2) of 0.94, indicating that the model well describes its degradation behavior. This excellent fit suggests that the film’s degradation process is regular and predictable. Over the 60-day degradation period, the film exhibited a rapid hydrolysis phase followed by a relatively stable later stage, a characteristic consistent with the degradation of natural polysaccharide components like starch.
The excellent biodegradability of the composite film is mainly attributed to the following mechanisms: First, as the matrix material, the glycosidic bonds in the starch molecular chains are easily cleaved by hydrolytic enzymes secreted by microorganisms, forming small-molecule sugars that can be further utilized. Second, although CNF degrades relatively slowly, its porous structure formed with starch facilitates the penetration of water and microorganisms, promoting the overall degradation process. Additionally, the incorporation of nano-silica, while improving material properties, did not show any significant inhibitory effect on the biodegradation process. Notably, a good balance was achieved between the film’s biodegradability and its application performance. The material maintains sufficient stability during its service life and degrades rapidly after disposal, highlighting its potential in the field of sustainable packaging materials.
4. Conclusions
This study successfully developed and optimized a fully bio-based ternary composite film composed of cassava starch, CNF, and SiO2-NPs. Through synergistic optimization using Response Surface Methodology and the Firefly Algorithm, the optimal preparation process was determined to be a starch concentration of 1.99%, CNF concentration of 1.38%, and SiO2-NPs concentration of 0.30%. Under these conditions, the composite film achieved optimal comprehensive performance, with a TS of 5.813 MPa, an EB of 12.3654%, and a WVP of 5.3954 × 10⁻⁶ g·cm−1·s−1·Pa−1. This effectively overcame the core deficiencies of pure starch films regarding poor mechanical and barrier properties.
This study reveals that the significant performance enhancement of the composite film originates from the strong synergistic effects among its components. CNF, acting as a reinforcing skeleton, significantly improves the material’s mechanical strength by forming a dense hydrogen bond network with the starch matrix. Meanwhile, SiO2-NPs, as efficient functional fillers, synergize with the CNF network to substantially enhance the barrier capacity against water vapor and oxygen by filling the free volume between polymer chains and creating a tortuous diffusion path. This synergistic mechanism of “skeletal reinforcement” and “filler barrier” is key to achieving the high performance of the composite film.
More importantly, conventional PE- or PVC-based plastic cling films exhibit high transparency in the visible light region and provide only limited attenuation of short-wavelength ultraviolet radiation, resulting in poor protection against photo-induced oxidation. In contrast, the composite film developed in this study effectively enhances its shielding performance against both ultraviolet and visible light, benefiting from the UV-blocking properties of CNF and nano-silica. Moreover, the composite film not only demonstrates excellent UV-shielding capability and favorable biodegradability (with a degradation rate exceeding 80% within 60 days) but also shows potential in delaying lipid oxidation. It successfully achieves a balance between functional stability during use and environmental friendliness after disposal.
In summary, this work provides an effective technical pathway for developing high-performance, low-cost, and sustainable new food packaging materials, holding significant theoretical and practical value for promoting the high-value utilization of agricultural by-products and reducing “white pollution.”
Future research could focus on two directions: first, incorporating natural active substances to impart active preservation functions like antimicrobial and antioxidant properties to the composite film; second, systematically evaluating the practical effectiveness of the composite film in preserving specific foods and exploring the feasibility of its large-scale production to accelerate its commercialization process.
Author Contributions
Conceptualization, K.S. and M.B.; writing—original draft preparation, W.Z. and T.W.; writing—review and editing, S.Y., Z.Y. and Y.G. funding acquisition, C.L. All authors have read and agreed to the published version of the manuscript.
Funding
This project was financially supported by the Science and Technology Development Plan Project of Jilin Province (20220204015YY) and the Doctoral Research Start-up Fund of Changchun Normal University.
Institutional Review Board Statement
Not applicable.
Informed Consent Statement
Not applicable.
Data Availability Statement
The data that support the findings of this study are available from the corresponding author upon reasonable request.
Conflicts of Interest
The authors declare no conflicts of interest.
References
- Zhao, W.; Wang, T.; Dong, H.; Zhao, W.R.; Song, K.; Zhu, N.A. Multifunctional Roles and Ecological Implications of Nano-Enabled Technologies in Oryza sativa Production Systems: A Comprehensive Review. Plants 2025, 14, 528. [Google Scholar] [CrossRef] [PubMed]
- Youssef, A.M.; El-Sayed, S.M. Bionanocomposites materials for food packaging applications: Concepts and future outlook. Carbohydr. Polym. 2018, 193, 19–27. [Google Scholar] [CrossRef]
- Mali, S.; Grossmann, M.V.E.; García, M.A.; Martino, M.N.; Zaritzky, N.E. Effects of controlled storage on thermal, mechanical and barrier properties of plasticized films from different starch sources. J. Food Eng. 2006, 75, 453–460. [Google Scholar] [CrossRef]
- Ma, L.; Ma, J.; Teng, M.; Li, Y. Visual Analysis of Colorectal Cancer Immunotherapy: A Bibliometric Analysis From 2012 to 2021. Front. Immunol. 2022, 13, 843106. [Google Scholar] [CrossRef]
- Yeung, A.W.K. Comparison between Scopus, Web of Science, PubMed and publishers for mislabelled review papers. Curr. Sci. 2019, 116, 1909. [Google Scholar] [CrossRef]
- Yeung, A.W.K.; Heinrich, M.; Kijjoa, A.; Tzvetkov, N.T.; Atanasov, A.G. The ethnopharmacological literature: An analysis of the scientific landscape. J. Ethnopharmacol. 2020, 250, 112414. [Google Scholar] [CrossRef]
- Shen, Z.; Wu, H.; Chen, Z.; Hu, J.; Pan, J.; Kong, J.; Lin, T. The Global Research of Artificial Intelligence on Prostate Cancer: A 22-Year Bibliometric Analysis. Front. Oncol. 2022, 12, 843735. [Google Scholar] [CrossRef]
- Zhu, X.; Hu, J.; Deng, S.; Tan, Y.; Qiu, C.; Zhang, M.; Ni, X.; Lu, H.; Wang, Z.; Li, L.; et al. Comprehensive Bibliometric Analysis of the Kynurenine Pathway in Mood Disorders: Focus on Gut Microbiota Research. Front. Pharmacol. 2021, 12, 687757. [Google Scholar] [CrossRef]
- Fu, J.; Zhou, Y.L.; Xie, H.F.; Duan, Q.F.; Yang, Y.W.; Liu, H.S.; Yu, L. From macro- to nano- scales: Effect of fibrillary celluloses from okara on performance of edible starch film. Int. J. Biol. Macromol. 2024, 262, 129837. [Google Scholar] [CrossRef] [PubMed]
- Shen, Y.P.; Zhou, J.W.; Yang, C.Y.; Chen, Y.F.; Yang, Y.Y.; Zhou, C.S.; Wang, L.W.; Xia, G.H.; Yu, X.J.; Yang, H. Preparation and characterization of oregano essential oil-loaded Dioscorea zingiberensis starch film with antioxidant and antibacterial activity and its application in chicken preservation. Int. J. Biol. Macromol. 2022, 212, 20–30. [Google Scholar] [CrossRef] [PubMed]
- Teixeira, B.S.; del Mastro, N.L. Effects of electron beam irradiation on ozone-modified potato starch film. Radiat. Phys. Chem. 2023, 213, 111234. [Google Scholar] [CrossRef]
- Barik, M.; Bhagyaraj, G.V.S.; Dash, K.K.; Shams, R. A thorough evaluation of chitosan-based packaging film and coating for food product shelf-life extension. J. Agric. Food Res. 2024, 16, 101164. [Google Scholar] [CrossRef]
- Shi, B.Y.; Hao, Z.H.; Du, Y.Z.; Jia, M.K.; Xie, S.Q. Mechanical and Barrier Properties of Chitosan-based Composite Film as Food Packaging: A Review. Bioresources 2024, 19, 4001–4014. [Google Scholar] [CrossRef]
- Tagliaro, I.; Musile, G.; Caricato, P.; Dorizzi, R.M.; Tagliaro, F.; Antonini, C. Chitosan Film Sensor for Ammonia Detection in Microdiffusion Analytical Devices. Polymers 2023, 15, 4238. [Google Scholar] [CrossRef] [PubMed]
- Vasiljevic, Z.Z.; Vunduk, J.; Dojcinovic, M.P.; Miskovic, G.; Tadic, N.B.; Vidic, J.; Nikolic, M.V. ZnO and Fe2TiO5 nanoparticles obtained by green synthesis as active components of alginate food packaging films. Food Packag. Shelf Life 2024, 43, 101280. [Google Scholar] [CrossRef]
- Bangyekan, C.; Aht-Ong, D.; Srikulkit, K. Preparation and properties evaluation of chitosan-coated cassava starch films. Carbohydr. Polym. 2006, 63, 61–71. [Google Scholar] [CrossRef]
- Rompothi, O.; Pradipasena, P.; Tananuwong, K.; Somwangthanaroj, A.; Janjarasskul, T. Development of non-water soluble, ductile mung bean starch based edible film with oxygen barrier and heat sealability. Carbohydr. Polym. 2017, 157, 748–756. [Google Scholar] [CrossRef]
- Kim, S.R.B.; Choi, Y.-G.; Kim, J.-Y.; Lim, S.-T. Improvement of water solubility and humidity stability of tapioca starch film by incorporating various gums. Lwt-Food Sci. Technol. 2015, 64, 475–482. [Google Scholar] [CrossRef]
- Cheng, K.; Guo, Q.; Yang, W.; Wang, Y.; Sun, Z.; Wu, H. Mapping Knowledge Landscapes and Emerging Trends of the Links Between Bone Metabolism and Diabetes Mellitus: A Bibliometric Analysis From 2000 to 2021. Front. Public Health 2022, 10, 918483. [Google Scholar] [CrossRef]
- Sabe, M.; Pillinger, T.; Kaiser, S.; Chen, C.; Taipale, H.; Tanskanen, A.; Tiihonen, J.; Leucht, S.; Correll, C.U.; Solmi, M. Half a century of research on antipsychotics and schizophrenia: A scientometric study of hotspots, nodes, bursts, and trends. Neurosci. Biobehav. Rev. 2022, 136, 104608. [Google Scholar] [CrossRef]
- Shen, J.; Shen, H.; Ke, L.; Chen, J.; Dang, X.; Liu, B.; Hua, Y. Knowledge Mapping of Immunotherapy for Hepatocellular Carcinoma: A Bibliometric Study. Front. Immunol. 2022, 13, 815575. [Google Scholar] [CrossRef] [PubMed]
- Lim, W.S.; Ock, S.Y.; Park, G.D.; Lee, I.W.; Lee, M.H.; Park, H.J. Heat-sealing property of cassava starch film plasticized with glycerol and sorbitol. Food Packag. Shelf Life 2020, 26, 100556. [Google Scholar] [CrossRef]
- Pérez-Vergara, L.D.; Cifuentes, M.T.; Franco, A.P.; Pérez-Cervera, C.E.; Andrade-Pizarro, R.D. Development and characterization of edible films based on native cassava starch, beeswax, and propolis. NFS J. 2020, 21, 39–49. [Google Scholar] [CrossRef]
- Si, C.L.; Xu, J.Y. Recent Advances in Bio-medicinal and Pharmaceutical Applications of Bio-based Materials. Curr. Med. Chem. 2020, 27, 4581–4583. [Google Scholar] [CrossRef]
- Dogan, N.; McHugh, T.H. Effects of microcrystalline cellulose on functional properties of hydroxy propyl methyl cellulose microcomposite films. J. Food Sci. 2007, 72, E16–E22. [Google Scholar] [CrossRef]
- Ma, W.; Lu, Y.; Liu, Y.; Li, D.; Li, L.J.F.P.; Life, S. Enhanced permeability of ZnO/PE films by stretching and its application in Pakchoi preservation. Food Packag. Shelf Life 2024, 43, 101296. [Google Scholar] [CrossRef]
- Zou, J.; Zhong, H.; Jiang, C.; Zhu, G.; Lin, X.; Huang, Y.J.F.C. Ginkgo biloba leaf polysaccharide-stabled selenium nanozyme as an efficient glutathione peroxidase mimic for the preservation of bananas and cherry tomatoes. Food Chem. 2024, 459, 140443. [Google Scholar] [CrossRef] [PubMed]
- ASTM E96/E96M-22; Standard Test Methods for Gravimetric Determination of Water Vapor Transmission Rate of Materials. ASTM International: West Conshohocken, PA, USA, 2022.
- Skoog, D.A.; West, D.M.; Holler, F.J.; Crouch, S.R. Fundamentals of Analytical Chemistry; Saunders College Pub.: Fort Worth, TX, USA, 1996; Volume 33. [Google Scholar]
- Deswal, S.; Kaushik, A.; Garg, R.K.; Sahdev, R.K.; Chhabra, D.J.S. Optimization of fused deposition modelling printing parameters using hybrid GA-fuzzy evolutionary algorithm. Sādhanā 2024, 49, 257. [Google Scholar] [CrossRef]
- Marasini, N.; Yan, Y.D.; Poudel, B.K.; Choi, H.G.; Yong, C.S.; Kim, J.O. Development and optimization of self-nanoemulsifying drug delivery system with enhanced bioavailability by Box-Behnken design and desirability function. J. Pharm. Sci. 2012, 101, 4584–4596. [Google Scholar] [CrossRef]
- Hou, M.; Chen, F.; Jiao, J.; Pei, F.; Li, Y.; Zhang, W. Multi-response optimization of ejector for proton exchange membrane fuel cell anode systems by the response surface methodology and desirability function approach. Int. J. Green Energy 2024, 21, 1910–1927. [Google Scholar] [CrossRef]
- Yang, X.-S. Firefly algorithms for multimodal optimization. In Stochastic Algorithms: Foundations and Applications, Proceedings of the 5th International Symposium, SAGA 2009, Sapporo, Japan, 26–28 October 2009; Springer: Berlin/Heidelberg, Germany, 2009; pp. 169–178. [Google Scholar]
- Xia, X.; Gui, L.; He, G.; Xie, C.; Wei, B.; Xing, Y.; Wu, R.; Tang, Y. A hybrid optimizer based on firefly algorithm and particle swarm optimization algorithm. J. Comput. Sci. 2018, 26, 488–500. [Google Scholar] [CrossRef]
- Wang, H.; Zhou, X.; Sun, H.; Yu, X.; Zhao, J.; Zhang, H.; Cui, L. Firefly algorithm with adaptive control parameters. Soft Comput. 2017, 21, 5091–5102. [Google Scholar] [CrossRef]
- Chuah, H.S.; Wong, L.-P.; Hassan, F.H. Swap-based discrete firefly algorithm for traveling salesman problem. In Multi-disciplinary Trends in Artificial Intelligence, Proceedings of the 11th International Workshop, MIWAI 2017, Gadong, Brunei, 20–22 November 2017; Springer: Cham, Switzerland, 2017; pp. 409–425. [Google Scholar]
- Krishnanand, K.N.; Ghose, D.J.S.I. Glowworm swarm optimization for simultaneous capture ofmultiple local optima ofmultimodal functions. Swarm Intell. 2009, 3, 87–124. [Google Scholar] [CrossRef]
- Zhou, Y.; Wu, X.H.; Chen, J.H.; He, J.H. Effects of cinnamon essential oil on the physical, mechanical, structural and thermal properties of cassava starch-based edible films. Int. J. Biol. Macromol. 2021, 184, 574–583. [Google Scholar] [CrossRef]
- Deng, P.; Wang, Z.; Bu, J.; Fan, Y.; Kuang, Y.; Jiang, F. Konjac glucomannan-based nanocomposite spray coating with antimicrobial, gas barrier, UV blocking, and antioxidation for bananas preservation. Int. J. Biol. Macromol. 2024, 265, 130895. [Google Scholar] [CrossRef]
- Moudache, M.; Nerín, C.; Colon, M.; Zaidi, F. Antioxidant effect of an innovative active plastic film containing olive leaves extract on fresh pork meat and its evaluation by Raman spectroscopy. Food Chem. 2017, 229, 98–103. [Google Scholar] [CrossRef]
- Chen, Q.; Xie, Y.; Xi, J.; Guo, Y.; Qian, H.E.; Cheng, Y.; Chen, Y.I.; Yao, W. Characterization of lipid oxidation process of beef during repeated freeze-thaw by electron spin resonance technology and Raman spectroscopy. Food Chem. 2018, 243, 58–64. [Google Scholar] [CrossRef]
- Wang, L.; Shao, S.; Madebo, M.P.; Hou, Y.Y.; Zheng, Y.H.; Jin, P. Effect of nano-SiO2 packing on postharvest quality and antioxidant capacity of loquat fruit under ambient temperature storage. Food Chem. 2020, 315, 126295. [Google Scholar] [CrossRef]
- Zhang, R.; Wang, X.; Li, L.; Cheng, M.; Zhang, L. Optimization of konjac glucomannan/carrageenan/nano-SiO2 coatings for extending the shelf-life of Agaricus bisporus. Int. J. Biol. Macromol. 2019, 122, 857–865. [Google Scholar] [CrossRef]
- Naidu, K.; Mokhlis, H.; Bakar, A.H.A. Application of Firefly Algorithm (FA) based optimization in load frequency control for interconnected reheat thermal power system. In Proceedings of the 2013 IEEE Jordan Conference on Applied Electrical Engineering and Computing Technologies (AEECT), Amman, Jordan, 3–5 December 2013; pp. 1–5. [Google Scholar]
- Khanzada, B.; Akhtar, N.; ul Haq, I.; Mirza, B.; Ullah, A. Polyphenol assisted nano-reinforced chitosan films with antioxidant and antimicrobial properties. Food Hydrocoll. 2024, 153, 110010. [Google Scholar] [CrossRef]
- Cheng, L.; Li, X.; An, S.Y.; Liu, Z.H.; Liu, Y.Y.; Ren, D.F. Preparation and characterization of polyethylene-based composite films coated with carboxymethyl chitosan/sodium alginate/nisin and application in the packaging of Rosa roxburghii Tratt. Food Packag. Shelf Life 2024, 43, 101295. [Google Scholar] [CrossRef]
- Dong, G.P.; Yuan, Z.Q.; Guo, X.J. Functional properties of nano-SiO2/pinewood-derived cellulose acetate composite film for packaging application. Ind. Crops Prod. 2023, 204, 117253. [Google Scholar] [CrossRef]
- Dong, W.X.; Su, J.Q.; Chen, Y.L.; Xu, D.X.; Cheng, L.; Mao, L.K.; Gao, Y.X.; Yuan, F. Characterization and antioxidant properties of chitosan film incorporated with modified silica nanoparticles as an active food packaging. Food Chem. 2022, 373, 131414. [Google Scholar] [CrossRef]
- Hou, X.B.; Xue, Z.X.; Xia, Y.Z.; Qin, Y.M.; Zhang, G.F.; Liu, H.W.; Li, K.C. Effect of SiO2 nanoparticle on the physical and chemical properties of eco-friendly agar/sodium alginate nanocomposite film. Int. J. Biol. Macromol. 2019, 125, 1289–1298. [Google Scholar] [CrossRef]
- Zhang, X.; Luo, S.; Zhang, W.; Xu, W. Influence of Glycerol on Potato Starch-Based Biodegradable Packaging Films. In Advanced Graphic Communications, Packaging Technology and Materials; Springer: Singapore, 2015; pp. 837–842. [Google Scholar]
- Garcia, O.R.; Pinzón, M.I.; Villa, C.C. Analysis and modeling of mechanical and barrier properties of arracacha starch-chitosan composite biodegradable films. J. Polym. Environ. 2020, 28, 2253–2262. [Google Scholar] [CrossRef]
- Hu, N.; Liu, W.; Tang, E.; Li, L.; Yuan, M.; Xing, X.; Liu, X.; Yao, Y.; Shao, H.; Jewell, L. Optimization of Esterified Chestnut Starch Synthesis Using Response Surface Methodology and Its Application to Biodegradable Materials. Starch-Stärke 2025, 77, e70111. [Google Scholar] [CrossRef]


Disclaimer/Publisher’s Note: The statements, opinions and data contained in all publications are solely those of the individual author(s) and contributor(s) and not of MDPI and/or the editor(s). MDPI and/or the editor(s) disclaim responsibility for any injury to people or property resulting from any ideas, methods, instructions or products referred to in the content. |
© 2025 by the authors. Licensee MDPI, Basel, Switzerland. This article is an open access article distributed under the terms and conditions of the Creative Commons Attribution (CC BY) license (https://creativecommons.org/licenses/by/4.0/).