Abstract
Urban river restoration provides significant ecological and social benefits, yet its market valuation remains underexamined in rapidly urbanizing inland cities. This study estimates the economic value of integrated blue–green spaces generated by the Bai River Ecological Restoration Project in Nanyang, China, using a spatially explicit hedonic pricing framework that links geocoded resale transactions with NDVI-based vegetation measures. Properties located within blue–green zones—areas jointly characterized by restored waterways and enhanced riparian greening—command an average price premium of 17.9% (CNY 1509/m2). Visual accessibility further increases housing values, although interaction effects indicate diminishing marginal premiums where multiple amenities co-occur. Quantile regressions show stronger capitalization effects in lower- and middle-priced segments, suggesting that ecological improvements may yield broad-based rather than elite-focused benefits. Spatial dependence diagnostics confirm significant autocorrelation, and Spatial Error Model estimates remain consistent with the baseline results. Overall, the findings provide robust evidence of supra-additive blue–green synergies and demonstrate the utility of combining NDVI with spatial econometric hedonic modeling. The study offers a transferable framework for supporting nature-based urban planning and informing cost–benefit evaluations of integrated ecological restoration initiatives.
1. Introduction
Urban river corridors—historically engineered as hydraulic channels for flood control and drainage—are increasingly recognized as multifunctional ecological infrastructure capable of delivering diverse ecosystem services and enhancing urban resilience [1,2]. Traditional blue infrastructure, typically composed of concrete-lined river channels, offers limited ecological and recreational value. In contrast, blue–green infrastructure integrates restored waterways with riparian vegetation to form continuous ecological corridors that support biodiversity, improve microclimates, enhance recreational access, and strengthen climate adaptation capacity [3,4]. As cities confront the dual pressures of ecological degradation and rapid urbanization, integrated blue–green restoration has emerged as a key strategy for improving environmental quality, public well-being, and long-term urban sustainability.
Despite these advances, river corridors—particularly in developing regions such as inland China—have suffered from decades of degradation, including polluted waterways, fragmented riparian vegetation, encroachment, and weakened human–water interactions [5,6]. Many cities are now investing in ecological restoration as a means to reverse this deterioration. Yet while the ecological and social benefits of integrated blue–green corridors are widely acknowledged, their economic value remains insufficiently quantified. Existing hedonic pricing studies typically evaluate either blue amenities (e.g., rivers, lakes) or green amenities (e.g., parks, vegetation) separately [7,8], overlooking potential synergies generated when water bodies and vegetation are spatially integrated. Such siloed approaches risk underestimating the full ecosystem-service bundle supplied by blue–green corridors, including enhanced visual amenity, thermal comfort, biodiversity support, and recreational value [8,9,10].
Important methodological gaps persist as well. First, few studies incorporate fine-scale ecological indicators, such as NDVI-based vegetation quality or view-shed visibility, despite their demonstrated ability to reflect environmental conditions more accurately than simple distance metrics [11,12]. Second, most empirical evidence is concentrated in coastal megacities, leaving inland cities like Nanyang underexamined, even though they face distinct constraints—tighter land markets, weaker ecological baselines, and more pronounced socio-spatial disparities. Third, evidence on interactive effects between blue and green amenities remains extremely limited. Without examining how ecological features co-occur and reinforce one another, existing research cannot fully capture the value of integrated restoration.
To address these gaps, this study develops a unified hedonic pricing framework to estimate the market-based value of blue–green ecological restoration along the Bai River in Nanyang, China. The framework integrates housing transaction data with satellite-derived NDVI values and detailed measures of river proximity, vegetation quality, and visual accessibility. In the hedonic pricing framework, NDVI serves as an objective indicator of the green-space quality in a property’s immediate environment, while transaction prices represent the market valuation of both structural attributes and surrounding amenities. Integrating these two datasets allows us to estimate the extent to which vegetation coverage is capitalized into housing prices. Interaction terms allow us to identify synergistic effects arising from the integration of hydrological and vegetative restoration. A comprehensive set of sensitivity analyses—including alternative river-buffer distances (300 m and 700 m), alternative NDVI thresholds (0.25 and 0.35), and marginal-effects visualizations—confirms the robustness of the blue–green synergy effect. Diagnostic tests (VIF, residual normality, and heteroskedasticity checks) further validate the reliability of the estimates.
This study applies such an integrated approach to the Bai River Ecological Restoration Project in Nanyang, China. Using housing transaction records matched with NDVI data, the analysis estimates how blue, green, and combined blue–green features influence residential property values. The results reveal marked differences in how ecological amenities are monetized. Proximity to blue space yields a substantial and consistent premium: the estimated coefficient of 0.169 corresponds to a 15.0–18.4% price increase (approximately CNY 1263–1549/m2). Integrated blue–green zones also generate a sizeable premium, with a coefficient of 0.165 translating to a 17.9% increase (about CNY 1509/m2). In contrast, green-only zones show no statistically significant capitalization effect across model specifications. These findings suggest that vegetation alone does not confer measurable market value unless paired with hydrological features, highlighting the importance of ecological integration.
This study makes several substantive contributions. First, it provides robust empirical evidence of supra-additive blue–green synergies, demonstrating that integrated ecological restoration yields greater economic value than isolated hydrological or vegetative interventions. Second, it advances methodological practice by integrating remote sensing and econometric interaction modeling, offering a scalable toolkit for ecological valuation in data-scarce settings [13]. Third, it provides actionable insights for planners, illustrating how ecological capital can be enhanced by combining river restoration with riparian vegetation enhancement, preserving visual corridors, and strategically coordinating blue–green design elements.
These contributions help bridge the knowledge gap between ecological theory, planning praxis, and market behavior, and provide empirical backing for broader adoption of integrated ecological planning in cities facing the dual pressures of urban growth and environmental degradation.
2. Literature Review
2.1. Economic Valuation of Urban Green and Blue Spaces
A growing body of research in environmental economics examines how urban green and blue spaces are capitalized into housing markets, most commonly through hedonic pricing models (HPMs). These models provide a robust framework for estimating marginal willingness to pay for non-market environmental amenities and have consistently shown that features such as parks, street trees, lakes, and rivers generate measurable property price premiums [14,15]. Studies across North America, Europe, and Asia demonstrate that proximity to urban green infrastructure—urban forests, community gardens, and parks—tends to increase residential property values, reflecting strong household preferences for these amenities [16,17]. Similarly, blue spaces including rivers, lakes, and coastlines contribute positively to housing prices by offering aesthetic, recreational, and microclimatic benefits, as well as stormwater regulation services [14,18,19]. Meta-analyses and spatial econometric studies further show that the magnitude of these premiums varies across urban density, socio-economic context, and levels of accessibility [20].
More recent work moves beyond treating green and blue spaces as separate amenities and has introduced the concept of blue–green infrastructure (BGI) to capture the synergistic value of integrated natural systems. Empirical studies show that co-located green and blue features can yield supra-additive effects on property prices, with integrated landscapes generating greater benefits than either component alone [21,22]. These findings align with the growing recognition of BGI as a multifunctional system delivering overlapping ecological, social, and economic benefits [23,24].
Despite this progress, empirical research on blue–green interaction effects remains limited. While some studies incorporate spatial interaction terms or multilevel approaches [20,25], most hedonic analyses still evaluate green and blue variables separately, potentially underestimating the co-benefits of integrated ecological design. This gap is particularly relevant in rapidly transforming urban regions, such as inland Chinese cities, where large-scale ecological restoration could produce compounded economic effects. Addressing this gap requires methodological approaches capable of capturing spatial heterogeneity and interaction dynamics, including geographically weighted regression and spatial autoregressive models.
2.2. River Restoration and Ecosystem Services
River restoration has become a central ecological and urban planning strategy aimed at reversing the degradation of urban waterways and enhancing livability through diverse ecosystem services. Contemporary restoration efforts extend well beyond hydrological repair to include riparian habitat enhancement, re-establishment of native vegetation, biodiversity improvements, and the provision of cultural ecosystem services such as aesthetics, recreation, and psychological benefits [26,27]. These interventions strengthen urban resilience and contribute to both ecological and social well-being, particularly in the context of climate adaptation.
Despite the widespread implementation of river restoration initiatives, their economic impacts on housing markets remain relatively underexplored. Although ecological and social benefits are well documented, fewer studies quantify how restoration translates into property price premiums using rigorous economic models. For example, Wen [28] applied spatial quantile regression in Changsha, China, showing that river proximity and visibility exert heterogeneous effects across market segments, while Wu [23] used 3D-GIS-based visibility measures to demonstrate that visible riparian restorations significantly elevate nearby housing values.
Recent work has begun to disentangle the value of specific ecological improvements—such as water quality upgrades versus vegetative enhancements—to better understand how these components contribute individually and collectively to property values. This distinction is crucial in restored corridors where green and blue elements function jointly [20,29]. For instance, Chen [26] found in Guangzhou that improvements in both water purification and riparian vegetation influence real estate values independently and interactively, and that models omitting interaction terms may underestimate co-benefits.
The literature further highlights the need for spatially nuanced valuation approaches that move beyond simple proximity measures. Scholars increasingly emphasize incorporating visual accessibility, elevation-adjusted viewsheds, and multilevel spatial autoregressive methods to more accurately capture how ecological enhancements shape housing markets [4,30]. Additionally, quasi-experimental designs [31] and difference-in-differences frameworks [32] offer promising tools for strengthening causal inference in the valuation of ecosystem services.
2.3. Economic Value of Urban River Restoration in China
Urban river restoration has become a major priority in China’s environmental governance as cities confront rapid urbanization, water degradation, and ecological fragmentation. Although global studies offer theoretical frameworks for valuing non-market environmental amenities, the institutional, legal, and spatial characteristics of Chinese cities necessitate context-specific empirical research [5,33].
One influential contribution is Dai, Brouwer, and Lei’s [29] discrete choice experiment (DCE) in the Yongding River Basin, which showed that public willingness to pay (WTP) for restoration is strongly shaped by place attachment, with higher WTP for improvements to water quality and ecological access. This aligns with findings from Ting Cho [34], who compared DCE with the Analytic Hierarchy Process in Guangzhou and highlighted the importance of citizen preferences and public participation in valuation processes.
Complementing stated-preference studies, Chen and Li [5] applied a spatial hedonic model to estimate how urban stream pollution affects housing prices in Guangzhou. Their results revealed substantial spatial heterogeneity, underscoring the value of spatial econometric approaches—such as spatial lag and error models—for capturing localized environmental perceptions. Extending this work, Li et al. [20] introduced a 3D multilevel autoregressive model to quantify the vertical dimension of river visibility in Guangzhou’s high-rise housing markets, demonstrating how regulatory view corridors and urban morphology shape valuation patterns.
Recent research has also explored restoration spillovers beyond immediate riverfront areas. For example, Yang [35] used a quasi-natural experimental design in Wuhan to show that ecological improvements generate benefits extending into adjacent neighborhoods, reinforcing the need for integrated, city-wide ecological planning.
2.4. Remote Sensing and Spatial Indicators in Valuation Models
Advances in remote sensing and GIS technologies have greatly improved the spatial precision of environmental valuation, particularly within hedonic pricing models. Vegetation indices such as NDVI now provide continuous and objective measures of urban greenness that outperform traditional buffer-based or Euclidean distance proxies [36,37]. High-resolution imagery from platforms such as Landsat, Sentinel, and commercial satellites allows fine-grained detection of vegetation variability across dense urban environments [38].
These tools enable researchers to capture subtle greenness effects on housing values, even in cities with complex vertical morphology or severe air pollution. For instance, Mei [39] used time-series NDVI data in Beijing and found strong positive associations between vegetation levels and housing prices in areas with lower environmental quality. Moreover, the incorporation of 3D viewsheds—derived from digital surface models and line-of-sight algorithms—provides more accurate measures of how visible green and blue amenities are from individual units [12].
While remote-sensing approaches have significantly enhanced the granularity and reliability of hedonic models, further progress requires integrating context-specific spatial metrics. Combining vegetation structure, hydrological accessibility, and perceptual variables such as visibility and cultural utility will yield a more comprehensive understanding of the economic value of urban environmental amenities.
2.5. Contribution of This Study
This study makes three substantive contributions to environmental valuation and urban planning literature. First, it provides empirical evidence on the synergistic value of integrated blue–green restoration. While most prior studies assess water bodies and vegetation separately, this analysis quantifies their interaction effect, demonstrating how co-located river and vegetation features contribute supra-additive value in an inland Chinese context.
Second, the study incorporates visual accessibility into the hedonic framework, extending valuation beyond physical proximity to include perceptual exposure. This integration of visibility—alongside fine-grained indicators of vegetation quality and spatial proximity—advances methodological practice beyond the coarse distance-only measures common in earlier work.
Third, the study broadens the geographic scope of blue–green valuation research by examining an inland city undergoing rapid ecological transformation. The findings provide context-specific evidence on how restoration influences urban housing markets and offer practical insights for planning nature-based solutions in similar urban settings.
These contributions deepen understanding of how blue–green ecological corridors shape urban land values and provide analytically robust, policy-relevant evidence to support sustainable urban planning.
3. Research Area and Data
3.1. Research Area
Nanyang is a prefecture-level city located in the southwestern part of Henan Province, China. As a rapidly growing inland city, it has experienced continuous population expansion and urban development over the past two decades, placing notable pressure on local ecological systems. Among these, the Bai River is one of the city’s most important urban waterways, running through the main urbanized area and playing a central role in the city’s ecological and spatial structure (Figure 1).
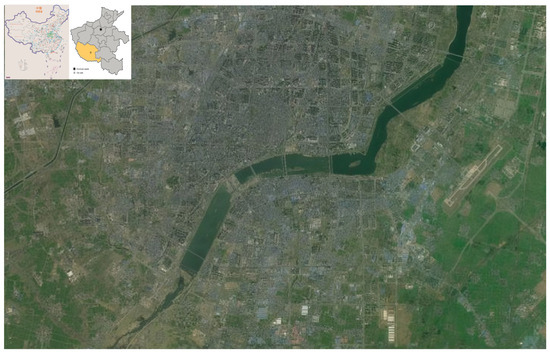
Figure 1.
The geography of Nanyang city.
Before restoration efforts began in 2015, the Bai River corridor exhibited substantial environmental degradation. Rapid industrialization and urban land conversion had led to declining water quality, sediment accumulation, loss of riparian vegetation, and fragmentation of natural habitats. Public access to the riverfront was limited, and the corridor provided few ecological or recreational functions. As a result, the area did not offer landscape amenities capable of generating any meaningful capitalization effect in housing markets prior to intervention.
To address these issues, the Nanyang municipal government launched the Bai River Ecological Restoration Project in 2015. The project adopted a comprehensive ecological management approach, involving channel dredging, ecological bank stabilization, wetland and riparian habitat reconstruction, and large-scale planting of native vegetation. In parallel, integrated riverside parks, greenways, public access points, walking trails, and recreational facilities were developed to create multifunctional blue–green corridors.
These interventions collectively transformed the Bai River from a degraded urban waterway into a connected ecological and recreational system that enhances water quality, restores riparian functions, and provides continuous public access to high-quality blue–green spaces. This clear and substantial transformation provides an appropriate setting to examine how ecological improvements are reflected in residential property values.
The empirical analysis uses housing transaction data collected after the completion of the major restoration works, ensuring that the environmental attributes of the restored Bai River corridor were fully established and observable to market participants when the transactions occurred.
3.2. Theoretical Framework
3.2.1. Hedonic Pricing Theory
Hedonic pricing theory [40] posits that housing prices reflect a bundle of structural, neighborhood, and environmental attributes. Through market transactions, buyers reveal their willingness to pay for environmental quality. In this study, river proximity, vegetation quality, and visual access represent key environmental attributes expected to be capitalized into property values. Properties offering superior ecological or aesthetic conditions are therefore anticipated to exhibit higher prices.
3.2.2. Ecosystem Services and Blue–Green Amenities
Urban rivers and adjacent vegetation generate multiple ecosystem services, including microclimate regulation, stormwater mitigation, air purification, habitat support, and recreational and cultural benefits [41]. Because these services vary spatially, fine-grained indicators—such as NDVI and distance-based measures—are appropriate for capturing heterogeneity in ecological provision at the parcel scale. In this context, NDVI reflects vegetation quality, while river proximity captures access to water-related ecological and cultural services.
3.2.3. Blue–Green Synergy Theory
Environmental planning research increasingly highlights the synergistic value of co-located water and vegetation [42]. Blue–green systems often produce ecological and experiential benefits that are greater than the sum of their independent contributions, including enhanced cooling, biodiversity gains, and improved recreational and aesthetic qualities. To reflect this theoretical expectation, the model includes an interaction between NDVI and river proximity, allowing us to test whether vegetation amplifies the value of river access—and vice versa.
3.2.4. Environmental Perception and Visual Amenity Theory
Perception-based theories emphasize that the visual accessibility of natural features shapes aesthetic appreciation, restorative potential, and overall environmental preference [17,43]. Empirical evidence suggests that visible water bodies often generate larger price premiums than proximity alone. Although detailed viewshed modeling could not be performed due to data limitations, a binary indicator of river visibility is included to capture line-of-sight exposure to the restored corridor. This approach aligns with established practice in hedonic valuation research when full three-dimensional visibility data are unavailable and provides a practical proxy for the perceptual dimension of environmental amenities.
Figure 2 illustrates the conceptual framework that guides this study. River proximity and vegetation quality represent the core blue and green attributes of the urban environment. While each contributes ecological and aesthetic value independently, their co-location may generate synergistic blue–green benefits that exceed the sum of individual effects. Visual accessibility and access to wetland parks capture perceptual and recreational pathways through which residents experience these environmental features. Together, these ecological, perceptual, and synergistic attributes inform how environmental quality is capitalized into housing prices. This framework guides the empirical model, which evaluates not only the separate contributions of blue and green features but also their interaction and potential nonlinear effects on residential property values.
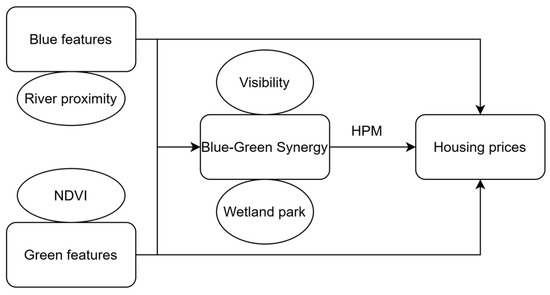
Figure 2.
Conceptual Framework Linking Blue–Green Infrastructure Features to Housing Price Formation.
3.3. Data Sources and Variable Construction
This study integrates multiple data sources to construct a rich, spatially explicit dataset suitable for hedonic price analysis. The core unit of observation is the individual housing transaction, and each transaction is linked to a series of structural, locational, and environmental attributes. This study uses 316 verified second-hand housing transactions from 2023, obtained from Anjuke.com, one of China’s largest real estate platforms. Anjuke provides broad market coverage, with more than 85% of established residential communities in Nanyang represented, making it a reliable source for second-hand market information.
The choice of 2023 is deliberate. It represents the first full and stable year after the completion of the Bai River Ecological Restoration Project in late 2022. Using a single cross-sectional year allows the study to capture the spatial capitalization of fully established ecological amenities without construction-related disturbances. While multi-year or pre-restoration data would strengthen causal identification, consistent transaction records from earlier periods are not publicly accessible, and new-sale developer data are unsuitable due to bundled and nontransparent pricing practices.
The dataset consists exclusively of resale housing transactions, which provide market-formed prices unaffected by developer pricing strategies. Data quality was ensured through the removal of records with missing or inconsistent information, the elimination of duplicate listings posted by multiple agents, and the exclusion of non-residential or mixed-use properties. After applying these filters, a total of 316 complete and verified residential transactions remained for analysis.
To account for neighborhood amenities that influence housing prices, the model incorporates spatially defined covariates derived from Baidu Maps and processed through GIS-based analysis. Educational quality is captured using the number of government-designated key schools—high-performing schools—within a 500-m radius of each property. Although detailed performance metrics were unavailable, the distribution of key schools provides a meaningful proxy for school-district quality. Prior research shows that proximity to high-quality schools is strongly capitalized into housing prices in urban China, reflecting both access to educational resources and the premium associated with competitive school districts [44].
Similarly, the number of hospitals within 500 m serves as a proxy for local healthcare accessibility. Access to medical services has been consistently identified as a key determinant of housing demand in urban environments [45], with positive price effects observed in many Chinese cities due to the perceived convenience and security associated with proximity to health facilities.
In addition to institutional services, the model includes the number of wetland parks located within a 500-m buffer to capture nearby ecological and recreational amenities. Wetland parks, as multifunctional green-blue infrastructure, contribute to urban livability by providing aesthetic, recreational, and climate regulation benefits. Prior studies have found that proximity to urban green and blue spaces—including lakes, riverfronts, and wetlands—has a significant positive effect on property values [21].
As such, these neighborhood-level covariates are expected to capture meaningful spatial variation in service accessibility and environmental quality, both of which are relevant to household location decisions and property valuation.
Environmental attributes represent the central explanatory variables in the empirical model, reflecting the ecological quality and spatial accessibility of green and blue infrastructure within the urban landscape. These variables are constructed using a combination of satellite-derived remote sensing data and geospatial proximity analysis, in alignment with best practices in environmental economics and spatial hedonic modeling. Table 1 presents the variables.

Table 1.
Descriptions of the variables.
The first key environmental indicator is the NDVI, which serves as a continuous measure of vegetation density in the vicinity of each housing unit. NDVI values were obtained from the MODIS Vegetation Indices (MOD13Q1) product, which offers data at a 250-m spatial resolution (Figure 3). To reflect the immediate residential greenness experienced by urban households, these values were averaged within a 250-m buffer around each property. The use of NDVI has been widely validated in hedonic pricing studies, offering a more nuanced and objective assessment of ecological quality than binary or land-cover-based proxies. Moreover, NDVI captures variations in vegetation health and density—factors that influence residents’ perceptions of local environmental quality and microclimatic comfort [39].
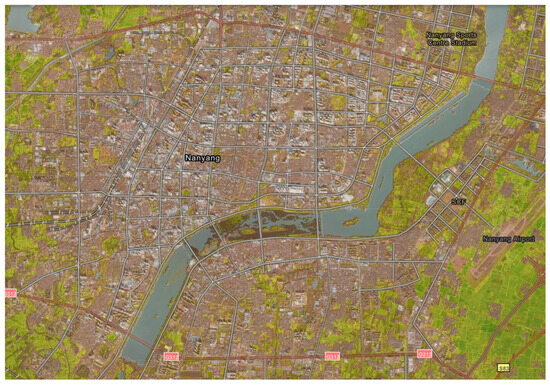
Figure 3.
Spatial Distribution of NDVI of Nanyang urban city.
In addition to greenness, blue infrastructure is represented through a continuous variable measuring the Euclidean distance from each residential unit to the nearest point along the restored section of the Bai River. This distance was calculated using georeferenced data from Baidu Maps. The inclusion of this variable enables the estimation of spatial decay effects, wherein the marginal amenity value of blue spaces declines with increasing distance from the property.
To further operationalize the concept of green–blue integration and examine the potential for synergistic valuation effects, two binary variables are constructed. A “Green” dummy variable is assigned a value of one if the NDVI within the property buffer exceeds or equals 0.3, a threshold commonly used in the urban valuation literature to signify moderate to high vegetation density [46]. Simultaneously, a “Blue” dummy is defined as one if the property is located within 500 m of the restored Bai River. This spatial threshold reflects widely accepted standards in urban design and environmental psychology, where a 400 to 600-m radius is considered a behaviorally relevant walking distance for regular use of parks and water features. Empirical studies confirm that housing premiums associated with ecological amenities are strongest within this spatial range, supporting the relevance of this proximity cutoff [47].
The interaction of the green and blue dummy variables is used to capture properties that simultaneously benefit from sufficient vegetation density and close proximity to restored water bodies—thus identifying “blue–green spaces.” This interaction term is critical for testing the hypothesis that the co-location of green and blue infrastructure generates supra-additive value beyond the sum of individual effects.
Accordingly, the classification yields four mutually exclusive groups of properties: those with access to both green and blue features, those with only green infrastructure, those with only blue infrastructure, and those with neither. This structure enables a rigorous comparison of the marginal and interactive effects of environmental attributes on housing values and provides a basis for identifying whether integrated ecological design confers economic advantages over isolated interventions.
4. Empirical Strategy
4.1. Hedonic Model Specification
To assess how ecological restoration influences urban housing markets, this study applies a hedonic pricing model, a framework rooted in the theory of differentiated goods first formalized by Rosen [40]. In this model, housing prices are interpreted as functions of a vector of attributes, including structural features, neighborhood-level characteristics, and environmental qualities. The hedonic model provides a way to infer individuals’ marginal willingness to pay for non-market amenities, such as access to green and blue infrastructure, by observing their effects on market transactions.
Formally, a semi-logarithmic regression model is specified in the following form:
where is the per-square-meter price of property, is a vector of structural housing characteristics, represents neighborhood amenities, and captures environmental features including river-related attributes and vegetation indices is the idiosyncratic error term.
The application of the hedonic pricing model is designed to capture the implicit market price of blue–green spaces as residential property attributes. This methodological choice enables the estimation of the contribution made by varying levels of blue–green space provision to overall housing value, thereby reflecting the market’s valuation of these amenities at a specific point in time. Although strict causal identification remains challenging in a cross-sectional setting, the primary focus is on providing an accurate estimate of the market monetization effect, conditional on the observed features of properties and their surrounding environment.
This modeling framework enables us to estimate the implicit value of discrete and continuous environmental features while accounting for structural and locational confounders. By integrating satellite-derived vegetation indices and fine-scale spatial indicators, the model is capable of capturing both the presence and functional quality of ecological improvements. This design aligns with recent advances in spatially explicit environmental valuation, offering a robust empirical platform for analyzing how nature-based urban restoration is monetized in property markets.
4.2. Causal Identification and Cross-Sectional Design
This study relies on cross-sectional housing transactions from 2023, the first full year after the completion of the Bai River restoration. Because historical pre-restoration transactions with consistent spatial identifiers were unavailable, it was not possible to construct a multi-period dataset or implement quasi-experimental strategies such as difference-in-differences or panel fixed-effects models. Consequently, the empirical results represent associational capitalization patterns observed in the post-restoration market rather than causal estimates of the restoration’s effects. While the hedonic framework captures how environmental attributes are reflected in market prices, the absence of temporal variation prevents inference about dynamic adjustment, causal treatment effects, or temporal generalizability. These limitations are addressed explicitly in Section 5.3, and future work should incorporate multi-year or quasi-experimental designs to strengthen causal interpretation.
4.3. Interaction Models and Synergistic Value Estimation
To explore the hypothesis that spatially integrated blue and green infrastructure generates greater economic value than isolated features, this study extends the hedonic price model to include interaction terms. This approach enables the empirical investigation of synergistic effects, whereby the joint presence of water bodies and vegetation enhances perceived environmental quality.
The spatial relationship between each property and the restored Bai River is represented along two dimensions: physical proximity and visual access. Proximity is measured as the shortest distance to the river, while visual access is captured through a binary indicator denoting whether a property has a direct line-of-sight to the river corridor. Although more detailed visibility metrics—such as 3D viewsheds or measures of view extent and landscape quality—would provide greater precision, such analyses require high-resolution elevation and building-height data that were not available for this study. The binary measure therefore serves as a practical proxy commonly used in hedonic analyses under similar data constraints. To account for the possibility of ecological complementarity, a categorical variable representing blue-green integration is also constructed, defined as the spatial overlap of riparian vegetation and restored water bodies within a given buffer around the property.
One key interaction term links NDVI with a binary river proximity indicator. The underlying rationale is that vegetative cover may be more valuable when functionally connected to hydrological systems, consistent with ecosystem service theory.
The first extended model introduces an interaction term between NDVI and the binary “Blue” variable, which captures whether a property is located within 500 m of the restored Bai River. This specification allows for the identification of synergistic effects between vegetation density and river proximity, testing whether co-located green and blue features generate a compound premium beyond their individual contributions.
First, NDVI is interacted with a binary indicator for river proximity:
A second specification interacts NDVI with the natural logarithm of the distance to the river, permitting a continuous estimation of how the value of vegetation varies across spatial gradients.
The second extended model incorporates an interaction between NDVI and the continuous distance to the Bai River, enabling the analysis of how the marginal value of greenness varies along a spatial gradient of river accessibility. This interaction captures potential nonlinear complementarities, offering insight into whether dense vegetation yields stronger price effects when it is situated closer to blue infrastructure.
The gradient of synergy decay is further examined by interacting NDVI with the logarithmic river distance:
A third set of interactions combines visual access indicators—such as river view—with other environmental amenities like wetland parks, to examine whether perceptual saturation or diminishing marginal utility arises when multiple amenities are co-located.
The third extended model examines the interaction between NDVI and a visibility dummy for wetland parks, defined as a binary variable indicating whether the property has a direct line-of-sight to a nearby wetland park. This model addresses the role of visual accessibility in shaping perceived ecological quality and aesthetic value, particularly in the context of restored wetland environments. Prior studies suggest that the ability to visually perceive natural features can substantially influence environmental preferences and housing prices [23,48].
To assess perceptual saturation, a river view variable is included and interacted with the presence of nearby parks:
These interaction models are theoretically motivated and designed to assess how ecological structure, visibility, and spatial arrangement shape valuation outcomes. Although the effects of these interactions are tested empirically in subsequent sections, their inclusion at the modeling stage reflects a commitment to capturing the nonlinear and interdependent nature of urban ecosystem services.
Together, these three extensions offer a layered empirical framework for disentangling the effects of spatial co-location, distance-based ecological gradients, and visual exposure. By modeling these interaction effects, the analysis not only confirms whether blue–green spaces hold economic value, but also clarifies the pathways through which such value is capitalized in urban property markets. This framework provides a more nuanced and policy-relevant understanding of how nature-based infrastructure contributes to urban sustainability and land value enhancement.
4.4. Quantile Regression and Distributional Heterogeneity
Recognizing that preferences for environmental amenities may vary across different segments of the housing market, this study complements the ordinary least squares regressions with quantile regression models. These models provide estimates of the marginal effects of environmental variables at different points of the housing price distribution—such as the 25th, 50th, and 75th percentiles—thereby identifying whether the implicit value of ecological improvements differs across lower-, middle-, and higher-priced properties.
Quantile regression is particularly suitable in settings characterized by heteroskedasticity or non-normal error distributions, which are common in urban housing data. It also enables the examination of distributional equity, assessing whether nature-based interventions disproportionately benefit particular socioeconomic groups. By capturing this heterogeneity, the quantile-based approach provides a richer understanding of how environmental values are monetized and who benefits most within the urban property market.
4.5. Spatial Dependence Diagnostics
Given the inherently spatial structure of housing markets, diagnostic procedures were applied to determine whether the hedonic model required a spatial econometric specification. Spatial dependence was evaluated using a rook-contiguity spatial weights matrix constructed from shared parcel boundaries. Two complementary tests were implemented.
First, global spatial autocorrelation in the OLS residuals was assessed using Moran’s I, which measures the degree to which residuals exhibit systematic spatial clustering.
Second, Lagrange Multiplier (LM) tests were employed to identify the underlying form of spatial dependence. The LM–Lag statistic evaluates whether spatial interaction affects the dependent variable directly, consistent with a Spatial Lag Model (SAR). The LM–Error statistic evaluates whether spatial dependence operates through the error term, consistent with a Spatial Error Model (SEM). Robust LM statistics account for the presence of alternative spatial processes and guide appropriate model selection.
Based on the outcomes of these diagnostics, a SEM was estimated to correct for spatially correlated unobserved influences and to ensure statistically valid inference for the hedonic price effects.
The Spatial Error Model assumes:
where is the spatial error coefficient and is an independent and identically distributed disturbance term.
4.6. Endogeneity Considerations
Potential endogeneity between environmental quality and housing prices is a recognized concern in hedonic valuation. Although the possibility of bidirectional influence cannot be fully ruled out, several features of the study context help limit its severity. The NDVI levels and river-related ecological attributes used in this analysis originate from municipal restoration programs and citywide ecological planning rather than from household-level investment decisions, reducing the likelihood that local price dynamics directly shape environmental conditions. In addition, the major restoration works were completed prior to most transactions in the 2023 dataset, which helps mitigate risks of reverse causality.
Nonetheless, unobserved neighborhood characteristics or residential sorting processes could still generate omitted-variable bias. Because suitable instruments and multi-year transaction records are not available, more formal corrections—such as instrumental-variable estimation, difference-in-differences, or panel methods—cannot be implemented in the present analysis. For these reasons, the estimated premiums should be interpreted as associational rather than causal. Future research drawing on longitudinal datasets or quasi-experimental designs would allow for a more rigorous assessment of causal pathways linking ecological improvements and housing market outcomes.
5. Results
5.1. Descriptive Data
Table 2 summarizes descriptive statistics for the 316 housing transactions included in the analysis, all located within a three-kilometer buffer of the Bai River. The average housing price is approximately CNY 8417 per square meter, with a substantial standard deviation (CNY 2031), indicating considerable variation in housing values across the sample. This price dispersion likely reflects differences in both structural characteristics and environmental amenities.
Table 2.
Descriptive data.
On average, housing units have a floor area of 118.5 square meters and contain approximately 4.5 rooms, suggesting that mid-sized family dwellings dominate the sample. The mean number of floors is 17.1, though the range extends from 5 to 33, capturing a mix of mid- and high-rise buildings. The average building age is 10.75 years, with a range spanning newly built to 20-year-old structures, indicating moderate aging in the local housing stock.
Regarding public services, the mean number of schools within the vicinity is approximately 2, the key school is 0.12 and hospitals around 1.5, with some units lacking nearby hospitals entirely. These figures highlight spatial disparities in access to public infrastructure.
Environmental attributes show meaningful variation: the average NDVI value is 0.269, suggesting moderate vegetation density around the properties, while the distance to the Bai River varies widely—from as close as 124 m to as far as 2.3 km—with a mean of approximately 799 m. This heterogeneity in ecological exposure—both in green coverage and river proximity—provides a robust empirical foundation for identifying monetization effects associated with blue-green infrastructure.
5.2. Results of the Baseline Hedonic Pricing Models
Table 3 reports results from baseline hedonic pricing models examining the effects of environmental and structural attributes on housing prices. Across all specifications, blue–green integrated spaces—areas combining restored water bodies with surrounding vegetation—are strongly and significantly associated with higher property values. The coefficients range from 0.165 to 0.326, after controlling for housing characteristics and neighborhood amenities.
Table 3.
Results of baseline hedonic pricing models.
Control variables behave as expected: larger floor area, higher floors, and proximity to schools and hospitals are positively associated with price, while older buildings are discounted. These results confirm that blue–green integration delivers distinct and economically meaningful value, exceeding the benefits of standalone green or blue amenities.
To further investigate the mechanism of ecological complementarity, interaction terms between NDVI and river-related variables are incorporated into the hedonic models. Table 4 explores the role of ecological complementarity by incorporating interaction terms between NDVI and river-related variables into the hedonic pricing models. In both specifications, the results underscore the importance of spatial integration between green and blue elements.
Table 4.
Results with NDVI.
In column (1), the interaction between NDVI and river proximity is large and highly significant (coefficient = 0.771), suggesting that vegetation near rivers yields a substantially higher price premium than vegetation alone. The main effects of NDVI and river are individually weaker and less consistent, indicating that their combined presence drives much of the observed housing value uplift.
Column (2) reinforces this finding by interacting NDVI with the log of distance to the river. The interaction term is negative and significant, implying that the value of vegetative cover declines as distance from the river increases. NDVI on its own shows a strong positive effect in this model, but its impact is clearly conditional on proximity to the river.
These results support that blue–green spatial synergy enhances property values, with vegetation contributing more economically when embedded in a hydrological setting. The findings emphasize the importance of ecological design and spatial planning in maximizing the economic and environmental benefits of urban green infrastructure.
5.3. Spatial Econometric Analysis
To assess whether spatial dependence could distort the baseline OLS estimates, standard spatial diagnostics were applied. Global Moran’s I statistics were calculated for the OLS residuals and for each key variable. As shown in Table 5, the results reveal strong and statistically significant positive spatial autocorrelation in housing prices as well as in most structural and environmental attributes. This pattern indicates the presence of clustered spatial structure that a non-spatial specification is unable to fully account for.
Table 5.
Global Moran’s I Statistics for OLS Residuals and Key Variables.
To determine the appropriate spatial specification, Lagrange Multiplier (LM) diagnostics were employed. As shown in Table 6, both the LM-Error statistic (42.474, p < 0.001) and the Robust LM-Error statistic (33.357, p < 0.001) are strongly significant, whereas the Robust LM-Lag statistic is not. In accordance with established spatial econometric decision rules [49], this pattern indicates that the dominant form of spatial dependence originates from spatially correlated unobserved factors, thereby supporting the adoption of a Spatial Error Model (SEM).
Table 6.
Lagrange Multiplier Diagnostics for Spatial Dependence.
Consistent with this diagnostic evidence, a SEM was estimated, and the results are reported in Table 7. The spatial error coefficient is positive and statistically significant, confirming the presence of spatially clustered disturbances. Notably, the coefficients for river proximity, the Blue indicator, and the Green × Blue interaction remain stable and statistically significant under the SEM specification. This stability indicates that the environmental capitalization effects identified in the non-spatial model are robust to correction for spatial error dependence.
Table 7.
Spatial Error Model Estimates.
5.4. Robustness Test
To evaluate the stability and reliability of the hedonic estimates, a series of robustness checks were conducted using alternative spatial definitions, variable thresholds, and diagnostic tests. These analyses assess whether the main blue–green amenity effects hold under different proximity buffers (300 m and 700 m), revised NDVI thresholds (0.25 and 0.35), and potential issues such as multicollinearity, non-normal residuals, and heteroskedasticity. Marginal-effect visualizations are also provided to illustrate the direction and magnitude of the key ecological variables. Taken together, these robustness checks demonstrate that the estimated blue–green synergy and the associated amenity premiums are not artifacts of specific model choices and remain consistent across multiple specifications.
5.4.1. Alternative Buffer Zone Definitions (300 m and 700 m)
To assess whether the main results depend on the chosen proximity definition, Table 8 reports robustness tests using 300-m and 700-m buffer zones. The results demonstrate a high level of consistency across distance thresholds.
Table 8.
Sensitivity Analysis of Buffer Distance Definitions (300 m and 700 m).
When proximity is defined as within 300 m, the variable River_300 has a positive and statistically significant coefficient of 0.088, indicating that closer access to restored riverfront areas is associated with higher housing prices. When extending the buffer to 700 m, the coefficient of River_700 increases to 0.186, suggesting that the capitalization effect remains strong even at a broader spatial scale.
Importantly, the Blue–Green interaction term—capturing the synergy between river proximity and vegetation quality—remains positive and highly significant across both models (0.286 for the 300 m specification and 0.190 for the 700 m specification). This confirms that the enhanced amenity value generated by co-located blue and green features is robust to variations in proximity thresholds.
Control variables behave as expected: larger housing units show a modest positive effect on prices; proximity to key schools and hospitals is associated with higher values; and older buildings exhibit lower prices.
These results reinforce the robustness of the main findings and provide strong evidence that the blue–green synergy effect persists across alternative proximity definitions.
5.4.2. Sensitivity Analysis with Alternative NDVI Definitions
To test whether the definition of green space influences the estimated amenity effects, Table 9 presents regression results using alternative NDVI thresholds of 0.25 and 0.35. The results demonstrate a strong degree of robustness.
Table 9.
Sensitivity Analysis of Green-Space Definitions Using Alternative NDVI Thresholds (0.25 and 0.35).
First, both alternative indicators—Green_0.25 and Green_0.35—show small and statistically weak direct associations with housing prices, suggesting that vegetation density alone is not the primary driver of price variation when modeled independently.
Second, the Blue–Green interaction term remains positive and statistically significant at the 1% level across both specifications. The interaction coefficient equals 0.176 under the 0.25 threshold and 0.146 under the 0.35 threshold, indicating that the synergistic effect between river proximity and vegetation quality persists regardless of threshold choice. This supports the view that the enhanced amenity value arises from blue–green integration rather than the absolute level of vegetation density.
Third, other control variables behave consistently with expectations: Larger dwelling areas slightly increase prices. Proximity to key schools and hospitals adds significant premiums. Building age remains negatively associated with price levels.
These results provide strong evidence that the study’s findings are not sensitive to the NDVI threshold used to classify green spaces, confirming the validity of the original NDVI ≥ 0.30 definition.
5.4.3. Diagnostic Tests: Multicollinearity, Normality, and Heteroscedasticity Assessments
To ensure the reliability of the regression estimates, a series of diagnostic tests were conducted, including multicollinearity assessment (Table 10), residual normality evaluation (Figure 4), and heteroskedasticity testing (Table 11).
Table 10.
Assessment of Multicollinearity.
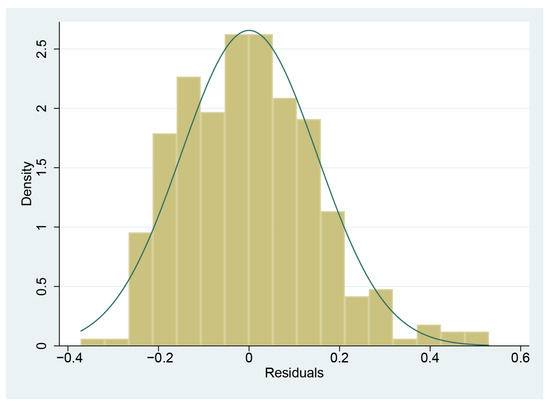
Figure 4.
Histogram of residuals with normal density curve.
Table 11.
Results of Breusch–Pagan test.
The Variance Inflation Factors (VIFs) indicate that multicollinearity is not a concern in the model. The mean VIF is 2.10, and all individual VIF scores fall well below the commonly accepted threshold of 10. The highest VIF value is 3.51 for Area of house, followed by Green × Blue (3.39) and Rooms (3.34). These values confirm that no variables exhibit problematic collinearity.
Residual normality was examined using a histogram (Figure 4), which shows that the residuals follow an approximately normal distribution without substantial skewness. This supports the appropriateness of the linear model specification.
The Breusch–Pagan/Cook–Weisberg test for heteroskedasticity yields χ2(1) = 2.13 (p = 0.1448), indicating no statistically significant heteroskedasticity at conventional levels. To ensure conservative inference, heteroskedasticity-robust standard errors are reported throughout, and results remain substantively unchanged when using conventional standard errors.
The diagnostic analyses confirm that the regression models satisfy the key assumptions of the hedonic pricing framework and that the reported results are statistically robust.
5.4.4. Marginal Effects Plot
Figure 5 reports the average marginal effects for vegetation, river proximity, and their interaction.
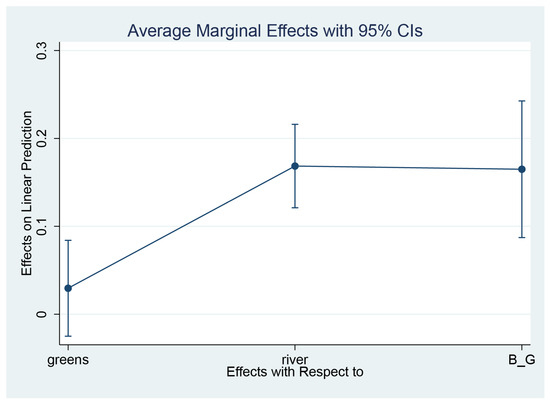
Figure 5.
Average Marginal Effects of Vegetation, River Proximity, and Blue–Green Interaction on Housing Prices.
The marginal effect of vegetation is positive but relatively small, indicating modest price increases associated with higher greenness levels; the confidence interval, however, approaches zero at the lower bound, suggesting heterogeneity in the capitalization of vegetation alone. In contrast, river proximity exhibits a substantially larger and statistically significant marginal effect, reflecting a clear premium for locations closer to the restored river corridor. The interaction term (blue–green synergy) is also positive, indicating that properties benefiting from both high vegetation quality and closer river access experience additional price gains beyond the sum of their independent effects. Although its confidence interval is wider, the positive central estimate supports the conceptual expectation that co-located blue and green features generate enhanced value. Together, these results demonstrate that the ecological and aesthetic benefits of integrated blue–green infrastructure are systematically capitalized into urban housing markets.
5.5. Quantile Regression Results
Table 12 presents quantile regression estimates that capture heterogeneity in the valuation of ecological amenities across the housing price distribution. Blue space exerts a consistently strong and significant influence at all quantiles, with coefficients declining from 0.275 at the 25th percentile to 0.213 at the median and 0.137 at the 75th percentile. This pattern indicates that water-based amenities are particularly valued in lower- and middle-priced market segments, where public ecological features may substitute for limited access to private green or recreational space. Green space alone remains insignificant across all quantiles, confirming that vegetation contributes meaningful value primarily when embedded within a hydrological setting. The interaction between green and blue space is positive and significant at each quantile (ranging from 0.125 to 0.179), demonstrating that integrated blue–green environments yield additional premiums beyond the independent effects of their components.
Table 12.
Quantile Regression Results.
Control variables behave as expected: building age consistently depresses prices, hospital accessibility raises prices in the lower and middle parts of the distribution, and other structural attributes show modest or mixed effects. Overall, the quantile results confirm that blue–green ecological integration is broadly capitalized into housing values, with especially pronounced benefits in the lower half of the market.
5.6. Economic Evaluation of Blue-Green River
To estimate the implicit economic value of ecological amenities, the coefficients from the hedonic pricing models are translated into percentage changes in property prices and then applied to the sample mean price of CNY 8417 per square meter. Given that the dependent variable is the logarithm of unit price, the estimated coefficients represent semi-elasticities. The percentage premium associated with each ecological attribute is therefore computed using the standard transformation:
where is the estimated coefficient for the variable of interest. This percentage premium is then multiplied by the average unit price to derive the marginal willingness to pay (MWTP) in monetary terms (CNY/m2).
These MWTP estimates reflect the incremental contribution of ecological amenities, as the model controls for a comprehensive set of structural and neighborhood characteristics—including building age, floor level, unit size, room composition, and access to schools and hospitals. By accounting for heterogeneity in construction quality and community configuration, the estimated premiums isolate the net capitalization effect of blue, green, and integrated blue–green spaces.
The coefficient for proximity to blue space (river) in the baseline specification is 0.169, which translates to a 18.41% premium:
For integrated blue–green zones, the updated coefficient of 0.165 corresponds to a 17.9% premium, equivalent to an MWTP of approximately CNY 1509/m2. By contrast, green-only zones remain statistically insignificant across all specifications, indicating that isolated green space does not generate a measurable capitalization effect in this context.
Overall, the revised estimates reveal clear differences in how ecological amenities are reflected in housing prices. Blue space alone yields a substantial and consistent premium of roughly CNY 1549/m2, underscoring the strong market value of water-based amenities. Integrated blue–green corridors also generate a sizeable premium of CNY 1509/m2, demonstrating the added value of combining hydrological and vegetative restoration within a unified ecological corridor. These results reinforce that the market monetization of environmental amenities is strongest when blue and green features are ecologically integrated, rather than when green space is provided in isolation.
6. Discussion
This study provides a comprehensive economic valuation of blue–green spaces generated by urban river restoration in Nanyang, China, through a hedonic pricing framework. The findings reveal that the presence and quality of these amenities are significantly monetized into property values, underscoring their substantial market worth.
6.1. Rethinking the Valuation of Urban Ecological Amenities
The results from this study offer strong support for the hypothesis that integrated blue–green infrastructure generates supra-additive economic value. Specifically, the finding that properties near co-located water bodies and vegetated zones command significantly higher price premiums than those near either feature in isolation highlights an important limitation in traditional hedonic frameworks. Much of the existing literature evaluates green and blue amenities separately [50], implicitly assuming that the value of environmental goods is linearly separable. By demonstrating that the NDVI—a proxy for vegetative cover—only exerts a statistically and economically significant effect on housing prices when spatially associated with river proximity, this study challenges the prevailing assumption. This evidence supports the conceptual insights from the ecosystem service literature, which posits that ecological functions operate through interdependent, context-specific, and nonlinear relationships.
Beyond proximity effects, visual access also contributes meaningfully to housing prices show in Table 13. Model (2) shows that properties with river views command a 7.3% premium (β = 0.073, p < 0.01). Park proximity alone is associated with a sizeable positive effect in both models. However, the interaction term between river views and park proximity is negative and significant (β = −0.129, p < 0.05), indicating that the price premium from river views is reduced when a property is also near a park. This suggests that overlapping visual amenities may generate diminishing marginal value, possibly due to visual saturation or reduced distinctiveness of each feature.
Table 13.
Interaction Effects between River Views and Park Proximity on Housing Prices.
Overall, the results indicate that while both river views and park proximity independently enhance housing prices, their combined effect is less than additive, underscoring the importance of balanced spatial composition in blue–green landscape design.
The implications of this complementarity are twofold. First, it suggests that ecological value is embedded not only in the quantity of environmental goods but in their spatial and functional configuration. Vegetation situated along riverbanks performs qualitatively different roles—from erosion control to microclimate regulation to recreational aesthetics—than vegetation dispersed in non-hydrological areas. Second, it indicates that household preferences are sensitive to such functional synergies, even if indirectly perceived. The housing market, as a decentralized aggregator of individual preferences, appears capable of recognizing and monetizing the joint value of riparian restoration. This provides empirical justification for a landscape-level approach to environmental valuation that incorporates spatial interdependence among ecological attributes.
6.2. Spatial Mediation: Distance, Visibility
The spatial configuration of ecological amenities—particularly proximity and visibility—plays a pivotal role in shaping their perceived and monetized value within urban housing markets. The results from the distance decay models provide compelling evidence that the economic benefits of blue–green infrastructure are highly localized, with steep attenuation beyond a critical spatial threshold. Specifically, price premiums diminish sharply beyond 400 m from the restored river, thereby suggesting that the value of ecological features is bounded by behavioral and perceptual accessibility.
This threshold aligns with widely cited benchmarks in urban design and environmental psychology. Numerous studies identify 400–500 m as the behavioral limit for daily-use amenities, including parks and greenways, representing an approximate 5-min walking distance. This spatial norm is not merely geographical but behavioral, reflecting the limits of regular, routine engagement with ecological features [51]. The housing market’s sensitivity to this threshold supports the hypothesis that ecological value is monetized most strongly when environmental benefits are perceived as part of the immediate residential experience.
In Table 14, the regression results indicate a clear distance-decay pattern in the capitalization of river amenities. In Model (1), the elasticity of housing prices with respect to river distance is −0.179, meaning that a 1% increase in distance corresponds to a 0.18% decrease in property value. The positive interaction between distance and park proximity suggests that nearby green space can partly mitigate this decline.
Table 14.
Distance Decay of River Restoration Benefits: Spatial Gradient and Interaction with Park Co-Location.
The distance-band models in (2) and (3) confirm a monotonic reduction in premiums with increasing distance. The 0–400 m band shows the strongest effect (0.422), followed by progressively smaller premiums in the 400–800 m (0.365), 800–1200 m (0.297), 1200–1600 m (0.187), and 1600–2000 m (0.087) bands. Interactions with park proximity remain positive and significant, highlighting the added value of co-located blue–green amenities.
The results show that river-related value premiums are highly localized, with benefits concentrated within the first 400 m and diminishing sharply beyond 1600 m. These findings align with Zhou [52], which emphasize strong spatial decay effects in proximity to restored or natural riverfronts.
Importantly, the co-location of green infrastructure—such as wetlands and parks—amplifies these proximity effects. Interaction terms between distance bands and park presence show that the compounded value of blue–green co-presence significantly exceeds the sum of individual components. This reinforces a growing body of literature emphasizing the synergistic value of integrated ecosystems, where proximity to hydrological features is enhanced by adjacent vegetative elements [53,54]. These findings offer a strong empirical basis for spatially optimized ecological design, where compactness and co-location produce higher economic and ecological returns.
Beyond physical distance, visual accessibility to ecological features exerts an independent and meaningful effect on housing values. Properties with direct views of the restored river command a premium of approximately 7.8%, as captured through visibility and landscape aesthetics, significantly influences real estate markets. This supports the broader theoretical claim that ecosystem services are not solely experienced through use, but also through perception [55,56].
However, the results also uncover a potential downside: the diminishing marginal utility of visual exposure in high-density ecological contexts. A negative and statistically significant interaction term between river views and park proximity suggests that when multiple visual amenities co-occur, perceptual saturation or landscape clutter may erode marginal value. The implication is clear: more is not always better when it comes to amenity design. Spatial planners must consider not just the quantity, but also the composition, spacing, and perceptual clarity of ecological interventions.
These findings affirm that the economic value of blue–green restoration is both spatially bounded and perception-dependent. Maximum value accrues within a 400-m proximity radius and is contingent upon visual access, co-location, and design distinctiveness. Importantly, these benefits are not confined to premium housing segments but extend across the price distribution, reinforcing the broad-based social and economic case for investing in integrated nature-based urban infrastructure.
6.3. Environmental Monetization Across the Market Spectrum
The quantile regression results provide important insights into how the benefits of ecological amenities are distributed across different segments of the housing market. Rather than uniformly influencing prices, the capitalization of blue–green attributes varies meaningfully along the price distribution. The strongest effects appear in the median and lower quantiles, indicating that mid-priced and relatively affordable housing segments exhibit the greatest sensitivity to environmental improvements. This pattern suggests that the value of ecological enhancements is not confined to high-income or luxury markets; instead, households in middle-income segments show comparatively higher marginal willingness to pay for improved river proximity and vegetation quality [57].
These findings challenge the common assumption that demand for urban ecological amenities is primarily driven by affluent households. Instead, they align with emerging evidence that public environmental goods often deliver their largest marginal benefits to households with fewer private substitutes, such as limited access to private green space or smaller dwelling size. In this sense, ecological restoration may function as an equalizing public good—one whose benefits extend prominently to middle-income residents.
From a distributional perspective, this heterogeneity carries meaningful implications. The fact that blue–green amenities are most strongly valued in mid-market segments suggests that integrated ecological restoration projects have the potential to enhance both aggregate well-being and the welfare of non-elite households, provided that these populations retain access to the improved areas. At the same time, the mechanism that generates property value gains—the capitalization of environmental quality—can also raise the risk of price appreciation–induced displacement, particularly if restoration occurs in areas with already fragile housing affordability.
This dual outcome underscores the importance of linking ecological investment with proactive housing and land-use policies. Strategies such as inclusionary zoning, mixed-income development requirements, subsidized housing near restored corridors, and long-term affordability protections can help ensure that the benefits of ecological improvements are broadly shared rather than concentrated. Without such measures, restoration initiatives—despite their environmental and social merits—may inadvertently contribute to exclusionary outcomes.
The quantile regression results demonstrate that the economic benefits of integrated blue–green infrastructure are neither uniform nor regressive. Instead, they reveal a nuanced distributional pattern in which middle-income households benefit disproportionately, highlighting both the opportunities and the governance responsibilities associated with ecological urban transformations.
6.4. Policy Implications
This study provides several implications for urban ecological planning and environmental management. First, the consistent premiums associated with integrated blue–green spaces highlight the value of coordinated planning that combines hydrological restoration with vegetation enhancement. Rather than treating water and green infrastructure as separate systems, planners should prioritize their spatial co-location—such as vegetated riverbanks, wetlands adjacent to rivers, and unobstructed visual corridors—to maximize ecological functionality and user experience. The strong complementary effects observed in the hedonic models suggest that such integrated designs can produce higher aggregate social and economic returns than single-feature interventions.
Second, the results indicate that the benefits of ecological amenities are highly localized. Distance-decay patterns and robustness tests point to a meaningful threshold within approximately 400 m of restored riverfronts, beyond which premiums fall sharply. This provides a practical guideline for prioritizing ecological investment: siting new blue–green corridors or enhancing existing ones where they can serve the greatest number of residents within a walkable catchment. Ensuring that these corridors remain visually accessible—e.g., through view preservation, height regulations, and open-edge design—can further reinforce their perceived and monetized value.
Third, the quantile regression results show that lower- and middle-priced market segments derive particularly strong value from blue and blue–green amenities, suggesting that ecological improvements can contribute to welfare gains among households with more limited private access to nature. At the same time, higher amenity premiums may introduce risks of green gentrification if rising housing prices displace lower-income residents. To align ecological restoration with social equity goals, planners may consider pairing blue–green investments with affordability protections, such as inclusionary zoning, rental support near restored corridors, or the designation of mixed-income housing adjacent to major ecological interventions. Such measures can help ensure that the social benefits of ecological restoration are broadly shared rather than disproportionately captured by higher-income groups.
6.5. Limitations and Future Research
Several limitations should be noted. First, the reliance on a single year of cross-sectional transactions limits causal inference and temporal generalization; the results reflect spatial capitalization rather than changes over time. Future work using panel or quasi-experimental designs would strengthen causal claims. Second, although spatial diagnostics and SEM were implemented, the analysis is constrained by incomplete geocoded data. The spatial weights matrix is based on rook contiguity, preventing finer spatial assessments such as hotspot or residual surface mapping. Third, potential endogeneity between environmental quality and housing prices cannot be fully dismissed. While NDVI and river-related attributes are largely shaped by municipal planning, unobserved preference sorting may still bias estimates. Without instruments or longitudinal data, the findings should be interpreted as correlational.
Despite these constraints, the analysis offers consistent, spatially robust evidence that blue–green infrastructure is capitalized into housing prices. Future research incorporating richer temporal and spatial data will further strengthen the evidence base for ecological planning and urban design.
7. Conclusions
This study quantifies the economic value of blue–green spaces created through river restoration in Nanyang and demonstrates that these ecological improvements are significantly capitalized into residential property prices. The results provide clear empirical evidence that the housing market recognizes and monetizes ecological amenities, underscoring the importance of integrating blue–green infrastructure into sustainable urban development strategies.
The analysis combines a theoretically grounded hedonic framework with spatially explicit environmental indicators and flexible econometric techniques, including quantile regressions. This methodological approach enables the identification of both average and distributional patterns of value formation in a rapidly urbanizing inland city. Across specifications, properties located near integrated blue–green corridors exhibit the highest premiums, exceeding those associated with vegetation or river proximity alone. These findings underscore the synergistic ecological benefits that arise when hydrological and vegetative features are planned as interconnected systems.
At the same time, the distributional results call for a more cautious and equity-focused interpretation. The quantile regressions indicate that blue and blue–green amenities are most strongly valued in lower- and middle-priced market segments—households that may benefit substantially from improved public environmental quality but are also more vulnerable to rising housing costs. Without complementary housing policies, amenity-driven price increases could contribute to “green gentrification” and reinforce affordability pressures near restored corridors. Ensuring equitable access to ecological benefits may therefore require pairing restoration projects with inclusionary zoning, affordable housing provisions, or rent-stabilization measures.
The findings also have clear implications for urban planning. Spatial proximity and visual accessibility emerge as important pathways through which ecological amenities are monetized. Homes located within walkable distance of the restored river corridor, as well as those with clear views of blue–green landscapes, experience measurable price advantages. These patterns suggest that the usability and perceptual quality of ecological spaces—not merely their existence—play a central role in shaping their economic and social value. For planners, this underscores the importance of maintaining continuous public access along riverfronts, protecting visual sightlines through height and setback regulations, and designing compact, interconnected blue–green networks that maximize both ecological performance and everyday accessibility.
Overall, this study contributes to the growing evidence on the economic returns of nature-based solutions and provides a replicable framework for evaluating ecological investments in urban settings. As cities increasingly rely on ecological infrastructure to address environmental degradation and enhance quality of life, the valuation approach developed here offers a practical, data-driven tool to inform planning and policy decisions while emphasizing the need for socially inclusive implementation.
Funding
This research received no external funding.
Institutional Review Board Statement
Not applicable.
Informed Consent Statement
Not applicable.
Data Availability Statement
The raw data supporting the conclusions of this article will be made available by the authors on request.
Conflicts of Interest
The author declares no conflicts of interest.
References
- Gómez-Baggethun, E.; Barton, D.N. Classifying and valuing ecosystem services for urban planning. Ecol. Econ. 2013, 86, 235–245. [Google Scholar] [CrossRef]
- Lundy, L.; Wade, R. Integrating sciences to sustain urban ecosystem services. Prog. Phys. Geogr. Earth Environ. 2011, 35, 653–669. [Google Scholar] [CrossRef]
- Akbari, S.; Polyakov, M.; Iftekhar, M.S. Capitalised nonmarket benefits of multifunctional water-sensitive urban infrastructure: A case of living streams. Aust. J. Agric. Resour. Econ. 2023, 67, 524–540. [Google Scholar] [CrossRef]
- Li, X.; Chen, W.Y.; Cho, F.H.T.; Lafortezza, R. Bringing the vertical dimension into a planar multilevel autoregressive model: A city-level hedonic analysis of homebuyers’ utilities and urban river attributes. Sci. Total Environ. 2021, 772, 145547. [Google Scholar] [CrossRef]
- Chen, W.Y.; Li, X. Impacts of urban stream pollution: A comparative spatial hedonic study of high-rise residential buildings in Guangzhou, south China. Geogr. J. 2018, 184, 283–297. [Google Scholar] [CrossRef]
- Gong, X.; Chang, C.-C. Monetized estimates of the ecosystem service value of urban blue and green infrastructure and analysis: A case study of Changsha, China. Sustainability 2022, 14, 16092. [Google Scholar] [CrossRef]
- Chen, H.; Li, J.; Wang, Y.; Ni, Z.; Xia, B. Evaluating trade-offs in ecosystem services for blue–green–grey infrastructure planning. Sustainability 2024, 16, 203. [Google Scholar] [CrossRef]
- Tate, C.; Tran, N.; Longo, A.; Barry, J.; Taylor, T.; O’Neill, C.; Hunter, R. Economic evaluations of urban green and blue space interventions: A scoping review. Ecol. Econ. 2024, 222, 108217. [Google Scholar] [CrossRef]
- Peng, C.; Xiang, Y.; Chen, L.; Zhang, Y.; Zhou, Z. The impact of the type and abundance of urban blue space on house prices: A case study of eight megacities in China. Land 2023, 12, 865. [Google Scholar] [CrossRef]
- Huang, T.; He, Q.; Yang, D.; Ouyang, X. Evaluating the Impact of Urban Blue Space Accessibility on Housing Price: A Spatial Quantile Regression Approach Applied in Changsha, China. Front. Environ. Sci. 2021, 9, 696626. [Google Scholar] [CrossRef]
- Wei, C.; Fu, M.; Wang, L.; Yang, H.; Tang, F.; Xiong, Y. The research development of hedonic price model-based real estate appraisal in the era of big data. Land 2022, 11, 334. [Google Scholar] [CrossRef]
- Zhu, J.; Liu, C.; Yu, C.; Du, J. An assessment of how street view imagery and remote-sensing data of green and blue spaces can explain variations in housing prices: A case study in Suzhou, China. Remote. Sens. Lett. 2024, 15, 1209–1217. [Google Scholar] [CrossRef]
- Sunita Kumar, D.; Shekhar, S. Developing an approach for assessing urban blue-green spaces towards sustainable urban growth through retrospective cyber metrics analysis of operational estimations approaches. J. Landsc. Ecol. 2022, 14, 12–51. [Google Scholar] [CrossRef]
- Bockarjova, M.; Botzen, W.J.W.; Koetse, M.J. Economic valuation of green and blue nature in cities: A meta-analysis. Ecol. Econ. 2020, 169, 106480. [Google Scholar] [CrossRef]
- Sander, H.A.; Zhao, C. Urban green and blue: Who values what and where? Land Use Policy 2015, 42, 194–209. [Google Scholar] [CrossRef]
- Engstrom, G.; Gren, A. Capturing the value of green space in urban parks in a sustainable urban planning and design context: Pros and cons of hedonic pricing. Ecol. Soc. 2017, 22. [Google Scholar] [CrossRef]
- Panduro, T.E.; Veie, K.L. Classification and valuation of urban green spaces—A hedonic house price valuation. Landsc. Urban Plan. 2013, 120, 119–128. [Google Scholar] [CrossRef]
- Kuroda, Y.; Sugasawa, T. The value of scattered greenery in urban areas: A hedonic analysis in Japan. Environ. Resour. Econ. 2023, 85, 523–586. [Google Scholar] [CrossRef]
- McCord, M.; McCord, J.; Lo, D.; Brown, L.; MacIntyre, S.; Squires, G. The value of green and blue space: Walkability and house prices. Cities 2024, 154, 105377. [Google Scholar] [CrossRef]
- Li, X.; Chen, W.Y.; Hu, F.Z.Y.; Cho, F.H.T. Homebuyers’ heterogeneous preferences for urban green–blue spaces: A spatial multilevel autoregressive analysis. Landsc. Urban Plan. 2021, 216, 104250. [Google Scholar] [CrossRef]
- Tang, Y.; Xiao, W.; Yuan, F. Evaluating objective and perceived ecosystem service in urban context: An indirect method based on housing market. Landsc. Urban Plan. 2025, 254, 105245. [Google Scholar] [CrossRef]
- Chen, H.; Hu, L.; Liu, Z.; Chen, B. Spatial heterogeneity and interaction effect of urban blue and green spaces on housing prices. Int. J. Strateg. Prop. Manag. 2024, 28, 302–319. [Google Scholar] [CrossRef]
- Wu, C.; Du, Y.; Li, S.; Liu, P.; Ye, X. Does visual contact with green space impact housing prices? An integrated approach of machine learning and hedonic modeling based on the perception of green space. Land Use Policy 2022, 115, 106048. [Google Scholar] [CrossRef]
- Wu, Y.; Liu, X.; Li, M.; Xi, H.; Xu, M.; Ou, W.; Huang, C. The nonlinear impact of urban blue-green space landscape pattern on residential housing price in a new first-tier city of China. Discov. Cities 2024, 1, 30. [Google Scholar] [CrossRef]
- Dell’Anna, F.; Bravi, M.; Bottero, M. Urban Green infrastructures: How much did they affect property prices in Singapore? Urban For. Urban Green. 2022, 68, 127475. [Google Scholar] [CrossRef]
- Chen, W.Y. Environmental externalities of urban river pollution and restoration: A hedonic analysis in Guangzhou (China). Landsc. Urban Plan. 2017, 157, 170–179. [Google Scholar] [CrossRef]
- Gerner, N.V.; Nafo, I.; Winking, C.; Wencki, K.; Strehl, C.; Wortberg, T.; Niemann, A.; Anzaldua, G.; Lago, M.; Birk, S. Large-scale river restoration pays off: A case study of ecosystem service valuation for the Emscher restoration generation project. Ecosyst. Serv. 2018, 30, 327–338. [Google Scholar] [CrossRef]
- Wen, H.; Xiao, Y.; Zhang, L. Spatial effect of river landscape on housing price: An empirical study on the Grand Canal in Hangzhou, China. Habitat Int. 2017, 63, 34–44. [Google Scholar] [CrossRef]
- Dai, D.; Brouwer, R.; Lei, K. Measuring the economic value of urban river restoration. Ecol. Econ. 2021, 190, 107186. [Google Scholar] [CrossRef]
- Lewis, L.Y.; Bohlen, C.; Wilson, S. Dams, dam removal, and river restoration: A hedonic property value analysis. Contemp. Econ. Policy 2008, 26, 175–186. [Google Scholar] [CrossRef]
- Zhou, Y.; Li, J.; Li, S.; Chen, Q. Measuring the premium effect of marine ecological restoration on housing prices: A quasi-experimental design based on real estate transaction data. J. Nat. Conserv. 2025, 86, 126916. [Google Scholar] [CrossRef]
- Lewis, L.Y.; Landry, C.E. River restoration and hedonic property value analyses: Guidance for effective benefit transfer. Water Resour. Econ. 2017, 17, 20–31. [Google Scholar] [CrossRef]
- Dong, Y.; Lazareva, E.I. Willingness to pay for urban inland river restoration: Case of Nanyang, China. Water Econ. Policy 2023, 9, 2340010. [Google Scholar] [CrossRef]
- Ting Cho, F.H.; Chen, W.Y.; Hua, J. Validating citizens’ preferences for restoring urban riverscape: Discrete choice experiment versus analytical hierarchy process. J. Water Resour. Plan. Manag. 2021, 147, 05021005. [Google Scholar] [CrossRef]
- Yang, S.; Zhou, L.; Zhang, P.; Fang, S.; Li, W. Evaluating the spillover value of ecological products from urban rivers eco-restoration: A quasi-natural experiment in Wuhan, China. Ecol. Indic. 2023, 156, 111095. [Google Scholar] [CrossRef]
- Li, W.; Saphores, J.-D.M.; Gillespie, T.W. A comparison of the economic benefits of urban green spaces estimated with NDVI and with high-resolution land cover data. Landsc. Urban Plan. 2015, 133, 105–117. [Google Scholar] [CrossRef]
- Patino, J.E.; Duque, J.C. A review of regional science applications of satellite remote sensing in urban settings. Comput. Environ. Urban Syst. 2013, 37, 1–17. [Google Scholar] [CrossRef]
- Jiao, L.; Xu, G.; Jin, J.; Dong, T.; Liu, J.; Wu, Y.; Zhang, B. Remotely sensed urban environmental indices and their economic implications. Habitat Int. 2017, 67, 22–32. [Google Scholar] [CrossRef]
- Mei, Y.; Zhao, X.; Lin, L.; Gao, L. Capitalization of urban green vegetation in a housing market with poor environmental quality: Evidence from Beijing. J. Urban Plann. Dev. 2018, 144, 05018011. [Google Scholar] [CrossRef]
- Rosen, S. Hedonic Prices and Implicit Markets: Product Differentiation in Pure Competition. J. Polit. Econ. 1974, 82, 34–55. [Google Scholar] [CrossRef]
- MEA. Ecosystems and Human Well-Being: Wetlands and Water Synthesis; World Resources Institute: Washington, DC, USA, 2005. [Google Scholar]
- Voskamp, I.M.; Van de Ven, F.H.M. Planning support system for climate adaptation: Composing effective sets of blue-green measures to reduce urban vulnerability to extreme weather events. Build. Environ. 2015, 83, 159–167. [Google Scholar] [CrossRef]
- Tyrväinen, L.; Miettinen, A. Property prices and urban forest amenities. J. Environ. Econ. Manag. 2000, 39, 205–223. [Google Scholar] [CrossRef]
- Zhang, J.; Li, H.; Lin, J.; Zheng, W.; Li, H.; Chen, Z. Meta-analysis of the relationship between high quality basic education resources and housing prices. Land Use Policy 2020, 99, 104843. [Google Scholar] [CrossRef]
- Gu, Z.; Tang, M.; Luo, X.; Feng, J. Examination of the impacts of hospital accessibility on housing prices: Heterogeneity across attributes, space and price quantiles. J. Hous. Built Environ. 2024, 39, 179–200. [Google Scholar] [CrossRef]
- Giannico, O.V.; Addabbo, F.; Catino, F.; Bisceglia, L.; Minerba, S.; Mincuzzi, A.; Sardone, R. The mortality impacts of implementing the 3-30-300 greenness rule in Taranto, southern Italy. Ecol. Indic. 2025, 178, 113895. [Google Scholar] [CrossRef]
- Jayalath, T.A.; Lloyd-Smith, P. Water quality and property values: A meta-analysis and Canadian national benefit assessment. Can. Water Resour. J./Rev. Can. Ressour. Hydr. 2025, 1–22. [Google Scholar] [CrossRef]
- Sander, H.A.; Polasky, S. The value of views and open space: Estimates from a hedonic pricing model for ramsey county, minnesota, USA. Land Use Policy 2009, 26, 837–845. [Google Scholar] [CrossRef]
- Anselin, L. Spatial Econometrics: Methods and Models; Springer: Dordrecht, The Netherlands, 1988. [Google Scholar]
- Lynch, M.; Spencer, L.H.; Tudor Edwards, R. A systematic review exploring the economic valuation of accessing and using green and blue spaces to improve public health. Int. J. Environ. Res. Public Health 2020, 17, 4142. [Google Scholar] [CrossRef] [PubMed]
- Schipperijn, J.; Cerin, E.; Adams, M.A.; Reis, R.; Smith, G.; Cain, K.; Christiansen, L.B.; Dyck Dvan Gidlow, C.; Frank, L.D.; Mitáš, J.; et al. Access to parks and physical activity: An eight country comparison. Urban For. Urban Green. 2017, 27, 253–263. [Google Scholar] [CrossRef]
- Zhou, Y.; Li, S.; Li, J. Measuring the capitalization effects of coastal landscapes: Evidence from real estate market in Qingdao, China. J. Hous. Built Environ. 2025, 40, 1037–1060. [Google Scholar] [CrossRef]
- Agudelo, C.A.R.; Bustos, S.L.H.; Moreno, C.A.P. Modeling interactions among multiple ecosystem services. A critical review. Ecol. Model. 2020, 429, 109103. [Google Scholar] [CrossRef]
- Gurnell, A.M.; Bertoldi, W.; Corenblit, D. Changing river channels: The roles of hydrological processes, plants and pioneer fluvial landforms in humid temperate, mixed load, gravel bed rivers. Earth Sci. Rev. 2012, 111, 129–141. [Google Scholar] [CrossRef]
- Nie, X.; Wang, Q.; Wu, J.; Wang, H.; Chen, Z.; He, J. Effectively enhancing perceptions of cultural ecosystem services: A case study of a karst cultural ecosystem. J. Environ. Manag. 2022, 315, 115189. [Google Scholar] [CrossRef]
- Riechers, M.; Barkmann, J.; Tscharntke, T. Perceptions of cultural ecosystem services from urban green. Ecosyst. Serv. 2016, 17, 33–39. [Google Scholar] [CrossRef]
- Navarrete-Hernandez, P.; Laffan, K. The impact of small-scale green infrastructure on the affective wellbeing associated with urban sites. Sci. Rep. 2023, 13, 9687. [Google Scholar] [CrossRef] [PubMed]


Disclaimer/Publisher’s Note: The statements, opinions and data contained in all publications are solely those of the individual author(s) and contributor(s) and not of MDPI and/or the editor(s). MDPI and/or the editor(s) disclaim responsibility for any injury to people or property resulting from any ideas, methods, instructions or products referred to in the content. |
© 2025 by the author. Licensee MDPI, Basel, Switzerland. This article is an open access article distributed under the terms and conditions of the Creative Commons Attribution (CC BY) license (https://creativecommons.org/licenses/by/4.0/).