Abstract
Context: Efforts to understand sustainability behavior have developed significantly over the past few decades. To date, this research has primarily focused on directly observable behaviors (e.g., littering, recycling, and energy use). However, a more theoretical understanding of sustainability behavior needs to include its unobservable or latent antecedents. Problem: As a result, valid and reliable measures of these latent constructs are required to build a theoretical foundation for the development of relevant sustainability social science. We discuss the need for such a targeted, attitudinal measure, given its connection to observable behavior. Objective: We aimed to develop such a measure through a series of studies. Results: We present an 11-item measure of a general sustainability attitude that includes ecological, economic, and social elements. We conclude with a discussion of the utility of the Sustainability Attitude Scale.
1. Introduction
A better understanding of sustainable behavior is critical, given the immediate and pervasive threats associated with climate change. Research regarding sustainability has developed considerably in recent decades, expanding the range of topics that have been studied, the methodologies used, theories, and disciplines themselves. Given the broad, multidimensional nature of sustainability [1], these developments are appropriate and require necessary conceptual consistency between theory and subsequent research. Investigations of overt sustainable behavior (e.g., recycling, and waste reduction) continue to expand from descriptive studies [2] to those examining predictive [3] and causal factors related to sustainable behavior [4]. However, less is known about the roles of latent constructs (e.g., beliefs, attitudes, and personal emotions) in sustainable behavior. Although more research involving latent constructs is occurring [5,6,7], further exploration of the roles of latent constructs in sustainability social science is justified given their role as antecedents to behavior. As with any growing area of research, valid and reliable measures of phenomena must be developed. Presently, few measures of sustainability attitudes exist for researchers to use. In this article, we put forth a measure of sustainability attitudes, the Sustainability Attitudes Scale, consistent with perspectives of sustainability that include ecological, economic, and social elements. In addition to presenting the validity and reliability of the scale, we demonstrate its utility in sustainability social scientific research.
1.1. Measuring Attitudes
Attitudes are an important component of behavior because they involve forming a negative or positive evaluation of a phenomenon [8]. People consider these evaluations in various ways when deciding to behave. Yet, given the influence of situational factors, sustainability behaviors in different contexts involve both internal and external factors. Thus, understanding sustainability behaviors requires studying both cognitive and situational components. Studying external factors typically involves greater direct observation and experimental control than cognitive factors. Nonetheless, studying latent constructs, while complex, is necessary and feasible through valid and reliable measures [9] in order to more fully understand sustainability behavior.
Attitudes are commonly conceptualized to have three components: behavioral, affective, and cognitive [8]. The behavioral component involves overt behaviors. The affective element involves emotional evaluation, while the cognitive component includes knowledge, beliefs, and memories for the phenomenon in question. While being individual constructs, these components do interact and are related through experience with the phenomenon. The more congruent these components are, the stronger and more consistent the attitude is. Additionally, the nature of these elements influences how researchers observe and manipulate them. The behavioral component allows for more direct measurement of overt behaviors. The affective and cognitive components, however, require indirect measures.
For example, when studying energy use, one may choose to measure a person’s use of electricity in their home. Measuring kilowatt–hour consumption would be relatively straightforward via electric meters. Understanding this person’s electrical use behavior, however, would require additional research because the person’s attitude toward electrical consumption could influence their overall behavior. Thus, one could measure electricity-related behaviors (e.g., using energy-efficient appliances, using natural lighting) to assess the behavioral component of the person’s attitude. A more complete understanding of the overall behavior would involve measuring the person’s emotional evaluation and beliefs about electricity use. These steps would require social science-based measures that would assess these more subtle aspects of energy consumption.
Measuring attitudes and other latent constructs is nuanced because of their nature. Researchers have been studying latent constructs systematically for well over a century (e.g., Hermann Ebbinghaus’ memory research) [10]. Measuring attitudes has a strong foundation, and the methodology for doing so has been refined over the years. Measuring latent constructs typically involves self-report, yet well-constructed measures often are based on observable behaviors. With respect to attitudinal measures, the items in the measure quite often are questions or statements to which a person indicates the degree to which the statement matches her or his belief, emotion, or behavior. Greater conceptual clarity and precision of these statements result in more accurate responses from respondents for two reasons [11]. First, the statements more closely match what you want to measure, resulting in greater validity of the measure. Second, the statements decrease confusion for the respondent, resulting in greater validity and reliability because consistency in understanding from person to person is greater. Although the direct measurement of attitudes would be ideal, doing so at this point is not feasible. Nonetheless, gathering valid and reliable indirect observations can contribute important knowledge to understanding other overt behaviors.
1.2. Sustainability Attitudes
The need to measure attitudes about sustainability, as with any phenomenon, involves the conceptualization of sustainability itself. As is often true in emerging fields of study, multiple definitions of sustainability exist partly because researchers from various disciplines examine sustainability. Conceptual variability can impede scientific progress [11,12] because researchers could be using similar language while technically studying different constructs, or vice versa. Precisely identifying and defining the phenomenon of interest is crucial to clear communication.
The process of defining sustainability has taken numerous necessary turns [1,13]. The current authors have encouraged the sustainability community to accept Brundtland Report’s [14] broader conceptualization of sustainability [15]. This conceptualization includes three related domains of sustainability: ecological, economic, and social well-being [14]. This approach, which is similar to Elkington’s [16] triple-bottom-line concept of sustainability, inherently includes major factors that would influence the longevity of a system, decision, or policy. Comprehensive measures of sustainability from this perspective, therefore, ought to tap into each of the three domains.
The triple-bottom-line perspective [16] offers a conceptual focus for developing a measure of sustainability attitudes for those who subscribe to this view of sustainability. Other views of sustainability include more domains [17] and would require attitudinal measures that align with the additional domains. Although not definitive, the triple-bottom-line perspective does find acceptance as a conceptual model to understand sustainable behavior in contexts ranging from businesses [17,18,19] to education [20]. As such, researchers ascribing to the triple-bottom-line perspective would benefit from having a corresponding measure of sustainability attitudes.
The process of measuring one’s attitude towards such a broad, multi-dimensional concept as sustainability, whose precise definition lacks widespread consensus is analogous to the development of environmental attitudinal measures. Research began with understanding the basic connection between attitudes and behavior, with the assumption that more positive attitudes towards the environment lead to pro-environmental behavior. These attitudes were believed to be formed primarily through positive personal experiences [21]. Attempts to explain the antecedents to pro-environmental behavior eventually clarified the distinction between an overall “global environmental attitude,” versus a “specific environmental attitude,” an attitude towards a specific environmental-related behavior [11]. Through the widespread application of the Theory of Planned Behavior [22] to environmental contexts, items measuring attitudes that were specific to the behavior of interest were largely found to better predict behavioral outcomes. However, given that specific attitudinal scales are necessarily created on an ad hoc basis with little theoretical guidance to fit the behavioral context, a general environmental attitudes scale was still considered valuable [23]. This rationale has led to our current effort to create a measure of one’s “global sustainability attitude” that is a valid operationalization of the broader concept of sustainability and can be used to build and test sustainability-related theories that integrate one’s attitudes with greater theoretical accuracy.
One existing scale that has been commonly used to measure sustainability attitudes is the New Ecological Paradigm [24,25,26]. Dunlap and colleagues’ focus with this scale is at a worldview (paradigmatic) level. Even at the worldview level, cognitive and value-based beliefs–contributors to personal attitudes—are in play. Thus, the New Ecological Paradigm (NEP) and its revised version, the New Ecological Paradigm Scale [27], have been widely used as measures of sustainability attitudes [28]. Both measures are efficient, straightforward, reliable, and valid measures of an environmental mindset that have contributed tremendously to studying latent mechanisms connected to other sustainability behaviors. Yet, the NEP’s contributions center, by design, on only one of the three domains of sustainability.
Using the Brundtland Report’s conceptualization of sustainability, the NEP would not adequately measure attitudes pertaining to the economic and social well-being domains of sustainability. The lack of attitudinal measures for these other domains led us to create a measure of sustainability attitudes that addresses an integrated and comprehensive sustainability attitude. Although others have argued to use existing measures, such as the NEP Scale or the Environmental Concern Scale given their overlap in measurement [29], a measure conceptually consistent with the Brundtland Report would allow researchers to examine different components of sustainability attitudes, which may relate differently to a variety of other sustainability behaviors. Here, we build on our past efforts [15] to support the development and refinement of more sustainable social science theory.
1.3. Current Studies
The current paper describes the development of a new measure, the Sustainability Attitude Scale (SAS), that captures one’s comprehensive sustainability attitude comprising ecological, economic, and social well-being elements. This rigorous, multi-step validation process was designed to directly follow Boateng et al.’s best practices for scale development and validation [30]. See Figure 1 for a conceptual diagram of this research. Study One addresses the construct and content validity issues in previous attempts to develop the SAS [31]. This process included refining the pool of possible items and testing these with a more representative sample, which provided the necessary statistical power to create a valid and reliable measure.
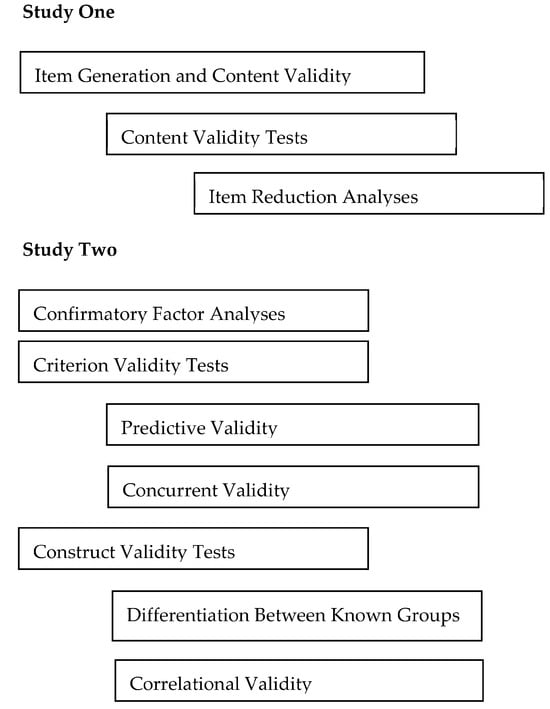
Figure 1.
Methodology Outline for Studies One and Two.
Study Two tests those items on a different population and addresses an important question regarding attitudes: How well do they predict behavior? Attitudes have long been viewed as related to a person’s personality and behavior and should be associated with actual behaviors. Nonetheless, attitudes do not completely predict behavior. This disconnect is due to the multivariate nature of any context that contains more factors than one’s attitudes. As others have argued [32,33], behavior is an interaction between the individual and her or his multifaceted environment. Predicting behavior from attitudes depends on a variety of factors, ranging from the clarity of the situation and accessibility of the attitude [34] to how strongly and consistently the attitude is held [35] to the relevant social norms and real or perceived behavioral barriers to the behavior [22]. Given variability in these and other constructs, it is unlikely that an attitude would completely account for or predict a behavior. In other words, the attitude itself can never do all the work to predict a behavior, but it remains an important factor in better understanding targeted overt behaviors.
The primary aim of this research was to develop a succinct measure of sustainability attitudes consistent with the triple-bottom line view of sustainability offered by the Brundtland Report [14]. Ideally, such a measure would assess individual ecological, economic, and social well-being sustainability attitudes with as few items as possible while maintaining strong construct validity.
2. Study One
2.1. Method
2.1.1. Item Generation and Content Validity
A fundamental aspect of scale construction is content validity—in which the items contained in the measure accurately reflect the construct being measured [30]. With the triple-bottom line view of sustainability as the theoretical framework, a team of ten experts representing the ecological, economic, and social domains created a broad initial question pool of 74 items representing the three domains of sustainability and their intersections. These items were then coded and grouped by their domain of focus. Items found during this coding process to be repetitive or overly detailed were removed, reducing the pool down to 58 Likert-type questions. Items were set on a six-point scale ranging from 1, strongly disagree, to 6, strongly agree. A six-point scale should allow for enough sensitivity to detect the range and variability of people’s responses. An even-numbered scale was employed to avoid having a neutral or middle point for a scale, an option that rarely reveals a person’s inclination to agree or disagree at least somewhat to a statement. Higher scores on the scale indicate more positive sustainability attitudes. The interdisciplinary team then assessed the fit of the 58 items for the three domains of sustainability and their intersections. Interviewed independently, the judges concluded the items accurately reflected the constructs in question. Further content validity was needed; however, after item extraction to ensure that the remaining items still represented the theoretical domains.
2.1.2. Survey Administration
The 58 items were sent via an electronic survey administered to a sample of undergraduate students enrolled at Michigan State University. Ten thousand randomly selected undergraduate students were recruited to participate in the survey via email. Of that number, nearly 14% completed the entire survey. As the SAS pool of items was presented in a random order, and respondents dropped out of the survey at different times, total responses varied from 1363 to 1398 on an item-by-item basis. This sample size exceeds the recommended sample sizes for item extraction [36]. The demographic characteristics of this sample mirrored those of the campus overall on age, race, ethnicity, gender, and year in school.
2.2. Results: Item Reduction Analyses
In order to evaluate the proposed items, all 58 items were subjected to an Item Response Theory-driven two-parameter latent variable analysis using the weighted least squares estimator with mean and variance correction. The goal of this step was to choose the minimum number of items that provided thematic coverage across three sustainability domains. Additionally, these items should discriminate across various levels of the underlying construct (theta) of a general sustainability attitude. Items were iteratively cut as a function of both statistical and substantive concerns until four items from each of the three sustainability domains remained. The resulting 12 item scale fit moderately to the data (CFI = 0.90; TLI = 0.87; WRMR = 2.21; RMSEA = 0.11) and provided good evidence of coverage of the latent construct and discrimination among levels of theta (see Table 1).

Table 1.
Preliminary Sustainability Attitudes Scale.
Given concerns about the distinctiveness of the three sustainability domains, a second model was estimated in which the twelve items were modeled as indicators of separate latent factors. The model fit well to the data (CFI = 0.96; TLI = 0.95; WRMR = 1.43; RMSEA = 0.08) but revealed strong correlations among the latent factors (RSocial.Economic = 0.61; RSocial.Environmental = 0.96; REconomic.Environmental = 0.63).
2.3. Discussion
The focus of Study One was to select items for an efficient measure of sustainability attitudes based on the three-domain model from the Brundtland Report [14]. The resulting preliminary measure has good internal consistency for each of the three domains: ecological (Cronbach’s alpha = 0.77), economic (Cronbach’s alpha = 0.74), and social (Cronbach’s alpha = 0.78). It is worth noting that although all of the items loaded significantly on their hypothesized factor, the loadings for the economic factor indicators—which were reverse scored—were much smaller. Although the good fit of the overall model implies that scoring each of these dimensions separately to provide a more nuanced indication of a person’s sustainability attitudes is defensible, we caution against this approach because of the high correlations among the three factors. Instead, the results suggest that a single dimension more efficiently explains the 12 items (Cronbach’s alpha = 0.82). A single-dimension approach will be more appropriate especially when the measure is used in analyses that depend on the identification of unique variance (e.g., regression).
By utilizing item response theory we were able to reduce the number of items in the scale, removing those that discriminated equally well between respondents with high and low sustainability attitudes. When removing items in this manner we balanced two important criteria. Our first criterion was theoretical accuracy. To this end, we strove to balance the overall content of the items, ensuring that environmental, economic, and social domains were covered in the final scale. This resulted in a 12-item scale consisting of four environmental, four economic, and four social items. The second criterion which guided our decisions about reducing items was to increase the breadth of the scale, ensuring that those with very high and very low levels of sustainability attitudes can be accurately distinguished. To this end, we evaluated each item’s difficulty. Because the scale was scored with six response options (strongly disagree to strongly agree), each item generated five thresholds which represent the point on the scale of the latent trait at which the odds an individual would select the higher and lower category were equivalent. We therefore selected items with generally high values (suggesting that they discriminate well among individuals high in sustainability) as well as items with generally low thresholds (suggesting that they discriminate well among individuals low in sustainability).
These two criteria were often at odds with each other, and in these instances, we favored theoretical accuracy over response diversity. This decision is evident in the descriptive results, with a mean of 4.68 on a six-point scale, and a standard deviation of 0.63. While we are confident the scale accurately captures attitudes towards all major aspects of a conceptualization of sustainability that includes social, ecological, and economic domains, the items themselves may be a bit challenging for respondents to disagree to given increasing awareness of sustainability issues.
3. Study Two
The purpose of Study Two was to test the dimensional structure and validity of the preliminary 12-item SAS. Following the best practices of scale development and validation [30], we designed this study to facilitate a test of criterion validity and two tests of construct validity (correlation analysis and differentiation by known groups). In order to address the potential impact of negatively worded items, the four economic items were rewritten such that agreement indicated greater sustainability attitudes (see Table 2).
Table 2.
The final 11-item Sustainability Attitudes Scale (SAS) tested in a single factor CFA model. All items are set on a 1 (strongly disagree) to 6 (strongly agree) scale.
3.1. Method
3.1.1. Survey Administration
This study again used an online survey that was administered to a different sample of undergraduate students enrolled at Michigan State University. As before, recruitment emails containing a link to the survey were sent out to 10,000 randomly selected students who were not part of the first study. Nearly 17% of those contacted completed the entire survey, which contained the SAS, the New Ecological Paradigm (NEP), and items measuring sustainability behaviors, political ideology, and demographics. Again, the demographic characteristics of this sample mirrored that of the campus overall on age, race, ethnicity, and year in school.
3.1.2. Determining Factor Structure
Determining factor structure helps identify a measure’s latent structures [30] which then allows for further tests of validity. Data were analyzed using latent measurement models in Mplus version 6 in two steps. In the first step, we tested the hypothesized factor structure of the SAS and NEP scales. Confirmatory factor analysis provides an ideal approach to testing measures of latent constructs like attitudes because of its ability to partition shared and unshared (presumably, error) variance in indicators, thus providing a test of the construct’s reliability. The factors were identified by setting the mean to 0 and the variance to 1, thereby approximating a z-score. This approach allows all of the item loadings to be estimated. Global fit was assessed primarily using the alternative fit indices provided in Mplus; the Comparative Fit Index (CFI) for which values greater than 0.95 are considered good fit [37], the Tucker–Lewis Index (TLI; >0.95); and the Root Mean-Square Error of Approximation (RMSEA; <0.08). In addition to assessing global fit, we also evaluated local fit using the modification indices provided in Mplus. These indices report the change in model fit that would be afforded by single parameter changes to the model thereby identifying relationships incorrectly specified in the hypothesized factor structure. Importantly, the literature does not provide explicit guidance as to when a modification is “big enough” to merit a model change. Instead, researchers are encouraged to consider the theoretical and statistical implications of any model changes and act accordingly [38]. Where needed, nested model comparisons were tested using the null model log-likelihood scaled to approximate a chi-square distribution (−2LL) as a function of the change in parameters across models.
3.1.3. Tests of Validity
Criterion Validity Tests
Typically, a new measure should pass two tests of criterion validity: predictive and concurrent validity [30]. To test predictive validity, we performed a series of structural regressions to test the ability of the SAS to predict various sustainability-oriented behaviors, with the expectation that as positive sustainability attitudes increase, so should sustainability behavioral intention [22]. Four different political ideology measures were included as controls: the Ideological Consistency Scale (ICS) [39], separate measures for economic and social ideology, and a categorical measure of political party. This variety of political ideology controls were selected to ensure that we controlled for actual liberal and conservative views, but also expressed party affiliation. As climate change and other sustainability issues have become politically polarized, we wanted to ensure that the attitudes being measured were not related to political ideology in any way. All of these were coded so greater values reflected more liberal responses. If the SAS is an effective measure of sustainability attitudes, it should have a positive relationship with sustainability-related behavioral outcomes after controlling for political ideology.
Concurrent validity demonstrates appropriate alignment with similar constructs [40], and a valid new measure of sustainability attitudes should positively align with other valid measures of similar constructs. A concurrent validity test, however, requires a comparison to the current “gold standard” measure of the same construct. As no such measure of sustainability attitudes currently exists, this step is not necessarily applicable to this study [30]. We did, however, evaluate the relation between the SAS and the NEP, as some studies have used the NEP to serve as a proxy measure of sustainability attitudes [41,42]. Additionally, many more studies have used the NEP as a measure of environmental attitudes, which is then used to address sustainability behaviors and concepts writ large. To test concurrent validity, we ran the same structural regressions in the predictive validity tests but with the NEP only, allowing a comparison between the predictive validity of the SAS and NEP.
Construct Validity Tests
Similarly to establishing criterion validity, past research into scale development suggests that at least two different indicators of construct validity are needed to assess the validity of a new measure [43]. The two indicators we assessed for the SAS were its ability to differentiate between known groups and the extent to which it was correlated with other theoretically related variables. Differentiation between known groups provides evidence that a measure accurately indicates the construct in question in different populations [30], allowing us to see if it “…behaves as expected in relation to other constructs” ([44], p. 72). Based on numerous studies related to cultural cognition [45] and the Global Warming Six America’s Project [46], we expected those who identify as Republican, or politically conservative, to hold weaker sustainability attitudes (lower SAS scores) than those who identify as Democrat, or politically liberal.
Finally, we tested whether the SAS was correlated with theoretically related variables, namely the NEP and political ideology, through a series of product-moment correlations.
3.2. Results
3.2.1. Confirmatory Factor Analyses
The Sustainability Attitudes Scale (SAS) was initially subjected to a confirmatory factor analysis. In order to retest the utility of treating the domains as separate, we first estimated a model in which the items were entered as indicators of their three separate hypothesized factors. The analyses suggested moderate global fit (CFI = 0.95; TLI = 0.93; SRMR = 0.04; RMSEA = 0.06, p = 0.03). All 12 items loaded significantly on their hypothesized factors but revealed one relatively low loading for the reworded version of item 7 from Study One (standardized loading [λ] = 0.26). As before, the model suggested especially high correlations among the three latent constructs (RSocial.Economic = 0.86; RSocial.Ecological = 0.95; REconomic.Ecological = 0.89).
As in the previous study, we then estimated a second model in which the 12 SAS items were indicators of a single factor. The model fit moderately to the data (CFI = 0.93; TLI = 0.92; SRMR = 0.04; RMSEA = 0.06, p < 0.001). The model fit significantly worse than the three-factor model (−2ΔLL(3) = 88.89, p < 0.001), but given the acceptable fit and the fact that high correlations challenged the utility of considering the three subscales as distinct factors, the single-factor model was again accepted as the best representation of the data [47]. As the loading for the reworded version of item 7 from Study One was lower than the other 11 items, we estimated an additional, non-nested, single-factor model without this item. This model fit well to the data (CFI = 0.94; TLI = 0.92; SRMR = 0.04; RMSEA = 0.06, p < 0.001) and revealed loadings greater than 0.45 for all of the items (ω = 0.90). Therefore, we removed this item, resulting in a final 11 item sustainability attitudes scale (Table 2).
In order to use the NEP as an existing, recognized comparative measure, we first evaluated its factor structure as well. The initial CFA model, including all 15 items of the NEP as indicators of the same latent factor, fit poorly to the data (CFI = 0.74; TLI = 0.70; RMSEA = 1.00, p < 0.001), and, although all loadings were significant, several were relatively low (seven loadings were below 0.5). Evaluation of the modification indices revealed stronger than expected correlations among the positively worded items and the negatively worded items separately, but not between the two types of items. Although the original intent of the wording of the NEP may have been to encourage more thoughtful responses from participants, analyses suggest that the two types of questions (positive and negative) produce measurement error. The different types of questions in the NEP may be measuring different constructs (e.g., shared responsibility, entitlement). Given its consistency with previous research in other domains [48] a second model for the NEP was estimated in which two factors were estimated. One factor included only the positively worded items (+NEP), and the other included only the negatively worded items (-NEP). This second model fit better but still insufficiently accounted for the relationships within the data (CFI = 0.88; TLI = 0.86; RMSEA = 0.07, p < 0.001) and revealed both low loadings (two were below 0.5; see Table 3) and some evidence of poor local fit, especially including a stronger than expected relationship between items positive NEP items 1 and 6. The correlation between the latent factors was −0.63. Given the well-researched nature of the NEP and the importance of replicating previous work, however, no other modifications to this scale were made. For all correlational analyses, we used the full NEP scale and the positively and negatively worded subscales independently.
Table 3.
Descriptive Statistics for New Ecological Paradigm Scale Items.
3.2.2. Criterion Validity Results
Predictive Validity
A series of regressions was estimated in which eight behaviors and opinions were regressed on the SAS, the NEP, and our four controls (Table 4). The eight behaviors include both individual (e.g., reducing one’s electricity use) and community (e.g., our community should aspire to carbon neutrality). These behaviors have been used in previous assessments of the sample population and have shown good conceptual fit and reliability as examples of sustainability behaviors, ensuring that these regressions provide a test of the SAS’s ability to predict sustainability behaviors. Given the strong correspondence among them, separate models were estimated for the SAS (Model 1), the NEP modeled as a single factor (Model 2), and as separate positive and negative NEP factors (Model 3).
Table 4.
Structural Regression results using the SAS and the NEP to predict sustainability behaviors and opinions controlling for political ideology.
Model 1 (n = 1466) fit moderately to the data (CFI = 0.89; TLI = 0.84; SRMR = 0.02; RMSEA = 0.07, p < 0.001) and suggested that the SAS was always a significant predictor of our outcome variables. The variance accounted for in each model varied significantly, with the SAS always a stronger predictor than the control variables. Unsurprisingly, given the ill-fit within the full NEP scale, Model 2 (n = 1466) fit poorly to the data (CFI = 0.79; TLI = 0.72; SRMR = 0.13; RMSEA = 0.08, p < 0.001). The complete scale significantly predicted all of the sustainability behavior and opinion items. Model 3 (n = 1466) also fit moderately to the data (CFI = 0.86; TLI = 0.81; SRMR = 0.12; RMSEA = 0.06, p < 0.001) and revealed the +NEP subscale to be a significant predictor of all eight sustainability behaviors and opinions, and was always the strongest predictor. The –NEP subscale significantly predicted only one of the opinion statements. Overall, the SAS explained a similar amount of variance for each of the environmental behaviors as the NEP, with R2 values greater than or equal to those of the NEP, whether it was entered as one or two factors, demonstrating good predictive validity. In other words, the SAS accounts for at least the same and in some cases more variance in the tested items than the NEP.
Concurrent Validity
Evidence of the concurrent validity of the SAS was triangulated through three slightly different ways. First, there was a significant correlation between the SAS and NEP, r = 0.82, p < 0.001 (see Table 5). As one would expect, given the intent and items contained in the SAS, the measure positively correlated with the positive items of the NEP, r = 0.79, p < 0.001, and negatively with the NEP negative items, r = −0.44, p < 0.001. This inverse relationship offers a degree of divergent validity, as the SAS scores had a significant negative correlation with an established measure of anti-environmental world views. Finally, and most importantly, the beta coefficients in the regression analyses predict environmental behaviors to a similar degree as the NEP and its subscales. Thus, the SAS shows sound conceptual content measuring the latent construct it intends to measure.
Table 5.
SAS, NEP, and Control Variable Correlations.
3.2.3. Construct Validity Results
Differentiation Between Known Groups
Our comparison between two populations hypothesized to differ in their SAS scores was made using political groups. Using our dichotomous variable of party affiliation, performed an independent samples t-test comparing the mean SAS scores of those who self-identified as Democrat and those who identified as Republican. Consistent with past research on climate change and environmental attitudes, Democrats held more positive sustainability attitudes (M = 5.24, SD = 0.55, n = 394) than did Republicans(M = 4.42, SD = 0.74, n = 197; t = 13.76, p < 0.001).
Correlational Validity
Finally, respondents’ SAS scores significantly correlated with the other constructs of our study in the anticipated directions (Table 5). In addition to its correlations with the NEP and both of its subscales, as previously mentioned, the SAS was also correlated with all four control variables of ideological consistency, economic and social ideology, and a categorical measure of political party. Importantly, however, none of these relationships were strong enough to warrant concern regarding multicollinearity in our earlier analyses. Given this consistency across measures and constructs, the SAS showed good correlational validity based on previous research.
3.3. Discussion
Study Two resulted in our final sustainability attitudes scale and demonstrations of its criterion and construct validity. By rewriting the items from Study One that were reverse-coded and dropping one poor-performing item, we arrived at our final 11 item scale (Table 2). Overall, the unidimensional structure of the SAS shows good consistency with the New Ecological Paradigm, a commonly used measure of sustainability perspective, while also being distinctive. The SAS predicted sustainability-related behaviors and opinions better than the NEP after controlling for political ideology (Table 4). Additionally, the SAS differentiated between two groups that would be expected to have different attitudes regarding sustainability) and was correlated with both the NEP and one’s political ideology (Table 5), as theory and past research would hypothesize. Taken in totality, these results triangulate to show good criterion and construct validity for the SAS. However, given that the conceptual focus of the SAS centers more precisely on a sustainability attitude rather than an ecological worldview, we believe that it offers a more theoretically consistent alternative to the NEP for sustainability social science researchers who subscribe to a view of sustainability including social, ecological, and economic components.
4. General Discussion and Conclusions
The goal of these studies was to develop a measure of sustainability attitudes. Although measurement of latent constructs such as attitudes is commonly used in a variety of scholarly fields (e.g., psychology, sociology, political science, communications, etc.), the practice is less developed in sustainability research. As with other types of measurement, attitude measures must accurately and consistently measure the constructs they represent. The current research produced a new 11-item, single-factor measure of sustainability attitudes, the Sustainability Attitude Scale (SAS), that meets these criteria while aligning with the triple-bottom line perspective that includes social, ecological, and economic domains of sustainability [14,16].
The SAS was developed in a multiphase, iterative process that included re-evaluating and refining the wording of potential items from early versions of the measure. Following this step, testing more representative samples allowed for greater statistical power. This tactic was a critical necessity for an Item Response Theory approach to choosing efficient and theoretically sound sustainability items from a multidimensional perspective (Study One). While the SAS contains ecological, economic, and social sustainability-focused items, the current data indicate that it best measures a general or global sustainability attitude. This finding may offer some conceptual clarity for understanding sustainability and its social, economic, and ecological constructs. For example, these three domains may interact more inherently in one’s attitude rather than being three independent constructs that connect to lesser degrees.
The conceptual alignment with a three-domain perspective of sustainability including social, economic, and ecological components gives the SAS direct applicability to research questions and theory development consistent with this definition of sustainability. Research involving different views of sustainability [1,17] reasonably requires different measures of attitudes that are more tailored to those paradigms than the SAS. Thus, the SAS is limited by its conceptual alignment to the triple-bottom-line view. The authors encourage researchers with different views of sustainability to develop attitudinal measures congruent with those perspectives. The importance of attitudes in understanding sustainable behavior does not change across sustainability perspectives, but their measures should, as the different perspectives focus on different aspects of the underlying construct. Recent sustainability research measuring other attitudes [49] shows that this area is growing and informing our understanding of sustainable behavior. We hope that the SAS can be employed to help more researchers pursue related questions.
We acknowledge that the generalizability of our results is linked to the populations we sampled. We invite other researchers investigating other populations to use the SAS and share their findings together we can better understand the measure. Nonetheless, the SAS is a valid and reliable measure ready for use in populations similar to those in our studies.
4.1. The SAS as a Component in Sustainability Research
The SAS could be used in a variety of situations, ranging from empirical research to educational and/or program assessment. As shown in Study Two, the SAS has respectable predictive validity by predicting a range of sustainability behaviors and opinions. Additionally, the measure is easy to administer, score, and interpret. The high degree of face validity and clarity helps motivate participants to complete the measures in a survey and minimizes respondent confusion, making the SAS a practical measure to include in different data collection contexts. Although the scale was developed and tested on repeated samplings of a large, midwestern land grant institution, it has subsequently been compared to a representative sample of the United States public [49]. While the university sample did find significantly higher sustainability attitudes than the general public (Muniversity students = 5.08, 95%CI = ±0.02; Mgeneral public = 4.80, 95%CI = ±0.04), the SAS performed similarly across both samples. This study demonstrates the generalizability of the SAS and its suitability for use in theoretically based, quantitative empirical research.
The SAS also can be used to investigate the roles of sustainability attitudes in conjunction with other predictors of sustainability behaviors. For example, Kirby and Zwickle [50] found that sustainability attitudes combine with demographic variables to predict both sustainability behaviors and sustainability knowledge in both student and general public populations. Thus, the SAS also allows investigations into the role of sustainability attitudes within the context of other social-cognitive constructs (e.g., gender, cultural identity), and can be helpful in investigating the roles of other latent constructs in sustainability behavior. Kivett and Jones [51] used the SAS to see how sustainability attitudes, generative concern, and procedural knowledge about sustainability practices predict engaging in sustainable behaviors in younger adults. Their results revealed that sustainability attitudes accounted for a significant amount of the variance in sustainability behaviors (R2 = 0.287, p < 0.001) [51]. Exploring other latent constructs, such as elements of character (e.g., empathy, entitlement), shame, and sense of responsibility, could further help to understand the development of sustainability attitudes and behavior. One aspect of character, concern for future generations [52], is a good example of a personal attitude that is showing insight into this understanding. Wells et al. [53], for example, showed that generative concern predicted both specific attitudes and behaviors regarding water and energy use. Given that attitudes both result from a variety of factors and can predict other outcomes, the SAS could be used to understand sustainability attitudes more fully as an outcome and a predictor of different phenomena.
In a similar sense, educational researchers and administrators may be interested in changes in more general sustainability attitudes as a potential outcome of educational programs. Given the link between attitudes and behavior, educators could examine a more subtle and potentially more sensitive aspect of sustainability education. The SAS would be an efficient and reliable inclusion in a pre-posttest design and could be used as a mediating variable to understand variability in sustainability behavior within educational groups. For example, perhaps pre-existing sustainability attitudes help explain the differences in educational effects of a program on participants or an educational cohort.
The SAS is also one measure that could be used to assess help “campus sustainability culture,” as reported in the AASHE STARS program. At the time of this publication, Credit EN requires a participating college or university to survey a representative sample of the entire campus community (students, staff, and faculty) and track changes over time [54].
4.2. Conclusions
Valid and reliable measures offer clarity in research and are necessary to test existing social science theories in novel contexts and for the development of new theories. This is particularly true when measuring attitudes, where measures should be targeted to an object as closely as possible. Given its validity and conceptual precision, our hope is that the SAS can support rigorous and theoretically sound research in the rapidly growing field of sustainability social science within the paradigm of sustainability that incorporates ecological, social, and economic dimensions.
Author Contributions
All authors contributed significantly to this project. Conceptualization, K.T.J., A.Z. and B.C.; methodology, A.Z. and K.T.J.; formal analysis, J.A.H.; investigation, A.Z.; resources, A.Z. and K.T.J.; data curation, A.Z. and J.A.H.; writing—original draft preparation, K.T.J., A.Z. and J.A.H.; writing—review and editing, K.T.J., A.Z. and B.C.; supervision, K.T.J. and A.Z.; project administration, A.Z. and K.T.J.; funding acquisition, A.Z. All authors have read and agreed to the published version of the manuscript..
Funding
This research was supported by the Environmental Science and Policy program and the Office of Sustainability at Michigan State University.
Institutional Review Board Statement
The study was conducted in accordance with the Declaration of Helsinki, and approved by the Institutional Review Board of Michigan State University (protocol code STUDY00001331 approved 10 September 2018).
Informed Consent Statement
Informed consent was obtained from all subjects involved in the study.
Data Availability Statement
The raw data supporting the conclusions of this article will be made available by the authors on request.
Acknowledgments
We are grateful for the collaboration of the Michigan State University Office of Sustainability and their support of this research.
Conflicts of Interest
The authors declare no conflicts of interest.
References
- Hopwood, B.; Mellor, M.; O’Brien, G. Sustainable development: Mapping different approaches. Sustain. Dev. 2005, 13, 38–52. [Google Scholar] [CrossRef]
- Piscitelli, A.; D’Uggento, A.M. Do young people really engage in sustainable behaviors in their lifestyles? Soc. Indic. Res. 2022, 163, 1467–1485. [Google Scholar] [CrossRef]
- Nguyen-Van, P.; Stenger, A.; Tiet, T. Social incentive factors in interventions promoting sustainable behaviors: A meta-analysis. PLoS ONE 2021, 16, e0260932. [Google Scholar] [CrossRef]
- Heeren, A.J.; Singh, A.S.; Zwickle, A.; Koontz, T.M.; Slagle, K.M.; McCreery, A.C. Is sustainability knowledge half the battle? An examination of sustainability knowledge, attitudes, norms, and efficacy to understand sustainable behaviours. Int. J. Sustain. High. Educ. 2016, 17, 613–632. [Google Scholar] [CrossRef]
- Jacobs, T.P.; McConnell, A.R. Self-transcendent emotion dispositions: Greater connections with nature and more sustainable behavior. J. Environ. Psychol. 2022, 81, 101797. [Google Scholar] [CrossRef]
- Kaplan, B.; Iyer, E.S. Motivating sustainable behaviors: The role of religiosity in a cross-cultural context. J. Cons. Aff. 2021, 55, 792–820. [Google Scholar] [CrossRef]
- Süssenbach, S.; Kamleitner, B. Psychological ownership as a facilitator of sustainable behaviors. In Psychological Ownership and Consumer Behavior; Peck, J., Shu, S., Eds.; Springer: Cham, Switzerland, 2018; pp. 211–225. [Google Scholar] [CrossRef]
- Maio, G.R.; Olson, J.M.; Bernard, M.M.; Luke, M.A. Ideologies, values, attitudes, and behavior. In Handbook of Social Psychology; Dalamater, J., Ed.; Springer: Boston, MA, USA, 2006; pp. 283–308. [Google Scholar] [CrossRef]
- Bollen, K.A. Latent variables in psychology and the social sciences. Annu. Rev. Psychol. 2002, 53, 605–634. [Google Scholar] [CrossRef]
- Ebbinghaus, H. Memory; Ruger, H.A.; Bussenius, V.E., Translators; Dover: New York, NY, USA, 1964; (Original work published in 1885). [Google Scholar]
- Schultz, P.W.; Oskamp, S.; Mainieri, T. Who recycles and when? A review of personal and situational factors. J. Environ. Psychol. 1995, 15, 105–121. [Google Scholar] [CrossRef]
- Toman, M.A. The difficulty in defining sustainability. In The RFF Reader in Environmental and Resource Policy; RFF Press: Washington, DC, USA, 2006; pp. 247–253. [Google Scholar] [CrossRef]
- Vos, R.O. Defining sustainability: A conceptual orientation. J. Chem. Technol. Biotechnol. 2007, 82, 334–339. [Google Scholar] [CrossRef]
- The World Commission on Environment and Development. Our Common Future; Oxford University Press: Oxford, UK, 1989. [Google Scholar]
- Zwickle, A.; Jones, K.T. Sustainability knowledge and attitudes: Assessing latent constructs. In Handbook of Sustainability and Social Science Research; Filho, L., Marans, R.W., Callewaert, J., Eds.; Springer International: New York, NY, USA, 2018; pp. 435–451. [Google Scholar] [CrossRef]
- Elkington, J. Cannibals with Forks: Triple Bottom Line of 21st Century Business; Capstone: Oxford, UK, 1997. [Google Scholar]
- Zak, A. Multiple perspectives on sustainable development. In Organizing Sustainable Development; Kuzniarska, A., Mania, K., Jedynak, M., Eds.; Rutledge: New York, NY, USA, 2024; pp. 77–90. [Google Scholar] [CrossRef]
- Sargani, G.R.; Zhou, D.; Raza, M.H.; Wei, Y. Sustainable entrepreneurship in the agricultural sector: The nexus of the triple bottom line measurement approach. Sustainability 2020, 12, 3275. [Google Scholar] [CrossRef]
- Shim, J.; Moon, J.; Lee, W.S.; Chung, N. The impact of CSR on corporate value of restaurant businesses using triple bottom line theory. Sustainability 2021, 13, 2131. [Google Scholar] [CrossRef]
- MacDonald, J. Balancing priorities and measuring success: A triple bottom line frame work for international school leaders. J. Res. Int. Educ. 2009, 8, 81–98. [Google Scholar] [CrossRef]
- Newhouse, N. Implications of attitude and behavior research for environmental conservation. J. Environ. Educ. 1990, 22, 26–32. [Google Scholar] [CrossRef]
- Ajzen, I. The theory of planned behavior. Organ Behav. Hum. Decis. Process 1991, 50, 179–211. [Google Scholar] [CrossRef]
- Bradley, J.C.; Waliczek, T.M.; Zajicek, J.M. Relationship between environmental knowledge and environmental attitude of high school students. J. Environ. Educ. 1999, 30, 17–21. [Google Scholar] [CrossRef]
- Catton, W.R.; Dunlap, R.E. Paradigms, theories, and the primacy of the HEP-NEP distinction. Am. Sociol. 1978, 13, 256–259. Available online: http://www.jstor.org/stable/27702343 (accessed on 7 September 2025).
- Dunlap, R.E. The new environmental paradigm scale: From marginality to worldwide use. J. Environ. Educ. 2008, 40, 3–18. [Google Scholar] [CrossRef]
- Dunlap, R.E.; Van Liere, K.D. The “New Ecological Paradigm”. J. Environ. Educ. 1978, 9, 10–19. [Google Scholar] [CrossRef]
- Dunlap, R.E.; Van Liere, K.D.; Mertig, A.G.; Jones, R.E. Measuring endorsement of the new ecological paradigm: A revised NEP scale. J. Soc. Issues 2000, 56, 425–442. [Google Scholar] [CrossRef]
- Jowett, T.; Harraway, J.; Lovelock, B.; Skeaff, S.; Slooten, L.; Strack, M.; Shephard, K. Multinomial-regression modeling of the environmental attitudes of higher education students based on the revised New Ecological Paradigm Scale. J. Environ. Educ. 2014, 45, 1–15. [Google Scholar] [CrossRef]
- Cruz, S.M.; Manata, B. Measurement of environmental concern: A review and analysis. Front. Psychol. 2020, 11, 363. [Google Scholar] [CrossRef] [PubMed]
- Boateng, G.O.; Neilands, T.B.; Frongillo, E.A.; Melgar-Quinonex, H.R.; Young, S.L. Best practices for developing and validating scales for health, social, and behavioral research: A primer. Front. Public Health 2018, 6, 149. [Google Scholar] [CrossRef]
- Campbell, B.; Jones, K.T. Assessing Sustainability Attitudes: A New Multidimensional Measure; Paper Presentation; Midwest Psychological Association: Chicago, IL, USA, 2015. [Google Scholar]
- Lewin, K. Comments concerning psychological forces and energies, and the structure of the psyche. In Organization and Pathology of Thought: Selected Sources; Rapaport, D., Ed.; Columbia University Press: New York, NY, USA, 1951; pp. 76–94. [Google Scholar]
- Pepper, S.C. World Hypotheses; University of California: Berkeley, CA, USA, 1942. [Google Scholar]
- Glasman, L.R.; Albarracín, D. Forming attitudes that predict future behavior: A meta-analysis of the attitude-behavior relation. Psychol. Bull. 2006, 132, 778–822. [Google Scholar] [CrossRef]
- Wallace, D.S.; Paulson, R.M.; Lord, C.G.; Bond, C.F., Jr. Which behavior do attitudes predict? Meta-analyzing the effects of social pressure and perceived difficulty. Rev. Gen. Psychol. 2005, 9, 214–227. [Google Scholar] [CrossRef]
- Guadagnoli, E.; Velicer, W.F. Relation of sample size to the stability of component parts. Psychol. Bull. 1988, 103, 265–275. [Google Scholar] [CrossRef]
- Hu, L.-T.; Bentler, P.M. Fit indices in covariance structure modeling: Sensitivity to underparameterized model misspecification. Psychol. Methods 1998, 3, 424–453. [Google Scholar] [CrossRef]
- Kline, R.B. Principles and Practice of Structural Equation Modeling, 2nd ed.; Guilford Press: New York, NY, USA, 2005. [Google Scholar]
- Jacoby, W.G. The structure of ideological thinking in the American electorate. Am. J. Political. Sci. 1995, 39, 314–335. [Google Scholar] [CrossRef]
- Raykov, T.; Marcoulides, G.A. Introduction to Psychometric Theory; Routledge, Taylor & Francis Group: New York, NY, USA, 2011. [Google Scholar]
- de Barcellos, M.D.; Krystallis, A.; de Melo Saab, M.S.; Kügler, J.O.; Grunert, K.G. Investigating the gap between citizens’ sustainability attitudes and food purchasing behaviour: Empirical evidence from Brazilian pork consumers. Int. J. Cons. Stud. 2011, 35, 391–402. [Google Scholar] [CrossRef]
- Ruff, C.L.; Olson, M.A. The attitudes of interior design students towards sustainability. Int. J. Technol. Des. Educ. 2009, 19, 67–77. [Google Scholar] [CrossRef]
- Frongillo, E.A.; Nanama, S.; Wolfe, W.S. Technical Guide to Developing a Direct, Experience-Based Tool for Household Food Insecurity; Washington DC Food and Nutrition Technical Assistance Project 2004; Food and Nutrition Technical Assistance, Academy for Educational Development: Washington, DC, USA, 2004. [Google Scholar]
- Churchill, G.A. A paradigm for developing better measures of marketing constructs. J. Mark. Res. 1979, 16, 64–73. [Google Scholar] [CrossRef]
- Kahan, D.M. Cultural cognition as a conception of the cultural theory of risk. In Handbook of Risk Theory: Epistemology, Decision Theory, Ethics, and Social Implications of Risk; Roeser, S., Ed.; Springer: Dordrecht, The Netherlands, 2012; pp. 725–759. [Google Scholar]
- Leiserowitz, A.; Maibach, E.; Roser-Renouf, C.; Feinberg, G.; Howe, P. Global Warming’s Six Americas, September 2012; Yale University and George Mason University: New Haven, CT, USA, 2013; Yale Project on Climate Change Communication; Available online: https://climatecommunication.yale.edu/app/uploads/2016/02/2013_03_Global-Warming%E2%80%99s-Six-Americas-in-September-2012.pdf (accessed on 10 September 2024).
- Hamm, J.A.; Hoffman, L. Working with covariance: Using higher-order factors in structural equation modeling with trust constructs. In Interdisciplinary Perspectives on Trust: Towards Theoretical and Methodological Integration; Shockley, E., Neal, T., PytlikZillig, L., Bornstein, B., Eds.; Springer International: New York, NY, USA, 2016; pp. 85–97. [Google Scholar]
- Lyne, K.J.; Barrett, P.; Evans, C.; Barkham, M. Dimensions on the variation of the CORE-OM. Br. J. Clin. Psychol. 2006, 45, 185–203. [Google Scholar] [CrossRef]
- Hidalgo-Crespo, J.; Amaya-Rivas, J.L. Citizens’ pro-environmental behaviors for waste reduction using an extended theory of planned behavior in Guayas Province. Clean. Eng. Technol. 2024, 21, 100765. [Google Scholar] [CrossRef]
- Kirby, C.K.; Zwickle, A. Sustainability behaviors, attitudes, and knowledge: Comparing university students and the general public. J. Environ. Stud. Sci. 2021, 11, 639–647. [Google Scholar] [CrossRef]
- Kivett, B.; Jones, K.T. Predicting sustainability behavior via attitudes, knowledge, and generative concern [paper presentation]. In Proceedings of the Global Conference in Sustainability in Higher Education, Online, 20–22 October 2020. [Google Scholar]
- McAdams, D.P.; de Saint Aubin, E. A theory of generativity and its assessment through self-report, behavioral acts, and narrative themes in autobiography. J. Pers. Soc. Psychol. 1992, 62, 1003–1015. [Google Scholar] [CrossRef]
- Wells, V.K.; Taheri, B.; Gregory-Smith, D.; Manika, D. The role of generativity and attitudes on employees’ home and workplace water and energy saving behaviors. Tour. Manag. 2016, 56, 63–74. [Google Scholar] [CrossRef]
- AASHE. STARS Technical Manual, version 2.2; Association for the Advancement of Sustainability in Higher Education: Philadelphia, PA, USA, 2019. Available online: https://stars.aashe.org/resources-support/technical-manual/ (accessed on 8 August 2020).
Disclaimer/Publisher’s Note: The statements, opinions and data contained in all publications are solely those of the individual author(s) and contributor(s) and not of MDPI and/or the editor(s). MDPI and/or the editor(s) disclaim responsibility for any injury to people or property resulting from any ideas, methods, instructions or products referred to in the content. |
© 2025 by the authors. Licensee MDPI, Basel, Switzerland. This article is an open access article distributed under the terms and conditions of the Creative Commons Attribution (CC BY) license (https://creativecommons.org/licenses/by/4.0/).