Abstract
The Icelandic Government’s climate action plan proposes climate-neutral beef production, reduced methane emissions, and improved fertilizer management. However, a life cycle assessment (LCA) of cattle production is lacking to determine the current status of its environmental impacts. This study conducts a cradle-to-farm gate LCA of interconnected dairy and beef cattle systems. The functional unit (FU) is “1 kg of edible cattle meat” for the meat and “1 kg of fat and protein corrected milk” (FPCM) for milk produced in Iceland in 2019. The multifunctionality between meat and milk from the dairy system is handled using mass, economic, and biophysical allocations, respectively. The environmental impacts were estimated using the ReCiPe 2016 v1.08 mid-point (H) impact assessment method. Furthermore, this study conducts an uncertainty and global sensitivity analysis to understand the possible range of environmental impacts and identifies key influential parameters in the dairy and beef cattle system. Animal production is a hotspot for global warming, while the feed (hay and concentrate) is a hotspot for other environmental categories. The allocation method choice highly influences the environmental impacts. This study underscores the need to harmonize data collection and access to centralized, reliable data sources to reduce uncertainty and meet climate action plan goals on both the national and global scale.
1. Introduction
The current global agri-food system is a major driver of environmental degradation, contributing to environmental impacts such as climate change, land use, freshwater use, eutrophication, and acidification [1,2,3]. Furthermore, these environmental impacts are currently in a positive feedback loop and are continuously undermining the global agri-food system’s functional ability to fulfill its primary objective, i.e., providing nutrition to a growing world population [4,5,6,7]. Positive feedback loops increase the effects of environmental impacts and amplify the rate of change. In the case of climate change, greenhouse gas (GHG) emissions from the agri-food system contribute to global warming. The resulting temperature increases alter climate patterns, leading to decreased yields, crop failures, increased crop diseases, and soil erosion. To compensate and maintain food output, forests are cleared for new agricultural land, releasing more carbon dioxide. This mechanism creates a positive feedback loop. In addition to this feedback loop, various interactions between the agri-food system and the Earth system exist [8,9]. Livestock production is a significant contributor to various environmental impacts, particularly to climate change, with a substantial share of 12% (6.2 Gt CO2 eq.) of the global anthropogenic GHG emissions [10]. This significant GHG emission share emphasizes an urgent need for intervention to mitigate the undesired effects of climate change and support a transition towards sustainable livestock production systems [10,11]. However, the challenge is not only to transition towards an environmentally sustainable system to address climate change, but to avoid burden shifting to other environmental categories [12,13].
As per the meta-analysis of global food system by Poore and Nemecek [2], specialized beef cattle production has the highest GHG emission intensity (mean value: 50 kg CO2 eq.) among all the livestock meat products per 100 g of protein basis [2]. However, the beef meat from dairy cattle is not far behind and ranks third in GHG emission intensity (mean value: 20 kg CO2 eq per 100 g protein [2]), after production of lamb meat [2,14,15]. These GHG emission intensity trends are similar across regions, where beef meat from specialized meat and dairy cattle production have the highest GHG emissions among the agri-food system products in each region. However, the magnitude of GHG emissions of meat from specialized beef and dairy cattle and dairy products varies across regions. The variation in magnitude of impacts of the same products from the cattle production system is influenced by difference in farming techniques, number of animals, feed type used, manure handling approach, land use, and climatic conditions [13,16]. These differences influence the overall GHG emission intensities and variability of the constituent GHGs, such as enteric and manure methane, nitrous oxide, and carbon dioxide [2,15]. Apart from GHG emissions, these differences also influence other environmental categories, such as biodiversity and water quality, at different spatial scales [13,17].
Life cycle assessment (LCA) has been used for decades to calculate the environmental impact of agriculture, including livestock systems [2,18,19]. As a methodology, LCA evaluates a product’s environmental impact by considering all the material and energy input at different stages of a product life cycle, from raw material to end of life. In general, cattle production system LCAs so far have explored a narrow set of indicators, lack complete data, rely on global-level emission factors, and utilize inconsistent allocation methods to account for numerous co-products [18,20,21].
Across the Nordic nations, several cattle LCAs have been conducted, including from Finland, Norway, Sweden, and Denmark. In Sweden, two studies have used LCA to calculate the global warming potential (GWP) of 1 kg of energy-corrected milk (ECM) from cradle-to-farm gate [22,23]. The GWP from Henriksson et al. [22] was 0.9–1.3 kg CO2-eq/kg ECM, while Sasu-Boakye et al. [23] showed an impact between 0.6 and 0.7 kg CO2-eq/kg ECM. This difference between studies can be explained by the fact that Sasu-Boakye et al. [23] included economic allocations to account for co-products of the feed production, while Henriksson et al. [22] used mass allocations. Similarly, the GWP outcome from a whole farm model in Norway (HolosNor) was 1.1 kg CO2-eq/kg fat and protein-corrected milk (FPCM), and 17.3–21.7 kg CO2-eq/kg carcass weight (CW) of beef [24]. Though not strictly applying an LCA methodology, this study reinforced the need to account for beef as an unavoidable co-product of the dairy production.
In terms of beef production, Mogensen et al. [25] used LCA to calculate the impact of beef production in Denmark using the impact indicators global warming potential (GWP), land-use change (LUC), fossil energy use (FD), eutrophication (EU), and acidification (AC), with the outcome ranging between 10.4 and 45.8 kg CO2-eq/kq of beef used for human nutrition [25]. The authors used estimations of the proportion of the live animal that ends up in edible products, thus explaining the choice of the functional unit. The large GWP impact range is further explained by the animals’ age variation at slaughter, as well as differences in farm management practices. More recently, two LCA studies of beef production in Finland assessed three key environmental impacts (GWP, eutrophication (EU), and acidification (AC)) for every kg of beef carcass weight (CW) [26,27]. Following a biophysical allocation method, Hietala et al. [26] demonstrated that the dairy-bred beef and meat-bred beef systems had a GWP outcome of 24.9 and 32.1 kg CO2-eq/kg CW, respectively. However, an experimental LCA by Huuskonen et al. [27] reasoned that permutations in the cattle diet led to a GWP that ranged between 19.1 and 25.9 kg CO2-eq/kg CW. Finally, under a model with expanded system boundaries, an LCA of beef production in Sweden obtained a GWP ranging between 23.0 and 27.0 kg CO2-eq/kg of “bone-free meat” [28]. Clearly, these more recent studies from the Nordic countries echo the findings of [21] regarding the importance of appropriate selection of impact indicators and allocation methods. Additionally, inconsistent choices of functional units make comparisons between studies difficult. The variations in the absolute range of cattle environmental impacts therefore provide an opportunity for region specific intervention to reduce the GHG emission from cattle production systems and to reiterate the need to assess the environmental impact of different regional systems [29,30].
Given the need for measuring region-specific environmental impacts of cattle production systems, Iceland’s unique geographic and climatic conditions, as well as its reliance on imports of vital components, such as fertilizers, concentrated feed, and farm machinery to support its livestock production, make evaluating the environmental impact of cattle farming particularly important. Iceland is situated near the Arctic Circle, and its climate is characterized as cold, with short growing seasons. Most of the cropland is utilized for hay cultivation, which is a primary feed source in cattle and sheep production in Iceland. The cattle production is concentrated in the south, northeast, and northwest regions of the country [31]; the system is utilized for the production two products, meat and milk [32]. The dairy cattle system is utilized to produce milk and meat, while the specialized beef cattle system is only used for meat production [32]. Iceland is dependent on imports to fulfill its food and nutritional requirements, and the cattle production accounts for 12–16% of the total domestic meat production between 2014 and 2023, and 99% of the produced dairy products. Cattle are therefore essential livestock in regard to Iceland’s food security and self-sufficiency [33]. To address the rising concerns of climate change, the Icelandic Government has, in their Climate Action Plan 2020, among 48 actions, prioritized actions E.2, on carbon-neutral beef production; E.4, on improved use and handling of fertilizers; and E.5, on improved feeding of livestock to reduce enteric fermentation [34].
Each of these three actions is of direct consequence to the domestic beef meat and dairy milk production [35,36]. These actions are welcomed and required for sustainable food production [15]. Implementation of these actions, however, requires a national-level evaluation of the current environmental impacts of the cattle production systems in Iceland. In Iceland, the GHG emissions from livestock are reported under the National Inventory Report (NIR), which is published every year. As per the NIR 2022 [32], in 2019, the agriculture sector accounted for 14% of the total national GHG emissions (excluding land use and land-use change). This includes both enteric and manure methane (CH4), as well as dinitrogen oxide (N2O) emission from managed soil and fertilizer applications. These reported emissions are considered as territorial emissions of activities taking place within Iceland. However, the inputs that are imported, such as production of fertilizers, feed concentrate, and fuel, are not considered in these agricultural sector emissions. Therefore, a life cycle perspective of all the imported and domestic inputs is needed to evaluate the environmental impacts of the Icelandic national-level cattle production system.
The aim of this study is thus to apply science-based efforts to enable a transition towards a more sustainable cattle production system in Iceland. To enable this transition, this study first evaluates the environmental impacts of cattle meat and milk production in Iceland at the national level using LCA. Second, this study identifies the material inputs and environmental hotspots in the production system. The final aim is to establish a list of input parameters, whose sensitivity influences and adds to the uncertainty of the environmental hotspot assessment. By doing so, this study provides information on the current status of environmental impacts of the cattle production system in Iceland and adds to the ongoing discussion and action prioritization on climate actions in Iceland.
2. Materials and Methods
2.1. Life Cycle Assessment
This LCA is a cradle-to-farm gate study analyzing the cattle meat and milk production in Iceland. The cattle system in Iceland produces meat and milk and can thus be termed as an interconnected system with animals from the dairy system moving to the beef system. The production system is categorized into two specific sub-systems, i.e., the dairy cattle and the beef cattle systems. The dairy cattle system produces two products, milk and meat, while the beef cattle system produces only meat [32].
The system boundary of this study (Figure 1) includes all the relevant inputs of resources, energy, and materials from cradle-to-farm gate. The functional units (FU) used in this study are “1 kg of edible cattle meat” for the meat production and “1 kg of fat and protein corrected milk” (FPCM) for the milk produced in Iceland in 2019.
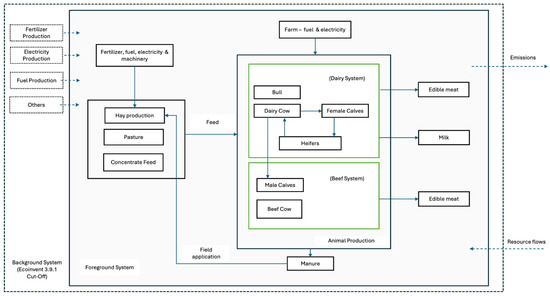
Figure 1.
System boundary of cradle-to-farm gate assessment of cattle production in Iceland in this study.
Although this study does not include post-farm activities in the assessment, it assesses the environmental impacts at different production stages for easier comparison with other studies. These include assessment at the farm gate as 1 kg of live weight (LW), 1 kg of carcass weight (CW) at the slaughterhouse, 1 kg of edible meat (at the retail stage), and 100 g of edible meat proteins. By doing so, it is possible to compare the result of this study with the literature available from different geographic locations. Furthermore, by also assessing the impact per 100 g of edible meat proteins, this study adds valuable knowledge to the current discussions in Iceland on sustainable and healthy diets.
In this study, the term “edible cattle meat” represents the conversion of LW to retail weight, excluding bones [37]. Thus, conversion ratios between production stages vary among animal types and breeds. The applied conversion ratios are provided in Supplementary Materials (File S1), Section S1, Table S1a. Although various side streams at the slaughterhouse are utilized as co-products, such as fertilizer, there is little to no information available on the utilization of these side streams from the Icelandic slaughterhouses. Due to this reason, these side streams are not included in this assessment, and all the environmental impacts are allocated towards the meat and milk products emerging from the cattle production system. However, efforts and collaboration with slaughterhouses are needed to gather this information to fill the gap in future studies. Due to a lack of information on the use of veterinary products, they are also not included in this study.
The LCA of the cattle meat and milk production was conducted following the ISO 14040 [38] and ISO 14044 [39] standards, and it is classified as an attributional LCA. SimaPro version 9.5 [40] was used for conducting the LCA, along with Activity Browser [41] to conduct a global sensitivity analysis of both production systems included in this study. Both the background and secondary data for this study were based on the ecoinvent data 3.9.1 cut-off criteria [42]. This study addressed the multifunctionality in the dairy system between milk and meat production using mass, economic, and biophysical allocations, respectively, between the two products from the dairy cattle system. While the mass and economic allocation methods take into account the product mass and economic relationship between milk and meat, the biophysical allocation is based on using the feed energy and physiological feed requirements of the animal to produce meat and milk [43,44]. The environmental impacts are assessed using the ReCiPe 2016 v1.08 midpoint, hierarchist (H) perspective [45]. The reason for using ReCiPe 2016 v1.08 midpoint is that, as a first LCA study on cattle system in Iceland, ReCiPe’s comprehensive coverage of environmental categories provides the holistic view of the environmental impacts on which future research can be built to transition the cattle production system towards environmental sustainability.
2.2. Life Cycle Inventory
The life cycle inventory data in this study at the national level is compiled using various sources. These sources include farm data, national statistics, National Inventory Reports (NIR) of Iceland, and annual statements of the Icelandic cattle farmers’ association. In addition, where data was not available or sources contradicted each other, estimates were made. The inventory data for the cattle system used in this study, along with the relevant data sources used, is provided in Table 1. The inventory table provides the data at the national level for both cattle systems, while the inventory data per animal type for both systems is provided in Supplementary Materials File S1, Section S1, Table S2a,b.
The National Inventory Report of Iceland [32] does not differentiate the systems as dairy and beef cattle systems, and it provides the data for all the cattle together. Therefore, based on correspondence with the Icelandic Farmers’ Association, the systems in this study are classified as follows: the dairy cattle system comprises dairy cows, old heifers, heifers, female calves, and bulls (personal correspondence: Jóhannesson, 2023), while the beef cattle system comprises beef cows and male calves. The male calves are transferred from the dairy cattle system and are raised at the beef farms (personal correspondence: Jóhannesson, 2023). This classification is a simplification of the interconnected cattle system in Iceland due to the absence of exact numbers on the population of heifers, bulls, and male calves within the beef cattle system, as well as the lack of exact numbers of dairy male calves moving over to the beef cattle system. Furthermore, the national statistics and population data only provides the total number of calves in Iceland, and it does not distinguish between male and female calves. This led to a limitation of estimating the exact number of male calves that are transferred from the dairy to the beef system. Therefore, in this study, all the male calves are accounted for in the beef cattle system as a simplification. Additionally, this simplification has some implication to the allocation factors, as the calculation does not take into account the proportion of male calves in either of the three allocation methods. However, as separate records of feed or manure management are available for the calves in Iceland, the calves are modeled fully as part of beef cattle system, including male calves from both the dairy and beef system [32]. Additionally, the International Dairy Federation (IDF) [46] also provides guidance in the following cases: “in situations where data are readily available it is preferable, under the ISO guidelines, to employ system separation.” Therefore, all the resource inputs of raising the dairy male calves and their associated emissions are accounted for in the beef cattle system. Furthermore, no allocation is applied for manure, as it is utilized for the production of hay, which is used as feed for the animals within the system.
The animal characteristics of Icelandic cattle, including the average annual population, animals slaughtered, days spent in housing and pasture, and manure management system information, are obtained from the Farmers’ association, the Icelandic Agricultural Advisory Center (Ráðgjafarmiðstöð landbúnaðarins, RML) annual reports [47,48], and the NIR 2022 [32]. This data is provided in Supplementary Materials File S1, Section S1, Table S3. The inventory is therefore a formulation of different sources, obtained from the national sources and personal correspondence, combined with estimates from farm-level data [49] and previous work on GHG protocols by Brynjarsson et al. [50]. The reason for this approach is a lack of reliable published data, and inconsistencies between sources. This is a major challenge in Iceland, especially for a first LCA study of cattle production in the country. The Farmers and the Farmers Advisory Service keep data records both for breeding purposes and for obtaining governmental financial support in terms of subsidies. However, the Farmers’ Advisory, which is involved in record keeping, lacks most of the inventory data of materials used at the farm level that are relevant to conduct an LCA. Thus, the inventory formulated in this study is therefore the most detailed assessment available to date of the cattle farming in Iceland. Additionally, the term “national level” is used to describe the Icelandic total production output from the cattle system in 2019 of 2366 tons of edible meat from the dairy system, 546 tons of edible meat from the beef system, and 167,091 tons of raw milk. The inventory formulation is a combination of top-down and bottom-up approaches, allowing for a representative inventory at the national level [51,52,53]. For instance, the animal population (taken from national sources) represents the country’s total cattle population. While the feed intake data is available per animal in NIR 2022 [32], it is scaled up to estimate the feed intake of the total population. Figure 2 provides the total-feed-to-edible-product analysis, along with the point of allocation for the dairy cattle system, and Table 2 provides the allocation factors applied in the dairy cattle system. Additionally, the feed-to-edible-product analysis for the beef cattle system is provided in Supplementary Materials File S2, Section S1, Figure S1.

Table 1.
National cattle meat and milk production inventory, based on total number of animals produced in Iceland in 2019.
Table 1.
National cattle meat and milk production inventory, based on total number of animals produced in Iceland in 2019.
| Data | Dairy System | Beef System | Source |
|---|---|---|---|
| Animal | |||
| Total number of cattle | 67,870 | 13,166 | RML |
| Total live weight (tons) | 24,726 | 2663 | NIR and RML |
| Product | |||
| Raw milk (tons) | 167,091 | - | RML |
| Edible meat, system output (tons) | 2366 | 546 | E |
| Edible meat protein, system output (tons) (18.8 g to 21.5 g) per 100 g of meat | 445–509 | 103–117 | ÍSGEM |
| Feed | |||
| Hay at housing (tons dry matter (dm)) | 135,636 | 9311 | NIR |
| Hay at pasture (tons dm) | 19,218 | 8670 | NIR |
| Compound feed (tons dm) | 55,745 | 1836 | NIR |
| Barley (tons dm) | 5710 | - | NIR |
| Arable land, hay cultivated (ha) | 64,963 | 12,602 | E, SI, NIR |
| Arable land, pasture (ha) | 106,293 | 25,213 | SI |
| On-farm activities | |||
| Fuel agricultural machinery (m3) | 5279 | 1024 | FD |
| Electricity (GWh) | 60.33 | 11.7 | FD |
| Fertilizer-hay production | |||
| N (tons) | 6353 | 1232 | E, SI |
| P (tons) | 1064 | 206 | E, SI |
| K (tons) | 1796 | 348 | E, SI |
| Fertilizer manure (tons) | 7705 | 1495 | E, FD |
E, estimate; NIR, National Inventory Report 2022 [32]; SI, Statistics Iceland [31]; ÍSGEM, the Icelandic database on the chemical content of food [37]; FD, farm data [50]; RML, Ráðgjafarmiðstöð landbúnaðarins [47,48]. The combination of sources, for example E and SI, or E and FD, indicates that estimates are based on sources SI and FD. The data on animal characteristics and inventory based on per animal type is provided in Supplementary Materials File S1, Section S1, Tables S1–S3.
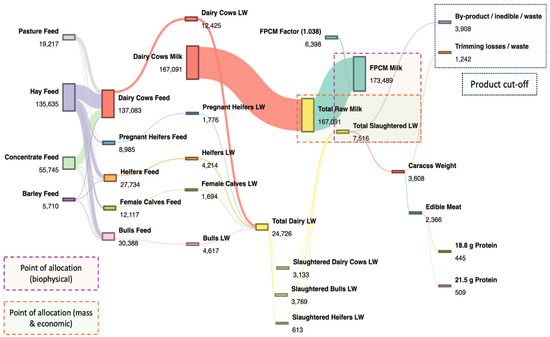
Figure 2.
Mass flow analysis of the national-level feed to dairy meat and milk products at different production stages. LW, live weight; CW, carcass weight; EM, edible dairy meat and protein. All values are presented in tons.
Table 2.
Effects of allocation method applied on the multifunctionality between milk and meat in the dairy cattle system.
Feed for the dairy cattle system comprises hay that is locally produced in Iceland, along with imported feed concentrate, local barley, and pasture grazing [32]. In the case of beef cattle, locally produced hay and pasture grazing are the only feed sources for the animals. However, the male calves that are transferred from the dairy system to the beef production for fattening consume feed concentrates [32]. Furthermore, estimates of animal feed and its composition are provided in Supplementary Materials File S1, Section S1, Table S5. The detailed descriptions of the feed, on-farm electricity and fuel use, and fertilizers are provided in Supplementary Materials File S2, Section S1. Due to lack of information on country of origin of feed, this study utilizes ecoinvent market activities (global and rest of the world) to model the feed concentrate, including its average transportation distance mix. Furthermore, the transportation distance of locally produced hay to farm is not included in this study, since hay is generally produced on the farm or close to the farm.
Additionally, the associated GHG emissions from the animal production (CH4) and nitrous oxide (N2O) are calculated using the Intergovernmental Panel on Climate Change (IPCC) 2019 [54]. The other emissions arising from the animal production, such as ammonia (NH3), nitrogen (N2), Non-Methane Volatile Organic Compounds (NMVOCs), and particulate matter (PM) from manure management from the animal housing, are calculated using the European Environment Agency (EEA), 2019, Chapter 3.B [55].
This study uses the Tier-2 method to calculate the GHG and ammonia emissions based on animal characteristics such as the total animal population, gross energy intake, housing period, amount of nitrogen intake, and amount of nitrogen excreted. Currently there are no published on-site measurements of the GHG and ammonia emissions available in Iceland. Therefore, this study employs default emission factors provided for Tier-2 methods to evaluate these emissions. For a description of the emission calculation method, please refer to Supplementary Materials File S2, Section S1. All emission estimates and their justifications are provided in Supplementary Materials File S1, Section S2, Tables S9–S13. The descriptions of all three allocation methods (mass, economic, and biophysical) are provided in Supplementary Materials File S2, Section S1.
The calculations and parameters for the allocation factors are provided in (Supplementary Materials File S1, Section S1, Table S1b).
2.3. Global Sensitivity and Uncertainty Analysis
This study approaches the environmental impact sensitivity and uncertainty analysis in two steps. First, an uncertainty analysis was performed using the Monte Carlo (MC) analysis to estimate the range of the environmental impacts of the overall result of the dairy and beef cattle systems. The MC analysis is therefore performed with 5000 runs for both the meat and milk products, with a 95% confidence interval, using the pedigree matrix approach [56,57]. The uncertainty factors of the foreground system data, using the pedigree matrix method following a log-normal distribution, are provided in the Supplementary Materials File S1, Section S3, Table S14. For the background database, pre-defined uncertainty values already available in the ecoinvent database were used [42]. Second, this study applies a global sensitivity analysis (GSA) that follows [58]. The GSA is conducted in the Activity Browser [41], based on uncertainty values obtained from the pedigree matrix approach for the foreground process and pre-defined uncertainty values from the ecoinvent database. The two primary metrics used to analyze the GSA results are the (δ) estimate and the first-order sensitivity index (S1) [58].
3. Results
3.1. Hotspot Identification and Multifunctionality Effects
The total characterized ReCiPe midpoint impacts for both cattle systems per FU are depicted in Table 3. In the dairy cattle system, the magnitude of the environmental impact of the two products, milk and meat, varies based on the allocation method used. However, the proportional contribution of the life cycle processes to the overall impact remains consistent for both products, irrespective of the allocation method applied. This is because the allocation method distributes the environmental impact between the two products, keeping the relative contribution of underlying processes the same for both products. Figure 3a presents the hotspot analysis of all ReCiPe midpoint environmental impact categories for the dairy cattle system. The hotspot analysis provides the contribution of each process towards each environmental impact category. Animal production, feed hay production, and feed concentrate production are the three processes that contribute the most to the multiple environmental impact categories for the dairy cattle system.
Table 3.
The total characterized midpoint environmental impact of 1 kg of edible dairy meat, 1 kg of FPCM milk, and 1 kg of beef meat.
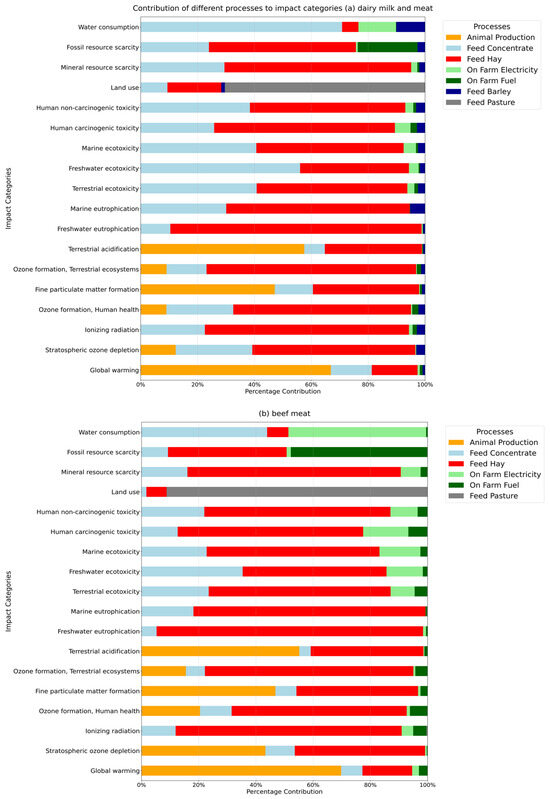
Figure 3.
Contribution analysis of different life cycle-process ReCiPe 2016 v1.08 midpoint (H) categories for (a) dairy cattle and (b) beef cattle production systems.
Animal production (Section 3.1) is a hotspot that contributes over 40% of the following environmental impact categories: global warming, terrestrial acidification, and fine particulate matter formation. For other environmental impact categories, feed hay (Section 3.2.2) is the primary hotspot, contributing over 40% to twelve environmental impact categories (Figure 3a). Additionally, feed concentrate (Section 3.2.3) is the second most contributing feed process, with over 20% contribution across twelve environmental impact categories (Figure 3a). Other processes have smaller proportional contributions to the environmental impacts across the eighteen categories. These other processes, such as on-farm activities which include the electricity and fuel use at the farm, feed barley, and pasture, have more focused impacts on particular environmental categories. For instance, on-farm electricity use contributes to 13% to the total water consumption impact, due to the intensive water utilization provided from the hydropower and geothermal energy during electricity production in Iceland. Similarly, feed (barley) contributes to 10% of the total water consumption impact, along with small contributions across other environmental categories.
On-farm fuel use contributes 21% to the total fossil resource scarcity, reflecting substantial oil use at the farm level. Feed (pasture) then contributes 70% to land use, emphasizing the extensive land used for pasture in the dairy cattle system. Furthermore, in the dairy cattle system, the allocation method significantly influences the total deterministic characterized result across all impact categories. There is high variability in the case of edible dairy meat, with an increase of nearly six times from mass allocation (M) to biophysical allocation (B). In contrast, the magnitude of the impact of FPCM milk from (B) is reduced by 0.23 times the impact of (M), showing less variability to the allocation method compared to meat.
The beef cattle system follows a similar trend to that of the dairy system, identifying animal production and feed (hay and concentrate) as major hotspot processes. However, the magnitude of the environmental impacts and the proportional contribution of these processes differ from those of the dairy cattle system. Figure 3b illustrates the hotspot analysis of all ReCiPe midpoint categories for the beef cattle system. Additionally, the results per LW, CW, edible part, and 100 g of protein for the dairy and beef meat products are presented in Supplementary Materials File S3, Sections S1 and S2 (Tables S18–S33).
3.2. Main Hotspot Processes
3.2.1. Animal Production
For both cattle systems, the critical environmental emissions from the animal production process include enteric and manure methane, dinitrogen monoxide, ammonia, particulate matter, and NMVOC to air. Enteric methane emissions are due to biological processes within the animals, while the other emissions are due to manure management practice during housing and pasture grazing. Supplementary Materials File S3, Sections S1 and S2 (Tables S18–S33), provides the deterministic contribution of the animal production to the total impacts for the different environmental categories per FU for both cattle systems.
Animal production is a vital hotspot process in both the dairy and beef cattle system for global warming (GW). The process contributes to 67% of the dairy and 70% of the beef cattle systems’ total global-warming impacts. This major contribution to the total global-warming impact from the animal production process is driven mainly by methane emissions. Enteric and manure methane emissions combined account for 66% (out of 67%) of the GWP for dairy, and 64% (out of 70%) for the beef system during the animal production stage. Most of these methane emissions are enteric methane, in comparison to the contribution from manure methane emissions. The remaining contributions to global warming from animal production are due to dinitrogen monoxide emissions, manure management at housing, and pasture grazing for both the dairy and beef systems. The N2O emissions originating from the animal production stage are about 1–6% for both systems. The enteric methane emission is calculated using Tier-2, with the default methane conversion (Ym) factor of 7.0% for the beef cows, and 6.5% for the dairy cows and all other animals [54]. This distinction reflects typical dietary systems, where dairy herds generally receive concentrate feed, hay, and pasture grazing, whereas the beef cows in Iceland utilize hay and pasture grazing only. Manure methane emissions utilize the default maximum methane producing capacity (B0) factors based on regional defaults. The methane conversion factors (MCF) are based on manure management systems, for the cool climate zone (moist), in this study [54]. The Tier-2 method allows us to estimate these emissions based on activity data: gross energy intake, animal population characteristics, manure handling, and animal housing and grazing patterns. Emission factors convert this data into methane and nitrous oxide emissions. As Iceland-specific emission factors are not yet available, future studies should develop Iceland-specific factors to estimate these emissions. In the absence of these factors, this study employs uncertainty and global sensitivity analysis to estimate the influence of emission estimates on the overall GW impact (see Section 3.4 and Section 4.3)
The second highest hotspot contribution from the animal production is to terrestrial acidification. The process contributes to 58% of the impact in the dairy system, and to 55% of the beef cattle total impact on the category, which is solely due to ammonia emissions from the manure management at housing and pasture grazing in both cattle systems. Subsequently, the animal production contributes 47% to the fine particulate matter formation total impact for both the dairy and beef cattle system. Most of this contribution is driven by ammonia emissions, or 44% of the dairy cattle system and 41% of the beef system, while 3–4% from the PM2.5 emissions originate from manure management.
For stratospheric ozone depletion, the animal production process accounts for 12% of the dairy cattle system impact, and 43% of the beef cattle total impact. This contribution to the stratospheric ozone depletion is solely due to dinitrogen monoxide emissions from manure management. Lastly, animal production contributes to ozone formation, human health, and the terrestrial ecosystem, but the process contributes to 9% for both ozone formation sub-categories in the dairy system. In the beef system, the animal production process contributes 20% of the ozone formation and human health, and it provides a 16% contribution to the terrestrial ecosystems sub-category. The emissions that lead to this contribution to both ozone formation impact categories are nitrogen dioxide (NO2) and NMVOC emissions from manure management. The underlying technosphere and biosphere flow contributions from the animal production towards all the environmental categories are provided as a heat map in Supplementary Materials File S2, Section S3. Figures S7–S24.
3.2.2. Feed
Different types of feed, utilized in both cattle systems, are hotspot processes across multiple environmental categories. In both cattle systems, certain feed processes, such as pasture, concentrate, and hay, have the same underlying processes and emissions, thus leading to similar input components being identified as hotspots for these feed processes for a particular environmental impact category. The difference, though, lies in the magnitude of these input components and their contributions to each category, which varies between the cattle systems. Therefore, the results of the feed hotspot analysis are provided as feed contributions to the dairy and beef cattle systems, respectively, followed by the relative contributions of the critical input components that are hotspots within that feed process. Supplementary Materials File S3, Sections S1 and S2 (Tables S18–S33), provides the deterministic contribution of all feed processes across all impact categories per FU for both cattle systems. However, the underlying technosphere and biosphere flow contributions from different feed processes for all the environmental categories are provided as a heat map in Supplementary Materials File S2, Section S3, Figures S7–S24.
3.2.3. Feed Pasture and Barley
Feed processes such as pasture are hotspots for the land-use impact. For instance, feed pasture is the only major hotspot process for the land-use impact, accounting for 70% of the dairy and 91% of the beef cattle systems’ total land-use impact. This difference in contributions between the systems is because the dairy cattle system relies on multiple feed inputs, such as hay, barley, and concentrate, along with pasture grazing, for its feed requirement. Meanwhile, the beef cattle system, especially beef cows, solely relies on pasture grazing and hay for its feed requirement. The result of this difference in feed fulfillment is that the land area used for feed from pasture is relatively high in the beef cattle system compared to the dairy cattle system. One of the limitations of this result is that the land area allotted to pasture grazing in both cattle systems is modeled as the total population feed requirement that is fulfilled by pasture grazing divided by the land area available for the total cattle population from pasture in each cattle system. This is a simplification of the land-use impact from pasture, as it does not account for the grazing density and the vegetation available on the pasture land for the animals to fulfill their feed requirements. Barley feed is only utilized in the dairy cattle system and has a small contribution across all impact categories. However, the barley process contributes about 10% to the water consumption and 5% to the marine eutrophication total impacts within the dairy cattle system. The contribution to eutrophication is primarily due to nitrate (NO3−) emissions into water. An important aspect of barley feed’s contribution to these systems is that, though it is small, it is a mix of local and imported feed for the growth and wellbeing of the animals. Furthermore, barley feed is also one of the ingredients in the feed concentrate mix. Thus, there are two inputs of barley in the dairy cattle system, one as feed barley and one as a part of the feed concentrate mix.
3.2.4. Feed Hay
Feed hay is a hotspot process for multiple environmental impact categories in both cattle systems. The primary reason for feed hay to be a hotspot process is the low hay yield in Iceland (about 4000–5000 kg dry matter/ha), predominantly due to its cold climate, and high fertilizer use to sustain the hay production. These hotspot contributions can be traced back to three main feed hay processes, which are hay cultivation, production of nitrogen fertilizer, and, in a few cases, dry hay storage. Other feed hay processes contribute to a moderate degree to these environmental impacts. Figure 4 provides the contribution analysis of the different feed hay processes to the cattle systems.
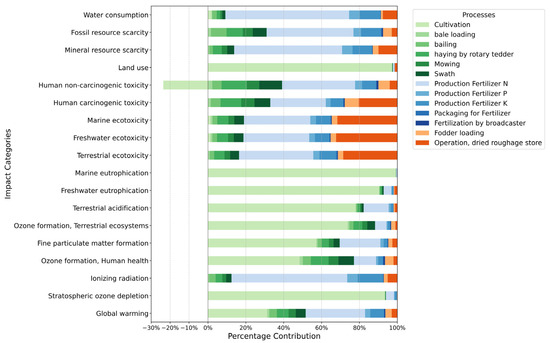
Figure 4.
Contribution analysis of feed hay production processes for all 18 ReCiPe impact categories.
To provide a more comprehensive assessment of the feed hay impact, the relative contributions of the underlying feed hay processes are expressed as percentages of the total impact for each environmental impact category, summing up to 100%. Feed hay accounts for 16% and 17% of the global-warming impact within the dairy and beef cattle systems, respectively. Within the feed hay processes, the underlying processes that are hotspots for the global-warming impact are hay cultivation (contributing to 31% of the GW), and nitrogen fertilizer production (contributing to 31% of the impact). The main constituent of the GHG emissions from the feed hay process are dinitrogen monoxide (33%), of which the majority is due to hay cultivation (31%). Carbon dioxide accounts for 58% of the GHG emissions, but most of these carbon dioxide emissions are due to the production of nitrogen fertilizer (27%). When it comes to the stratospheric ozone depletion, the feed hay accounts for 57% and 46% of the total impact in the dairy and beef cattle systems, respectively. Within the feed hay processes, the underlying process that is the main hotspot for the stratospheric ozone depletion is hay cultivation (contributing to 93% of the impact), which is solely due to dinitrogen monoxide emissions.
Feed hay also has a major contribution to the ionizing-radiation impact, about 72% and 79% of the dairy and beef cattle systems, respectively. Within the feed hay processes, the underlying processes that are hotspots for the ionizing radiation are the fertilizer production processes, including nitrogen (61%), potassium (13%), and phosphorus (6%). However, the underlying constituent from these three fertilizer production processes is radon-222, which accounts for 95% of the ionizing-radiation impact from the feed hay process.
Furthermore, in the case of ozone formation, affecting human health and terrestrial ecosystems, the feed hay processes contributed to 63% and 74%, respectively, of the total impacts in the dairy system, and to 61% and 73%, respectively, in the beef cattle system. Within the feed hay process, the underlying processes that are hotspots for the ozone formation on human health and terrestrial ecosystems are the hay cultivation (48% and 74%, respectively) and production of nitrogen fertilizer (12% and 6%, respectively), while agricultural operations contribute to the remainder of the impacts. These impacts are driven by nitrogen monoxide emissions solely from hay cultivation, while the nitrogen oxides and NMVOC emissions from multiple processes make up the remainder of the emissions for both impact categories. Compared to the other environmental impacts, feed hay has a moderate contribution to fine particulate matter formation, or 37% and 43% of the total impacts of the dairy and beef cattle systems, and contributes 34% and 39% to the terrestrial acidification total impact in the dairy and beef system, respectively.
The feed hay underlying processes that are hotspots for both impacts categories (fine particulate matter formation and terrestrial acidification) are hay cultivation (57% and 78%, respectively) and production of nitrogen fertilizer (21% and 13%, respectively). In the case of fine particulate formation, the hotspots are due to ammonia (causing 56%), sulfur dioxide (23%), and PM 2.5 (9%) emissions. Similarly, the terrestrial acidification impact from feed hay is driven by ammonia (79%) and sulfur dioxide (14%) emissions.
In the case of eutrophication, feed hay has a relatively high contribution towards freshwater (about 88% and 93%) and towards the marine ecosystem (65% and 81%) for the dairy and beef cattle systems, respectively. The feed hay process that is a hotspot in both eutrophication impacts is hay cultivation, causing 90% and 99% of the impact for freshwater use and marine eutrophication, respectively. These high contributions from the feed hay process, causing freshwater eutrophication, are mainly due to phosphorus (86%) and phosphate (13%) emissions to water, which mainly occur during hay cultivation. The marine eutrophication is, however, solely due to nitrate emissions to water from the hay cultivation process.
The toxicity impact of the feed hay processes is also notable and substantial, with terrestrial ecotoxicity causing 53% and 64%; freshwater ecotoxicity causing 38% and 50%; marine ecotoxicity causing 52% and 60%; human carcinogenic toxicity (64% and 65%), and lastly, Human non-carcinogenic toxicity (55% and 65%) of the total impact for the dairy and beef cattle systems, respectively. In case of all the toxicity impacts, the two underlying hay processes that are hotspots are the production of nitrogen fertilizer, followed by operation, and dried roughage store (See Figure 4). These toxicity impacts to different sub-class can be attributed to the emissions of, in case of terrestrial ecotoxicity, to copper ion (air) 73%, for freshwater and marine ecotoxicity, they are attributed to copper ion (water), 66% and 60%, respectively; and zinc II (water), 25% and 27%, respectively. Furthermore, the impacts to human carcinogenic toxicity are mainly due to chromium VI (95%) emissions, while human non-carcinogenic toxicity is mainly due to emissions of zinc II (water) (55%) and arsenic ions (water) (16%). Additionally, the negative emissions in Figure 4 are due to uptake of heavy metals by the hay biomass. The mass balance of this relationship is estimated in Supplementary Materials File S1, Section S2, Table S13.
Additionally, feed hay has a relatively small contribution to water consumption (6% and 7%) and land use (19% and 7%) of the total impacts in the dairy and beef cattle systems, respectively. However, in the case of other resource uses, feed hay has a relatively high contribution for mineral resource scarcity (66% and 75%), and for fossil resource scarcity (52% and 41%) of the dairy and beef systems’ total impacts. For both resource scarcity impacts, the underlying feed hay processes providing hotspots are the production of the fertilizer components, nitrogen and potassium.
3.2.5. Feed Concentrate
Feed concentrate is a hotspot process for multiple environmental impact categories, and its contribution to these environmental categories can be further disaggregated into its ingredients. To provide a more comprehensive assessment, the contributions of these ingredients are expressed as relative percentages within the feed concentrate’s total impacts for each category, summing up to 100%.
Feed concentrates account for 14% of the dairy system’s and 7% of the beef system’s total global-warming impacts. In descending order, the contributions of the feed concentrate ingredients are soybean (50%), maize (21%), wheat flour (15%), and barley (8%), while other ingredients together make up about 6% of the total GW. The key GHG emissions from these ingredients are carbon dioxide (fossil fuel-based) (33%), and carbon dioxide (land transformation-based) (44%), followed by dinitrogen monoxide (18%), and methane (fossil fuel-based) at about 4% for both cattle systems. The substantial carbon dioxide emissions from land transformation and fossil-fuel use highlight the global warming contribution of the feed ingredients, obtained by converting forests and grasslands into agricultural land, alongside the utilization of fossil fuels throughout the feed production processes. Furthermore, the feed concentrate accounts for 27% of the dairy and 10% of the beef systems’ total stratospheric ozone depletion impact. This contribution is solely due to dinitrogen monoxide emissions from various feed ingredients and can be attributed to fertilizer applications and other feed production activities. The key contribution to stratospheric ozone depletion originates from wheat flour and maize (31% and 30%, respectively), soybean (18%), and barley (16%), while other feed ingredients make up for the remaining small contribution.
The key emission to the ionizing-radiation impact from the feed concentrate is radon-222 (about 94%). The main feed concentrate ingredients that are hotspots are maize (33%), wheat flour (20%), barley (17%), soybean (12%), and mineral supplements (8%). These contributions lead to feed concentrates accounting for 23% of the dairy and 12% of the beef systems’ total ionizing-radiation impacts. The radon-222 emissions in the feed supply chain can be traced back to the electricity production, which is mostly nuclear in the region where the feed production takes place. Since these are modeled as global activities, a direct contribution to a specific region is difficult to establish. This points out the intricacies in the global feed supply chains and their impacts on other environmental categories, apart from global warming. In the context of ozone formation, the feed concentrate contributes 24% of the impact on human health, and 14% on terrestrial ecosystems of the dairy cattle system. For the beef system, this feed contributes 11% to human health, and 7% to terrestrial ecosystems of the total impact for both cattle systems. Nitrogen oxides (NOx) emissions from various feed ingredients are responsible for 94% and 90% of the ozone formation impact on human health and terrestrial ecosystems, respectively. Additionally, NMVOC emissions to air account for the remaining minor contribution to ozone formation. The ingredients that are driving the ozone formation impacts are maize (33%), wheat flour (22%), soybean (17%), and barley (13%). Other feed constituents make up for the remaining minor contributions. These emissions of nitrogen oxide and NMVOCs that lead to ozone-formation impacts are emitted throughout the agricultural systems, from the feed, and from the animal housing, and are due to photochemical reactions forming ozone, which impacts human health and plant species, where emitted.
Feed concentrates account for 13% of the dairy and 7% of the beef systems’ total fine particulate matter formation impact. These contributions are driven by maize (29%), soybean (25%), wheat flour (21%), and barley (11%), while the remaining ingredients make up for the remaining 14%. Emissions from these ingredients contribute to fine particulate matter formation: PM2.5 (36%), ammonia (25%), sulfur dioxide (22%), and nitrogen oxides (16%). Similarly, for terrestrial acidification, feed concentrates account for 7% of the dairy and 4% of the beef systems’ acidification impacts, which are due to ammonia (61%), sulfur dioxide (23%), and nitrogen oxide (16%). Other environmental impacts are only affected minimally. The ingredients that are driving the terrestrial acidification impact are maize and wheat flour (both at 32%), and barley (13%), while the remaining constituent attribute to 3–9%. Furthermore, the contribution to freshwater eutrophication (10% of the dairy and 5% of the beef systems’ total impacts) is driven by wheat flour (40%) and maize (27%). The primary emissions from these ingredients that are contributing to the freshwater eutrophication are phosphate (54%) and phosphorus (42%), which are emitted into the water. In comparison, the marine eutrophication contribution from the feed concentrates is 30% of the dairy and 18% of the total impact of the beef system, and it is solely due to nitrate emission (99%) to water. However, marine eutrophication is driven by the production of soybean (28%), wheat flour (25%), barley (24%), and maize (17%), with feed proteins accounting for 6%.
Feed concentrate also impacts various toxicity categories across the dairy and beef cattle systems. In total, it makes up 41% of the dairy system’s and 23% of the beef system’s total terrestrial ecotoxicity impact due to the feed concentrate, driven by heavy metal emissions of zinc-II (22%) and copper ions (49%) into the air, while the remaining contribution originates from other heavy metals. The hotspot ingredients that are driving the terrestrial ecotoxicity impact are mineral supplements (33%), soybean (23%), and maize (19%). For freshwater ecotoxicity, the feed concentrates contribute to 56% of the dairy system’s and 35% of the beef system’s total impacts. This is mainly due to copper ions (20%) and zinc-II (9%) being emitted into water, and chlorpyrifos (62%) being emitted into soil. In the case of freshwater ecotoxicity, the ingredients that contribute to these emissions are soybean (68%), maize (10%), and mineral supplements (9%).
Another toxicity environmental category for which feed concentrate is a hotspot is marine ecotoxicity. The feed concentrates account for 41% of the dairy system’s and 23% of the beef system’s total impact within this category. The main contributing emissions for the marine ecotoxicity impact are copper ions (35%) and zinc-II (19%) emissions to water, and chlorpyrifos (28%) to soil. The hotspot ingredients that drive these emissions are soybean (42%), mineral supplements (17%), and maize (16%).
Feed concentrates also account for 26% and 13% of the total human carcinogenic toxicity impact for the dairy and beef cattle systems, respectively. This impact is largely due to chromium-VI emissions, including 92% into water and 2% into air. The main hotspot ingredients are maize (33%), wheat flour (22%), and barley (15%). For human non-carcinogenic toxicity, the feed concentrate contributes 38% and 22% to the dairy and beef cattle systems’ total impacts, respectively. This is mainly due to zinc-II being emitted into water (42%) and air (8%), as well as acephate being emitted into soil (13%), and arsenic ions being emitted into to water (11%); other heavy metals make up the remaining impact. The primary ingredients of the feed concentrate that are hotspots for this impact category are mineral supplements (25%) and maize (22%), contributing to human non-carcinogenic toxicity.
The land-use impact from the feed concentrates is relatively low. It accounts for 9% of the dairy system’s and 2% of the beef system’s total land-use impact. Feed concentrates have a moderate contribution to mineral resource scarcity in the dairy and beef systems, causing 29% of the dairy system’s and 16% of the beef system’s total impacts. Within this contribution, the main biosphere flow is the use of raw phosphorus in fertilizers, accounting for 56% of the feed concentrate-related impact. Iron use is the second most-used biosphere flow, contributing around 11% of the feed concentrate impact in both systems. Most of the impact can be attributed to mineral supplements (which account for 44%), maize (18%) and wheat flour (15%). Feed concentrate production also requires significant oil use, which contributes 47% of the total fossil resource scarcity impact, while natural gas contributes 29%, and coal contributes 22%. The feed concentrate thus contributes to 24% of the dairy system’s and 9% of the beef system’s total fossil resource scarcity impact, and the impacts are driven by maize (35%), wheat flour (23%), barley (15%), and soybean (13%). Lastly, the impact on water consumption from the feed concentrate is substantial, accounting for 71% of the dairy system’s and 44% of the beef system’s total impacts on this category. The main hotspot contributors for this substantial water use are wheat flour (32%), soybean (25%), maize (22%), and barley (9%), with other components making up the remainder.
3.2.6. On-Farm Activities
On-farm fuel process accounts for 21% of the dairy system’s and 48% of the beef system’s fossil resource scarcity total impact, and 92% of the on-farm fuel usage impact originates from crude oil use. The technosphere flow of the on-farm fuel is diesel, modeled as a market activity. In addition, on-farm fuel use also accounts for a minor contribution to other environmental impact categories, accounting for <2% and <8% within the dairy and beef systems, respectively. Furthermore, the on-farm electricity process in ecoinvent v. 3.9.1 [42]—technosphere flow: electricity, medium voltage (IS)—accounts for a moderate 13% of the total water consumption impact of the dairy system, and a significant 48% in the beef system. On-farm activities then had minor impacts on other categories, or about 1–5% of the dairy system and 10–16% of the beef system’s total toxicity impacts. The electricity is modeled using an ecoinvent process, which describes the market mix consisting mostly of hydropower and geothermal energy for Iceland. The hydropower process has been adapted by ecoinvent using the Switzerland hydro power process and adapting it for Icelandic conditions. The major hydropower plant in Iceland is reservoir-based, and only small-capacity plants are run off river systems. A recently published study [59] estimated the environmental impacts of hydropower electricity production in Iceland. It estimated that for 1 kWh of electricity generated at four hydropower plants (reservoir-based), an average water use from these four plants ranges from 4.9 × 10⁻⁵ to 1.4 × 10⁻⁴ m3 world-eq/kWh, which in comparison to ecoinvent (using the AWARE V1.05 method in SimaPro) estimates that the production of 1 kWh of electricity requires 0.032 m3 world-eq water use. This shows that future studies could benefit from modeling electricity water use based on Icelandic-specific data.
3.3. Normalized Impacts
The hotspot analysis of the dairy and beef cattle systems provides a comprehensive overview of the contributions of each process to the different environmental categories. However, the characterized results do not allow for a comparison of the magnitude of each impact among the environmental categories. Such an assessment is possible through normalizing the characterized midpoint results. This study uses the default World 2010 (H) normalization scale available with ReCiPe midpoint to provide a normalized analysis of the environmental impacts. The unit of the normalization scale is person equivalent (PE). Supplementary Materials File S3, Section S1, Table S20, provides the normalized results or both cattle systems per FU. In both cattle systems, a few impact categories have high impacts and stand out from the rest. In ascending order, these are marine ecotoxicity, freshwater eutrophication, and freshwater ecotoxicity, with the highest impact observed for human carcinogenic toxicity. Notably, land use stands out for the beef cattle system.
3.4. Uncertainty and Global Sensitivity Analysis
The stochastic midpoint characterized results for the dairy and beef cattle systems are presented as the mean values ± the standard deviation (SD) for each impact category, together with the coefficient of variation (CV), in Supplementary Materials File S3, Section S4, Tables S35–S42. The SD provides the amount of dispersion of impact values above and below the mean, while the CV is the ratio of SD to the mean, expressed as a percentage (%). This ratio provides a measure of the variability within the results. A high CV suggests high variability in the input data, indicating a high uncertainty in the result. The corresponding histogram plot of these uncertainties for both systems and products are presented in Supplementary Materials File S2, Section S2, Figures S2–S4. The histograms provide the spread of the total impact magnitudes for each impact category, along with the mean value for each cattle system. For both systems, the uncertainty in the midpoint characterized results is classified as either high or extreme (CV ≥ 50%); moderate (19% < CV < 50%); or low uncertainty (CV ≤ 19%).
A common trend is observed across the environmental categories for both systems. The environmental impact categories that have a high overall uncertainty for the dairy and beef cattle system, respectively, are freshwater ecotoxicity, human carcinogenic toxicity, human non-carcinogenic toxicity, ionizing radiation, and water consumption. The CV values for these impact categories are in several order of magnitudes. These high uncertainties are firstly due to the input parameter, and secondly, they are due to current limitations of the uncertainty method implementation in the LCA software.
The environmental impact categories that have a moderate overall uncertainty for the dairy and beef cattle system, respectively, are mineral resource scarcity (with CV values of 20% and 21% for the dairy and beef cattle systems, respectively), marine ecotoxicity (64% and 42%), and terrestrial ecotoxicity (33% and 39%). The environmental impact categories that have a low overall uncertainty for the dairy and beef cattle systems, respectively, are global warming (with CV value of 5% and 15%), fine particulate matter formation (7% and 12%), fossil resource scarcity (13% and 12%), freshwater eutrophication (16% for both), land use (9% for both), marine eutrophication (15% and 18%), ozone formation, human health (9% and 10%), ozone formation, terrestrial ecosystems (13% for both), stratospheric ozone depletion (10% and 12%), and terrestrial acidification (7% and 13%).
These uncertainty results for the environmental categories are due to several factors. The toxicity impacts are currently not fully understood, due to their complex fate and exposure modeling of chemicals, and the applied characterization factors may not be adequate to capture this relationship [60,61]. In the foreground model, the processes feed hay and concentrates are hotspots for the ecotoxicity, as well as the human carcinogenic and non-carcinogenic toxicity impacts in this study. The processes include certain heavy metal emissions, which often have negative values, due to the uptake of these emissions by the hay during cultivation. In this study, the heavy metal emissions are estimated using the SALCA method [62,63,64], which is based on the application of fertilizer and manure on the fields. Additionally, the emission of chlorpyrifos (an organophosphate insecticide) to the soil is a major contribution to the ecotoxicity impact. In this study, the heavy metal emissions are calculated only for the feed hay. However, it is also important to note that final fate of the heavy metals in the harvested hay is not accounted for in this study. This is due to lack of information on the hay feed analysis in Iceland. Additionally, Nemecek and Lansche [65] argues that by not considering the heavy metal uptake by plants, it is assumed that the final destination of heavy metals is the agricultural soil. This simplification does not consider the amounts of heavy metals ending up in hay feed either. Thus, to compensate for this, the heavy metal uptake by hay feed is considered in the modeling of the hay environmental impacts. Furthermore, EU directives of feed heavy metals provide a safe limit of heavy metals permissible in animal feed (Undesirable Substances—European Commission). Thus, this aspect needs to be further researched to fully account for the heavy metals’ impacts on animal feed and their impact on animal and human health in Iceland. Additionally, assessments of the cadmium, mercury, iron, copper, manganese, and zinc in the livers and kidneys of the Icelandic lamb [66] indicated that the concentrations of cadmium, mercury, and copper were low compared to other studies, and the cadmium concentration did not exceed the 46% of the proposed maximum level for cadmium in organs for human consumption. Based on this analysis of Icelandic lamb, which relies only on hay and pasture grazing, it can be assumed that a similar case for hay and pasture of cattle might be persistent. Additionally, evaluations of trace elements in Icelandic dairy products [67] found mercury to be below the detection limit, except for one sample of cheese. Future studies could benefit from the use of USEtox [60], along with damage assessment, to evaluate the impacts of hay production in Iceland.
Personal correspondence with the Pré Sustainability SimaPro support indicates that the current relation between the water inflow and outflow cannot be regarded in the assessment of the water consumption, and this is a known issue with the current implementations of the water consumption uncertainty analysis in SimaPro. Therefore, the result of the uncertainty assessment for the water consumption can be disregarded, in agreement with a similar observation made by [68]. Lastly, in the case of ionizing radiation, the high uncertainty is induced by the variability in the applied energy sources and energy mix in the upstream processes and fertilizer production. The energy mix used in the upstream data amplification of the uncertainty is used because of the nuclear energy in the electricity mix. This, along with use of the market process of these fertilizers, in absence of more accurate information on sub-types of these fertilizers, leads to high ionizing-radiation uncertainty.
Additionally, the deterministic environmental impacts of meat from both cattle systems are too close for us to make any substantial conclusions about the environmental performance of the meat from the dairy vs. beef cattle systems. Figure 5 provides the comparative uncertainty analysis between dairy cattle meat and beef meat. A comparative uncertainty analysis of edible meat dairy (biophysical) and beef production was conducted using SimaPro, where the MC analysis was conducted for both systems together, with fixed seed values and plotted against each other in scatter plots (Figure 5). The points above the diagonal indicate the region for which the beef meat has higher impacts, while the points below the diagonal line show the region where the dairy meat has higher impacts. According to the stochastic analysis result shown in Figure 5, the beef system generally has higher environmental impacts compared to the dairy system for most of the environmental categories, except for the environmental categories that have high or extreme uncertainty, where both systems have similar scatter plot spreads.
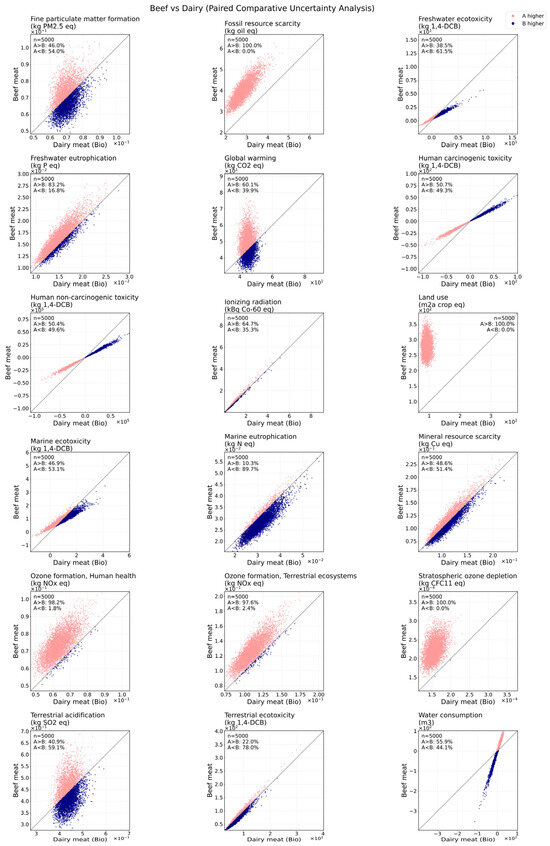
Figure 5.
Comparative uncertainty analysis, where the scatter plot compares the impact of beef meat to dairy meat (biophysical allocation) for all impact categories in alphabetical order. Each point on the scatter plot represents a paired simulation (A = beef meat) and (B = dairy meat). For the Monte Carlo results, the dairy meat is on the x-axis, and the beef meat is on the y-axis. The points are outcomes of paired simulations, and both systems are plotted together. The light red points indicate where the beef meat has higher impacts, while the dark blue dots indicate where the dairy meat has higher impacts. The diagonal line in each subplot represents equal impact between the two cattle systems.
The results of the GSA are provided in Supplementary Materials File S3, Section S5, Tables S43 and S44. A general trend is observed in the GSA analysis for the products from the dairy cattle system, with same inputs being the most sensitive for all three allocation methods for both meat and milk products. Therefore, only edible dairy meat (biophysical) allocation results from the dairy cattle system are discussed here, along with the beef system. Supplementary Materials File S2, Section S2, Figures S5 and S6, plots the S1 to (δ) of all the sensitive input variables for both cattle systems, highlighting the top three most influential input parameters both in emissions (biosphere) and processes (technosphere).
4. Discussion
The environmental impacts of meat products from the two cattle systems show different trends in terms of magnitude, yet the underlying reasons for these impacts are similar in many ways. Furthermore, the environmental impact attribution between milk and meat can be understood from these underlying characteristics. The reasons for different magnitudes of the environmental impacts lie in the number of animals; production outputs; and animal physical characteristics, feed characteristics, and the resource used.
4.1. Meat from Both Cattle Systems
In Iceland, the cattle system is dominated by dairy cattle, and about 85% of all the slaughtered animal’s live weight (LW) for meat production originates from the dairy cattle. In comparison, the beef cattle system makes up the remaining 15%. The dairy cattle breed has remained mostly the same since the age of settlement in Iceland (874–930 AD), [32] and compared to other Nordic breeds, the Icelandic dairy cow is small. The mature weight of Icelandic dairy cattle is about 17% smaller than other Norwegian and Swedish dairy cattle breeds [32], and it has a lower carcass weight compared to other Nordic breeds [69]. The beef cattle breeds in Iceland are Aberdeen Angus, Galloway, and Limousin breeds, all imported from Great Britain and France in the previous century, and the breeds have remained the same since [32]. Despite being of different breeds and serving different purposes, the mature live body weight is about 471 kg for the dairy cows and 470 kg for the beef cows (Supplementary Material File S1, Section S1, Table S1a). System efficiency can be evaluated using three intensive measures: (a) edible meat per animal in both systems (kilograms per animal); (b) edible meat per slaughtered animal (kilograms per slaughtered animal); and (c) edible meat per slaughtered animal LW (kilograms per kilogram), i.e., the total live weight of animals that are sent to slaughter. All values are estimated at the system level, meaning the measures are total edible meat in relation to total number of animals, total number of slaughtered animals, and total slaughtered live weight; calculations are provided in (Supplementary Material File S3, Section S3, Table S34). The dairy system comprises dairy cows, heifers, old heifers, female calves, and bulls, whereas, in this study, the beef system comprises beef cows and male calves.
In the dairy system, meat is produced along with milk production, whereas, in the beef system, meat is the primary output. All values aggregate edible outputs across all slaughtered classes within each system. From a meat-production perspective, the beef system delivers higher edible meat per animal in the system, i.e., 41.43 kg per animal compared with 34.86 kg per animal for the dairy system, indicating greater system-wide efficiency. The beef system also produces more edible meat per slaughtered animal: 139.05 kg per slaughtered animal compared with 125.88 kg per slaughtered animal for the dairy system. Lastly, the edible meat per kilogram of slaughtered animal LW is higher in the beef system, i.e., 0.41 kg per kilogram compared with 0.31 kg per kilogram for the dairy system, representing an approximately 30% relative advantage. Although the beef system is more efficient in converting slaughter live weight to edible meat on a per-unit (intensive) basis, it has a smaller herd, so its total edible output (an extensive measure) is lower than that of the dairy system.
The focus of this study is not on breeds and their biological characteristics, although there are a few points of interest in that domain. First is the gross energy intake, a parameter that directly influences the enteric methane emissions [54]. The gross energy intake of dairy cattle is higher than that of beef cattle, as it requires more energy for the milk production, while in beef cattle, the requirement of energy is more towards maintenance and body growth [70]. Second, the nitrogen excreted per dairy cattle is higher compared to beef cattle, resulting in higher total direct and indirect dinitrogen monoxide and ammonia emissions. In both cases, the term refers to the average gross energy intake, and the methane and dinitrogen emissions of all the animals in both the dairy and beef cattle systems. However, the environmental emissions of beef and dairy cattle systems are calculated based on Tier-2 methods, using default emission factors. Future studies should focus on site-specific measurements, and determining country-specific emission factors based on the climatic conditions of Iceland and local feed is a necessary step for accurately estimating the environmental emissions from these systems.
In addition to the physical characteristics of the animals, the other two most contributing processes that are hotspots are feed hay, concentrate, and, from a land-use perspective, pasture grazing. The feed composition used in the dairy and beef system is an important aspect, explaining the fundamental difference in the environmental impacts between the systems. For 1 kg of edible meat, the composition of feed for the dairy cattle system is around 64% hay, 26% concentrate, 8% pasture, and 2% barley, while the beef cattle system utilizes 48% hay, 44% pasture, and 8% concentrate. While the dairy cattle system is dominated by hay and concentrate, the beef system has a larger environmental impact due to hay and pasture. For the combined reasons discussed above, and the fact that the dairy cattle system serves a dual purpose, with milk as the primary product and meat as the co-product, the overall environmental impact of edible dairy meat is lower than that of beef.
4.2. Dual Purpose of the Dairy Cattle System
In the Icelandic dairy cattle system, the main factor influencing the environmental impacts of the two products meat and milk in this study is the allocation method. Three allocation methods were thus used to provide a wide range of results for these two products. A trend is observed in the allocation factors, with mass allocation resulting in the lowest allocation factor for meat, followed by economic allocation, while the biophysical allocation results in the highest factor for the meat. A reverse trend of this is observed for the milk, where biophysical allocation results in the lowest milk environmental impacts. A similar trend was also observed by Rice et al. [71] for the evaluation of the carbon footprint of grass-based dairy production in Ireland.
Mass allocation allocates the environmental impacts based on the mass output of these two products, 4.3% to meat and 95.7% to milk. Based on the allocation factor, this method allocates higher environmental impacts to the milk, and only a small fraction is allocated to the meat. The mass allocation thus oversimplifies the cattle system and underplays the environmental impacts of the meat, as the milk production amount is always higher compared to the amount of meat coming out from the dairy cattle system. Additionally, the mass allocation may be better suited for other sectors where mass is the key factor defining the relationship between two co-products. However, this is not an accurate representation of a livestock system, as the inputs are dependent on both the different animal types, and on the feed and energy compositions utilized to produce meat vs. milk.
On the other hand, by applying economic allocations, the environmental impacts are allocated based on the economic value of the meat and milk. In the Icelandic dairy system, the main economic driver of the system is the milk production, although the system also is the major meat producer in the country. However, the sheer amount of milk produced outweighs the economic value of the meat, leading to a higher allocation factor for the milk compared to the meat using this allocation method as well. Economic allocations are then also influenced by fluctuations in the market price and other economic externalities. However, Guinée et al. [72] indicated that the influence of such fluctuations in market prices can be reduced by taking into account the average price of the products over the year, making economic allocations one of the most used allocation method in agriculture LCAs.
Lastly, the biophysical allocation method allocates the highest percentage to meat among the three methods, as it considers the biological processes of the animal in the dairy system. While the economic allocation provides the real-world dynamics for producing milk or meat products by the farmers, the IDF 2015 [44] recommends biophysical allocations for dairy LCAs as a stable approach. This allocation method shifts the pattern compared to the other two allocation methods by allocating the highest factor to meat and the lowest factor to milk.
However, in the IDF 2022 [46], the updated version of the guidelines provides a new approach to the biophysical allocation, using the net energy requirement for milk and body mass growth, as described by Thoma and Nemecek [73]. However, further use of the biophysical allocation method is not applied due to lack of data on net energy requirement for growth and lactation of the animals. As in this study, the gross energy requirement for each animal is taken directly through the NIR 2022 [32]. However, standard values could be used to estimate the energy requirements [74], and future studies could benefit estimating updated biophysical allocation factors based on animal energy requirement for milk and meat. Additionally, the gross energy requirements available through the NIR 2022 [32] are more representative and therefore not estimated. This IDF 2022 [46] approach is beneficial, as it allows for more compressive allocations between milk and meat, taking also into account if the animal is transferred from the dairy to the beef system. The biophysical allocation method in this study considers feed and energy requirement of the animal for producing meat and milk using [44,75]. However, the approach has various limitations, as discussed by Ineichen et al. [76], such as restricted applicability to low beef-to-milk ratios, and does not accurately represent farms with dual purpose, i.e., farms with high meat output, as is the case for this study. As one factor that is limited due to availability of data is the modeling of dairy male calves in the beef system; if the male calves were included as part of the dairy system, this would slightly shift the allocation factors towards meat. In the case of biophysical allocation, the factor is calculated through AF milk = 1 − 6.04 × BMR, where BMR is the ratio calculated as (Mmeat/Mmilk). If it is considered that half of the male calves in beef system are coming from dairy and account them towards in dairy system. This would shift the BMR ratio and result in a slight decrease in allocation factor. However, the emission and resource use of the dairy male calves will be accounted in the dairy system, increasing the burden of milk in turn. Therefore, future LCA studies of the dairy and beef system in Iceland should utilize the biophysical allocation method, along with more representative animal population models. Lastly, considering the influence of the allocation method on the overall results, it is essential to apply different allocation methods to estimate the range of potential environmental impacts.
4.3. Data Quality, Uncertainty and Sensitivity
The addressed uncertainties in this study can be classified as parameter uncertainty and are due to methodology choices in the design of the LCA study [77]. Parameter uncertainty is due to different data sources and estimates used to formulate the life cycle inventory. Uncertainty due to methodology choices arises due to the chosen allocation methods used in this study. The parameter uncertainty is addressed using MC analysis and GSA. Meanwhile, the uncertainty due to the choice of allocation methods is addressed by assessing the influence of the three allocation methods on the overall environmental impacts of dairy system.
The choice of the allocation methods has an influence on the overall magnitude of the environmental impacts but does not affect the relative uncertainty (CV) across the impact categories. For instance, the CV value 5% for global warming remains consistent across all three allocation methods. However, the allocation factor itself has a certain parameter uncertainty that is not tested in this study. These uncertainties arise due to data quality and availability of information regarding the LW of animals, milk produced, and the market price of the meat and milk products.
The parameter uncertainty, using the MC analysis, provides the ranges of magnitude for each of the environmental impacts of both the dairy and beef cattle systems, while the GSA provides the most influential parameter using two measurements: delta (δ) and the first-order sensitivity index (S1). In the cattle system, the top input parameters for the global warming are methane from animal production, with high δ (0.42 and 0.46) and S1 (62% and 74%) for the dairy and beef cattle system, respectively, suggesting high influence on the output variance and sensitivity to the global-warming impact. These high δ values further underscore the need for reduction of methane emissions from the cattle system, through different management practices, and efficient feeding strategies [10]. However, high contributions to the variance of methane emissions reiterate the need for more reliable data on key parameters, like the gross energy intake, if using the IPCC 2019 [54], and Tier-3 modeling approach to estimate Iceland’s specific emission factors.
Feed-related inputs significantly influence the sensitivity and the output variance of multiple environmental categories. For instance, feed concentrate is one of the top influential inputs for 8 out of the 18 environmental categories, including ozone formation, terrestrial and human health, marine eutrophication, terrestrial ecotoxicity, fossil resource scarcity, water consumption, and human carcinogenic and non-carcinogenic toxicity in the dairy cattle system. Similarly, for the dairy system, feed hay-related inputs significantly influence the sensitivity and the output variance of 4 out of 18 environmental impacts, i.e., fine particulate matter formation, ozone depletion, mineral resource scarcity, and freshwater eutrophication. For a few impact categories, the influential input parameters include occupation of grassland; in the case of land use, this parameter is part of process feed pasture in both cattle systems. The emissions that the LCA results are sensitive towards are radon-222 for ionizing radiation, and phosphorus emissions from both fertilizer and manure applications in the process feed hay in both cattle systems. Another parameter is transport, from freight lorry as a part of background process to the impact of marine ecotoxicity. And the last parameter is the ammonia emissions from fertilizer and manure applications in the process feed hay to the impact of terrestrial acidification.
These three steps, deterministic LCA, uncertainty analysis, and GSA, enable further pinpointing of the hotspot and the key processes and inputs that are highly influential in both cattle systems. Most of these parameters come from the foreground system, with the exception of highly influential parameters in the background system. Thus, future LCA studies on the cattle system in Iceland should include more detailed data gathering of these inputs to make the assessment more comprehensive. Overall, there is a need for better data gathering and harmonization of key input data among different sources and stakeholders in Iceland, which is currently lacking. This assessment further underscores that the effort should be focused on reducing methane emission from the cattle and feeding strategies. Both are interlinked to each other; thus, the reduction of methane emissions and other GHG emissions is dependent on the feed production and changes in feeding, as shown by Flysjö et al. [78].
4.4. Comparison with Other Studies
Direct comparison with other studies of meat and dairy products is a challenging task and should be interpreted with caution. The LCA studies of dairy and beef cattle systems vary between countries and regions due to their different characteristics of animals, feeding requirements, manure management practices, and methodological choices used to conduct an LCA, to list a few. However, the comparison with other studies in the livestock LCA literature is generally performed to compare the environmental impacts of the products, including other regions and farming practices. However, due to the reason stated above, it is a difficult and challenging task.
The main animal characteristics that differ among the studies are the animal weight, and its LW-to-CW ratio, which is 48% for the dairy and 55% for the beef cattle system in this study, and the LW-to-edible-meat ratio, as described in (Section 4.1), and choice of allocation method (Section 4.2). In comparison with global averages obtained in a meta study of food products by Poore and Nemecek [2], cattle with an average CW of 52%, and by applying economic allocations, a FU of 1 kg of retail meat, the mean GHG emission are 99.5 kg CO2-eq for beef meat and 33.3 kg CO2 equivalent of the dairy meat based on IPCC 2013 [79], which is comparable to the ReCiPe global-warming impact. In comparison, the global-warming impact of the Icelandic cattle system, based on economic allocation for dairy meat, is 25 ± 1 kg CO2 equivalent/kg edible meat, which is closer to Poore and Nemecek’s [2] above-10th-percentile range of 18 kg CO2 equivalent/kg meat and 47 ± 4 kg CO2 equivalent/kg edible meat; and for beef meat, it is above the 10th percentile range of Poore and Nemecek [2], 40.4 kg CO2 equivalent/kg meat, for beef meat. Additionally, from a nutritional perspective, Poore and Nemecek [2] use 20 g of protein per 100 g of meat to estimate the GHG emission of beef and dairy meat on a protein basis. According to the Icelandic food composition database ISGEM [37], Icelandic beef has 21.5–18.8 g of protein per 100 g of meat. The global-warming impact of 100 g of dairy meat of Icelandic cattle using economic allocation is thus 12–13 kg CO2 equivalent, while it is 22–25 kg CO2 equivalent for beef meat, which is closer to [2]’s 10th percentile of 9.1 kg CO2 equivalent for dairy meat, and 20 kg CO2 equivalent for beef meat. In the case of milk, this study estimates the global-warming impact of 1.99 ± 0.1 kg CO2-equivalent (economic allocation); in comparison, Poore and Nemecek [2] estimate 1 L of pasteurized milk (4% fat and 3.3% protein) resulting in a mean impact of 3.2 kg CO2 equivalent, and a 10th percentile value of 1.7 kg CO2 equivalent.
When assessing the land use, this study estimates that for 1 kg of edible dairy meat (economic allocation), the required land use is 51 ± 2 m2a crop equivalent. Beef meat has a 279 ± 14 m2a crop equivalent, and milk has a 4 ± 0.4 m2a crop equivalent, which is higher than the 10th percentile estimates, and higher than the obtained mean values of 43.2 m2 (dairy), 326.2 m2 (beef), and 1,1 m2 (milk) seen in the study by Poore and Nemecek [2]. Additionally, Poore and Nemecek [2] use the CML2 Baseline to estimate acidification and eutrophication impacts of the products, which is not directly comparable due to the differences in characterization factors used. Furthermore, Poore and Nemecek [2]’s study included post-farm activities, and harmonization of multiple studies for the assessment, and is therefore not a direct comparison with this study.
Brynjarsson et al.’s study [50] used the IDF 2015 [44] biophysical allocation method to estimate the GHG emission from a typical dairy farm in Iceland for milk to be 1 kg of CO2 equivalent/1 L of energy-adjusted milk, corrected for fat and protein content, which is lower compared to the milk GHG emission of (biophysical allocation) 1.72 ± 0.1 kg obtained in this study. For the dairy meat, Brynjarsson et al.’s study [50] estimated GHG emissions of 18.2 kg CO2 equivalent/kg meat. The Brynjarsson et al. study does not specify if this kg of meat refers to 1 kg of edible meat or CW, making the comparison between studies even more challenging. However, the assessed GHG emissions of 1 kg edible meat in this study is 45 ± 1.2 kg CO2 equivalent, and 30 kg CO2 equivalent/kg CW. However, according to Brynjarsson et al.’s study [50], the estimated GHG emission for beef cattle is 23.4 kg CO2 equivalent/kg meat, which is lower than in this study edible beef meat (47.24 ± 4 kg CO2 equivalent), and 1 kg of CW is 35 kg CO2 equivalent/kg CW for meat from the beef system. This shows how different methodologies of estimating the global-warming impact yield varying results, and how challenging comparisons between studies with different units are. In addition, the specific farm data utilized in Brynjarsson et al.’s study [50] gives an accurate representation of the cattle population between the dairy and beef farms, and this is also one of the reasons for the difference in the global-warming impacts from this study.
Among the Nordic countries, Hietala et al. [26] demonstrated that the dairy-bred beef and meat-bred beef systems in Finland have an outcome of 24.9 and 32.1 kg CO2 equivalent/kg CW, respectively. Hietala et al. [26] use biophysical allocation and consider surplus calves sent to the beef system as a co-product, with 1% allocation factor to calves based on the IDF 2015 [44] allocation method. This differentiation is crucial when comparing the results of the dairy beef meat in this study, which is higher to that of [26]. It should be noted that the beef production from beef-specific cows is much smaller in Iceland compared to Finland, and the Finish cattle do not consume soybean meal or maize silage, which is the case in Icelandic cattle [26]. Additionally, it is difficult to compare aquatic eutrophication and acidification with the results obtained by Hietala et al. [26] due to different impact assessment and measure unit.
Similar to farmers in Iceland, Swedish farmers rely on imported proteins in their feed for their cattle systems. Sasu-Boakye et al. [23] studied the implication of imported and local feed scenarios and showed that GHG emissions can be reduced by 12% when local feed is used for protein. However, this reduction in GHG emission is overturned by overall land-use increase for the dairy cattle system, with a 25% increase in feed land use in Sweden in the dairy cattle system. However, due to climatic conditions of Iceland, an increase in local feed production is challenging, and efforts are being made to increase local feed production.
There are benefits of using forage-grain feed in comparison to forage only feed in terms of lower global-warming impacts, even if carbon sequestration is taken into account [28]. However, carbon sequestration has the potential to reduce emissions by 15–22%, as demonstrated by Hammar et al. [28] in a hypothetical case study in Sweden. This could be a beneficial avenue to explore for future studies to include carbon sequestration in LCA studies of the cattle system in Iceland. Due to its volcanic geography, the Icelandic soil carbon sequestration may be higher than elsewhere, as explored by Arnalds [80]. Furthermore, due to its colder climate and low crop yields, there is a need for higher fertilization of nitrogen in Iceland to maintain the hay production. As demonstrated in Section 3, hay feed has a high contribution to multiple environmental impacts. In this study, the GSA analysis identified the feed hay process as the third most influential parameter in the case of the dairy cattle system, and the second most influential process within the beef cattle system, on the global-warming impact. Although, the global-warming impact of feed hay is limited, Bonesmo et al. [24] demonstrated that there is a strong relationship between increased use of nitrogen fertilizer per ha grass production and GHG emissions. However, Bonesmo et al. [24] did not find any significant relationship between GHG emission intensity and per kg FPCM milk yield.
In regard to the studies that have applied the ReCiPe midpoint method to conduct LCAs of the cattle systems, Putman et al.’s study [81] estimated the environmental impacts of beef production in USA. However, their study does not differentiate between the dairy and beef cattle systems, and it estimates the environmental impact as combined beef (76% from beef and 24% dairy) by accounting for meat from the dairy and beef system as a singular beef supply chain. The results of Putman et al. [81] therefore are extracted up until the processing stage, and only compared with 1 kg of edible beef meat from this study. The Putman et al. [81] study had higher environmental impacts for only 2 out of 18 environmental categories, with differences in water consumption (+154%) due to irrigation in feed production in the USA. Stratospheric ozone depletion (+168%). The difference in both impact categories is due to different energy mixes used in USA in comparison to this study. However, despite these differences the key constituent of these emissions remains similar (Section 3). Additionally, the impacts of this study are higher than Putman et al.’s [81] in the ecotoxicity categories—terrestrial (+360%), freshwater (+550%), and marine (+386%); and in the case of human toxicity (carcinogenic, +287%; non-carcinogenic, +140%), land use (+43%), and fossil resource scarcity (+119%).
4.5. Limitations
The results of this study rely on the simplified animal population models that assume that the dairy cattle system contains dairy cows, old heifers, heifers, female calves, and bulls, while the beef cattle system comprises only beef cows and male calves. This division of the total cattle population to these systems at the national level provides an indication of the environmental impacts of these systems, as provided in Section 3. However, there is a need for a more compressive population model for these systems. In the Brynjarsson et al. study [50], the two farms that were investigated had a clear division of these animals, providing a realistic animal population structure for the assessment. The current population model used in this study has its limitations, as national statistics provide total animal population and do not classify between the dairy system and beef system, which is essential for evaluating environmental impacts of both systems. Perhaps a better approach would be to conduct a national-level study, including regional data and classifications of farms into different types, which would build up a national-level inventory. This would allow us to capture the variation in farm types and would provide a more comprehensive approach to estimate the environmental impacts of the dairy and beef cattle systems. Furthermore, different animal types use different formulations of the concentrates at different stages of their lives in the dairy system. Since only one feed composition was available while performing this study, this formulation was used for all the cattle in varying amounts, as provided by NIR 2022 [32]. This needs to be further investigated with more representative feed concentrate-mix data in future studies. Lastly, since on-farm fuel and electricity are hotspots in selected environmental categories, these parameters need to be further investigated. Additionally, this study further adapts the Icelandic feed hay processes from ecoinvent based on previous work [52]. Feed hay is one of the most influential hotspot processes among multiple environmental categories at the characterized midpoint level, as well as leading to high toxicity and land-use environmental impacts at the endpoint level. This further warrants the need for system-specific data and a better understanding of the Icelandic cattle systems and the associated feed production. The characterized midpoint analysis in this study provided the magnitude of the impact of different processes and their contribution, while the normalized analysis provided the information on the crucial environmental impacts from the two cattle systems. Additionally, the characterized and normalized assessment highlights the need for a holistic and comprehensive assessment of the environmental impacts and emphasizes that an eminent requirement to focus on climate change does not lead to burden shifting towards other environmental impacts.
5. Conclusions
This study is the first detailed LCA-based environmental assessment of the Icelandic cattle system. This study assesses the environmental impacts of dairy system meat and milk production and beef cattle system meat production. Using a comprehensive set of environmental categories of the ReCiPe impact assessment method, this study identifies the hotspots in the primary production of the milk and meat products from these cattle systems in Iceland.
Key Findings
- Hotspots
- Feed (hay and concentrate) is identified as a hotspot for most environmental categories.
- Animal production is a hotspot for four out of the eighteen environmental categories.
- Other processes have more nuanced effects on a select few environmental categories.
- Multifunctionality
- Three allocation methods are applied to address multifunctionality between meat and milk in the dairy system (mass, economic, and biophysical).
- The allocation method strongly influences the magnitude of the environmental impacts between meat and dairy.
- The biophysical allocation method provides the most balanced allocation between meat and milk products and is best suited for livestock systems compared to the mass and economic allocation methods.
- Data and uncertainty
This study is, however, limited by the lack of quality data on the cattle system in Iceland, and low and non-existent data in English. This problem is shared by other livestock systems in Iceland as well. A general observation on the livestock systems in Iceland is as follows:
- National-level data sources need harmonization.
- Data sources lack critical information and exhibit major inconsistencies across sources.
This study documents the current environmental status of Icelandic cattle in the context of the ambitious goal of carbon-neutral beef production.
- Reduction potential and future work
- Optimizing fertilizer application (such as nitrogen) in hay production can reduce the overall environmental impacts of the cattle system.
- Adoption of methane-reducing interventions in feeding, animal husbandry, and manure management (utilization of manure for biogas production) could reduce climate change-related impacts.
- In dairy systems, strategies are needed to reduce reliance on imported feed concentrates and to enhance domestic feed production, such as barley.
- The results of this study could enable policymakers to formulate quantifiable targets for the Climate Action Plan 2020 objectives, with key interventions in fertilizer, feed, manure management, and data harmonization and quality.
- Additionally, future studies should focus on evaluating the water scarcity footprint of imported feed and its associated biodiversity impacts.
- Achieving more sustainable meat and milk production will require interventions from multiple stakeholders across the production chain and require that a reduction in one environmental domain does not shift the burden elsewhere.
Supplementary Materials
The following supporting information can be downloaded at https://www.mdpi.com/article/10.3390/su172310778/s1, File S1: [Supplementary S1: Life cycle Inventory]; File S2: [Supplementary S2: LCI details and results]; File S3: [Supplementary S3: Results].
Author Contributions
Conceptualization, S.S., M.G., V.E.M., G.T. and Ó.Ö.; methodology, S.S., M.G., V.E.M., G.T. and Ó.Ö.; software, S.S. and Ó.Ö.; validation, S.S., M.G., V.E.M., G.T. and Ó.Ö.; formal analysis, S.S. and V.E.M.; investigation, S.S., M.G., V.E.M., G.T. and Ó.Ö.; resources, S.S., M.G., V.E.M., G.T. and Ó.Ö.; data curation, S.S., V.E.M., G.T., M.G. and Ó.Ö.; writing—original draft preparation, S.S., M.G., V.E.M., G.T. and Ó.Ö.; writing—review and editing, S.S., M.G., V.E.M., G.T. and Ó.Ö.; visualization, S.S.; supervision, M.G. and Ó.Ö.; project administration, M.G. and Ó.Ö.; funding acquisition, M.G. and Ó.Ö. All authors have read and agreed to the published version of the manuscript.
Funding
This research was funded by the Icelandic Centre for Research in relation to the Sustainable Healthy Diets project (grant no. 200221-5601).
Institutional Review Board Statement
Not applicable.
Informed Consent Statement
Not applicable.
Data Availability Statement
The original contributions presented in this study are included in the Supplementary Materials. Further inquiries can be directed to the corresponding author.
Acknowledgments
The authors acknowledge the assistance of Egill Gunnarsson in providing data and access to the Agricultural University of Iceland’s dairy farm; Guðmundur Johannesson at RML for assistance and guidance on understanding Icelandic cattle population structure; Eirikur Loftsson at RML for assistance and verifying hay yield estimates; Alexandra Kjeld at EFLA Consulting Engi-neers for providing the report on previous work on Icelandic cattle GHG emissions; and lastly, Inga Rún Helgadóttir at the Environment Agency of Iceland for providing gross energy intake data of animals as calculated for the national greenhouse gas inventory and based on data from RML (The Icelandic Agricultural Advisory Centre).
Conflicts of Interest
Gudjon Thorkelsson is employed by the Matís Food and Biotech R&D. Matís is a governmentally owned research company. The remaining authors declare that the research was conducted in the absence of any commercial or financial relationships that could be construed as potential conflicts of interest. Alexandra Kjeld at EFLA had no role in the collection, analyses, or interpretation of data; in writing of the manuscript; and in the decision to publish the results.
References
- Campbell, B.M.; Beare, D.J.; Bennett, E.M.; Hall-Spencer, J.M.; Ingram, J.S.I.; Jaramillo, F.; Ortiz, R.; Ramankutty, N.; Sayer, J.A.; Shindell, D. Agriculture Production as a Major Driver of the Earth System Exceeding Planetary Boundaries. Ecol. Soc. 2017, 22, 8. [Google Scholar] [CrossRef]
- Poore, J.; Nemecek, T. Reducing Food’s Environmental Impacts through Producers and Consumers. Science 2018, 360, 987–992. [Google Scholar] [CrossRef]
- Springmann, M.; Clark, M.; Mason-D’Croz, D.; Wiebe, K.; Bodirsky, B.L.; Lassaletta, L.; de Vries, W.; Vermeulen, S.J.; Herrero, M.; Carlson, K.M.; et al. Options for Keeping the Food System Within Environmental Limits. Nature 2018, 562, 519–525. [Google Scholar] [CrossRef] [PubMed]
- Vermeulen, S.J.; Campbell, B.M.; Ingram, J.S.I. Climate Change and Food Systems. Annu. Rev. Environ. Resour. 2012, 37, 195–222. [Google Scholar] [CrossRef]
- Steffen, W.; Richardson, K.; Rockström, J.; Cornell, S.E.; Fetzer, I.; Bennett, E.M.; Biggs, R.; Carpenter, S.R.; de Vries, W.; de Wit, C.A.; et al. Planetary Boundaries: Guiding Human Development on a Changing Planet. Science 2015, 347, 1259855. [Google Scholar] [CrossRef]
- Dury, S.; Bendjebbar, P.; Hainzelin, E.; Giordano, T.; Bricas, N. (Eds.) Food Systems at Risk: New Trends and Challenges; FAO: Rome, Italy; CIRAD: Montpellier, France; European Commission: Brussels, Belgium, 2019. [Google Scholar]
- Nyström, M.; Jouffray, J.-B.; Norström, A.V.; Crona, B.; Jørgensen, P.S.; Carpenter, S.R.; Bodin, Ö.; Galaz, V.; Folke, C. Anatomy and Resilience of the Global Production Ecosystem. Nature 2019, 575, 98–108. [Google Scholar] [CrossRef]
- Bajželj, B.; Richards, K.S. The Positive Feedback Loop between the Impacts of Climate Change and Agricultural Expansion and Relocation. Land 2014, 3, 898–916. [Google Scholar] [CrossRef]
- Yang, Y.; Tilman, D.; Jin, Z.; Smith, P.; Barrett, C.B.; Zhu, Y.-G.; Burney, J.; D’Odorico, P.; Fantke, P.; Fargione, J.; et al. Climate Change Exacerbates the Environmental Impacts of Agriculture. Science 2024, 385, eadn3747. [Google Scholar] [CrossRef]
- FAO. Pathways towards Lower Emissions—A Global Assessment of the Greenhouse Gas Emissions and Mitigation Options from Livestock Agrifood Systems; Food and Agriculture Organization of the United Nations: Rome, Italy, 2023. [Google Scholar]
- Grossi, G.; Goglio, P.; Vitali, A.; Williams, A.G. Livestock and Climate Change: Impact of Livestock on Climate and Mitigation Strategies. Anim. Front. 2019, 9, 69–76. [Google Scholar] [CrossRef] [PubMed]
- Leip, A.; Billen, G.; Garnier, J.; Grizzetti, B.; Lassaletta, L.; Reis, S.; Simpson, D.; Sutton, M.A.; De Vries, W.; Weiss, F.; et al. Impacts of European Livestock Production: Nitrogen, Sulphur, Phosphorus and Greenhouse Gas Emissions, Land-Use, Water Eutrophication and Biodiversity. Environ. Res. Lett. 2015, 10, 115004. [Google Scholar] [CrossRef]
- McAuliffe, G.A.; Zhang, Y.; Collins, A.L. Assessing Catchment Scale Water Quality of Agri-Food Systems and the Scope for Reducing Unintended Consequences Using Spatial-LCA. J. Environ. Manag. 2022, 320, 115837. [Google Scholar] [CrossRef] [PubMed]
- Clark, M.A.; Domingo, N.G.G.; Colgan, K.; Thakrar, S.K.; Tilman, D.; Lynch, J.; Azevedo, I.L.; Hill, J.D. Global Food System Emissions Could Preclude Achieving the 1.5° and 2 °C Climate Change Targets. Science 2020, 370, 705–708. [Google Scholar] [CrossRef]
- Gerber, P.J.; Steinfeld, H.; Henderson, B.; Mottet, A.; Opio, C.; Dijkman, J.; Falcucci, A.; Tempio, G. Tackling Climate Change Through Livestock: A Global Assessment of Emissions and Mitigation Opportunities; Food and Agriculture Organization of the United Nations (FAO): Rome, Italy, 2013. [Google Scholar]
- Steinfeld, H.; Gerber, P.; Wassenaar, T.; Castel, V.; Rosales, M.; De Haan, C. Livestock’s Long Shadow: Environmental Issues and Options; Food and Agriculture Organization of the United Nations (FAO): Rome, Italy, 2006. [Google Scholar]
- Benton, T.G.; Bieg, C.; Harwatt, H.; Pudasaini, R.; Wellesley, L. Food System Impacts on Biodiversity Loss: Three Levers for Food System Transformation in Support of Nature; Chatham House: London, UK, 2021. [Google Scholar]
- de Vries, M.; de Boer, I.J.M. Comparing Environmental Impacts for Livestock Products: A Review of Life Cycle Assessments. Livest. Sci. 2010, 128, 1–11. [Google Scholar] [CrossRef]
- De Vries, M.; Van Middelaar, C.; De Boer, I. Comparing Environmental Impacts of Beef Production Systems: A Review of Life Cycle Assessments. Livest. Sci. 2015, 178, 279–288. [Google Scholar] [CrossRef]
- Baldini, C.; Gardoni, D.; Guarino, M. A Critical Review of the Recent Evolution of Life Cycle Assessment Applied to Milk Production. J. Clean. Prod. 2017, 140, 421–435. [Google Scholar] [CrossRef]
- McClelland, S.C.; Arndt, C.; Gordon, D.R.; Thoma, G. Type and Number of Environmental Impact Categories Used in Livestock Life Cycle Assessment: A Systematic Review. Livest. Sci. 2018, 209, 39–45. [Google Scholar] [CrossRef]
- Henriksson, M.; Flysjö, A.; Cederberg, C.; Swensson, C. Variation in Carbon Footprint of Milk Due to Management Differences between Swedish Dairy Farms. Animal 2011, 5, 1474–1484. [Google Scholar] [CrossRef]
- Sasu-Boakye, Y.; Cederberg, C.; Wirsenius, S. Localising Livestock Protein Feed Production and the Impact on Land Use and Greenhouse Gas Emissions. Animal 2014, 8, 1339–1348. [Google Scholar] [CrossRef]
- Bonesmo, H.; Beauchemin, K.A.; Harstad, O.M.; Skjelvåg, A.O. Greenhouse Gas Emission Intensities of Grass Silage Based Dairy and Beef Production: A Systems Analysis of Norwegian Farms. Livest. Sci. 2013, 152, 239–252. [Google Scholar] [CrossRef]
- Mogensen, L.; Hermansen, J.E.; Nguyen, L.; Preda, T. Environmental Impact of Beef by Life Cycle Assessment (LCA)-13 Danish Beef Production Systems; DCA Report; DCA—Danish Centre for Food and Agriculture: Tjele, Denmark, 2015. [Google Scholar]
- Hietala, S.; Heusala, H.; Katajajuuri, J.-M.; Järvenranta, K.; Virkajärvi, P.; Huuskonen, A.; Nousiainen, J. Environmental Life Cycle Assessment of Finnish Beef—Cradle-to-Farm Gate Analysis of Dairy and Beef Breed Beef Production. Agric. Syst. 2021, 194, 103250. [Google Scholar] [CrossRef]
- Huuskonen, A.; Hietala, S.; Hyvönen, J.; Leinonen, I.; Manni, K. Environmental Impacts and Animal Performance of Finishing Bulls Fed Different Silage-Based Total Mixed Rations. Livest. Sci. 2023, 268, 105166. [Google Scholar] [CrossRef]
- Hammar, T.; Hansson, P.-A.; Röös, E. Time-Dependent Climate Impact of Beef Production—Can Carbon Sequestration in Soil Offset Enteric Methane Emissions? J. Clean. Prod. 2022, 331, 129948. [Google Scholar] [CrossRef]
- Uusitalo, V.; Kuokkanen, A.; Grönman, K.; Ko, N.; Mäkinen, H.; Koistinen, K. Environmental Sustainability Assessment from Planetary Boundaries Perspective—A Case Study of an Organic Sheep Farm in Finland. Sci. Total Environ. 2019, 687, 168–176. [Google Scholar] [CrossRef] [PubMed]
- Ortiz, A.M.D.; Outhwaite, C.L.; Dalin, C.; Newbold, T. A Review of the Interactions between Biodiversity, Agriculture, Climate Change, and International Trade: Research and Policy Priorities. One Earth Camb. Mass 2021, 4, 88–101. [Google Scholar] [CrossRef]
- Statistics Iceland. Agriculture. Available online: https://statice.is/statistics/business-sectors/agriculture/ (accessed on 5 August 2024).
- Keller, N.; Stefani, M.; Einarsdóttir, S.R.; Helgadóttir, Á.K.; Helgason, R.; Guðlaugsdóttir, H.; Snorrason, A.; Órsson, J.; Tinganelli, L. Emissions of Greenhouse Gases in Iceland from 1990 to 2020: National Inventory Report; Umhverfisstofnun: Reykjavík, Iceland, 2022. [Google Scholar]
- Sturludóttir, E.; Þorvaldsson, G.; Helgadóttir, G.; Guðnason, I.; Sveinbjörnsson, J.; Sigurgeirsson, Ó.I.; Sveinsson, Þ. Fæðuöryggi á Íslandi; Landbúnaðarháskóli Íslands: Borgarnes, Iceland, 2021. [Google Scholar]
- Government of Iceland. Iceland’s Long-Term Low Emission Development Strategy; United Nations Framework Convention on Climate Change: Rio de Janeiro, Brazil, 2021. [Google Scholar]
- Quintero-Herrera, S.; Zwolinski, P.; Evrard, D.; Cano-Gómez, J.J.; Botello-Álvarez, J.E.; Rivas-García, P. The Role of Livestock Feed Fertilization as an Improvement of Sustainability in the Dairy Sector. Sustain. Prod. Consum. 2022, 31, 448–458. [Google Scholar] [CrossRef]
- Donnison, C.L.; Murphy-Bokern, D. Are Climate Neutrality Claims in the Livestock Sector Too Good to Be True? Environ. Res. Lett. 2023, 19, 011001. [Google Scholar] [CrossRef]
- ÍSGEM. Matís Icelandic Database on the Chemical Content of Food (ÍSGEM). 2003. Available online: https://matis.is/en/frettir/isgem-hver-er-stadan-og-hvar-liggja-taekifaerin/ (accessed on 10 October 2024).
- ISO 14040; Environmental Management–Life Cycle Assessment–Principles and Framework. ISO: Geneva, Switzerland, 2006.
- ISO 14044; Environmental Management–Life Cycle Assessment–Requirements and Guidelines. ISO: Geneva, Switzerland, 2006.
- PRé Sustainability. SimaPro, Version 9.5; PRé Sustainability: Amersfoort, The Netherlands, 2023.
- Steubing, B.; de Koning, D.; Haas, A.; Mutel, C.L. The Activity Browser—An Open Source LCA Software Building on Top of the Brightway Framework. Softw. Impacts 2020, 3, 100012. [Google Scholar] [CrossRef]
- Wernet, G.; Bauer, C.; Steubing, B.; Reinhard, J.; Moreno-Ruiz, E.; Weidema, B. The Ecoinvent Database Version 3 (Part I): Overview and Methodology. Int. J. Life Cycle Assess. 2016, 21, 1218–1230. [Google Scholar] [CrossRef]
- Kyttä, V.; Roitto, M.; Astaptsev, A.; Saarinen, M.; Tuomisto, H.L. Review and Expert Survey of Allocation Methods Used in Life Cycle Assessment of Milk and Beef. Int. J. Life Cycle Assess. 2022, 27, 191–204. [Google Scholar] [CrossRef]
- International Dairy Federation. A Common Carbon Footprint Approach for the Dairy Sector: The IDF Guide to Standard Life Cycle Assessment Methodology; International Dairy Federation: Brussels, Belgium, 2015. [Google Scholar]
- Huijbregts, M.A.J.; Steinmann, Z.J.N.; Elshout, P.M.F.; Stam, G.; Verones, F.; Vieira, M.; Zijp, M.; Hollander, A.; van Zelm, R. ReCiPe 2016: A Harmonized Life Cycle Impact Assessment Method at Midpoint and Endpoint Level. Int. J. Life Cycle Assess. 2017, 22, 138–147. [Google Scholar] [CrossRef]
- The International Dairy Federation (IDF). The IDF Global Carbon Footprint Standard for the Dairy Sector; The International Dairy Federation: Brussels, Belgium, 2022. [Google Scholar] [CrossRef]
- Ráðgjafarmiðstöð landbúnaðarins. Skýrsluhald í Mjólkurframleiðslu: Annual Milk Data; Ráðgjafarmiðstöð Landbúnaðarins: Hvammstangi, Iceland, 2019. [Google Scholar]
- Ráðgjafarmiðstöð landbúnaðarins. Skýrsluhald í Nautakjötsframleiðslu: Annual Beef Data; Ráðgjafarmiðstöð Landbúnaðarins: Hvammstangi, Iceland, 2019. [Google Scholar]
- Bændasamtök Íslands. Lykiltölur Bús: Hvanneyri—350513; Bændasamtök Íslands: Reykjavik, Iceland, 2015. [Google Scholar]
- Brynjarsson, B.; Kristinsson, B.S.; Yngvadóttir, E. Kolefnisspor Nautgriparæktar á Íslandi 2018 [Carbon Footprint of Cattle Farming in Iceland 2018]; EFLA: Reykjavík, Iceland, 2020. [Google Scholar]
- Meron, N.; Blass, V.; Thoma, G. A National-Level LCA of a Water Supply System in a Mediterranean Semi-Arid Climate—Israel as a Case Study. Int. J. Life Cycle Assess. 2020, 25, 1133–1144. [Google Scholar] [CrossRef]
- Shrivastava, S.; Gudjónsdóttir, M.; Thorkelsson, G.; Ögmundarson, Ó. Shifting Units, Shifting Views: How Product Mass and Protein Content Influence Environmental Impact of Icelandic Lamb. Int. J. Life Cycle Assess. 2025, 30, 491–510. [Google Scholar] [CrossRef]
- Guðjónsdóttir, S.B.; Vásquez-Mejía, C.M.; Shrivastava, S.; Ögmundarson, Ó. A Life Cycle Assessment of Broiler Chicken Meat and Egg Production in Iceland. Poult. Sci. 2025, 104, 105072. [Google Scholar] [CrossRef]
- Intergovernmental Panel on Climate Change (IPCC). 2019 Refinement to the 2006 IPCC Guidelines for National Greenhouse Gas Inventories; Intergovernmental Panel on Climate Change: Geneva, Switzerland, 2019. [Google Scholar]
- European Environment Agency (EEA). EMEP/EEA Air Pollutant Emission Inventory Guidebook 2019; European Environment Agency: Copenhagen, Denmark, 2019. [Google Scholar]
- Ciroth, A.; Muller, S.; Weidema, B.; Lesage, P. Empirically Based Uncertainty Factors for the Pedigree Matrix in Ecoinvent. Int. J. Life Cycle Assess. 2016, 21, 1338–1348. [Google Scholar] [CrossRef]
- Rosenbaum, R.K.; Georgiadis, S.; Fantke, P. Uncertainty Management and Sensitivity Analysis. In Life Cycle Assessment: Theory and Practice; Hauschild, M.Z., Rosenbaum, R.K., Olsen, S.I., Eds.; Springer International Publishing: Cham, Switzerland, 2018; pp. 271–321. ISBN 978-3-319-56475-3. [Google Scholar]
- Cucurachi, S.; Blanco, C.F.; Steubing, B.; Heijungs, R. Implementation of Uncertainty Analysis and Moment-Independent Global Sensitivity Analysis for Full-Scale Life Cycle Assessment Models. J. Ind. Ecol. 2022, 26, 374–391. [Google Scholar] [CrossRef]
- Kjeld, A.; Bjarnadóttir, H.J.; Ólafsdottir, R. Life Cycle Assessment of Hydropower Utilization in Iceland as a Driving Force for Climate Strategy and Decarbonization. Int. J. Life Cycle Assess. 2025, 30, 1806–1826. [Google Scholar] [CrossRef]
- Rosenbaum, R.K.; Bachmann, T.M.; Gold, L.S.; Huijbregts, M.A.J.; Jolliet, O.; Juraske, R.; Koehler, A.; Larsen, H.F.; MacLeod, M.; Margni, M.; et al. USEtox—The UNEP-SETAC Toxicity Model: Recommended Characterisation Factors for Human Toxicity and Freshwater Ecotoxicity in Life Cycle Impact Assessment. Int. J. Life Cycle Assess. 2008, 13, 532–546. [Google Scholar] [CrossRef]
- Fantke, P.; Aylward, L.; Bare, J.; Chiu, W.A.; Dodson, R.; Dwyer, R.; Ernstoff, A.; Howard, B.; Jantunen, M.; Jolliet, O.; et al. Advancements in Life Cycle Human Exposure and Toxicity Characterization. Environ. Health Perspect. 2018, 126, 125001. [Google Scholar] [CrossRef]
- Nemecek, T.; Roesch, A.; Bystricky, M.; Jeanneret, P.; Lansche, J.; Stüssi, M.; Gaillard, G. Swiss Agricultural Life Cycle Assessment: A Method to Assess the Emissions and Environmental Impacts of Agricultural Systems and Products. Int. J. Life Cycle Assess. 2024, 29, 433–455. [Google Scholar] [CrossRef]
- Nemecek, T.; Schnetzer, J. Methods of Assessment of Direct Field Emissions for LCIs of Agricultural Production Systems; Agroscope Reckenholz-Tänikon Research Station ART: Zurich, Switzerland, 2011; 34p. [Google Scholar]
- Freiermuth, R. Modell zur Berechnung der Schwermetallflüsse in der Landwirtschaftlichen Ökobilanz; Agroscope FAL Reckenholz: Zurich, Switzerland, 2006; 42p. [Google Scholar]
- Nemecek, T.; Lansche, J.; Nemecek, T.; Lansche, J. Consistent Modelling of Heavy Metal Balances in LCA on Field and Farm Level. In Proceedings of the 13th International Conference on LCA of Food, Lima, Peru, 12–14 October 2022; pp. 563–567. [Google Scholar]
- Reykdal, Ó.; Thorlacius, A. Cadmium, Mercury, Iron, Copper, Manganese and Zinc in the Liver and Kidney of the Icelandic Lamb. Food Addit. Contam. 2001, 18, 960–969. [Google Scholar] [CrossRef] [PubMed]
- Reykdal, O.; Rabieh, S.; Steingrimsdottir, L.; Gunnlaugsdottir, H. Minerals and Trace Elements in Icelandic Dairy Products and Meat. J. Food Compos. Anal. 2011, 24, 980–986. [Google Scholar] [CrossRef]
- Järviö, N.; Maljanen, N.-L.; Kobayashi, Y.; Ryynänen, T.; Tuomisto, H.L. An Attributional Life Cycle Assessment of Microbial Protein Production: A Case Study on Using Hydrogen-Oxidizing Bacteria. Sci. Total Environ. 2021, 776, 145764. [Google Scholar] [CrossRef]
- Therkildsen, M.; Vestergaard, M.; Kargo, M.; Keto, L.; Ertbjerg, P.; Thorkelsson, G.; Gudjónsdóttir, M.; Kjetså, M.; Honkatukia, M.; Egelandsdal, B.; et al. Carcass Characteristics of Nordic Native Cattle Breeds. Genet. Resour. 2023, 4, 1–19. [Google Scholar] [CrossRef]
- Min, B.-R.; Lee, S.; Jung, H.; Miller, D.N.; Chen, R. Enteric Methane Emissions and Animal Performance in Dairy and Beef Cattle Production: Strategies, Opportunities, and Impact of Reducing Emissions. Animals 2022, 12, 948. [Google Scholar] [CrossRef]
- Rice, P.; O’Brien, D.; Shalloo, L.; Holden, N. Evaluation of Allocation Methods for Calculation of Carbon Footprint of Grass-Based Dairy Production. J. Environ. Manag. 2017, 202, 311–319. [Google Scholar] [CrossRef]
- Guinée, J.B.; Heijungs, R.; Frischknecht, R. Multifunctionality in Life Cycle Inventory Analysis: Approaches and Solutions; LCA Compendium—The Complete World of Life Cycle Assessment; Springer: Cham, Switzerland, 2021. [Google Scholar]
- Thoma, G.; Nemecek, T. Allocation between Milk and Meat in Dairy LCA: Critical Discussion of the IDF’s Standard Methodology. In Proceedings of the 12th International Conference on Life Cycle Assessment of Food (LCA Food 2020), Berlin, Germany, 13–16 October 2020; pp. 83–89. [Google Scholar]
- National Academies of Sciences, Engineering, and Medicine. Nutrient Requirements of Dairy Cattle, 8th ed.; The National Academies Press: Washington, DC, USA, 2021; ISBN 978-0-309-71449-5. [Google Scholar]
- Thoma, G.; Jolliet, O.; Wang, Y. A Biophysical Approach to Allocation of Life Cycle Environmental Burdens for Fluid Milk Supply Chain Analysis. Int. Dairy J. 2013, 31, S41–S49. [Google Scholar] [CrossRef]
- Ineichen, S.; Schenker, U.; Nemecek, T.; Reidy, B. Allocation of Environmental Burdens in Dairy Systems: Expanding a Biophysical Approach for Application to Larger Meat-to-Milk Ratios. Livest. Sci. 2022, 261, 104955. [Google Scholar] [CrossRef]
- Huijbregts, M.A. Application of Uncertainty and Variability in LCA. Int. J. Life Cycle Assess. 1998, 3, 273–280. [Google Scholar] [CrossRef]
- Flysjö, A.; Henriksson, M.; Cederberg, C.; Ledgard, S.; Englund, J.-E. The Impact of Various Parameters on the Carbon Footprint of Milk Production in New Zealand and Sweden. Agric. Syst. 2011, 104, 459–469. [Google Scholar] [CrossRef]
- Stocker, T.F.; Qin, D.; Plattner, G.-K.; Tignor, M.; Allen, S.K.; Boschung, J.; Nauels, A.; Xia, Y.; Bex, V.; Midgley, P.M. Climate Change 2013: The Physical Science Basis; Contribution of Working Group I to the Fifth Assessment Report of the Intergovernmental Panel on Climate Change; IPCC: Cambridge, UK; New York, NY, USA, 2013; p. 1535. [Google Scholar]
- Arnalds, A. Carbon Sequestration and the Restoration of Land Health. Clim. Change 2004, 65, 333–346. [Google Scholar] [CrossRef]
- Putman, B.; Rotz, C.A.; Thoma, G. A Comprehensive Environmental Assessment of Beef Production and Consumption in the United States. J. Clean. Prod. 2023, 402, 136766. [Google Scholar] [CrossRef]
Disclaimer/Publisher’s Note: The statements, opinions and data contained in all publications are solely those of the individual author(s) and contributor(s) and not of MDPI and/or the editor(s). MDPI and/or the editor(s) disclaim responsibility for any injury to people or property resulting from any ideas, methods, instructions or products referred to in the content. |
© 2025 by the authors. Licensee MDPI, Basel, Switzerland. This article is an open access article distributed under the terms and conditions of the Creative Commons Attribution (CC BY) license (https://creativecommons.org/licenses/by/4.0/).