Abstract
Large rivers are crucial for the functioning of individual regions and entire countries. However, despite their importance, relevant data allowing for a full assessment of the processes and phenomena occurring within them are often lacking. In the contemporary context, climate change has become a key factor affecting river ecosystems, leading to transformations in one of their fundamental characteristics—thermal conditions. This study analyzes the relationships between air temperature and water temperature in the four largest rivers in Poland, using a diversified methodological approach (wavelet analysis, lag non-linear models, copula), which broadens the current understanding of rivers in Central Europe. All three analytical paths confirmed a strong relationship between the two media, forming a basis for further research aimed at addressing data gaps and determining the direction and rate of changes over the period 1965–2024. All cases showed a statistically significant positive trend, with rates varying slightly from 0.32 to 0.38 °C · decade−1 (an average increase of 0.35 °C · decade−1). The ongoing transformation of the thermal regime—its scale and rate—should be taken into account in interdisciplinary studies of river ecosystems, as well as by agencies responsible for water resource management. This issue is particularly important in the context of sustainable development, where the economic use and ecological condition of river systems are closely linked to water temperature.
1. Introduction
The pursuit of continuous development is an inherent trait of humankind, and the realization of these goals inevitably has either a direct [] or indirect impact on the natural environment. Numerous studies have demonstrated that individual components of the hydrosphere respond distinctly to global warming [,,,,]. In the terrestrial phase of the water cycle, rivers play a key role, as their significance is multifaceted. From the perspective of natural processes, rivers are decisive for the transport of matter [,,]. From an economic standpoint, they serve as sources of irrigation, energy, transport, fisheries, and as essential landscape-forming elements [,,,]. Among the many parameters that characterize river ecosystems, water temperature is one of the most critical, as it determines their overall functioning [,,]. The temperature of river water is both directly and indirectly dependent on climate change []. Consequently, in the context of global climate change, increasing attention has been devoted to long-term variations in river thermal regimes, where air temperature plays a decisive role. As demonstrated in the case of Arctic rivers in Russia [], the rise in water temperature resulted primarily from changes in air temperature (in approximately 70% of cases). Similarly, projected air temperature increases in Canada may intensify future river warming, potentially leading to further significant ecological consequences [].
Thermal monitoring of rivers is essential for developing scenarios related to the physical, chemical, and biological processes occurring within these ecosystems []. Understanding changes in water temperature is crucial for effective river environment management []. An increase in water temperature has both direct and indirect effects on aquatic life, and it also influences eutrophication processes and the spread of waterborne diseases []. The warming of watercourses has been observed to affect ichthyofauna, resulting in an expansion of fish populations toward the polar limits of their distribution ranges and a corresponding decline toward the equatorial boundaries []. Higher water temperatures also affect the bioavailability, toxicity, and bioaccumulation of toxic metals in aquatic plants [].
In Poland, studies on river water thermal regimes have covered a wide range of topics, including the effects of forest cover [], projections of future changes [], the impact of dams [], heat waves [], diurnal fluctuations [], and long-term variability [], among others. For the latter, it should be noted that such analyses require continuous, long-term observational records. However, not all rivers have complete datasets. As pointed out by Daigle and Légaré [], detecting trends in environmental data can be challenging, and in the case of river temperature, this difficulty often results from the limited length of time series. These gaps are increasingly being addressed through the growing use of modeling techniques []. The purpose of this study is to determine the relationships between air and water temperatures and their long-term variability for the four largest rivers in Poland over the period 1965–2024. The research objectives were implemented through: statistical analyses of air–water temperature relationships, reconstruction of missing water temperature data, and identification of long-term and seasonal trends at monthly and annual scales. The novelty in this study lies in the application of advanced analytical methods to determine the relationships between air and water temperature—approaches that have not previously been used for Polish rivers. Such an approach can serve as an effective tool for studying river temperature in Central Europe, which is the focus of numerous recent studies [,,]. Historically, scientific and economic attention has often focused on major rivers, which is understandable given their strategic and environmental significance for individual countries and regions. The implementation of the present research objectives aligns with this long-standing perspective.
2. Materials and Methods
2.1. Study Area
Our goal is to understand how air temperature (AT) and river water temperature (WT) co-evolve, how quickly WT responds to changes in AT, and how often high AT and high WT occur together. We therefore use a complementary, three-step framework. First, wavelet analyses identify when and at what time-scales the two series move together, including seasonal and multi-year patterns. Second, distributed lag non-linear models (DLNM) quantify how strongly and how soon WT responds to AT across different temperature ranges and delays (weeks–months). Third, copula models describe the joint behavior of AT and WT—including the likelihood of extreme combinations relevant for ecological stress. This layered approach links timing (wavelets), effect magnitude and lag (DLNM), and joint risk (copulas), providing both physical insight and decision-relevant metrics.
The subject of analysis includes the four largest rivers in Poland, all of which belong to the Baltic Sea catchment area (Figure 1). The longest of them is the Wisła River (1047 km, the 15th longest river in Europe), followed by the Odra (854 km), the Warta (808 km), and the Bug (772 km). From a hydrological perspective, these rivers are characterized by either a moderately developed nival regime [] or a strongly developed nival regime (Bug). In the first case, the average spring discharge amounts to approximately 130–180% of the mean annual discharge, whereas in the second regime, spring discharges exceed the annual mean by more than 180%.
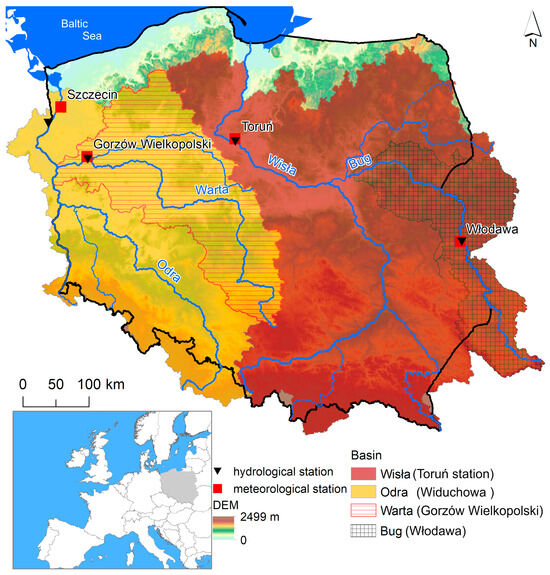
Figure 1.
Location of research rivers.
2.2. Materials
The study utilized monthly aggregated measurements of water temperature. The data were obtained from the Institute of Meteorology and Water Management and collected according to a standardized procedure applied to all monitored rivers. Measurements were taken at a fixed point (near the water gauge), 0.4 m below the water surface. Air temperature data were also sourced from the Institute of Meteorology and Water Management, recorded at the nearest meteorological stations. These observations were conducted in accordance with WMO guidelines, with instruments placed in a standard weather shelter, 2 m above ground level.
2.3. Methods
Air–water temperature coupling in temperate rivers is nonstationary, exhibits lagged and non-linear responses due to thermal inertia, and raises management questions about compound and extreme states. We therefore combined three complementary tools. Wavelet power and coherence localize co-variability in the time–frequency domain and identify scale-specific lead–lag patterns, indicating when and at which periods air temperature (AT) and water temperature (WT) co-evolve. Guided by these scales, Distributed Lag Non-Linear Models (DLNM) quantify the exposure lag response surface, resolving delayed and non-linear WT sensitivities to AT. Finally, copula models characterize the dependence structure, including tail dependence, to estimate probabilities of joint high-AT/high-WT conditions relevant for ecological thresholds. This staged approach addresses distinct inferential targets that no single method can provide alone, yielding a physically interpretable and decision-relevant assessment.
2.3.1. Thermal Coupling Between Air and Water Temperature
This study employed three analytical approaches to characterize the thermal coupling between air and water temperatures across four major Polish river systems (Wisła, Odra, Warta, and Bug) from 1965–2024. First, continuous wavelet transform analysis and wavelet coherence were applied to quantify time-frequency dynamics, revealing how variance is distributed across temporal scales (annual to multi-decadal) and measuring scale-dependent coupling strength between atmospheric and riverine thermal regimes [,]. Second, distributed lag non-linear models (DLNM) were constructed using tensor product splines to characterize the functional form of the air-water temperature relationship and its temporal decay structure across 0–12 month lags, providing explicit quantification of contemporary coupling strength and thermal memory []. Third, copula-based dependence models were fitted to examine the joint probability structure with particular attention to tail behavior, quantifying whether extreme warm and extreme cold conditions exhibit symmetric coupling or differential dependence at distributional extremes [,].
Wavelet Analysis
First, we applied continuous wavelet transform (CWT) and wavelet coherence (WTC) analysis. The purpose of this step was to identify when and at what time scales (from annual to multi-decadal) the air and water temperature signals move together. CWT decomposes each time series to show how its variance is distributed over time, while WTC quantifies the correlation strength and any lead-lag phase shifts between the two series at those specific time scales [,]. This allowed us to pinpoint the dominant periods of co-variability (e.g., the strong annual cycle). All mathematical formulations, including the Morlet wavelet, power spectrum calculations against AR(1) red noise, and coherence equations, are detailed in Supplementary Materials S1 [,,,,].
Distributed Lag Non-Linear Models
Second, guided by the scales identified in the wavelet analysis, we used Distributed Lag Non-Linear Models (DLNM). The goal of this step was to quantify how strongly and how quickly water temperature responds to changes in air temperature [,]. DLNMs are a flexible regression technique that allowed us to create an “exposure-lag-response” surface. This surface simultaneously shows how the effect of an air temperature change is distributed over time (e.g., over several weeks or months) and how that effect differs at various temperature ranges (e.g., the response to a 2 °C change is different in winter than in summer). This step quantifies the river’s thermal “memory” and sensitivity. The specific model structure, including the tensor product B-spline basis functions and Gaussian error distribution, is provided in Supplementary Materials S1 [,,,,,,].
Copula Analysis
Third, we employed copula-based models to describe the joint behavior and dependence structure of AT and WT [,]. While DLNM quantifies the response, copulas quantify the risk of simultaneous events. This method isolates the dependence structure from the marginal distributions of each variable. The primary goal was to understand the “tail dependence”—that is, to answer questions like: “When air temperature is extremely high (e.g., 95th percentile), what is the probability that water temperature is also extremely high?” This is crucial for assessing ecological stress and the likelihood of compound extreme events. The formal definitions, including Sklar’s theorem, the candidate copula families (e.g., Gaussian, Student-t, Clayton, Gumbel, Frank), parameter estimation, and model selection, are detailed in Supplementary Materials S1 [,,,,,,,,,,,,,,,].
2.3.2. Water Temperature Reconstruction
Complete datasets were available for the meteorological stations in Toruń, Gorzów Wielkopolski, Szczecin, and Włodawa, as well as for the hydrological stations on the Wisła and Bug rivers. However, for the Warta River, data were missing for the years 2010, 2011, and 2015–2024, while for the Odra River, data were missing for the years 2015–2024. To reconstruct the missing data, a linear regression model and a polynomial regression model were developed for each month to describe the relationship between the mean monthly air temperature and water temperature. For the Warta River, third- and second-degree polynomial regression models were applied for the period from December to March, whereas for the Odra River, fourth- and second-degree polynomial regression models were employed for the period from December to February. The developed models for the Warta and Odra rivers were validated using data from the periods 1965–2010 and 1965–2014, respectively. To evaluate model performance, the coefficient of determination (R2), root mean square error (RMSE), and mean absolute error (MAE) were calculated (Table S1). The validation results for the monthly periods showed, for the Odra River, R2 values ranging from 0.73 to 0.93, RMSE from 0.37 to 0.62 °C, and MAE from 0.27 to 0.50 °C; and for the Warta River, R2 values ranging from 0.71 to 0.91, RMSE from 0.40 to 0.66 °C, and MAE from 0.31 to 0.53 °C. For the annual period, the Odra River models yielded R2 = 0.86, RMSE = 0.26 °C, and MAE = 0.22 °C, whereas the Warta River models yielded R2 = 0.91, RMSE = 0.19 °C, and MAE = 0.15 °C. Therefore, based on these models, the missing water temperature data for both rivers were reconstructed.
2.3.3. Trend Analysis
Finally, trends in the monthly and annual mean water and air temperatures were analyzed. We analyzed trends in monthly and annual mean water and air temperatures. For this purpose, a classical approach was applied, using the Mann–Kendall test [] to assess the significance of long-term changes, and Sen’s test [] to determine the magnitude of these changes. The Mann–Kendall and Sen tests were performed using the modified mk package in R 3.5.1 developed by Patakamuri and O’Brien []. The Mann–Kendall was conducted at a significance level of 0.05. In addition, the relationships between the mean monthly and annual water and air temperatures were determined using the following equation: WT = aAT + b. The air temperature was assumed to be the independent variable and the water temperature as the dependent variable, where a and b are the equation parameters—the slope and the intercept, respectively.
3. Results
3.1. Wavelet Analysis and Coherence
To establish the baseline temporal variability structure in each river system, we examined continuous wavelet power spectra for water and air temperatures independently. The wavelet decomposition reveals how variance is distributed across timescales from sub-annual to multi-decadal periods, providing essential context for interpreting subsequent coherence analysis.
To establish the baseline temporal variability in each river system, we first examined the continuous wavelet power spectra. The results for all four rivers were highly similar, displaying the same dominant patterns. Therefore, we present the spectrum for the Wisła River (Figure 2) as a representative example and have moved the analogous spectra for the Odra, Warta, and Bug rivers to Supplementary Materials (Figures S1–S3).
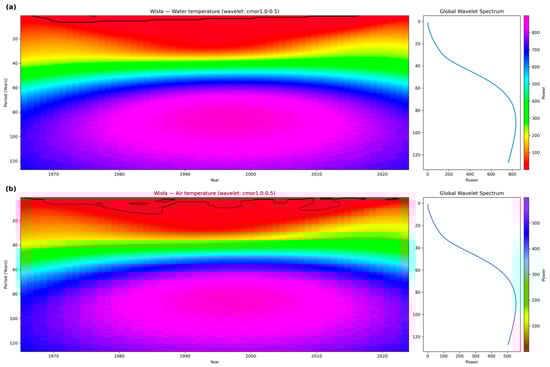
Figure 2.
Distribution of wavelet power spectra for the Wisla river thermal regime across time-frequency from 1965–2024 for (a) water temperature, and (b) air temperature.
The analysis reveals two primary findings common to all rivers. First, both air and water temperature spectra are overwhelmingly dominated by a single, high-power band concentrated at the 1-year (annual) period throughout the entire 1965–2024 timeframe. This confirms that the fundamental driver for the thermal regime of these large rivers is the strong, stable seasonal cycle. Second, the air temperature spectra show significant, intermittent power at decadal (10–20 year) scales, but this variability is clearly dampened or absent in the corresponding water temperature spectra. This pattern demonstrates the significant thermal inertia of these large river systems. The large water volume effectively acts as a low-pass filter, smoothing out shorter-term (decadal) atmospheric fluctuations while remaining tightly locked to the dominant annual cycle.
The wavelet coherence analysis (Figure 3) quantifies this strong, consistent coupling. For all four rivers, coherence values at the annual scale consistently exceed 0.90–0.95 across the entire study period.
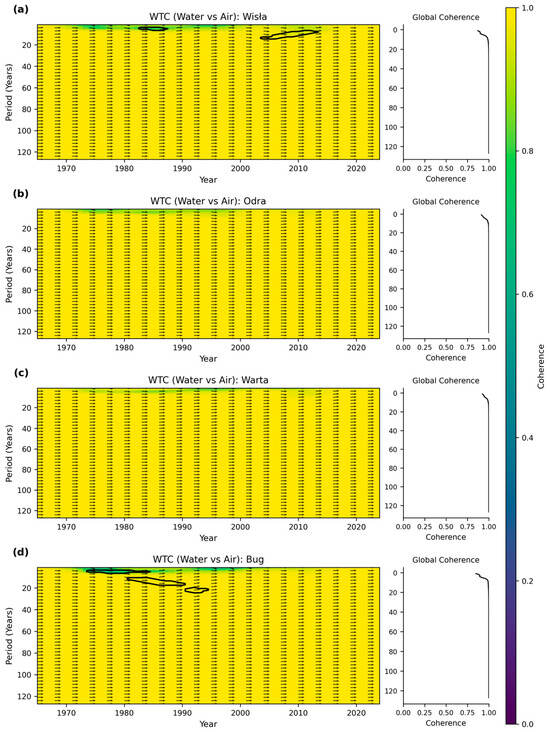
Figure 3.
Wavelet coherence analysis between water and air temperature for four major Polish river systems. Cross-wavelet coherence spectra for (a) Wisła, (b) Odra, (c) Warta, and (d) Bug Rivers spanning approximately 1965–2024.
The hydrological meaning of this is critical: it indicates that regional air temperature alone explains over 90% of the variance in monthly river water temperature. This finding provides a strong physical and statistical basis for using air temperature as a reliable proxy for reconstructing missing water temperature data. Furthermore, the phase arrows across all plots are uniformly in-phase (pointing right), showing no significant time lag between the air and water temperature peaks at this monthly scale. This implies that the rivers respond immediately (within the same month) to seasonal atmospheric forcing. The only notable inter-basin difference was a localized coherence enhancement in the Bug River at the 8–15 year band during 1985–2005, suggesting a temporary, heightened sensitivity to decadal-scale climate patterns in that specific basin.
3.2. Distributed Lag Non-Linear Models (DLNM)
While wavelet coherence quantifies coupling strength in the frequency domain, it does not reveal the functional form of the air-water temperature relationship or how this relationship evolves across different lag structures. To address these issues, we construct DLNM effect surfaces using tensor product B-splines that simultaneously model non-linearity in temperature response and temporal decay across 0–12 month lags.
While wavelet analysis confirms the timing and strength of the coupling, the Distributed Lag Non-Linear Models (DLNM) quantify the river’s functional thermal sensitivity and memory. The DLNM response curves (Figure 4) were remarkably uniform across all four rivers, indicating a common thermal behavior despite differences in catchment size. This spatial consistency allows for a consolidated interpretation. Two key characteristics emerged from the analysis. The first is the river’s immediate sensitivity (lag 0 response). We found that a 1 °C increase in concurrent air temperature results in a 0.85–0.95 °C increase in water temperature across all systems. The hydrological meaning of this sub-1.0 response is the signature of immediate thermal buffering. Even within the same month, factors such as groundwater inflow and the sheer thermal mass of the water provide a slight but consistent buffer against direct atmospheric forcing. The second characteristic is the river’s “thermal memory,” or how long an air temperature signal persists. The influence of air temperature decays rapidly: the effect is reduced by approximately 50% at a lag of 3–4 months and becomes negligible (approaching 5–10%) at lags beyond 6–9 months. This defines the practical limit of the river’s thermal memory. It means a river’s temperature in a given season (e.g., summer) is almost entirely independent of the atmospheric conditions from two seasons prior (e.g., the preceding winter). The river’s thermal regime effectively “resets” itself seasonally, implying that the long-term warming trends identified later (Section 3.4) are a result of a consistently shifting baseline rather than an intra-annual accumulation of residual heat. The models also revealed non-linear responses at temperature extremes, with thermal buffering evident at cold temperatures (0–5 °C) and enhanced coupling during warm conditions (15–20 °C).
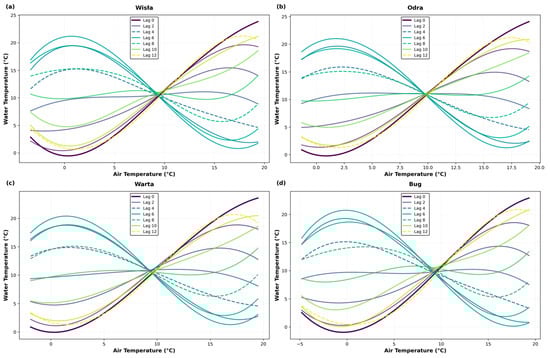
Figure 4.
Distributed Lag Non-Linear Model (DLNM) response curves showing water temperature (°C) as a function of air temperature and temporal lag structures for four Polish river systems. (a) Wisła, (b) Odra, (c) Warta, and (d) Bug Rivers.
3.3. Copula Analysis and Joint Distributions
The wavelet and DLNM analyses establish strong coupling and quantify its functional form, but neither method fully characterizes the dependence structure at distributional extremes. Copula analysis addresses this gap by examining the rank-based dependence structure after transforming marginals to uniform scales, allowing us to quantify whether extreme warm and extreme cold conditions exhibit symmetric coupling or whether tail dependence differs between upper and lower temperature quantiles. This is particularly relevant for understanding how heat waves and cold snaps propagate from atmosphere to rivers. The copula-based joint probability density functions for the four Polish river systems reveal the rank-based dependence structure between water and air temperatures after transforming both variables to uniform probability scales through empirical cumulative distribution functions. The copula analysis addresses the dependence structure at distributional extremes, which is critical for assessing ecological risk. The scatter plots for all four rivers (Figure 5) show a strong concentration of points along the 1:1 diagonal, confirming the tight, monotonic positive dependence between air and water temperatures found in the previous analyses.
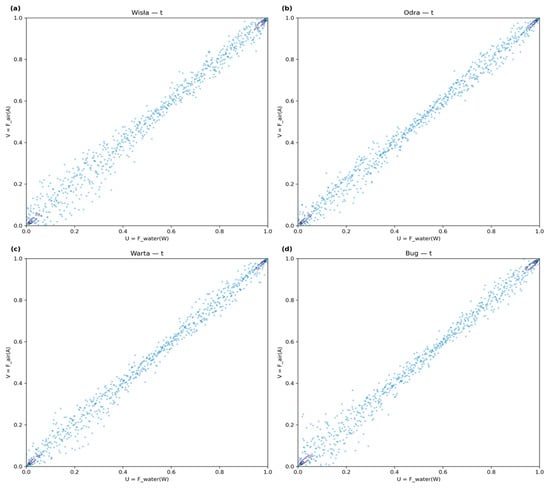
Figure 5.
Copula scatter plots depicting rank-based dependence between water and air temperature for four Polish river systems. (a) Wisła, (b) Odra, (c) Warta, and (d) Bug Rivers.
This analysis pattern is quantitatively confirmed by the joint probability density functions (Figure 6), which show a strong concentration of probability density (values >0.25, yellow coloring) along the main diagonal.
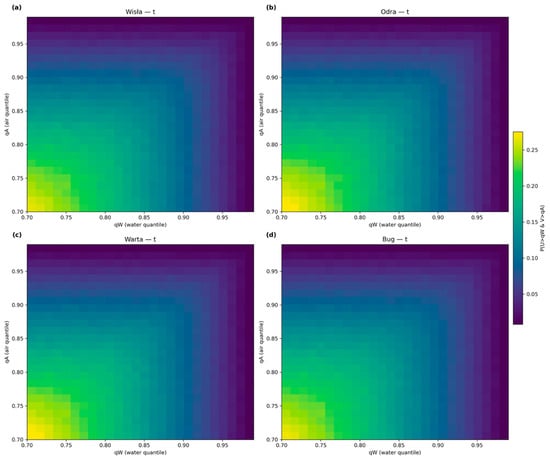
Figure 6.
Copula-based joint probability density functions for water and air temperature dependence structures in four Polish river systems. (a) Wisła, (b) Odra, (c) Warta, and (d) Bug Rivers.
The most critical finding, however, is the clear asymmetry in this dependence structure, visible in both sets of plots. In the upper tail (quantiles > 0.8), the points in the scatter plot cluster very tightly around the diagonal, and correspondingly, the density plot shows the high-density region becoming narrower and more compressed, indicating strong upper-tail dependence. The ecological meaning of this is that atmospheric heatwaves transfer to the river with high, predictable efficiency; an extremely hot month for air is very likely to be an extremely hot month for water, heightening the risk of thermal stress and low dissolved oxygen events. In contrast, the lower tail (quantiles < 0.2) shows points that are visibly more scattered, a pattern reflected in the density plot as a broader, more diffuse distribution of probability, indicating weaker lower-tail dependence. The hydrological meaning of this is the clear signature of ice physics. Once air temperature drops significantly below 0 °C, the river water reaches its freezing point. The formation of ice cover then decouples the water from the air, insulating it. The air can continue to plummet, but the river water remains locked near 0 °C, thus “breaking” the linear relationship observed at warmer temperatures.
3.4. Trend Analysis
The highest mean annual water temperature was recorded for the Odra River (10.9 °C), and the lowest for the Bug River (9.8 °C). These rivers are located at the westernmost and easternmost parts of Poland, respectively. The analysis of long-term air temperature trends, conducted for monthly periods, revealed a general warming over the period 1965–2024. The strongest increases occurred in January (mean rate of 0.62 °C · decade−1), while the weakest were observed in May (mean rate of 0.21 °C · decade−1) (Table S2). At the Toruń station (Wisła Basin), changes in February, March, and May, and at the Włodawa station (Bug Basin) in May were not statistically significant at the 0.05 level. Analysis of mean annual air temperatures showed consistent increases across all stations, ranging from 0.39 °C · decade−1 at Szczecin (Odra Basin) to 0.43 °C · decade−1 at Toruń, Gorzów, and Włodawa (Figure 7). For water temperatures, monthly trends ranged between 0.16 °C · decade−1 and 0.45 °C · decade−1, with the highest values recorded in August. Only for the Wisła River in February and the Bug River in May were the changes not statistically significant (p > 0.05). Mean annual water temperatures also increased, from 0.32 °C · decade−1 in the Bug River to 0.38 °C · decade−1 in the Wisła River (Figure 7).
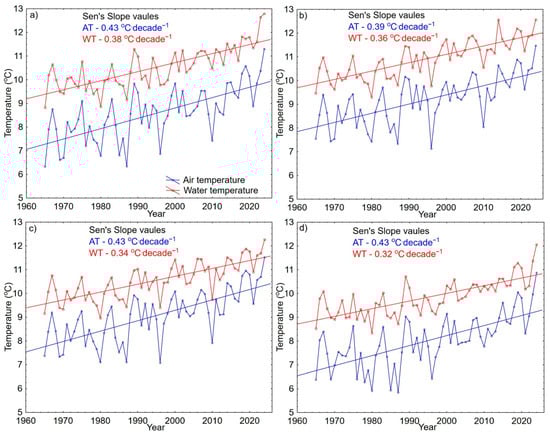
Figure 7.
Changes in mean annual air and water temperatures in the catchments of the Wisła (a), Odra (b), Warta (c), and Bug (d) river.
Lower changes in water temperature observed in January, February, and December were attributed to the occurrence of ice phenomena, which reduce the influence of air temperature fluctuations. In these winter months, correlations between changes in mean monthly water and air temperatures were inverse, whereas from March to November they were directly proportional (Figure 8).
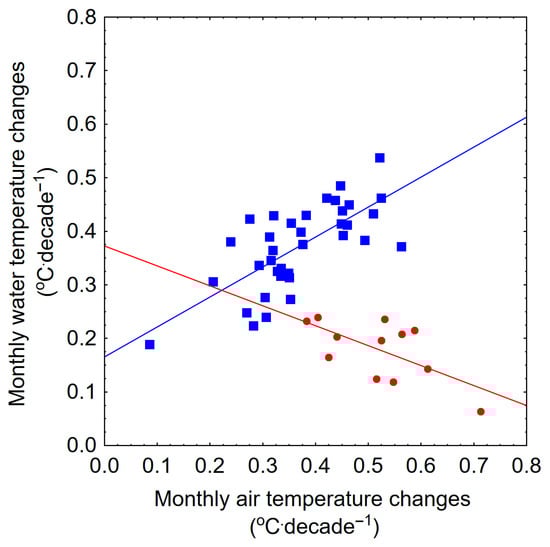
Figure 8.
Relationships between mean monthly changes in air and water temperatures for: December, January and February (red) and for March–November (blue).
Moreover, the analysis of the relationship WT = a.AT + b between water temperature (WT) and air temperature (AT), conducted on a monthly and annual basis for the years 1965–2024, revealed a strong relationship between water and air temperatures. On an annual scale, the values of the correlation coefficients ranged from 0.92 to 0.98 for the Wisła and Warta rivers, respectively (Table S3). On a monthly scale, the weakest relationships between water and air temperatures occurred during the winter months, from December to January. For the Wisła River, correlation coefficients ranged from 0.68 to 0.75, for the Oder from 0.87 to 0.92, for the Warta from 0.84 to 0.89, and for the Bug from 0.67 to 0.74. The relationship between WT and AT was weakened by the occurrence of ice phenomena. In contrast, the strongest relationships between WT and AT in the studied rivers were observed in June, with correlation coefficients ranging from 0.93 to 0.97.
4. Discussion
Contemporary climate change is driving transformations across numerous components of the natural environment, with rates of change varying according to their sensitivity and interactions with climatic factors. Each environmental process or phenomenon is governed by the combined influence of multiple variables, whose relative contributions differ depending on local conditions [,]. Within the hydrosphere, water temperature is a key characteristic that, as noted in the introduction, exerts a broad influence on aquatic ecosystems. However, information concerning the thermal regimes of rivers is often limited by the availability of appropriate long-term datasets. As observed by Grey et al. [], the analysis of long-term water temperature time series can be challenging due to low sampling frequency and data gaps. In addition to the lack or discontinuity of direct temperature records, a broader issue arises—namely, the limited availability of environmental data describing variables that shape river thermal conditions. This limitation hinders comprehensive assessments of factors determining river water temperature. A commonly used approach to overcome this issue involves estimating river thermal characteristics based on air temperature data, which typically show strong correlation between the two variables [,]. However, these relationships weaken when the water surface becomes insulated from atmospheric influences by ice cover, often resulting in inverse relationships during the winter season (Dec–Feb). Such dynamics are typical of rivers in cold regions, as confirmed by previous studies. For example, in the case of the Hinøgla River (Norway), water temperature in July, August, and September was found to be strongly correlated with air temperature, whereas this relationship was considerably weaker during the remaining months due to ice and snow cover conditions [].
It should be emphasized that air temperature measurements constitute some of the longest continuous environmental records, extending in the case of certain stations back to the 18th century []. Moreover, the global coverage and high consistency of these observations provide a reliable background for further analyses, including those related to processes occurring within the hydrosphere. The analyses conducted in this study confirmed a strong relationship between river water temperature and air temperature for the largest rivers in Poland. This finding forms a solid basis for reconstructing missing data and for identifying trends. As noted by Worrall et al. [], understanding the relationship between climate change and river thermal response requires long-term datasets, which provide greater reliability in detecting and quantifying such changes.
In the case of small rivers, the influence of local factors on water temperature is more pronounced. For instance, the thermal regime of the small Kocunia River (northern Poland) is strongly shaped by its position within the hydrographic network. Measurements taken downstream of Lake Sławianowskie showed that the mean annual water temperature was on average 1.5 °C higher, with the largest differences observed during the summer–autumn period, exceeding 4.0 °C []. Small rivers are also more affected by shading effects, which enhance their resistance to heating. A comparison of two Polish rivers demonstrated that higher forest cover reduced mean annual water temperature by 1.2 °C, and in the summer season, the difference reached 2.6 °C []. In contrast, large rivers, due to their geometric parameters and greater water mass (volume), exhibit higher thermal inertia. As a result, the heat exchange between atmospheric and local factors along particular reaches is largely buffered by the river’s transit character. The St. Lawrence River warmed more slowly in spring compared to its tributaries but remained warmer during autumn []. For the largest Polish rivers, similar behavior is reflected in consistent annual warming trends, averaging 0.35 °C · decade−1, with a narrow range from 0.32 to 0.38 °C · decade−1. These results align with the broader global pattern of river thermal regime shifts observed elsewhere. The Danube River, one of Europe’s major rivers, has warmed by 1.15 °C over the past three decades []. In the Yongan River basin (China), water temperature increased by 0.029–0.046 °C per year over a period exceeding thirty years (1980–2012) []. For the Hudson River (USA), a longer-term analysis (1920–1990) revealed a significant upward trend of 0.12 °C · decade−1 []. Research on the lower course of the Columbia River has shown that it is warming at a rate of 1.3 °C ± 0.1 °C per century []. Future projections are concerning. For the Rhine River, one of the largest in Central Europe, mean annual water temperature is expected to rise by +0.6 to +1.4 °C in the near future, and by +1.9 to +2.2 °C in the longer term [].
Given the crucial role of water temperature in maintaining aquatic ecosystem functioning, the changes observed in this study should be considered unfavorable, particularly with regard to water quality. Research on the Vrishabhavathy River (India) showed that water temperature is significantly negatively correlated with dissolved oxygen (DO) and pH, and positively correlated with conductivity, biological oxygen demand (BOD), chemical oxygen demand (COD), total hardness, and total dissolved solids []. Dissolved oxygen concentration is a key parameter in assessing water quality, as it affects a river’s self-purification capacity and determines the rate of mineralization []. Measurements from 2024 [] indicate that the lowest oxygen concentrations in the analyzed rivers ranged from 7.3 to 8.7 mg/L. As noted by Morrill et al. [], increases in water temperature can reduce dissolved oxygen levels, posing a threat to numerous aquatic species. In accordance with the EU Water Framework Directive, rivers are evaluated in terms of the ecological status of their water bodies, and for the cases analyzed here, the overall status was classified as bad []. Additionally, the hydrological monitoring stations included in this study were located in catchments sensitive to eutrophication, as evidenced by phenomena such as accelerated algal growth. Thermal changes also modify habitat conditions for aquatic organisms. In the context of climate change and ongoing warming trends, knowledge of species-specific thermal requirements is critical. In some of the studied Polish rivers, certain fish species are already living near their upper thermal thresholds []. Shifts in the spatial distribution of ichthyofauna may create opportunities for other species, including invasive ones, to occupy these niches, as they may be better adapted to the altered environmental conditions. Previous studies have confirmed the presence of invasive species in the analyzed rivers [,,]. The impact of invasive alien species currently represents a threat to biodiversity. Therefore, a thorough understanding of key ecosystem parameters, including water temperature, is essential for effective monitoring and management of riverine ecosystems. The relationships observed between water and air temperatures provide a valuable basis for incorporating thermal dynamics into water resource management, particularly since long-term changes affect the physico-chemical properties of water, including eutrophication processes. Future research should further explore the influence of catchment characteristics on the thermal regime and the contribution of anthropogenic thermal pollution.
5. Conclusions
Contemporary climate change highlights the need to understand processes affecting various components of the geosystem, including the hydrosphere. Among these, rivers play a particularly important role, and knowledge of the largest rivers is crucial at both national and regional scales. The study applied a previously unused analytical approach to the four largest rivers in Poland, demonstrating that considering one variable (air temperature) can be an effective solution for examining the thermal regime of rivers in the temperate zone. Such an approach is particularly valuable in situations where data on other variables affecting water temperature are lacking or incomplete. Given the critical importance of water temperature, this knowledge has practical applications in water resources management, including issues related to the physical and chemical properties of water and the assessment of its quality. Moreover, it is essential for the use of rivers in energy systems, as long-term changes driven by global warming may alter current operational assumptions. The ongoing transformation of river thermal regimes, as well as its scale and pace, should be carefully considered in interdisciplinary studies of riverine ecosystems and by agencies responsible for water resource management.
Supplementary Materials
The following supporting information can be downloaded at: https://www.mdpi.com/article/10.3390/su172310737/s1, S1. Detailed Methodological Formulations, Figure S1. Distribution of wavelet power spectra for the Odra river thermal regime across time-frequency from 1965–2024 for (a) water temperature, and (b) air temperature. Figure S2. Distribution of wavelet power spectra for the Bug river thermal regime across time-frequency from 1965–2024 for (a) water temperature, and (b) air temperature. Figure S3. Distribution of wavelet power spectra for the Warta river thermal regime across time-frequency from 1965–2024 for (a) water temperature, and (b) air temperature. Table S1. Validation results of linear and polynomial regression models applied for the reconstruction of missing monthly and annual water temperature data for the Odra and Warta rivers. Table S2. Results of trend analysis for air temperature (AT) and water temperature (WT) in the years 1965–2024. Table S3. Results of the analysis of the relationship WT = aAT + b between water temperature (WT) and air temperature (AT) on a monthly and annual basis for the years 1965–2024.
Author Contributions
Conceptualization, M.P., T.A.; methodology, M.P., T.A., M.S.; software, T.A., M.S.; validation, T.A., M.S.; formal analysis, M.P., T.A., M.S.; investigation, M.P., T.A., M.S.; resources, M.P.; data curation, M.P., M.S., K.S.-P.; writing—original draft preparation, M.P., T.A., M.S., K.S.-P.; writing—review and editing, M.P., T.A., M.S.; visualization, T.A., M.S.; supervision, M.P.; project administration, M.P.; funding acquisition, M.P. All authors have read and agreed to the published version of the manuscript.
Funding
This research received no external funding.
Institutional Review Board Statement
Not applicable.
Informed Consent Statement
Not applicable.
Data Availability Statement
Dataset available on request from the authors.
Conflicts of Interest
The authors declare no conflicts of interest.
References
- Ptak, M.; Choiński, A.; Strzelczak, A.; Targosz, A. Disappearance of Lake Jelenino since the end of the XVIII century as an effect of anthropogenic transformations of the natural environment. Pol. J. Environ. Stud. 2013, 22, 191–196. [Google Scholar]
- Zhu, S.; Ptak, M.; Choiński, A.; Wu, S. Exploring and quantifying the impact of climate change on surface water temperature of a high mountain lake in Central Europe. Environ. Monit. Assess. 2020, 192, 7. [Google Scholar] [CrossRef]
- Cameron, E.; Oliva, M.; Antoniades, D. High Arctic lakes reveal accelerating ecological shifts linked to twenty-first century warming. Sci. Rep. 2025, 15, 77. [Google Scholar] [CrossRef]
- Liu, C.; Chen, Y.; Huang, W.; Fang, G.; Li, Z.; Zhu, C.; Liu, Y. Climate warming positively affects hydrological connectivity of typical inland river in arid Central Asia. NPJ Clim. Atmos. Sci. 2024, 7, 250. [Google Scholar] [CrossRef]
- Merchant, C.J.; Allan, R.P.; Embury, O. Quantifying the acceleration of multidecadal global sea surface warming driven by Earth’s energy imbalance. Environ. Res. Lett. 2025, 20, 024037. [Google Scholar] [CrossRef]
- Feron, S.; Malhotra, A.; Bansal, S.; Fluet-Chouinard, E.; McNicol, G.; Knox, S.H.; Delwiche, K.B.; Cordero, R.R.; Ouyang, Z.; Zhang, Z.; et al. Recent increases in annual, seasonal, and extreme methane fluxes driven by changes in climate and vegetation in boreal and temperate wetland ecosystems. Glob. Change Biol. 2024, 30, e17131. [Google Scholar] [CrossRef]
- Hoffmann, B.; Feakins, S.J.; Bookhagen, B.; Olen, S.M.; Adhikari, D.P.; Mainali, J.; Sachse, D. Climatic and geomorphic drivers of plant organic matter transport in the Arun River, E Nepal. Earth Planet. Sci. Lett. 2016, 452, 104–114. [Google Scholar] [CrossRef]
- Saleem, A.; Dewan, A.; Rahman, M.M.; Nawfee, S.M.; Karim, R.; Lu, X.X. Spatial and temporal variations of erosion and accretion: A case of a large tropical river. Earth Syst. Environ. 2020, 4, 167–181. [Google Scholar] [CrossRef]
- Onwude, A.M.; Fran, A.E.; Abel, I.; Eric, O. Biodiversity of fish fauna in river niger at Agenebode, Edo State, Nigeria. Egypt. J. Aquat. Biol. Fish. 2019, 23, 159–166. [Google Scholar] [CrossRef]
- Yimere, A.; Assefa, E. Current and future irrigation water requirement and potential in the Abbay River Basin, Ethiopia. Air Soil Water Res. 2022, 15, 11786221221097929. [Google Scholar] [CrossRef]
- Skoulikaris, C. Run-Of-River Small Hydropower Plants as Hydro-Resilience Assets against Climate Change. Sustainability 2021, 13, 14001. [Google Scholar] [CrossRef]
- Payne, A.I. Asian upland fishes and fisheries. In Freshwater Fisheries Ecology; Wiley: Hoboken, NJ, USA, 2015; pp. 377–383. [Google Scholar]
- Plotnikova, E.; Vienažindienė, M.; Slavinskas, S. Development of Inland Waterway Transport as a Key to Ensure Sustainability: A Case Study of Lithuania. Sustainability 2022, 14, 10532. [Google Scholar] [CrossRef]
- Syvitski, J.; Cohen, S.; Miara, A.; Best, J. River temperature and the thermal-dynamic transport of sediment. Glob. Planet. Change 2019, 178, 168–183. [Google Scholar] [CrossRef]
- Leach, J.A.; Kelleher, C.; Kurylyk, B.L.; Moore, R.D.; Neilson, B.T. A primer on stream temperature processes. Wiley Interdiscip. Rev. Water 2023, 10, e1643. [Google Scholar] [CrossRef]
- Bonacina, L.; Fasano, F.; Mezzanotte, V.; Fornaroli, R. Effects of water temperature on freshwater macroinvertebrates: A systematic review. Biol. Rev. 2023, 98, 191–221. [Google Scholar] [CrossRef]
- Loerke, E.; Pohle, I.; Wilkinson, M.E.; Rivington, M.; Wardell-Johnson, D.; Geris, J. Long-term daily stream temperature record for Scotland reveals spatio-temporal patterns in warming of rivers in the past and further warming in the future. Sci. Total Environ. 2023, 890, 164194. [Google Scholar] [CrossRef]
- Vasilenko, A.; Frolova, N.; Grigoriev, V.Y.; Magritsky, D.; Shevchenko, A.; Winde, F. Spatio-temporal variability of water temperature of Arctic rivers in Russia over the past 60 years. Appl. Sci. 2024, 14, 10942. [Google Scholar] [CrossRef]
- Shrestha, R.R.; Pesklevits, J.C.; Bonsal, B.R.; Brannen, R.; Guo, T.; Hoffman, S. Rising summer river water temperature across Canada: Spatial patterns and hydroclimatic controls. Environ. Res. Lett. 2024, 19, 044058. [Google Scholar] [CrossRef]
- Das, N.; Bhattacharjee, R.; Choubey, A.; Agnihotri, A.K.; Ohri, A.; Gaur, S. Analysis of the spatio-temporal variation of the thermal pattern of River Ganges in proximity to Varanasi, India. J. Indian Soc. Remote Sens. 2022, 50, 1119–1134. [Google Scholar] [CrossRef]
- Liu, S.; Zhenghui, X.; Liu, B.; Wang, Y.; Gao, J.; Zeng, Y.; Xie, J.; Zhipeng, X.; Jia, B.; Qin, P.; et al. Global river water warming due to climate change and anthropogenic heat emission. Glob. Planet. Change 2020, 193, 103289. [Google Scholar] [CrossRef]
- Johnson, M.F.; Albertson, L.K.; Algar, A.C.; Dugdale, S.J.; Edwards, P.; England, J.; Gibbins, C.; Kazama, S.; Komori, D.; MacColl, A.; et al. Rising water temperature in rivers: Ecological impacts and future resilience. Wiley Interdiscip. Rev. Water 2024, 11, e1724. [Google Scholar] [CrossRef]
- Brown, T.M.; O’Connor, J.; Genner, M.J. Climate warming drives population trajectories of freshwater fish. Proc. Natl. Acad. Sci. USA 2024, 121, e2410355121. [Google Scholar] [CrossRef]
- Fritioff, Å.; Kautsky, L.; Greger, M. Influence of temperature and salinity on heavy metal uptake by submersed plants. Environ. Pollut. 2005, 133, 265–274. [Google Scholar] [CrossRef]
- Ptak, M. Wpływ zalesienia na temperaturę wody w rzece. Leśne Pr. Badaw. 2017, 78, 251–256. [Google Scholar]
- Ptak, M.; Amnuaylojaroen, T.; Sojka, M. Historical and future changes in water temperature of the Pilica River (Central Europe) in response to global warming. Sustainability 2024, 16, 10244. [Google Scholar] [CrossRef]
- Yang, R.; Wu, S.; Wu, X.; Ptak, M.; Li, X.; Sojka, M.; Graf, R.; Dai, J.; Zhu, S. Quantifying the impacts of climate variation, damming and flow regulation on river thermal dynamics: A case study of the Włocławek Reservoir in the Wisła River, Poland. Environ. Sci. Eur. 2022, 34, 3. [Google Scholar] [CrossRef]
- Sun, J.; Di Nunno, F.; Sojka, M.; Ptak, M.; Zhou, Q.; Luo, Y.; Zhu, S.; Granata, F. Long-term daily water temperatures unveil escalating water warming and intensifying heatwaves in the Odra River Basin, Europe. Geosci. Front. 2024, 15, 101916. [Google Scholar] [CrossRef]
- Łaszewski, M.A. Diurnal water temperature dynamics in lowland rivers: A case study from Central Poland. J. Water L. Dev. 2018, 36, 89–97. [Google Scholar] [CrossRef]
- Ptak, M. Long-term temperature fluctuations in rivers of the Fore-Sudetic region in Poland. Geografie 2018, 123, 279–294. [Google Scholar] [CrossRef]
- Daigle, A.; Légaré, A. Trend detection in the temperature of Quebec (Canada) rivers. Hydrol. Sci. J. 2024, 69, 2214–2226. [Google Scholar] [CrossRef]
- Sojka, M.; Ptak, M. Possibilities of river water temperature reconstruction using statistical models in the context of long-term thermal regime changes assessment. Appl. Sci. 2022, 12, 7503. [Google Scholar] [CrossRef]
- Jurgelėnaitė, A.; Kriaučiūnienė, J.; Šarauskienė, D. Spatial and temporal variation in the water temperature of Lithuanian rivers. Baltica 2012, 25, 65–76. [Google Scholar] [CrossRef]
- Niedrist, G.H. Substantial warming of Central European mountain rivers under climate change. Reg. Environ. Change 2023, 23, 43. [Google Scholar] [CrossRef]
- Briciu, A.E.; Mihăilă, D.; Graur, A.; Oprea, D.I.; Prisăcariu, A.; Bistricean, P.I. Changes in the Water Temperature of Rivers Impacted by the Urban Heat Island: Case Study of Suceava City. Water 2020, 12, 1343. [Google Scholar] [CrossRef]
- Wrzesiński, D. Entropia Odpływu Rzek w Polsce; Wydawnictwo Naukowe Bogucki: Poznań, Poland, 2013. [Google Scholar]
- Torrence, C.; Compo, G.P. A practical guide to wavelet analysis. Bull. Am. Meteorol. Soc. 1998, 79, 61–78. [Google Scholar] [CrossRef]
- Grinsted, A.; Moore, J.C.; Jevrejeva, S. Application of the cross wavelet transform and wavelet coherence to geophysical time series. Nonlinear Process. Geophys. 2004, 11, 561–566. [Google Scholar] [CrossRef]
- Gasparrini, A.; Armstrong, B.; Kenward, M.G. Distributed lag non-linear models. Stat. Med. 2010, 29, 2224–2234. [Google Scholar] [CrossRef]
- Nelsen, R.B. An Introduction to Copulas, 2nd ed.; Springer: Berlin/Heidelberg, Germany, 2006. [Google Scholar]
- Joe, H. Dependence Modeling with Copulas; CRC Press: London, UK, 2014. [Google Scholar]
- Gilman, D.L.; Fuglister, F.J.; Mitchell, J.M., Jr. On the power spectrum of “red noise”. J. Atmos. Sci. 1963, 20, 182–184. [Google Scholar] [CrossRef]
- Torrence, C.; Webster, P.J. Interdecadal changes in the ENSO-monsoon system. J. Clim. 1999, 12, 2679–2690. [Google Scholar] [CrossRef]
- Maraun, D.; Kurths, J. Cross wavelet analysis: Significance testing and pitfalls. Nonlinear Process. Geophys. 2004, 11, 505–514. [Google Scholar] [CrossRef]
- Gasparrini, A. Distributed lag linear and non-linear models in R: The package dlnm. J. Stat. Softw. 2011, 43, 1–20. [Google Scholar] [CrossRef] [PubMed]
- Gasparrini, A.; Scheipl, F.; Armstrong, B.; Kenward, M.G. A penalized framework for distributed lag non-linear models. Biometrics 2017, 73, 938–948. [Google Scholar] [CrossRef] [PubMed]
- de Boor, C. A Practical Guide to Splines, (Edition); Springer: Berlin, Germany, 1978. [Google Scholar]
- Wood, S.N. Generalized Additive Models: An Introduction with R. Chapman and Hall; CRC: Boca Raton, FL, USA, 2017. [Google Scholar]
- McCullagh, P. Generalized Linear Models; Routledge: London, UK, 2019. [Google Scholar]
- Armstrong, B.G.; Gasparrini, A.; Tobias, A. Conditional Poisson models: A flexible alternative to conditional logistic case cross-over analysis. BMC Med. Res. Methodol. 2014, 14, 122. [Google Scholar] [CrossRef] [PubMed]
- Sklar, A. Fonctions de Répartition à n Dimensions et Leurs Marges; Publications de l’Institut de Statistique de l’Université de Paris: Paris, France, 1959; Volume 8, pp. 229–231. [Google Scholar]
- Genest, C.; Favre, A.C. Everything you always wanted to know about copula modeling but were afraid to ask. J. Hydrol. Eng. 2007, 12, 347–368. [Google Scholar] [CrossRef]
- Demarta, S.; McNeil, A.J. The t copula and related copulas. Int. Stat. Rev. 2005, 73, 111–129. [Google Scholar] [CrossRef]
- Clayton, D.G. A model for association in bivariate life tables and its application in epidemiological studies of familial tendency in chronic disease incidence. Biometrika 1978, 65, 141–151. [Google Scholar] [CrossRef]
- Gumbel, E.J. Bivariate exponential distributions. J. Am. Stat. Assoc. 1960, 55, 698–707. [Google Scholar] [CrossRef]
- Frank, M.J. On the simultaneous associativity of F(x,y) and x + y − F(x,y). Aequationes Math. 1979, 19, 194–226. [Google Scholar] [CrossRef]
- Genest, C. Frank’s family of bivariate distributions. Biometrika 1987, 74, 549–555. [Google Scholar] [CrossRef]
- Kendall, M.G. A new measure of rank correlation. Biometrika 1938, 30, 81–93. [Google Scholar] [CrossRef]
- Genest, C.; MacKay, J. The joy of copulas: Bivariate distributions with uniform marginals. Am. Stat. 1986, 40, 280–283. [Google Scholar] [CrossRef]
- Akaike, H. A new look at the statistical model identification. IEEE Trans. Autom. Control 2003, 19, 716–723. [Google Scholar] [CrossRef]
- Joe, H. Multivariate Models and Dependence Concepts; Chapman & Hall: London, UK, 1997. [Google Scholar]
- Coles, S.; Heffernan, J.; Tawn, J. Dependence measures for extreme value analyses. Extremes 1999, 2, 339–365. [Google Scholar] [CrossRef]
- Embrechts, P.; McNeil, A.; Straumann, D. Correlation and dependence in risk management: Properties and pitfalls. In Risk Management: Value at Risk and Beyond; Cambridge University Press: Cambridge, UK, 2002; pp. 176–223. [Google Scholar]
- Cherubini, U.; Luciano, E.; Vecchiato, W. Copula Methods in Finance; John Wiley & Sons: Hoboken, NJ, USA, 2004. [Google Scholar]
- Kendall, M.G.; Stuart, A. The Advanced Theory of Statistics, 3rd ed.; Charles Griffin Ltd.: Knutsford, UK, 1968. [Google Scholar]
- Gilbert, R.O. Statistical Methods for Environmental Pollution Monitorin; Van Nos-trand Reinhold Co.: New York, NY, USA, 1987. [Google Scholar]
- Patakamuri, S.K.; O’Brien, N. Modified Versions of Mann Kendall and Spearman’s Rho Trend Tests, Version 1.6. Available online: https://cran.r-project.org/web/packages/modifiedmk/modifiedmk.pdf (accessed on 15 October 2025).
- Ptak, M.; Amnuaylojaroen, T.; Huang, W.; Wang, L.; Sojka, M. Role of lake morphometric and environmental drivers of ice cover formation on temperate lakes: A case study from the Eastern Baltic Lakeland, Poland. Resources 2024, 13, 146. [Google Scholar] [CrossRef]
- Ptak, M.; Szyga-Pluta, K.; Sojka, M. Long-term dynamics of water level fluctuations in lowland lakes in Central Europe (North Poland). Sci. Rep. 2025, 15, 1216. [Google Scholar] [CrossRef]
- Grey, V.; Hatt, B.E.; Fletcher, T.D.; Smith-Miles, K.; Coleman, R.A. Analysis of irregularly sampled stream temperature time series: Challenges and solutions. J. Hydrol. 2024, 636, 131244. [Google Scholar] [CrossRef]
- Ptak, M.; Heddam, S.; Haddout, S.; Sojka, M.; Amnuaylojaroen, T. Long-term changes in the thermal and ice regime of the Biebrza River (northeastern Poland) in the era of global warming. Water 2024, 16, 3211. [Google Scholar] [CrossRef]
- Bonacci, O.; Žaknić-Ćatović, A.; Roje-Bonacci, T. Significant Rise in Sava River Water Temperature in the City of Zagreb Identified across Various Time Scales. Water 2024, 16, 2337. [Google Scholar] [CrossRef]
- Kvambekk, Å.S.; Melvold, K. Long-term trends in water temperature and ice cover in the subalpine lake, Øvre Heimdalsvatn, and nearby lakes and rivers. Hydrobiologia 2010, 642, 47–60. [Google Scholar] [CrossRef]
- Kolar, P. Changes and variability of spring-summer air temperature in Czechia during the past 300 years: Comparison of instrumental, documentary and natural proxy data. Geografie 2017, 122, 190–212. [Google Scholar] [CrossRef]
- Worrall, F.; Howden, N.J.; Burt, T.P.; Hannah, D.M. River water temperature demonstrates resistance to long-term air temperature change. Hydrol. Process. 2022, 36, e14732. [Google Scholar] [CrossRef]
- Nowak, B.; Ptak, M.; Stanek, P. Influence of a lake on river water thermal regime: A case study of Lake Sławianowskie and the Kocunia River (Pomeranian Lakeland, Northern Poland). Meteorol. Hydrol. Water Manag. 2020, 8, 78–83. [Google Scholar] [CrossRef]
- Hudon, C.; Armellin, A.; Gagnon, P.; Patoine, A. Variations in water temperatures and levels in the St. Lawrence River (Québec, Canada) and potential implications for three common fish species. Hydrobiologia 2010, 647, 145–161. [Google Scholar] [CrossRef]
- Pekárová, P.; Bajtek, Z.; Pekár, J.; Výleta, R.; Bonacci, O.; Miklánek, P.; Belz, J.; Gorbachova, L. Monthly stream temperatures along the Danube River: Statistical analysis and predictive modelling with incremental climate change scenarios. J. Hydrol. Hydromech. 2023, 71, 382–398. [Google Scholar] [CrossRef]
- Chen, D.; Hu, M.; Guo, Y.; Dahlgren, R.A. Changes in river water temperature between 1980 and 2012 in Yongan watershed, eastern China: Magnitude, drivers and models. J. Hydrol. 2016, 533, 191–199. [Google Scholar] [CrossRef]
- Ashizawa, D.; Cole, J.J. Long-term temperature trends of the Hudson River: A study of the historical data. Estuaries 1994, 17, 166–171. [Google Scholar] [CrossRef]
- Scott, M.H.; Talke, S.A.; Jay, D.A.; Diefenderfer, H.L. Warming of the lower Columbia River 1853 to 2018. River Res. Appl. 2023, 39, 1828–1845. [Google Scholar] [CrossRef]
- Hardenbicker, P.; Viergutz, C.; Becker, A.; Kirchesch, V.; Nilson, E.; Fischer, H. Water temperature increases in the river Rhine in response to climate change. Reg. Environ. Change 2017, 17, 299–308. [Google Scholar] [CrossRef]
- Ahipathy, M.V.; Puttaiah, E.T. Ecological characteristics of vrishabhavathy River in Bangalore (India). Environ. Geol. 2006, 49, 1217–1222. [Google Scholar] [CrossRef]
- Ptak, M.; Nowak, B. Variability of oxygen-thermal conditions in selected lakes in Poland. Ecol. Chem. Eng. S 2016, 23, 639–650. [Google Scholar] [CrossRef]
- Available online: https://wody.gios.gov.pl/pjwp/publication/367 (accessed on 15 October 2025).
- Morrill, J.C.; Bales, R.C.; Conklin, M.H. Estimating stream temperature from air temperature: Implications for future water quality. J. Environ. Eng. 2005, 131, 139–146. [Google Scholar] [CrossRef]
- Available online: http://karty.apgw.gov.pl (accessed on 15 October 2025).
- Radtke, G.; Bernaś, R. Temperature tolerance of European fish species based on thermal maxima in southern Baltic Sea-basin streams. Ecol. Indic. 2025, 170, 113107. [Google Scholar] [CrossRef]
- Semenchenko, V.; Grabowska, J.; Grabowski, M.; Rizevsky, V.; Pluta, M. Non-native fish in Belarusian and Polish areas of the European central invasion corridor. Oceanol. Hydrobiol. Stud. 2011, 40, 57–67. [Google Scholar] [CrossRef]
- Płąchocki, D.; Kobak, J.; Kakareko, T. First report on the importance of alien gobiids in the diet of native piscivorous fishes in the lower Wisła River (Poland). Oceanol. Hydrobiol. Stud. 2012, 41, 83–89. [Google Scholar] [CrossRef]
- Kokocińska, K.; Ośko, K.; Kośla, K.; Rechulicz, J. Gatunki inwazyjne ryb w głównych rzekach Lubelszczyzny. 117. In Wybrane Zagadnienia Produkcji Zwierzęcej; Chabuza, W., Nowakowicz-Dębek, B., Eds.; Uniwersytet Przyrodniczy w Lublinie: Lublin, Poland, 2021. [Google Scholar]
Disclaimer/Publisher’s Note: The statements, opinions and data contained in all publications are solely those of the individual author(s) and contributor(s) and not of MDPI and/or the editor(s). MDPI and/or the editor(s) disclaim responsibility for any injury to people or property resulting from any ideas, methods, instructions or products referred to in the content. |
© 2025 by the authors. Licensee MDPI, Basel, Switzerland. This article is an open access article distributed under the terms and conditions of the Creative Commons Attribution (CC BY) license (https://creativecommons.org/licenses/by/4.0/).