Abstract
Smallholder coffee producers in the Amazonas Region, Peru, face increasing climate variability, yet evidence on their sensitivity and adaptive capacity remains limited. This study quantifies both dimensions for organised producers (associations and cooperatives) using a large cross-sectional survey (N = 5473). Composite indices were constructed via polychoric principal component analysis (PCA): items were harmonised to a common direction, standardised (z-scores), and rescaled to 0–1. Average Sensitivity and Adaptive Capacity were intermediate (0.49 and 0.47), indicating moderate overall vulnerability. Group comparisons reveal statistically significant heterogeneity across producer characteristics and territories. Cooperative members exhibit higher Adaptive Capacity than association members (0.50 vs. 0.43), consistent with stronger organisational services and networks; differences in Sensitivity are modest and vary across dimensions. Additional variation is observed by gender, farming experience, and province (Bagua, Luya, Rodríguez de Mendoza, Utcubamba). Post hoc tests (Tukey) indicate where pairwise differences concentrate. The findings prioritise organisational strengthening, targeted financial and technical support, and territorially tailored interventions to enhance resilience. These results inform regional adaptation policies and cooperative-strengthening programmes to improve the climate robustness of smallholder coffee systems in the Amazonas region, Peru.
1. Introduction
Coffee is one of Peru’s main agricultural export products and a socioeconomic pillar for several Andean and Amazonian regions [1]. Peru’s north-eastern region constitutes 40% of the nation’s total coffee-growing area, with notable production occurring in regions such as Cajamarca, Amazonas and San Martín [2]. In the Amazonas region, coffee farming is the primary source of income for thousands of families, and it articulates social and organisational dynamics through associations and cooperatives that facilitate access to markets, certifications, and technical assistance [2,3]. Nevertheless, this production system is under threat from climate change, as evidenced by rising temperatures and precipitation variability, a greater prevalence of pests and diseases, and the displacement of agroecologically optimal zones for Coffea arabica [4,5,6].
According to the literature on the subject, the vulnerability of coffee crops to climate change is a result of a combination of factors, including exposure to extreme events, the crop’s sensitivity, and the producers’ adaptive capacity to respond to such changes [7,8,9]. In addition, factors such as farm size, degree of productive diversification, access to climate information, availability of financial resources, and participation in organisational networks are closely associated with the adaptation options available [10,11]. In this sense, producer organisations are central actors associated with the provision of services and in the reduction in technical and commercial gaps, although their effectiveness depends on their management capacity, internal cohesion, and articulation with public policies and specialised markets [12,13,14].
In Latin America, experiences such as the rust crisis in Colombia and Central America have shown that the lack of access to timely climate information, financing, and technical assistance is associated with more severe impacts and slows down productive recovery [4,15]. In the Peruvian context, ref. [16] underline the need for coordinated interventions to strengthen territorial governance and promote resilient production systems. In regions such as the Amazon, the location of the crop on hillsides and the dependence on specific microclimates increase its sensitivity to climate variability [2]. Furthermore, ref. [17] noted that the development of coffee growing in the Amazonas region was primarily influenced by socioeconomic and climatic factors. While the adoption of strategies such as agroforestry systems has shown significant benefits for adaptation, their implementation faces technical, economic and training limitations [18,19].
Despite growing evidence on the impacts of climate change on the coffee value chain, a knowledge gap persists on how sensitivity and adaptive capacity vary among organised producers in specific contexts, such as the Amazon [2,16]. Understanding these dynamics is essential to designing adaptation strategies that integrate organisational strengthening with productive sustainability and climate resilience. Hereafter, we refer to the SYCACC Sensitivity index and the SYCACC Adaptive Capacity index as the two components of the Sensitivity and Adaptive Capacity to Climate Change (SYCACC) framework.
Although our empirical focus is on the Amazonas region, this area is part of Peru’s core coffee belt. National production is highly concentrated in a few regions—especially Junín, Cajamarca, San Martín and Amazonas—which together account for most of the country’s coffee area and output [20,21]. Peru is among the world’s main Arabica producers and a leading exporter of organic and Fair-Trade coffee, with more than 200,000 mostly smallholder farms and an estimated 223,000 rural families depending primarily on coffee income [21,22]. In this context, Amazonas stands out as a frontier region where coffee is the principal cash crop and producer organisations are central to market access, making it a strategically relevant case for analysing climate-related sensitivity and adaptive capacity in smallholder coffee systems.
Within this framework, the general objective of the research was to evaluate the level of sensitivity and adaptive capacity to climate change in organised coffee producers in the Amazonas region of Peru. Specifically, it was proposed to: (i) develop two composite indices—the SYCACC Sensitivity index and the SYCACC Adaptive Capacity index—that integrate variables linked to each construct; (ii) compare SYCACC levels among different subgroups of producers according to geographic location, seniority in the coffee activity, educational level, gender and type of organisation; and (iii) identifying critical dimensions that contribute to higher levels of sensitivity and adaptive capacity.
Drawing on asset-based and institutional approaches to climate vulnerability, we formulated the following working hypotheses. First, we expected producers facing more constrained endowments and weaker access to services—namely, younger and less experienced farmers, women, and those in less endowed territories—to exhibit higher Sensitivity and lower Adaptive Capacity than older, more professional and better-connected producers. Second, we hypothesised that members of cooperatives would display higher Adaptive Capacity than members of associations, reflecting their typically stronger governance structures and service provision, while remaining agnostic ex ante about differences in Sensitivity by organisation type and treating these as an empirical question. Third, we anticipated that dimensions related to physical and financial resources would be more strongly associated with Sensitivity, whereas organisational and network-related dimensions would contribute more strongly to Adaptive Capacity, given the central role of collective action and market linkages in smallholder coffee systems.
This study makes three contributions to the literature on climate vulnerability in smallholder coffee systems. First, it provides one of the few quantitative assessments of both Sensitivity and Adaptive Capacity among organised coffee producers in the Peruvian Amazon, using a large producer-level dataset disaggregated by gender, experience, organisational type and province. Second, it operationalises the vulnerability framework by constructing multidimensional indices that explicitly distinguish between natural, human, physical, and financial resources on the Sensitivity side, and between producer-level, organisational, and socio-productive network dimensions on the Adaptive Capacity side. This allows us not only to estimate overall vulnerability levels but also to identify which specific dimensions drive variability across groups. Third, by comparing cooperatives and associations within the same value chain and territorial context, the study adds new evidence on how different organisational arrangements are associated with both higher Adaptive Capacity and differentiated patterns of Sensitivity, offering nuanced insights for the design of climate-resilient cooperative and association support programmes beyond the Amazonian context.
1.1. Context of Organised Producers in Amazonas
The results presented in this section are based on the National Agrarian Survey (ENA, in its Spanish acronym), which is collected annually by the National Institute of Statistics and Informatics of Peru [23]. This statistical operation employs a probabilistic sample design that ensures representativeness at the departmental level, allowing for robust inferences for the Amazonas region. However, it is essential to note that the ENA lacks specific representativeness by crop, so the data referred to coffee should be interpreted as estimates based on the available sample, which constitutes a valuable but not exhaustive input to characterising regional coffee production.
Section 1.1 presents background ENA indicators, contrasting organised and non-organised producers, to contextualise the study setting. The analytic sample in this paper comprises organised producers; all inferential comparisons are therefore conducted within this population.
Coffee production in the Amazonas region exhibits a notable concentration of volumes in the hands of non-member producers, although members participate significantly in relative terms. Between 2021 and 2024, the contribution of non-organised producers to total annual production remained above 60%, reaching its peak in 2023 with 65.2% (33,263.6 tons). The organised contributed between 34.8% and 38.2% of the total, standing out for their stability over time and for an increase in 2024, which resulted in them producing 16,594.6 tons (Figure 1). These data indicate that, although non-organised account for the bulk of production, associates maintain a significant participation in the production.
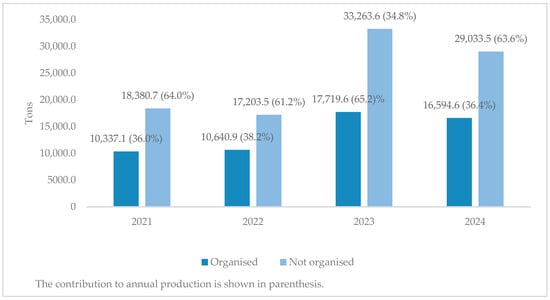
Figure 1.
Total annual production and contribution to yearly production.
The organisational structure reveals; however, a low proportion of producers who are integrated into associations or cooperatives (organised). Throughout the period analysed, their share did not exceed 15%, reaching its maximum in 2022 and 2023 (14.6% and 14.7%, respectively), and its minimum in 2021 (10.3%) (Figure 2). Although the year-to-year differences are not statistically significant, these data offer a relative benchmark that aligns with previous evidence, which indicates that organisational membership in rural coffee contexts tends to be limited by barriers such as membership costs, geographic dispersion and internal organisational dynamics [3,13,14].
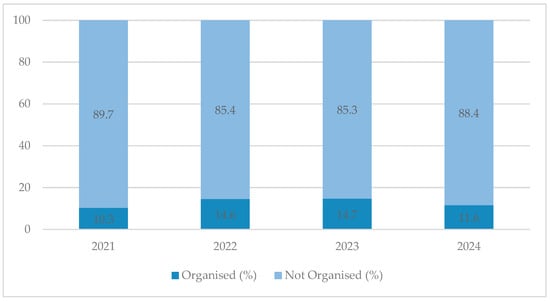
Figure 2.
Distribution of producers, by organisational status.
In terms of marketing, the selling price of coffee at the producer level shows a convergent trend between organised and non-organised producers, although with a slight advantage for the former in most years (Figure 3). Between 2021 and 2022, both groups experienced a substantial increase, reaching a maximum of S/15.0 for members and S/14.3 for non-members in 2022. Subsequently, prices decreased in 2023 and stabilised in 2024, maintaining the difference in favour of members. This gap, although modest, may be associated with the ability of organisations to access differentiated markets, improve bean quality and negotiate better sales conditions, as documented by studies on coffee value chains in Latin American contexts [12,14].
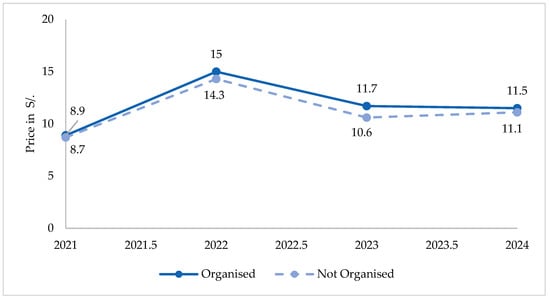
Figure 3.
Coffee selling price, at the producer level.
In terms of individual productivity, organised producers outperformed non-organised producers in almost the entire period analysed. The year 2024 stands out, as the average annual production of the organised sector reached 4.2 tons, compared to 2.0 tons for the non-organised sector (Figure 4). This difference suggests that organisational integration could be linked to better agronomic practices, greater access to inputs and technical assistance, as well as more efficient management of productive resources. However, it is also possible that interannual variability responds to climatic and market factors that affect each group differently, which reinforces the need to evaluate sensitivity and adaptive capacity with an integrated approach.
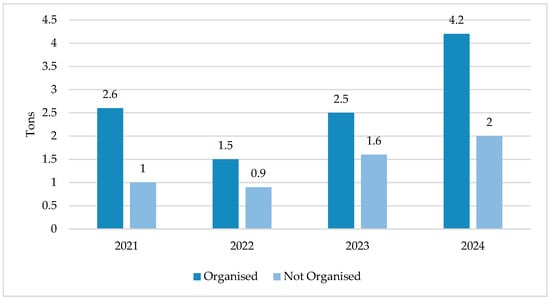
Figure 4.
Average annual production (in tons), by state of organisation.
1.2. Vulnerability, Sensitivity, Adaptive Capacity and Climate Change Approaches
Climate change represents one of the most significant challenges to the sustainability of agricultural systems worldwide, as it alters the patterns of temperature, precipitation, and the frequency of extreme events, with direct repercussions on crop productivity, quality, and viability [5]. In this regard, producers would base their decisions on adaptability to climate change on experimentation and evaluation of results in an ideal production environment, with sufficient information and incentives [24]. Therefore, in production systems such as coffee, these alterations acquire relevance due to their rigorous agroecological requirements. In the Peruvian case, coffee-growing areas, located mainly between 800 and 1800 m above sea level, depend on relatively stable temperatures, ranging from 18 to 23 °C, and annual rainfall of 1200 to 1800 mm [2]. Even modest changes in these parameters can displace suitable production areas to higher altitudes, reduce yields, deteriorate bean quality and increase the incidence of pests and diseases such as coffee rust (Hemileia vastatrix), coffee borer (Hypothenemus hampei) and nematodes [10,25].
In the IPCC analytical framework, vulnerability is defined as the degree to which a system is susceptible or unable to cope with the adverse effects of climate change, including climate variability and extreme events [5]. Vulnerability results from the interaction between exposure, sensitivity and adaptive capacity, and is manifested differently according to the socioeconomic, institutional and environmental conditions of each context. For agricultural value chains, this is a multidimensional notion that encompasses biophysical, economic, institutional and sociocultural factors [8]. Ref. [2] stress that, in coffee, vulnerability is not limited to the plot or the producer but also depends on the strength of intermediate organisations, such as cooperatives and associations, and sectoral governance. In this study, we therefore focus on operationalising Sensitivity and Adaptive Capacity as two constitutive components of vulnerability, without constructing a single composite vulnerability index because independent exposure metrics at an adequately disaggregated scale are not available.
Sensitivity, understood as the degree to which a system is affected positively or negatively by climatic stimuli, is an essential component of vulnerability. In the case of coffee, it is associated with the availability and quality of natural resources, productive infrastructure, producers’ technical knowledge and access to financial resources. Producers with farms in low-altitude and steep-slope areas tend to be more sensitive due to greater exposure to erosion and water stress, especially when they lack productive diversification or access to updated climate information [2,9].
Adaptive capacity, on the other hand, is defined as the ability of a system to adjust to climate change, moderate potential damages, take advantage of opportunities or cope with the consequences. It includes components such as human, social, physical, financial and natural capital, which together underpin producers’ the ability of producers to respond to climate change [5]. From the value chain approach, ref. [26] argue that strengthening these assets is a necessary condition for small producers to enter differentiated markets and adapt to productive changes successfully. In the coffee industry, cooperatives and associations serve as catalysts for adaptation by providing technical assistance, facilitating access to financing, and promoting collective innovation processes.
The assessment of sensitivity and adaptive capacity can be addressed through two complementary approaches: the impact approach, which projects future effects based on climate and agronomic models to identify risks and adaptation options, and the capacity approach, which analyses the current conditions of producers to implement robust actions in the face of different scenarios [8]. The integration of both approaches is essential to designing strategies that consider both the expected climate hazards and the actual response capacities of the actors. In the case of organised coffee producers in Amazonas, this type of analysis supports the identification of critical gaps and guides differentiated interventions that strengthen the resilience of the production system. In line with the IPCC framework, our empirical indices are therefore constructed so that higher Sensitivity scores indicate conditions that increase climate vulnerability, whereas higher Adaptive Capacity scores capture conditions that reduce vulnerability.
1.3. Organised Producers: Cooperatives and Associations
In agricultural systems such as coffee, producer associations and cooperatives play a central role in reducing market and coordination failures, facilitating access to technical and climate information, inputs, financing and infrastructure, and linking small producers to differentiated markets. From the value chain approach, these institutional arrangements make it possible to mobilise human, social, physical, financial and natural capital, all of which have been identified by the IPCC as essential components of adaptive capacity [5,8,26]. In contexts characterised by high transaction costs and exposure to climate and price risks, organised collective action increases the options for incremental and, when necessary, transformative adaptation by fostering learning, innovation and access to resources.
Empirical evidence shows that cooperative membership is associated with higher probabilities of accessing formal markets, obtaining better prices and stabilising incomes, which facilitates investment in resilient practices [3,27]. In Latin America, cooperatives have played a key role in accessing certifications, technical assistance, and quality premiums, although the benefits vary according to productivity, compliance costs, and the quality of internal governance [12,13,14]. In the Peruvian case, producer organisations mediate access to essential services for adaptation, and their performance is directly associated with sensitivity and adaptive capacity along the coffee value chain [2,28].
In the Peruvian regulatory framework, associations are non-profit Organisations whose purpose is to promote a common non-profit objective, reinvesting their surpluses in their activities and limiting their commercial actions to those that are incidental to their corporate purpose. Cooperatives, on the other hand, are collectively owned and democratically managed enterprises that provide services to their members for economic and productive purposes. They can operate entirely in the market, distribute surpluses based on the use of services, and have access to instruments such as credit, exports, and collective certifications. In what follows, we use the generic term organised producers to refer to farmers who are members of any producer organisation (associations or cooperatives). However, all descriptive and econometric analyses explicitly differentiate between associations and cooperatives [29].
The intensification of climate change and increased inter-annual variability pose a significant challenge for small-scale agriculture, particularly in high-value perennial crops such as Arabica coffee, whose productivity and quality depend on narrow temperature and precipitation ranges. The IPCC [30] projects suggest that a 1.5–2 °C increase in global average temperature could reduce the suitability of land currently cultivated with arabica by more than 50% by mid-century, due to altitudinal shifts and changes in agroecological conditions. Vulnerability—interaction of exposure, sensitivity and adaptive capacity [7,8] —is aggravated in systems with high dependence on natural capital, low diversification and limited access to climate information or financing. In this context, adaptive capacity is key to resilience, as it enables incremental (management adjustments) and transformative (structural changes in the production model) responses.
In Latin America, the impacts of climate change on coffee growing are well documented: a reduction in optimal areas in Andean and Central American countries is projected, along with a higher incidence and severity of coffee rust (Hemileia vastatrix) and coffee berry borer (Hypothenemus hampei) [4,6]. In addition to biophysical conditions, socioeconomic factors such as farm size, income diversification, and organisational participation influence sensitivity and adaptation options [11]. Agroforestry systems stand out for reducing exposure and sensitivity, offering shade, thermal regulation, water retention, and biodiversity conservation, which provide adaptation and mitigation. However, their adoption faces technical and financial barriers and requires specialised technical assistance for adequate management and integration with coffee of differentiated quality.
In Peru, the coffee value chain is the socioeconomic axis in regions such as the Amazon, where the crop is predominantly grown on hillsides under microclimates that make it especially vulnerable to variations in rainfall and temperature [2]. Lack of timely climate information, adequate financial services and efficient marketing networks limit producer response [17]. The adoption of measures such as varietal diversification, renovation of coffee plantations, integrated pest control and agroforestry systems is documented, with marked heterogeneity according to resources, management and organisational articulation [16,18]. In this scenario, associations and cooperatives mediate access to technical assistance, certifications and specialised markets, conditioning adaptive capacity in the face of climate and market risks. The future of Amazonian coffee growing will depend on combining incremental adaptation and profound transformations to maintain competitiveness and resilience in the face of increasingly adverse scenarios [5,8,28].
Regarding sensitivity and adaptive capacity, several studies show differentiated responses across coffee-growing territories in northern Peru. In the Amazonas Region, recent analyses integrating geographic information systems (GIS) and multi-criteria evaluation have identified altitude, slope, and rainfall as the main determinants of land suitability for Coffea arabica [17]. These findings confirm that the productive potential of coffee is highly sensitive to topographic and climatic gradients, particularly in provinces such as Rodríguez de Mendoza and Luya. Complementary evidence from national-scale assessments also indicates that the sustainability and resilience of coffee systems depend on territorial governance and diversification processes that mitigate climate and market risks [31]. Together, these studies highlight that adaptive capacity in Amazonas is shaped by institutional coordination, access to climate information, and the introduction of agroecological practices suitable for local biophysical conditions.
At the national level, projections indicate that the potential surface area for coffee production will decrease by 2050 due to climate change, highlighting high territorial sensitivity and risks in terms of quantity and quality, especially in low- and medium-elevation zones [32]. Along the same lines, the World Agroforestry Centre indicates that the sensitivity of producers is closely linked to climate variability that affects volumes and quality, while adaptive capacity is closely linked to access to inputs, agroforestry technologies and climate information systems [2].
2. Materials and Methods
The study employed a quantitative, descriptive, and comparative approach, aiming to measure and analyse the level of sensitivity and adaptive capacity to climate change among organised coffee producers in the Amazonas region of Peru. The design also allowed comparisons to be made between subgroups defined by socioeconomic and productive characteristics, enabling the identification of differential patterns and factors associated with greater climate resilience.
2.1. Population, Inclusion and Exclusion Criteria, and Sampling Strategy
The target population consisted of coffee producers affiliated with associations or cooperatives with a presence in the Amazonas region. The inclusion criteria were: (i) provinces with significant coffee production and a few members greater than 100; (ii) associations and cooperatives with organic certification and export activity; (iii) legally constituted organisations with tax compliance before the National Superintendence of Tax Administration (SUNAT); and (iv) cooperatives with a defined and hierarchical organisational structure. Exclusion criteria included: (i) provinces with low representation in coffee production (≤100 members); (ii) organisations without organic certification or without a defined organisational structure; and (iii) associations and cooperatives without tax compliance.
The sampling strategy was based on a stratified design by province and type of organisation, based on the list of members provided by the participating organisations. Within each stratum, producers were selected randomly, ensuring proportionality with respect to the size of the stratum in the total population. The final sample consisted of 360 producers (n), distributed as follows: Rodríguez de Mendoza (137 producers, 38.1%), Utcubamba (106 producers, 29.4%), Luya (87 producers, 24.2%), and Bagua (30 producers, 8.3%). This sample was projected in the results using probabilistic sampling weights to a total of 5473 producers (N).
Comparisons between cooperatives (88.6%) and associations (11.4%) rely on large absolute Ns but imbalanced group shares. We therefore report effect sizes and robust p-values and interpret subgroup differences with caution.
Sampling weights were defined as province-level expansion factors equal to the ratio between the total number of cooperative associates and the realised sample size in each province.
2.2. Sources of Information and Variables of Analysis
The information used was obtained from structured surveys administered in person, complemented by administrative records provided by the producer organisations. The variables selected for the analysis were grouped into two dimensions: (i) sensitivity, which included the producer’s natural, human, physical and financial resources, and (ii) adaptive capacity, which integrated the dimensions: producer, organisation and socio-productive networks.
2.3. Construction of Sensitivity and Adaptive Capacity Indices
First, all survey items used to construct the indices were coded or recoded on ordered four-point scales. For the Sensitivity index, response categories were aligned so that higher values always correspond to more adverse or constrained conditions, that is, greater Sensitivity. Positively phrased items (for example, those reflecting better access to resources or services) were reverse coded so that 1 represents the least constrained situation and 4 the most constrained one. For the Adaptive Capacity index, in contrast, response categories were aligned so that higher values represent greater Adaptive Capacity—larger endowments of assets, more intensive organisational support, or denser socio-productive networks. Here, negatively worded items that captured constraints were reverse coded so that 1 denotes very low and 4 very high capacity. Non-substantive answers (e.g., “don’t know”) were treated as missing and excluded from the index calculations. A complete item-by-item list, including wording, response categories and harmonised coding rules for both indices, is provided in Supplementary Tables S1 and S2.
Within each conceptual dimension—natural, human, physical and financial resources for Sensitivity, and producer, organisation and socio-productive networks for Adaptive Capacity—we then standardised each ordinal item using a z-score transformation (mean 0, standard deviation 1) to homogenise scales. For every dimension, we estimated a polychoric correlation matrix and ran a weighted polychoric principal components analysis, retaining the first component as the composite score for that dimension. The resulting factor scores were linearly rescaled to the 0–1 range using min–max normalisation based on the observed minimum and maximum values in the sample, yielding dimension-level indices in which 0 represents the lowest and 1 the highest observed Sensitivity (for Sensitivity dimensions) or Adaptive Capacity (for Adaptive Capacity dimensions) in the sample.
Internal consistency within each dimension was assessed using Cronbach’s alpha. Finally, the overall Sensitivity and Adaptive Capacity indices were computed as the arithmetic mean of their respective normalised dimension scores, also ranging from 0 to 1. All computations utilised probability weights and were implemented in Stata 15.0 (StataCorp, College Station, TX, USA).
2.4. Comparative Statistical Analysis
Once the indices were constructed, a comparative analysis was conducted to identify significant differences between subgroups of producers defined by geographic location, years of coffee farming experience, educational level, and gender. The study utilised statistical weights (probability weights) to ensure that the estimates accurately reflected the structure of the target population proportionally. For the comparison of means, a one-factor analysis of variance (ANOVA) was used, a technique that allows us to contrast the mean values of the indices between more than two groups and to evaluate the statistical significance of the differences observed. The ANOVA was complemented with a descriptive analysis, which allowed us to contextualise the results and explore general trends in the distribution of the indices.
In addition to reporting weighted means, standard errors and test statistics, we compute a standardised effect-size measure for all group comparisons. For each one-way ANOVA model (gender, age group, experience, province and type of organisation), we report η2, defined as the proportion of total variance in the index explained by group membership. To avoid overloading the main-text tables, these effect-size estimates are presented in the Supplementary Materials (Supplementary Table S3).
This is an observational, cross-sectional study. All models are descriptive and estimate associations rather than causal effects. Results should not be interpreted as evidence that the observed organisational or territorial characteristics cause changes in Sensitivity or Adaptive Capacity.
2.5. Ethical Considerations
The study is based on a structured survey of organised coffee producers in the Amazonas region of Peru. All procedures complied with standard ethical guidelines for survey research in human populations and with the institutional protocols of the implementing organisation. Prior to each interview, enumerators provided a brief explanation of the objectives of the study, the topics to be covered and the intended use of the information, emphasising that participation was voluntary, that respondents could skip any question or stop the interview at any time, and that their decision would not affect their relationship with any organisation providing services in the area. Informed consent was obtained from all participants prior to commencing the questionnaire.
No names, addresses or other direct personal identifiers were retained in the analytical dataset. Respondents and organisations were identified only through numeric codes, and any potentially identifying information was removed during data cleaning. The final dataset used for this analysis is fully anonymised and stored in password-protected files with access restricted to the research team.
3. Results
3.1. Sociodemographic and Productive Characteristics of the Sample
In terms of sociodemographic characteristics, it was observed that most producers are between 36 and 55 years of age, which reflects a predominantly adult population in an economically active stage. Female participation was limited, below 30%, in line with national trends that show a lower presence of women in coffee farming [1]. In terms of education, a high percentage of respondents reported having completed secondary education, while the proportion with technical or university studies was low (Table 1).

Table 1.
Distribution of the sample by province and main sociodemographic and productive characteristics.
Next, the results of the indices of sensitivity and adaptive capacity to climate change are presented, with a comparative analysis between different sub-groups of producers and including an analysis at the level of their dimensions. Finally, the critical factors of their statistical variability are examined.
3.2. Sensitivity to Climate Change
The comparative analysis of the sensitivity index reveals differences among the evaluated subgroups. Overall, the index shows an average value of 0.49, indicating a medium level of sensitivity to the effects of climate change (Table 2).
Table 2.
Sensitivity Index between studied groups.
When disaggregated by age group, the highest score corresponds to producers between 22 and 39 years of age (0.50), while the lowest score is recorded for those aged 59 years or older (0.48).
In terms of productive experience, the highest value is found in those with less than 5 years of experience (0.50), in contrast to the lowest scores recorded in both the group with between 5 and 10 years of experience (0.48) and the group with more than 10 years of experience (0.48). In the comparison by gender, significant differences were found, although the index was close (0.50-man vs. 0.49-woman). At the provincial level, Luya has the highest value (0.52), while Bagua has the lowest (0.41). Finally, according to the type of organisation, the highest score is observed in cooperatives (0.50), while the lowest corresponds to associations (0.43).
3.3. Differences by Age Group
The results show that sensitivity varies significantly among age groups in almost all dimensions, except in human resources, where the differences were not statistically significant. In the natural resources sector, the highest sensitivity was observed in the 40–59 age group. In contrast, sensitivity to physical and financial resources was higher in young producers (22 to 39 years old), suggesting greater exposure to structural and economic constraints in the early stages of production (Table 3).
Table 3.
Differences by age group on dimensions of sensitivity.
3.4. Differences by Coffee Growing Experience
Producers with less than five years in the sector showed higher levels of sensitivity in natural and physical resources, indicating possible deficiencies in infrastructure and access to basic assets. In contrast, sensitivity to human resources increased with years of experience. Financial sensitivity presented a less clear pattern, with a slight peak in the intermediate group (5 to 10 years). The p-values (<0.001) in all cases except for human resources in Table 3 indicate that the differences in sensitivity levels between the coffee experience groups are statistically significant, which indicates that sensitivity to climate change is systematically associated with experience in the crop (Table 4).
Table 4.
Differences by groups of coffee experience on sensitivity dimensions.
3.5. Gender Differences
The analysis by gender reveals that women exhibit greater sensitivity to natural and human resources than men (p-value < 0.001). In terms of physical resources, there is no statistically significant difference between men and women in this aspect (p = 0.23). In contrast, financial sensitivity was slightly higher in men, while in physical resources, there were no relevant differences (Table 5). This confirms a greater sensitivity of women in certain key components of climate change sensitivity. With respect to the total sensitivity index (p < 0.001), the overall difference between genders is statistically significant, although of small magnitude (0.50 in women vs. 0.49 in men)
Table 5.
Differences by gender on dimensions of sensitivity.
3.6. Differences Between Provinces
The differences by province are marked and all are statistically significant in all dimensions (p < 0.001). Luya is characterised by a high sensitivity to natural and physical resources, while Utcubamba shows the highest level of financial sensitivity. Bagua has the lowest values for human and natural resources, and Rodríguez de Mendoza has high sensitivity to physical resources (Table 6). These differences are consistent with territorial location being an important correlate of producers’ sensitivity in the Amazonas region of Peru.
Table 6.
Differences by provinces on dimensions of sensitivity.
3.7. Differences Between Types of Organisations
Table 7 shows that membership in cooperatives is associated with higher levels of sensitivity to natural, human, and physical resources than membership in associations. No differences were observed in financial resource sensitivity. This suggests that the form of Organisation is associated with differences in the sensitivity of producers, with greater sensitivity among those who belong to cooperatives.
Table 7.
Differences by type of Organisation on dimensions of sensitivity.
Consistent with these patterns, η2 values indicate that most subgroup differences in Sensitivity are small in magnitude (η2 < 0.03), with medium-sized effects concentrated in provincial differences and in type of organisation for the human-resources dimension and the overall Sensitivity index (Supplementary Table S3).
Overall, the results reveal that the sensitivity of coffee producers to climate change is not homogeneous and is associated with individual, territorial and organisational characteristics. Coffee-growing experience is associated with marked differences: producers with less than five years of experience show greater sensitivity, especially in terms of natural and physical resources, whereas producers with a longer history in coffee tend to present lower sensitivity levels. In terms of gender, women show higher levels of sensitivity in natural and human resources, which is consistent with persistent structural gaps that may limit their response capacity. Territorially, Luya concentrates the highest levels of overall sensitivity, in contrast to Bagua, which has the lowest values. Rodríguez de Mendoza and Utcubamba stand out for their specific sensitivity in physical and financial resources, respectively. Finally, organisational type is associated with differences in sensitivity: cooperative members show greater sensitivity in human and physical resources compared to association members, suggesting that, although organisation is linked to higher adaptive capacity, it may also entail greater internal management demands.
3.8. Adaptive Capacity
The comparative analysis of the adaptive capacity index reveals variations among the evaluated groups. At the general level, the index presents an average value of 0.47.
In the age group, the highest value corresponds to producers between 22 and 39 years old (0.48) and the lowest value to the subgroup of producers older than 59 years old (0.46).
In terms of experience in the sector, producers with more than 10 years of experience and those with between 5 and 10 years obtained the highest value (0.48 in both cases), while the lowest value was obtained by those with less than 5 years of experience (0.46).
In the comparison by gender, no differences are observed, with a value of 0.47 for both men and women. By province, Rodríguez de Mendoza has the highest score (0.52), while Bagua has the lowest (0.43). Finally, according to the type of organisation, the highest value is found in cooperatives (0.48), while the lowest corresponds to associations (0.43) (Table 8).
Table 8.
Adaptive Capacity Index between study groups.
3.8.1. Differences by Age Group
In the index of adaptive capacity of the producer, the group aged 40 to 59 years presented the highest value (0.51), surpassing the youngest (0.48) and those older than 59 (0.45). When analysing adaptive-organisational capacity, the extreme groups (22–39 and >59 years) showed higher capacity (0.50) than the intermediate group (0.47). In contrast, organisational capacity was higher in the 22–39 and >59 age groups, while network capacity showed smaller differences, with a slight advantage for the younger age group.
The total adaptive capacity index (p = 0.002) shows significant overall differences, with higher adaptive capacity in the younger group (0.48) and lower in those older than 59 years (0.46). Finally, producers aged 40 to 59 years show the highest individual adaptive capacity, while the youngest stand out in the organisational and network dimension, and those older than 59 years show the lowest capacities in general (Table 9).
Table 9.
Differences by age group on dimensions of adaptive capacity.
3.8.2. Differences in Coffee Growing Experience
Adaptive capacity tends to improve with experience, especially in the organisational component, where producers with more than ten years in the sector obtained the highest values. However, producers with 5 to 10 years of experience stood out in producer capacity, while those with less experience showed lags in this component, although they presented relatively high values in network capacity (Table 10).
Table 10.
Differences in coffee farming experience on dimensions of adaptive capacity.
3.8.3. Gender Differences
Significant differences are observed only in the dimension of organisation of adaptive capacity, where women have a higher index compared to men (Table 11).
Table 11.
Differences by gender on dimensions of adaptive capacity.
3.8.4. Differences Between Provinces
When we seek to differentiate the variables between provinces, the adaptive capacity between provinces is statistically significant. The territorial analysis shows that Rodríguez de Mendoza stands out for its high levels of organisational capacity and socio-productive networks, while Utcubamba has the highest producer capacity, but low levels of Organisation and networks (Table 12). Bagua and Luya exhibit the lowest levels of overall adaptive capacity, which shows marked territorial contrasts in resilience to climate change.
Table 12.
Differences among provinces in adaptive capacity dimension.
3.8.5. Differences Between Types of Organisations
Cooperatives show higher values than associations in all three components of adaptive capacity, with the widest gap in networks (Table 13). This pattern is consistent with the idea that cooperatives may play a key role in promoting climate resilience, for example, by facilitating access to markets, finance and extension services.
Table 13.
Differences by type of organisation on dimensions of adaptive capacity.
For Adaptive Capacity, η2 values likewise show that subgroup differences by gender, age group, experience and type of organisation are small (η2 < 0.03 in all cases), while medium-to-large effects are concentrated in provincial differences in the organisational-support, risk-sharing and overall Adaptive Capacity indices (Supplementary Table S3).
3.8.6. Critical Dimensions of Sensitivity and Adaptive Capacity Explaining the Indexes
The principal component analysis for the sensitivity index identified two axes that together explain 55.6% of the observed variability. The first component (29.1% of variance explained) reflects a gradient dominated by financial resources (high negative loading: −0.5993) and, in the opposite direction, physical resources (high positive loading: 0.5679), suggesting that limitations in infrastructure and physical equipment counterbalance the availability of financial capital. The second component (26.5% variance) is characterised by an inverse relationship between human resources (high positive loading: 0.6140) and natural resources (moderate negative loading: −0.5328), indicating that greater capabilities and human capital tend to be associated with contexts with less dependence or pressure on natural resources, and vice versa. The resulting biplot (Figure 5) shows that the vectors corresponding to financial and human resources are the farthest from the origin, indicating their greater discriminating power in defining sensitivity.
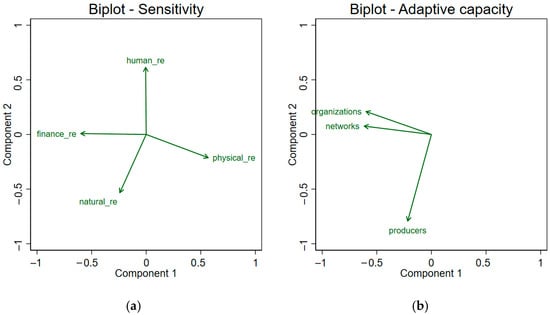
Figure 5.
Principal-component biplots of the dimension-level indices for the SYCACC Sensitivity (a) and Adaptive Capacity (b) indices.
The principal component analysis for adaptive capacity revealed that the first two components explain 76.7% of the total variance, with Component 1 having the greatest explanatory weight (43.9%). The biplot clearly separates the three dimensions evaluated: organisational capacity, socio-productive network capacity, and productive capacity. The network dimension presents the highest loading on Component 1 (−0.6154), followed by the organisational dimension with the second highest loading on Component 1 (−0.5987). In contrast, the productive dimension (−0.7926) is the only dimension in Component 2. This configuration suggests that, although productive capacity and socio-productive networks tend to reinforce each other, organisational strengthening operates as an independent axis that can enhance producers’ adaptive resilience.
4. Discussion
From a socio-ecological systems (SES) perspective, these patterns illustrate how biophysical conditions interact with human, financial and organisational assets to shape vulnerability among organised coffee producers. SES frameworks emphasise that adaptation options depend not only on exposure but also on the configuration of institutions, networks and governance across scales [33], which is consistent with the differentiated roles played by producer organisations and territorial context in our results [34]. Likewise, the intermediate Sensitivity and Adaptive Capacity scores we obtain are in line with assessments in the IPCC Sixth Assessment Report [30], which identifies smallholder agriculture in mountain regions of Latin America as a climate-vulnerability hotspot exposed to multiple interacting stressors, including changing rainfall patterns, disease outbreaks and market volatility [30].
The results obtained show that the average sensitivity (0.49) and adaptive capacity (0.47) of the organised coffee producers in Amazonas are located at intermediate levels, with significant variations between provinces, gender, productive experience and type of organisation. These differences are largely consistent with structural factors (infrastructure and physical resources) and organisational factors (institutional strength and socio-productive networks), a finding that coincides with [2], who point out that vulnerability in Andean-Amazonian coffee growing is configured at the intersection of biophysical and organisational conditions.
The high sensitivity in provinces such as Luya and Bagua, associated with limitations in natural and physical resources, corresponds to that documented by [35] in the upper basin of the Sisa River, where producers have had to move their coffee plantations to higher altitudes to reduce their exposure to thermal and rainfall variability. Similarly, ref. [32] projections anticipate reductions in the area suitable for coffee in low and medium altitudes, confirming that the Amazonian territory is highly sensitive to adverse climate scenarios. However, low levels of adaptive capacity are also observed in Bagua (0.43), which reinforces the condition of high sensitivity [36], in line with the findings of those who identify that most coffee plantations in San Martin have structural limitations that increase both sensitivity and vulnerability.
In contrast, Rodríguez de Mendoza stands out for its greater adaptive capacity (0.52), based on organisational strengthening and socio-productive networks. This territorial difference is consistent with the hypothesis of [16] that adaptation opportunities depend on local factors such as organisational management capacity and access to climate information. Furthermore, our results show higher adaptive capacity among cooperative members than association members, aligning with prior findings [35,36], which indicates that technical training and the introduction of innovative technologies increased the resilience of coffee organisations in San Martín.
Regarding the characteristics of the producers, it is observed that women are more sensitive to natural and human resources, although their organisational capacity is higher than that of men. This finding aligns with evidence that gender gaps in access to physical and financial resources exacerbate vulnerability, as well as the notion that female participation in collective spaces can enhance organisational resilience [2,15]. Similarly, the greater sensitivity among young and less experienced producers coincides with [12,13], who argue that the accumulation of human and social capital throughout the productive trajectory gradually reduces exposure to climate risks.
Overall, the results and background information converge in indicating that the climate vulnerability of Amazonian coffee production is multidimensional and appears to be shaped by interactions between individual, social, and territorial conditions, suggesting the need for differentiated interventions. The comparison also reveals that, although there are successful adaptation experiences, significant gaps persist in specific provinces and among certain groups. Finally, the results can serve as a basis for formulating public policies, such as territorial mitigation and adaptation strategies.
These findings have several practical implications. At the territorial level, provinces such as Luya and Bagua, which combine higher Sensitivity with lower Adaptive Capacity, should be prioritised for investments in climate-resilient infrastructure (e.g., coffee processing facilities, access roads) and for the development of tailored financial instruments such as credit and risk-management tools for smallholders. At the organisational level, association members—who exhibit higher Sensitivity and lower Adaptive Capacity than cooperative members—would benefit from programmes that strengthen management skills, internal governance and access to differentiated markets. At the producer level, targeted training and extension in climate-risk management, basic farm finances and diversification strategies for women and young farmers, delivered through producer organisations and local technical services, could help close the gaps in knowledge, networks and assets highlighted by the SYCACC indices. These patterns resonate with evidence from other Andean coffee regions, where smallholders also face constraints in physical and financial assets and rely on producer organisations and social networks as key adaptation pathways. Studies from Colombia and Ecuador, for example, show that access to technical assistance, credit, agroforestry systems, and gender-sensitive programmes is central to building resilience among coffee growers [37,38,39].
The structural conditions documented for organised smallholders in Amazonas mirror those faced by coffee farmers in many other producing countries. Globally, smallholders supply around 60% of the world’s coffee, and roughly 95% of farms are smaller than 5 hectares, yet they produce about three-quarters of the global output [13,22]. More than 25 million farmers depend directly on coffee, and many smallholder households remain below the global poverty line, facing recurrent constraints in infrastructure, finance, and basic services, as well as exposure to climate and price shocks [21,40,41,42]. The pattern observed in Amazonas—small farm sizes, strong dependence on coffee income, limited physical and financial capital, and reliance on cooperatives and associations—thus reflects broader smallholder coffee systems, suggesting that the sensitivity and adaptive capacity indices developed here are methodologically transferable to other coffee regions facing similar structural and climate adaptation challenges.
Limitations and Future Directions
Several caveats apply. First, the cross-sectional design precludes causal inference; we report associations only. Second, self-selection is plausible—producers with stronger capabilities may be more likely to join cooperatives, introducing selection bias. Third, survivorship bias may inflate average capacities among longer-tenured members. Fourth, residual confounding is possible, as some contextual and organisational factors were not measured with high granularity and our analysis relies on weighted subgroup comparisons rather than multivariable adjustment. Fifth, measurement error in self-reported items may attenuate relationships (common-method bias). Finally, given the group size imbalance (cooperatives ≈ 88.6% vs. associations ≈ 11.4%), estimates for associations are less precise; external validity beyond Amazonas should therefore be considered with caution.
Taken together, these caveats highlight that the findings should be interpreted as a descriptive profile of Sensitivity and Adaptive Capacity among organised coffee producers in Amazonas, rather than as causal estimates or nationally representative benchmarks. The sample is restricted to members of cooperatives and associations in a single region, so the results cannot be directly generalised to non-organised producers, other Peruvian regions or other coffee-producing countries. Moreover, our empirical focus is on Sensitivity and Adaptive Capacity. However, the indices incorporate perceived exposure to climate-related events; we do not combine them with independent hazard or climate-exposure metrics, consequently, we do not estimate a full vulnerability index in the IPCC sense, but rather two of its core components.
These limitations open clear avenues for future research. A first step would be to replicate and adapt the index-based methodology in other coffee regions—explicitly including non-organised producers—to compare sensitivity profiles across territories and organisational settings. A second step would be to combine similar producer-level surveys with georeferenced climate and hazard data, and, where possible, panel or repeated cross-sectional designs, to analyse how Sensitivity, Adaptive Capacity, and exposure co-evolve over time. Finally, the patterns we document—particularly the higher Sensitivity and higher Adaptive Capacity among cooperative members, and the disadvantages faced by women and less-experienced producers—can inform policy by helping governments, NGOs, and producer organisations prioritise investments in physical and financial capital, strengthen organisational and network capacities, and design gender- and youth-sensitive climate adaptation programmes in smallholder coffee systems.
From a broader perspective, these findings extend previous applications of vulnerability frameworks in agricultural systems by explicitly incorporating organisational and network dimensions into the measurement of Adaptive Capacity and by applying this approach to organised coffee producers in a frontier region such as the Peruvian Amazon. The combination of multi-dimensional indices and PCA-based profiling helps translate the abstract concepts of Sensitivity and Adaptive Capacity into concrete levers for action, which can inform climate-resilience strategies for coffee value chains in other tropical contexts.
5. Conclusions
This study aimed to measure the levels of Sensitivity and Adaptive Capacity to climate change among organised coffee producers in Amazonas. The overall results show an average Sensitivity of 0.49 and an Adaptive Capacity of 0.47 on a 0–1 scale. These intermediate values suggest that organised producers face non-trivial conditions of climate-related vulnerability—neither extreme nor negligible—and that their ability to respond is closely linked to both individual assets and to the strength of their organisations and socio-productive networks.
Comparisons across producer subgroups reveal marked differences. Young and less experienced farmers exhibit higher Sensitivity, especially in physical and financial resources, reflecting more limited access to infrastructure and capital in the early stages of their coffee trajectory. Producers with more than ten years of experience in coffee, by contrast, display higher Adaptive Capacity, which is consistent with the accumulation of technical knowledge, productive diversification, and expertise in managing climate risks. Gender differences also emerge. Women are more sensitive in natural and human resource dimensions, reflecting persistent gaps in access to productive assets and a differentiated burden of household work. Yet, they tend to show stronger organisational engagement, which may partly compensate for some individual constraints.
Territorial and organisational patterns underline that vulnerability is not homogeneous. Luya and Bagua combine higher Sensitivity with lower Adaptive Capacity, placing them in a comparatively more vulnerable position. In contrast, Rodríguez de Mendoza stands out with higher Adaptive Capacity (0.52), in a context of stronger organisations and socio-productive networks. Utcubamba occupies an intermediate position, with relative strengths at the producer level but weaker organisational and network dimensions. Organisational form also matters; cooperative members consistently score higher than association members across the three Adaptive Capacity components (producer, organisation and networks), with an overall index of 0.48 compared with 0.43 in associations. At the same time, cooperative members exhibit higher Sensitivity, suggesting that more formal, market-integrated organisations are associated with both greater vulnerability and greater response capacity. Taking together, territorial and organisational differences suggest that climate vulnerability is highest where producers simultaneously exhibit high Sensitivity scores and low Adaptive Capacity scores.
An intersectional analysis reveals that climate vulnerability is greatest among subgroups that combine relatively high Sensitivity with low Adaptive Capacity, reflecting the joint association of multiple disadvantages. Young women with less than five years of experience in coffee, who cultivate small plots in Luya and belong to associations rather than cooperatives, are characterised by high Sensitivity scores and comparatively low Adaptive Capacity, placing them in the most vulnerable position in our typology. In contrast, men with more than ten years of experience, located in Rodríguez de Mendoza and organised in cooperatives, combine comparatively low Sensitivity with high Adaptive Capacity, supported by accumulated capital, stronger organisations and denser external networks.
Overall, Sensitivity is higher where constraints in physical and financial resources are more pronounced, while Adaptive Capacity is stronger where organisational factors are more robust. The principal component analysis clarifies these patterns: for Sensitivity, the main contrast lies in financial and physical resources, signalling that deficits in productive infrastructure and finance are strongly associated with higher exposure. For Adaptive Capacity, the organisational dimension emerges as the most salient correlate, followed by socio-productive networks and producer-level capabilities, reinforcing the central role of institutional strengthening and collective action in enhancing resilience in Amazonian coffee systems.
Beyond this specific case, the SYCACC Sensitivity and Adaptive Capacity indices offer a transferable framework for diagnosing climate-related Sensitivity and Adaptive Capacity in other contexts. The same index-construction strategy—based on standard survey data, polychoric PCA and dimension-level indices—can be adapted to other agricultural value chains (such as cacao or other perennial crops) and to different regions, provided that comparable information on natural, human, physical, financial, organisational and network dimensions is available. In this way, SYCACC can support comparative analyses and inform the design of targeted adaptation strategies across diverse smallholder systems.
Supplementary Materials
The following supporting information can be downloaded at: https://www.mdpi.com/article/10.3390/su172310666/s1, Table S1: Sensitivity operational table; Table S2: Adaptative capacity operational table; Table S3: Standardised effect sizes (η2) for group comparisons of Sensitivity and Adaptive Capacity indices.
Author Contributions
Conceptualization, J.A.C.T. and P.R.; Data curation, C.A. and M.d.P.B.C.; Formal analysis, P.R. and C.A.; Funding acquisition, J.A.C.T. and P.R.; Investigation, P.R., C.A., M.d.P.B.C. and L.G.; Methodology, P.R. and L.G.; Project administration, P.R.; Resources, J.A.C.T. and L.G.; Supervision, J.A.C.T. and R.R.-S.; Validation, J.A.C.T., P.R. and R.R.-S.; Visualisation, C.A. and L.G.; Writing—original draft, P.R. and M.d.P.B.C.; Writing—review and editing, J.A.C.T., P.R. and R.R.-S. All authors have read and agreed to the published version of the manuscript.
Funding
This work was funded by the Consejo Nacional de Ciencia, Tecnología e Innovación Tecnológica (CONCYTEC) and the Programa Nacional de Investigación Científica y Estudios Avanzados (PROCIENCIA) under the competition “E041-2024-04 Proyectos de Investigación en Ciencias Sociales”, contract number PE501088206-2024.
Institutional Review Board Statement
This research was conducted within the approved institutional project framework (PROCIENCIA–CONCYTEC Contract N° PE501088206-2024): The study protocol was reviewed and approved by the Institutional Research Ethics Committee (CIEI) of Universidad Nacional Toribio Rodríguez de Mendoza de Amazonas (UNTRM), Approval Code: CIEI N° 00159, Approval Date: 27 March 2025.
Informed Consent Statement
Informed consent was obtained from all participants involved in the study. All data were anonymised and collected in accordance with the principles of the Declaration of Helsinki (1975, revised 2013).
Data Availability Statement
The data presented in this study are available on request from the corresponding author. Data is contained within the article and Supplementary Materials.
Acknowledgments
We gratefully acknowledge the support of the Vice Rectorate for Research of the Universidad Nacional Toribio Rodríguez de Mendoza de Amazonas, as well as the cooperative and association leaders, enumerators, and coffee producers who participated in the fieldwork.
Conflicts of Interest
The authors declare no conflicts of interest.
References
- MIDAGRI. Boletín Café 2025 Agromercado [Internet]. Lima. 2025. Available online: https://www.gob.pe/institucion/agromercado/informes-publicaciones/1705406-boletin-de-cafe (accessed on 15 October 2025).
- Robiglio, V.; Baca, M.G.; Donovan, J.; Bunn, C.; Reyes, M.; Gonzáles, D.; Sánchez, D. Impacto del Cambio Climático Sobre la Cadena de Valor del Café en el Perú; CGIAR Research Program on Climate Change, Agriculture and Food Security: Lima, Peru, 2017. [Google Scholar]
- Abate, G.T.; Francesconi, G.N.; Getnet, K. Impact of agricultural cooperatives on smallholders’ technical efficiency: Empirical evidence from Ethiopia. Ann. Public Coop. Econ. 2014, 85, 257–286. [Google Scholar] [CrossRef]
- Avelino, J.; Cristancho, M.; Georgiou, S.; Imbach, P.; Aguilar, L.; Bornemann, G.; Läderach, P.; Anzueto, F.; Hruska, A.J.; Morales, C. The coffee rust crises in Colombia and Central America (2008–2013): Impacts, plausible causes and proposed solutions. Food Secur. 2015, 7, 303–321. [Google Scholar] [CrossRef]
- Calvin, K.; Dasgupta, D.; Krinner, G.; Mukherji, A.; Thorne, P.W.; Trisos, C.; Romero, J.; Aldunce, P.; Barret, K.; Blanco, G.; et al. IPCC, 2023: Summary for Policymakers. In Climate Change 2023: Synthesis Report. Contribution of Working Groups I, II and III to the Sixth Assessment Report of the Intergovernmental Panel on Climate Change; Core Writing Team, Lee, H., Romero, J., Eds.; IPCC: Geneva, Switzerland, 2023; Available online: https://www.ipcc.ch/report/ar6/syr/ (accessed on 15 October 2025).
- Ovalle-Rivera, O.; Läderach, P.; Bunn, C.; Obersteiner, M.; Schroth, G. Projected shifts in Coffea arabica suitability among major global producing regions due to climate change. PLoS ONE 2015, 10, e0124155. [Google Scholar] [CrossRef] [PubMed]
- Turner, B.L.; Kasperson, R.E.; Matson, P.A.; McCarthy, J.J.; Corell, R.W.; Christensen, L.; Eckley, N.; Kasperson, J.X.; Luers, A.; Martello, M.L.; et al. A framework for vulnerability analysis in sustainability science. Proc. Natl. Acad. Sci. USA 2003, 100, 8074–8079. [Google Scholar] [CrossRef]
- Vermeulen, S.J.; Challinor, A.J.; Thornton, P.K.; Campbell, B.M.; Eriyagama, N.; Vervoort, J.M.; Kinyangi, J.; Jarvis, A.; Läderach, P.; Ramirez-Villegas, J.; et al. Addressing uncertainty in adaptation planning for agriculture. Proc. Natl. Acad. Sci. USA 2013, 110, 8357–8362. [Google Scholar] [CrossRef]
- Della Peruta, R.; Mereu, V.; Spano, D.; Marras, S.; Vezy, R.; Trabucco, A. Projecting trends of arabica coffee yield under climate change: A process-based modelling study at continental scale. Agric. Syst. 2025, 227, 104353. [Google Scholar] [CrossRef]
- Bracken, P.; Burgess, P.J.; Girkin, N.T. Opportunities for enhancing the climate resilience of coffee production through improved crop, soil and water management. Agroecol. Sustain. Food Syst. 2023, 47, 1125–1157. [Google Scholar] [CrossRef]
- Bouroncle, C.; Imbach, P.; Rodríguez-Sánchez, B.; Medellín, C.; Martinez-Valle, A.; Läderach, P. Mapping climate change adaptive capacity and vulnerability of smallholder agricultural livelihoods in Central America: Ranking and descriptive approaches to support adaptation strategies. Clim. Change 2017, 141, 123–137. [Google Scholar] [CrossRef]
- Valkila, J. Fair Trade organic coffee production in Nicaragua—Sustainable development or a poverty trap? Ecol. Econ. 2009, 68, 3018–3025. [Google Scholar] [CrossRef]
- Beuchelt, T.D.; Zeller, M. Profits and poverty: Certification’s troubled link for Nicaragua’s organic and fairtrade coffee producers. Ecol. Econ. 2011, 70, 1316–1324. [Google Scholar] [CrossRef]
- Ruben, R.; Zuniga, G. How standards compete: Comparative impact of coffee certification schemes in Northern Nicaragua. Supply Chain. Manag. 2011, 16, 98–109. [Google Scholar] [CrossRef]
- González-Orozco, C.E.; Porcel, M.; Byrareddy, V.M.; Rahn, E.; Cardona, W.A.; Velandia, D.A.S.; Araujo-Carrillo, G.A.; Kath, J. Preparing Colombian coffee production for climate change: Integrated spatial modelling to identify potential robusta coffee (Coffea canephora P.) growing areas. Clim. Change 2024, 177, 67. [Google Scholar] [CrossRef]
- Fort Meyer, R.; Varese Zimic, M.; de los Ríos Farfán, C. PERÚ: EL PROBLEMA AGRARIO EN DEBATE/SEPIA XVII. 2018. Available online: https://sepia.org.pe/publicaciones/peru-el-problema-agrario-en-debate-sepia-xvii-cajamarca-2017/ (accessed on 15 October 2025).
- López, R.S.; Fernández, D.G.; Silva López, J.O.; Rojas Briceño, N.B.; Oliva, M.; Terrones Murga, R.E.; Trigoso, D.I.; Castillo, E.B.; Gurbillón, M.Á.B. Land suitability for coffee (Coffea arabica) growing in Amazonas, Peru: Integrated use of AHP, GIS and RS. ISPRS Int. J. Geoinf. 2020, 9, 673. [Google Scholar] [CrossRef]
- Grandez-Alberca, M.A.; Cotrina-Sanchez, A.; Haro, N.; Zabaleta-Santisteban, J.A.; Silva-Melendez, T.B.; Sanchez-Vega, J.A.; Medina-Medina, A.J.; Tuesta-Trauco, K.M.; Rivera-Fernandez, A.S.; Granda-Santos, M.; et al. Agronomic and economic sustainability perspectives in coffee-based agroforestry system (Coffea arabica L.) in Rodríguez de Mendoza, Amazonas, Peru. Trees For. People 2025, 21, 100924. [Google Scholar] [CrossRef]
- Hernández, A.; Gutierrez-Soto, B.J.; Barrios, A.; Navarro Roque, E.S. Hacia una agroindustria alimentaria que nutra y contribuya a la sostenibilidad. Ceiba 2023, 56, 121–132. [Google Scholar] [CrossRef]
- INEI. Productores Agropecuarios—Principales Resultados de la Encuesta Nacional Agropecuaria (ENA), 2018–2019 y 2022–2024; INEI: Lima, Peru, 2025.
- Landaverde, R.; Rodríguez, M.T.; Niewoehner-Green, J.; Kitchel, T.; Chuquillanqui, J. Climate Change Perceptions and Adaptation Strategies: A Mixed Methods Study with Subsistence Farmers in Rural Peru. Sustainability 2022, 14, 16015. [Google Scholar] [CrossRef]
- Läderach, P.; Ramirez–Villegas, J.; Navarro-Racines, C.; Zelaya, C.; Martinez–Valle, A.; Jarvis, A. Climate change adaptation of coffee production in space and time. Clim. Change 2017, 141, 47–62. [Google Scholar] [CrossRef]
- Stoian, D.; Donovan, J.; Fisk, J.; Muldoon, M.F. Value chain development for rural poverty reduction: A reality check and a warning. Enterp. Dev. Microfinanc. 2012, 23, 54–69. [Google Scholar] [CrossRef]
- Fischer, E.; Qaim, M. Linking Smallholders to Markets: Determinants and Impacts of Farmer Collective Action in Kenya. World Dev. 2012, 40, 1255–1268. [Google Scholar] [CrossRef]
- Shapiro-Garza, E.; King, D.; Rivera-Aguirre, A.; Wang, S.; Finley-Lezcano, J. A participatory framework for feasibility assessments of climate change resilience strategies for smallholders: Lessons from coffee cooperatives in Latin America. Int. J. Agric. Sustain. 2020, 18, 21–34. [Google Scholar] [CrossRef]
- PRODUCE. Manual para la Gestión Empresarial de las Cooperativas de Servicios; PRODUCE: Lima, Peru, 2013. [Google Scholar]
- Chavez, S.G.; Arellanos, E.; Veneros, J.; Rojas-Briceño, N.B.; Oliva-Cruz, M.; Bolaños-Carriel, C.; García, L. Unveiling Peru’s Agricultural Diversity: Navigating Historical and Future Trends in a Post-COVID-19 Context. Sustainability 2024, 16, 4191. [Google Scholar] [CrossRef]
- UNDP. Peru: Sustainable Coffee in Detail. 2021. Available online: https://www.undp.org/foodsystems/peru-sustainable-coffee (accessed on 15 October 2025).
- Ostrom, E. A General Framework for Analyzing Sustainability of Social-Ecological Systems. Science 2009, 325, 419–422. [Google Scholar] [CrossRef]
- Harvey, C.A.; Pritts, A.A.; Zwetsloot, M.J.; Jansen, K.; Pulleman, M.M.; Armbrecht, I.; Avelino, J.; Barrera, J.F.; Bunn, C.; García, J.H.; et al. Transformation of coffee-growing landscapes across Latin America. A review. Agron. Sustain. Dev. 2021, 41, 62. [Google Scholar] [CrossRef]
- Intergovernmental Panel on Climate Change (IPCC). Climate Change 2022—Impacts, Adaptation and Vulnerability; Cambridge University Press: Cambridge, UK, 2023; Available online: https://www.cambridge.org/core/product/identifier/9781009325844/type/book (accessed on 15 October 2025).
- Guzman, F. Evaluación del impacto del cambio climático en el cultivo de café en la cuenca alta del río Sisa—Provincia de Lamas y El Dorado, región San Martín. Apunt. Investig. 2014, 2, 1–22. [Google Scholar]
- Davis, A.P.; Chadburn, H.; Moat, J.; O’Sullivan, R.; Hargreaves, S.; Nic Lughadha, E. High extinction risk for wild coffee species and implications for coffee sector sustainability. Sci. Adv. 2019, 5, eaav3473. [Google Scholar] [CrossRef]
- Guzmán Castillo, W.; Orihuela, C.E.; Vásquez Lavín, F.; Arévalo López, L.A. Evaluación del impacto en la productividad de cultivos de café y cacao con sistemas agroforestales en los departamentos de Amazonas y San Martín, Perú. Econ. Agrar. Recur. Nat. 2024, 24, 99–125. [Google Scholar] [CrossRef]
- Garavito-Calderon, N. Factores claves para la adaptación al cambio climático de los caficultores colombianos. Gestión Ambiente 2021, 24, 90509. [Google Scholar] [CrossRef]
- Canal Daza, D.S.; Andrade Castañeda, H.J. Sinergias mitigación—Adaptación al cambio climático en sistemas de producción de café (Coffea arabica), de Tolima, Colombia. Rev. Biol. Trop. 2019, 67, 36–46. [Google Scholar] [CrossRef]
- Iñiguez-Gallardo, V.; Jara-Ortíz, N.; Briceño-Salas, J. Género y adaptación climática: Estudio de familias caficultoras del cantón Olmedo, sur del Ecuador. Rev. Kawsaypacha Soc. Medio Ambiente 2025, 15, D-010. [Google Scholar] [CrossRef]
- WCR. Forging the Future of Coffee; WCR: Portland, OR, USA, 2023. [Google Scholar]
- Borrella, I.; Mataix, C.; Carrasco-Gallego, R. Smallholder Farmers in the Speciality Coffee Industry: Opportunities, Constraints and the Businesses that are Making it Possible. IDS Bull. 2015, 46, 29–44. [Google Scholar] [CrossRef]
- Siles, P.; Cerdán, C.R.; Staver, C. Smallholder Coffee in the Global Economy—A Framework to Explore Transformation Alternatives of Traditional Agroforestry for Greater Economic, Ecological, and Livelihood Viability. Front. Sustain. Food Syst. 2022, 6, 808207. [Google Scholar] [CrossRef]
- Foreign Agricultural Service. Coffee Annual; Foreign Agricultural Service: Washington, DC, USA, 2025.
- International Finance Corporation. Access to Finance for Smallholder Farmers. 2014. Available online: https://hdl.handle.net/10986/21679 (accessed on 15 October 2025).


Disclaimer/Publisher’s Note: The statements, opinions and data contained in all publications are solely those of the individual author(s) and contributor(s) and not of MDPI and/or the editor(s). MDPI and/or the editor(s) disclaim responsibility for any injury to people or property resulting from any ideas, methods, instructions or products referred to in the content. |
© 2025 by the authors. Licensee MDPI, Basel, Switzerland. This article is an open access article distributed under the terms and conditions of the Creative Commons Attribution (CC BY) license (https://creativecommons.org/licenses/by/4.0/).