Abstract
Cultural heritage plays a crucial role in maintaining cultural diversity and historical identity. However, preservation faces challenges from natural and human-induced factors, prompting increased adoption of digital technologies. Digital cultural heritage platforms provide innovative pathways for sustainable preservation, yet factors influencing user engagement remain underexplored. This study examines the WenZang Chinese Pattern Online Museum database using an integrated Technology Acceptance Model (TAM) and task–technology fit (TTF) framework, supplemented by Artificial Neural Networks (ANN), to explore relationships between key factors affecting designers’ satisfaction and engagement. A combined Structural Equation Modeling (SEM) and ANN approach was employed to survey 267 Chinese designers. Results indicate that design aesthetics (DA) and perceived ease of use (PEOU) enhance perceived convenience (PC); performance impacts (PIM) and information quality (IQ) influence perceived usefulness (PU); PC and PU drive attitude toward using (AU) and purchase intention (PI), jointly enhancing satisfaction with (SAT). Mission technology matching (MTM) positively influences SAT, perceived task–technology fit (PTTF), and technical task fitting (TTF). ANN analysis reveals that PI is the most significant determinant of SAT, followed by DA and PIM, demonstrating nonlinear relationships not captured by linear SEM alone. The introduction of ANN provides comprehensive understanding of user satisfaction, revealing indirect effects of key experience factors (such as DA and PIM) on SAT through PC and PU. This study emphasizes the need to comprehensively consider user experience, technological performance, and behavior transformation mechanisms when optimizing digital cultural heritage platforms to achieve sustained improvements in user satisfaction and engagement.
1. Introduction
Cultural heritage serves as the foundation of cultural diversity and historical identity, embodying the collective memory and wisdom of human civilizations []. However, this irreplaceable legacy faces unprecedented threats from multiple sources: armed conflicts destroy heritage sites, climate change accelerates artifact deterioration, globalization leads to cultural assimilation, and population displacement disrupts the transmission of intangible heritage []. In response to these challenges, UNESCO has established a comprehensive protection framework []. Yet traditional physical preservation approaches prove insufficient for long-term sustainability. Therefore, digital technologies, offering preservation through digitization, universal accessibility transcending geographical boundaries, and innovative pathways for cultural transmission [,,]. Since the 1990s, leading institutions, including the Louvre [], the British Museum [], and China’s Palace Museum [], have established digital archives, marking a paradigm shift from physical conservation to digital preservation and creative reactivation []. Within this context, the WenZang database https://www.wenzang.cn/) exemplifies this digital transformation approach, integrating digitization, digital preservation, and access, housing over 35,000 digitized Chinese traditional patterns, while enabling contemporary applications through brand collaborations (e.g., Meitu, IKEA), VR/AR experiences, and cultural derivative development [].
While digital cultural heritage platforms have achieved technological maturity, their sustainable impact depends on user engagement, particularly among professional designers. Unlike general visitors, designers actively transform digital resources into tangible cultural products, artworks, and commercial applications, thereby extending the lifespan and relevance of heritage []. This dual role makes designers both critical users and cultural transmitters: they require high-quality, accessible digital resources for creative inspiration and material sourcing, while contributing to the dissemination of heritage. However, designers’ unique needs distinguish them from general users. Specifically, they require task-specific features, workflow integration capabilities, and quality assurances. Despite this strategic importance, the existing research has predominantly focused on tourist experiences [], educational outcomes [], emergency preservation [], or general user satisfaction [], while studies specifically addressing designers’ acceptance behaviors, satisfaction determinants, and sustained engagement mechanisms remain scarce [,,].
To address this gap, our study examines designers’ acceptance of the WenZang database using a framework that combines the Technology Acceptance Model (TAM), the task–technology fit (TTF) model, and Artificial Neural Networks (ANN). This integration offers advantages over single-model approaches. TAM [] and TTF [] provide complementary frameworks: TAM explains adoption through perceived usefulness and ease of use, while TTF captures alignment between system capabilities and task requirements []. Traditional Structural Equation Modeling (SEM) assumes linear relationships, which may oversimplify complex decision-making. We employ ANN analysis to detect nonlinear patterns and rank predictor importance [,]. This combined SEM-ANN approach enables both hypothesis testing (via SEM) and pattern discovery (via ANN), providing complementary insights into designer behavior. We investigate three research questions:
- What factors influence designers’ satisfaction with the WenZang database?
- What are the structural relationships among these influencing factors?
- What platform optimization strategies can enhance designers’ user experience and sustained engagement?
This study offers three contributions. First, we extend technology acceptance research by demonstrating that TTF has a significant influence on designers’ acceptance beyond perceived usefulness and ease of use. ANN analysis reveals that purchase intention (PI) is the most critical determinant of satisfaction, while design aesthetics and system performance work indirectly through perceived convenience and usefulness. This demonstrates that for creative professionals, aesthetic quality and task-specific performance matter more than general usability. Second, we demonstrate how integrating SEM and ANN creates a replicable framework that balances explanation and prediction for digital heritage research. Third, we identify optimization priorities: enhancing design aesthetics and system performance, improving TTF through designer-centric features, and implementing conversion mechanisms. These strategies guide platforms serving creative professionals toward sustainable development.
2. Theoretical Background and Hypothesis Development
2.1. Theoretical Foundation
The TAM has been extensively validated for predicting digital technology acceptance [,] across cultural heritage contexts [,]. In this study, TAM serves as the primary explanatory backbone: perceived convenience (PC) and perceived usefulness (PU) influence satisfaction with (SAT) through attitude toward using (AU) and purchase intention (PI). Prior work confirms that external variables are context-dependent []; accordingly, we incorporate design aesthetics (DA), performance impacts (PIM), and information quality (IQ) as context-relevant antecedents [,,,,,], drawing on applications in AR-based heritage exhibitions, ICH-oriented digital education, VR experiences, digital museums, and cultural-tourism technologies [,,,,]. The research roadmap below for our WenZang study covers the survey constructs, questions, the integrated TAM+TTF model, and the empirical findings. It is divided into three parts: questions, models, and findings, to show how designer survey constructs inform an integrated TAM+TTF model specification and how the empirical results are obtained (Figure 1).
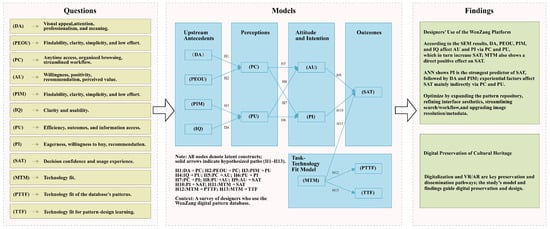
Figure 1.
Our research roadmap for WenZang study.
While the TTF model perspective posits that when technological features align closely with task requirements, both usage and performance improve [,], and this model has been validated in domains such as online education, digital-textbook services, and healthcare [,,,,]. In this study, the TTF model functions as a task-anchored driver that operates with TAM: mission technology matching (MTM) is modeled to directly enhance perceived task–technology fit (PTTF) and SAT; when the platform’s functionality aligns with designers’ creative tasks, satisfaction increases. Building on the integration of the TAM+TTF model proposed by Dishaw and Strong (1999) [] and subsequent empirical work [], an integrated framework is employed to provide a more comprehensive account of designers’ technology-adoption mechanisms.
In this study, TAM and TTF are not treated as parallel models but as complementary mechanisms explaining distinct dimensions of designers’ satisfaction. TAM primarily captures cognitive evaluations, how designers’ PU and PEOU influence their attitudes and intentions, while TTF accounts for the functional congruence between designers’ creative tasks and system capabilities. SAT thus emerges through two interacting channels: (1) a cognitive–affective route (DA, PEOU → PC/PU → AU/PI → SAT); and (2) a task-performance route (MTM → TTF/PTTF → SAT). This theoretical integration clarifies that while TAM explains why designers choose to engage with the system, TTF explains how effectively the system supports their professional design tasks, and both jointly determine overall satisfaction.
To verify the integrated model that prioritizes TAM while incorporating the TTF model, SEM is employed to evaluate both the measurement and structural components within a single framework and to compare the integrated specification with a TAM-only baseline in order to assess explanatory sufficiency and consistency []. The analytical procedure follows established practice for SEM: measurement quality and the statistical significance of key paths are first confirmed, after which a holdout-sample predictive assessment is conducted to evaluate performance on unseen data [,]. Theoretically, the SEM test is grounded in the integration of the TAM+TTF model proposed by Dishaw and Strong (1999) [], allowing both mechanisms to be examined within a unified model of their joint effects and relative contributions.
For the reason that traditional SEM primarily characterizes linear and additive relations, a two-stage SEM-ANN sequence is implemented after SEM to identify potential nonlinear effects and to obtain a stable ranking of predictor importance, thereby providing complementary evidence for model interpretation and platform optimization [,]. Operationally, validated latent-variable scores or composite indicators derived from SEM are first obtained and then used to train a multilayer perceptron (MLP) with cross-validation; in addition, variable importance and sensitivity results are reported following established procedures so that effects can be attributed to network weights in an interpretable manner []. Accordingly, SEM is used to establish the validity and robustness of the theorized relations, whereas ANN is employed to reveal nonlinear patterns and to rank the relative importance of predictors; together, the two methods provide convergent evidence that strengthens support for the integrated TAM+TTF model. Conceptually, this integration also implies that TTF acts as a boundary condition that strengthens or constrains the TAM pathway: when task–technology alignment is high, the effects of PU and convenience on satisfaction become more pronounced, because designers experience tangible workflow benefits from system functions. Conversely, when the fit is low, positive PU may not translate into satisfaction. Thus, the two models operate synergistically rather than independently.
2.2. Research Hypotheses
2.2.1. Design Aesthetics (DA)
According to Cyr et al. (2006), visual design is synonymous with design aesthetics, defined as the expression and communication of emotional appeal and pleasure through elements such as color, shape, typography, and animation []. Van der Heijden (2003) expanded this concept by introducing “Perceived Visual Attractiveness,” which measures how aesthetically pleasing users find information technology interfaces, such as websites []. Visual design influences users’ evaluations and intentions in multiple ways. The principle that “beauty is good” suggests that attractive visual design enhances user satisfaction []. Psychological studies have also shown that perceived attractiveness can shape impressions of other traits, particularly regarding personality, taste, and values that align with the evaluator’s preferences [,]. Tractinsky et al. (2000) further demonstrated that aesthetic appeal influences user perceptions by lowering perceived risks and eliciting positive emotions [], which creates favorable biases toward other product attributes and overall evaluations. Chang and Chen (2009) also confirmed that users’ enjoyment of a website’s visual aesthetics significantly impacts their loyalty and willingness to return to the site [].
H1.
The DA of WenZang database and digital patterns positively affect PC.
2.2.2. Perceived Ease of Use (PEOU)
PEOU refers to the extent to which individuals believe that new technology can be easily adopted without requiring a significant amount of time for learning []. Ease of use is closely related to three key aspects: intuitiveness, learning curve, and satisfaction. Intuitiveness means that users can understand how to use a product or service without additional guidance; the learning curve refers to the ability of users to master basic and advanced functions; and satisfaction pertains to the degree of contentment after use, including meeting needs and providing a pleasurable experience. Therefore, the WenZang database presents patterns and related content in an intuitive method, allowing users to learn how to use it quickly through introductory materials and ultimately achieve satisfying design outcomes.
H2.
The PEOU of the WenZang database and digital patterns significantly positively impacts PC.
2.2.3. Performance Impacts (PIM)
Perceived performance refers to an individual’s effectiveness in completing tasks. According to the (TCP) model [], the impact of task–technology fit (TTF) on individual performance extends beyond mere facilitation of use []. Individuals may not always choose the technology with the highest TTF. However, under the same frequency of use, technologies with higher TTF often enhance performance outcomes. Research has explored the alignment between virtual learning environments and both teachers and students []. These studies indicate that TTF and usage frequency positively influence perceived performance []. Perceived usefulness (PU) is a key driver of information system adoption, and this perception affects user satisfaction. In the Expectation Disconfirmation Theory (EDT), “perceived performance” reflects consumers’ PU of a product after purchase []. When using the WenZang database, designers need to efficiently browse, select, and apply various digitized traditional patterns. Performance plays a crucial role in this process: if the database is easy to use and significantly improves design efficiency and quality, designers are more likely to recognize its value, thereby increasing PU. For example, an efficient search and filtering system allows designers to quickly find the patterns they need, directly enhancing their work efficiency.
H3.
The PIM of the WenZang database and digital patterns has a significant positive impact on PU.
2.2.4. Information Quality (IQ)
Based on the updated D&M IS Success Model, IQ is an important factor influencing information success []. Information quality refers to the content and format generated by an information system (IS), with measurement criteria including accuracy, timeliness, reliability, relevance, and understandability. IQ is described as “users’ perceptions of the quality of information on a website” or “the extent to which customers receive complete, accurate, and timely information through electronic service interfaces” []. Previous studies have shown that users’ perceptions of the IQ provided by services or systems determine their usefulness and ease of use in the e-learning scenario [,,,]. For designers querying patterns in the WenZang database, high IQ enhances the convenience of their practice, improves the quality of their work, and makes the process time-saving and effortless.
H4.
The IQ of the WenZang database and digital patterns has a significant positive impact on PU.
2.2.5. Perceived Convenience (PC)
According to Brown (1989), PC consists of five key dimensions []: (1) place, the provision of products or services at locations convenient to consumers; (2) time, the provision of products or services at times convenient to consumers; (3) use, the ease with which the product or service can be used; (4) acquisition channels, the availability of diverse payment and financing options that facilitate purchase; and (5) execution, the convenience of the service delivery mode, for example, provider delivery versus self service.
In service and online settings, this construct has been systematized and validated using psychometric scales, which emphasizes that reductions in time and effort are associated with higher levels of convenience [,]. In digital learning contexts such as MOOCs, PC is primarily expressed through cost reduction and time savings, which in turn improve overall platform evaluations and adoption intentions []. Within the WenZang database context, the contextual antecedents of PC are largely provided by the platform, including cross-device and anytime access, efficient search and batch-processing workflows, decision convenience through clear licensing and provenance disclosure, and use convenience through vector export and similarity search. Collectively, these antecedents reduce the time and effort designers spend locating and integrating pattern assets into production workflows, thereby laying the groundwork for subsequent attitudes and behavioral intentions.
A substantial body of research indicates that PC significantly increases AU and PI. On the one hand, convenience reduces time, effort, and cognitive burden, thereby improving overall evaluations and attitudes toward use. On the other hand, these favorable evaluations extend to purchase intention and broader indicators of behavioral intention [,]. In digital platform settings, PC has been empirically shown to have a significant positive effect on user attitudes []. Multiple dimensions of online convenience significantly increase purchase intention and satisfaction, with evidence across retail electronic commerce and mobile banking [,,]. Within digital cultural heritage research, PC is modeled as an antecedent and influences attitude toward use and behavioral intention through pathways such as perceived usefulness and perceived enjoyment, thereby providing a transferable domain anchor for the present study [].
H5.
The PC of using digital patterns in the WenZang database has a positive effect on designers’ AU.
H7.
The PC of using digital patterns in the WenZang database has a positive effect on designers’ PI.
2.2.6. Perceived Usefulness (PU)
PU reflects the extent to which users believe that using a specific information system can enhance their work efficiency, including self-awareness, learning quality, and productivity []. Researchers have viewed PU as an extrinsic motivation to understand how different types of users adopt new technologies, such as personal computers [] and consumers using virtual stores []. These studies indicate that PU can help users develop a positive attitude toward using specific technologies or services, thereby increasing actual usage rates [].
Direct experience with a website leads to greater awareness and understanding, allowing users to assess the IT capabilities and effectiveness in meeting customer needs, thus strengthening the relationship between PU and PI [,]. Moreover, PU is a primary determinant of behavioral intention to use [,]. Previous research has found that PU has a significant positive influence on behavioral intentions to use mobile learning technologies [,,].
H6.
PU positively influences designers’ PI regarding the use of digital patterns in the WenZang database.
H8.
PU positively influences designers’ AU of digital patterns in the WenZang database.
2.2.7. Attitude Toward Using (AU)
AU reflects an individual’s positive or negative evaluation of an e-learning platform []. According to the Theory of Reasoned Action (TRA), people’s attitudes influence their behavioral intentions and subsequent actions. When individuals hold a positive attitude toward a system and perceive it as accessible, they are more likely to engage with it []. Users’ experience with the platform determines their satisfaction level and subsequent behavioral choices. The positive attitude could enhance users’ satisfaction with the WenZang database.
H9.
AU positively influences designers’ SAT digital patterns from the WenZang database.
2.2.8. Purchase Intention (PI)
A substantial body of research indicates that purchase intention PI is based on both symbolic and functional product attributes, with utilitarian value reflected in the practicality, convenience, and cost savings consumers experience during the shopping process [,]. This utilitarian value becomes particularly important when consumers focus solely on a product’s direct practical benefits. By enhancing the convenience and efficiency of online shopping choices, this value not only increases consumer satisfaction but also effectively strengthens their desire to purchase []. According to Expectation Confirmation Theory, when consumers’ actual experiences match their expectations, they typically feel satisfied and are more willing to make repeat purchases. Services that exceed expectations can increase satisfaction, while those falling short may lead to dissatisfaction. Consequently, high satisfaction levels can enhance consumers’ purchase willingness []. In this study, if design users demonstrate a positive attitude toward patterns in the WenZang database and show clear purchase intentions, these purchase intentions will be considered significant factors related to user satisfaction.
H10.
PI positively influences design users’ SAT digital patterns from the WenZang database.
2.2.9. Mission Technology Matching (MTM)
Goodhue and Thompson (1995) introduced the TTF model to examine whether the alignment between task characteristics and technology features can effectively predict information system success []. According to TTF theory, an information system’s success depends on how well its performance matches users’ task requirements. Task performance improves when an information system effectively meets users’ task demands. In the education sector, the TTF model has been applied to evaluate information systems such as MOOCs [,,] and Learning Management Systems []. Task characteristics are evaluated through the system’s structuring level, processing accuracy, and reliability. Researchers have historically emphasized the inseparable relationship between tasks and technology, maintaining that technology applications must align closely with the tasks they support [].
According to the TTF model, Yu and Yu (2010) found that learners select e-learning systems primarily when the technology features meet their usage requirements []. A finding supported by Kim et al. (2013), user satisfaction indicates system effectiveness [], including user acceptance and perceived value [,]. Regardless of an information system’s quality, efficiency, or support level, if users reject it, its intended effectiveness and performance will be compromised. Therefore, achieving task–technology alignment is essential. A well-designed and thoughtfully implemented system can enhance user satisfaction and create positive user impacts [].
H11.
MTM positively influences designers’ SAT digital patterns from the WenZang database.
H12.
MTM positively influences designers’ PTTF when using digital patterns from the WenZang database.
H13.
MTM positively influences designers’ perceived TTF when using digital patterns from the WenZang database.
2.2.10. Conceptual Differences in Designer Satisfaction and the Research Gap
A synthesis of prior work indicates that digital heritage platforms are increasingly characterized by a twofold integration of front-end, experience-oriented interfaces and back-end, AI-driven pipelines. Exhibition interfaces and visitor interactions have been reshaped by machine learning and AR/VR [,], while AI has been embedded in conservation and inspection workflows []. In parallel, visitor-facing UX models and continuance mechanisms have been consolidated in digital/virtual museum research [,].
While a conceptual divergence in how satisfaction is formulated is thereby evident between designers and other user groups. Whereas visitor-focused research emphasizes hedonic and educational outcomes (e.g., enjoyment, immersion, learning, and continuance) [], platforms are evaluated by professional designers through the lens of productive reuse, with priority given to TTF and workflow performance (searching, filtering, batch operations), IQ with provenance/rights clarity that reduces reuse risk, and format/metadata interoperability with associated PIM that sustain downstream creative pipelines []. Designer satisfaction, therefore, is not equivalent to visitor experience, it is more closely aligned with reuse-oriented constructs such as TTF, IQ, and PIM.
Against this backdrop, the research gap is evident. Few studies have explicitly modeled TTF, IQ, and PIM as first-order antecedents of designer satisfaction or operationalized their linkages to sustainable platform requirements (e.g., provenance/rights traceability and asset interoperability); likewise, mixed-methods designs that combine explanatory SEM with predictive ANN to capture potential nonlinearity and variable importance remain uncommon. To address this gap, an integrated TAM-TTF specification centered on reuse-relevant constructs is adopted, and a two-stage SEM → ANN sequence is implemented to provide convergent explanatory–predictive evidence.
2.3. Research Model
Based on the aforementioned hypotheses, this study proposes an integrated WenZang database research model incorporating the TAM and the TTF model. The model includes several key components, such as DA, PEOU, PC, PIM, IQ, PU, AU, PI, SAT, MTM, PTTF, and technical task fitting (TTF). Given the characteristics of the WenZang database patterns, a model was developed to assess designers’ acceptance of these patterns (Figure 2).
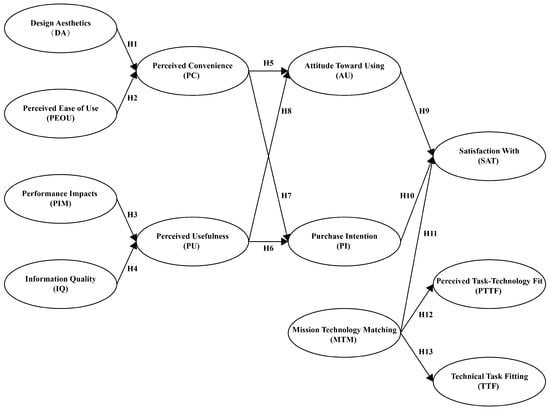
Figure 2.
Integrated TAM+TTF model for designer satisfaction in the WenZang digital pattern database. Note: Solid arrows denote hypothesized paths. Abbreviations, including DA = design aesthetics; PEOU = perceived ease of use; PIM = performance impacts; IQ = information quality; PC = perceived convenience; PU = perceived usefulness; AU = attitude toward using; PI = purchase intention; SAT = satisfaction with; MTM = mission technology matching; PTTF = perceived task–technology fit; TTF = technical task fitting.
This study was conducted in four stages (Figure 3):
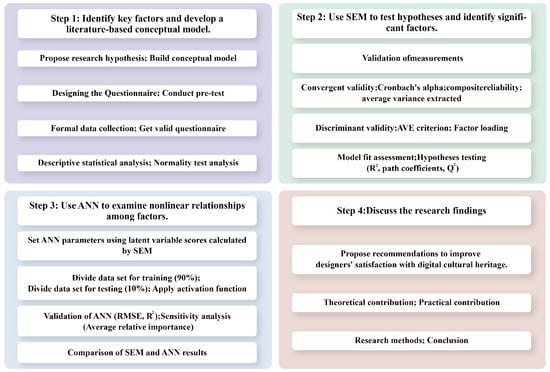
Figure 3.
Research workflow for the WenZang database designer-satisfaction study: model development and survey, SEM validation, ANN analysis, and synthesized contributions. Note: the workflow proceeds as follows: hypotheses and the conceptual model are developed; the questionnaire is designed and pretested; formal data are collected and screened with descriptive and normality checks; measurement validity is established and hypotheses are tested via SEM; an ANN is then trained on SEM-derived latent scores with a train/test split, followed by model validation and importance/sensitivity analyses, and results are compared with SEM. Finally, outputs synthesize recommendations to improve designer satisfaction with digital cultural heritage and articulate the study’s theoretical and practical contributions, methods, and conclusions. Abbreviations: SEM = structural equation modeling; ANN = artificial neural network.
Stage 1: A literature review was conducted to identify key factors influencing user satisfaction with digital cultural heritage; a conceptual model was constructed; and a survey was designed to collect data. Descriptive analysis was performed on valid questionnaires to further explore the impact of each factor.
Stage 2: SEM was employed to test the linear relationships in the conceptual model. Additionally, SEM logic was used to identify the sufficient conditions (i.e., “necessary factors”) influencing the results.
Stage 3: The latent variable scores obtained from SEM were used as inputs to analyze nonlinear relationships between factors using an ANN. The importance of each factor was ranked, and a comparative analysis of the SEM and ANN results was conducted.
Stage 4: Based on the integrated SEM-ANN analysis, theoretical and practical strategies to optimize user satisfaction with digital cultural heritage were proposed.
3. Materials and Methods
3.1. WenZang Pattern Database
The WenZang database was established in 2018 as a visual cultural heritage project that uses digital patterns as samples, aiming to better protect and preserve traditional designs (Figure 4 and Figure 5). The project is dedicated to exploring, restoring, and innovating on Chinese traditional patterns while building a comprehensive data system to store these designs. Currently, over 200 thematic pattern databases have been developed, covering five major areas: history, geography, ethnicity, media, and themes. The system has not only facilitated data collection and digital execution, but also established a correction mechanism for user applications. Consequently, a comprehensive database containing over 35,000 pattern entries has been established. The influence and interactivity of traditional patterns have been significantly enhanced through the publication of The Illustrated Guide to Chinese Classic Patterns, multi-platform promotion, brand collaborations, and digital technology exhibitions (Figure 4 and Figure 5).
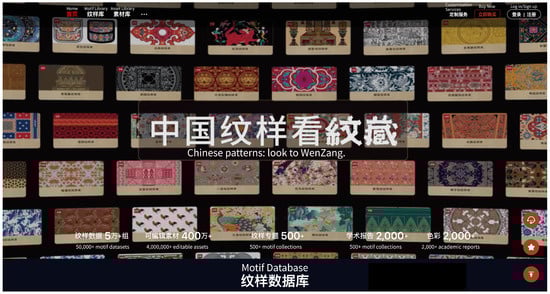
Figure 4.
The main page of the WenZang database.
Figure 5.
The samples library page of the WenZang database.
The WenZang database contains a large amount of traditional pattern data, attracting numerous designer users. Usage patterns and user feedback provide real-world data, helping to reveal designers’ acceptance and experience with digital patterns. By integrating the TAM and the TTF model, a deeper analysis of these factors can be conducted. The findings will provide insights for optimizing platform functionality, enhancing user experience, and offering guidance for other digital heritage projects. Additionally, these findings will validate the application of the TAM+TTF model in this field, contributing to the development of both theory and practice.
3.2. Questionnaire Design
The questionnaire comprises three distinct parts. Part one introduces digital patterns and related images from the WenZang database. Part two collects demographic data (gender, age, occupation, education, income, familiarity, usage experience) and examines designers’ intentions (four items each; 48 in total). To ensure cross-language equivalence, all items underwent rigorous back-translation procedures []. The original English items (drawn from validated scales) were first translated into Chinese by two independent translators with expertise in design and information systems. A third bilingual expert then back-translated the Chinese version to English without access to the original. Discrepancies between the original and back-translated versions were resolved through expert panel discussion, ensuring semantic equivalence. Additionally, five university professors with seven years of experience in cultural heritage digitalization and design education were consulted for wording accuracy. Participant data remain confidential and are used exclusively for academic research; no personal identification will be shared. As an incentive, participating designers will receive pattern-themed cultural and creative gifts in appreciation of their time and honest responses. Part three employs a five-point Likert scale for assessment: (1: “Strongly Disagree”, 2: “Disagree”, 3: “Neutral”, 4: “Agree”, 5: “Strongly Agree”) (Table 1).

Table 1.
Questionnaire items and sources for the study variables in the WenZang database. Note: this table enumerates 12 constructs (DA, PEOU, PC, AU, PIM, IQ, PU, PI, SAT, MTM, PTTF, TTF), their four-item measures (48 items total), and the literature sources. All items use a 5-point Likert scale (1 = strongly disagree … 5 = strongly agree).
3.3. Data Collection
Between February 2025 and March 2025, this study collected 310 complete questionnaires through the Chinese online survey platform Wenjuanxing. However, 43 questionnaires (14%) were deemed invalid. To mitigate common technical biases that could affect research findings, two key measures were implemented: (1) establishing a minimum questionnaire completion time of 120 s, with faster submissions considered unreliable; and (2) eliminating invalid responses, including those with clear contradictions or repetitive answers. Valid questionnaires were filtered based on these criteria for subsequent analysis.
The sample size is crucial for SEM analysis in this paper, as smaller samples can reduce model fit accuracy. After thorough screening, 267 questionnaires were validated, yielding an 86% valid response rate. This sample size exceeds the minimum threshold of 200 required for SEM analysis [], thus providing a robust foundation for data analysis.
3.4. Demographic Information
This study conducted a detailed demographic analysis on the 267 valid samples, with results presented in Table 2. Data processing was performed using SPSS software 27.0. The analysis revealed the following distribution:
Table 2.
Distribution of sample characteristics among designers participating in the WenZang database survey. Note: variables include gender, age group, occupation, education level, income range, familiarity with the “WenZang” database, and intended database application. Entries report frequency, percentage, valid percentage, and cumulative percentage.
The demographic characteristics of the sample in this study are as follows: gender distribution: 39.3% of the participants were male (105 individuals), while 60.7% were female (162 individuals). Age distribution: 1.9% of the participants were under 18 years old (5 individuals), 85.8% were between 18–30 years (229 individuals), 9.7% were between 31–40 years (26 individuals), 2.2% were between 41–55 years (6 individuals), and only 0.4% were over 55 years old (1 individual). Education level: 1.1% of the participants had a high school (or vocational high school) education (3 individuals), 52.4% had a bachelor’s degree (or equivalent) (140 individuals), 36.7% had a master’s degree (98 individuals), and 9.7% had a doctoral degree (26 individuals). Income levels: 28.8% of participants earned less than CNY 1000 per month (77 individuals), 23.2% earned between CNY 1000–3000 (62 individuals), 22.8% earned between CNY 3000–6000 (61 individuals), and 25.1% earned more than CNY 6000 (67 individuals).
In terms of professional background, the largest group of designers was graphic designers (50.9%, 136 individuals), followed by environmental designers (10.5%, 28 individuals) and product designers (8.2%, 22 individuals). Digital media designers accounted for 6.4% (17 individuals), fashion designers for 3.4% (9 individuals), and both animation and game designers accounted for 1.9% each (5 individuals). Jewelry, landscape, and ceramic designers each made up less than 1%. Awareness of the WenZang database: 10.5% (28 individuals) reported no knowledge, 50.2% (134 individuals) had heard of it, and 39.3% (105 individuals) were quite familiar with it. Intention to use: 70% (187 individuals) of the designers indicated they would use the database in pattern design, while 30% (80 individuals) expressed a negative attitude. This sample structure reflects the typical characteristics of the primary user group of current digital cultural heritage platforms, providing a representative data foundation for subsequent analysis.
4. Results
4.1. SEM Results
4.1.1. Assessment of Measurement Model
Given the good fit of the Confirmatory Factor Analysis (CFA) model, this study evaluates the convergent validity and internal consistency reliability of the measurement model using Average Variance Extracted (AVE), Composite Reliability (CR), and Cronbach’s coefficient. Specifically, the standardized factor loadings (TSTIMATE) of each measurement item on its respective latent variable were first calculated using the CFA model. Then, the AVE and CR values were calculated using standard formulas to test the convergent validity of each dimension. According to the recommendations of Nunnally and Bernstein (1994), a CR and Cronbach’s coefficient greater than 0.7 indicates good internal consistency reliability [], while an AVE value greater than 0.5 indicates good convergent validity of the measurement tool. The calculation formulas are as follows:
As shown in Table 3, the CR values and Cronbach’s coefficients for all latent variables in this study exceed 0.8, indicating excellent internal consistency and meeting rigorous academic standards.
Table 3.
Measurement model assessment: factor loadings, Cronbach’s alpha, composite reliability (CR), and average variance extracted (AVE). Note: All factor loadings are standardized. Internal consistency is acceptable when Cronbach’s alpha and CR ≥ 0.70; convergent validity is supported when AVE ≥ 0.50.
4.1.2. Tests of Differential Validity
Furthermore, the scale’s validity is assessed through convergent and discriminant validity. Convergent validity is measured by factor loadings, and typically, when all factor loadings exceed 0.7, it indicates strong explanatory power of the latent variables and good convergent validity of the observed variables. The assessment of discriminant validity is primarily based on the Fornell–Larcker criterion and cross-loading tests. This study applies this criterion to analyze the differences between latent variables. Discriminant validity is considered to be satisfied when the AVE value exceeds 0.5 and is greater than the square of the structural correlation coefficient between latent variables. As shown in Table 4, all factor loadings in this study meet the requirements for structural validity [].
Table 4.
Discriminant validity assessment via the Fornell–Larcker criterion: inter-construct correlations and square root of AVE value. Note: off-diagonal entries are inter-construct correlations; diagonal entries are AVE. The bottom row lists the square roots of the AVEs for each construct. Discriminant validity is supported when each construct’s square root of AVE is greater than all of its correlations with other constructs.
4.2. Structural Equation Modelling
4.2.1. Model Fit Test
Based on the model fit assessment results presented in Table 5, CMIN/DF = 1.463, which falls within the range of 1 to 3, indicating excellent fit. The RMSEA is 0.042, also considered excellent. The IFI, TLI, and CFI values are 0.921, 0.914, and 0.920, respectively, all of which are rated as outstanding. Therefore, the comprehensive analysis indicates that the model provides a good fit.
Table 5.
Overall goodness-of-fit indices for the model (CMIN/DF, RMSEA, IFI, TLI, CFI). Note: benchmarks including CMIN/DF ≈ 1–3 indicate excellent fit (Excellent: 1–3); RMSEA < 0.05 indicates excellent (excellent: <0.05; good: <0.08); IFI, TLI, and CFI ≥ 0.90 indicate good fit (excellent: >0.9; good: >0.8).
4.2.2. Path Relationship Test
To examine the effects of DA and PEOU on PC, PIM and IQ on PU, PC on AU and PI, PU on PI and AU, AU and PI on SAT, and MTM on SAT, perceived task–technology fit (PTTF), and TTF, thirteen hypotheses were proposed. These hypotheses were tested using SEM analysis with AMOS 26 software (Figure 6).
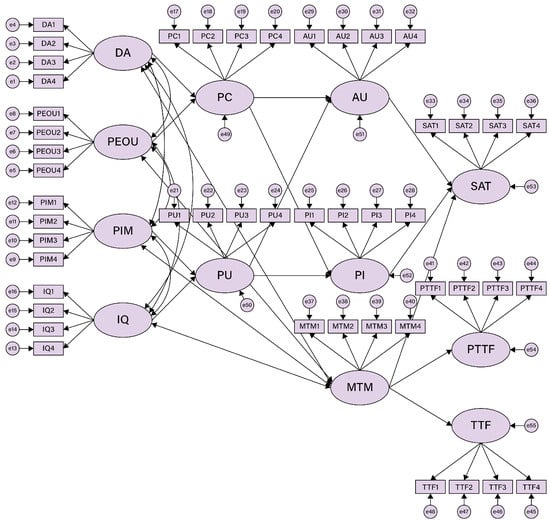
Figure 6.
The results of the structural model test.
4.3. Assessment of Structural Model
Based on the path relationship test results shown in Table 6, we evaluated the following hypotheses:
Table 6.
Hypothesis testing results for the structural model. Note: all path coefficients are standardized (). C.R. = estimate/S.E. (standard error). Two-tailed p-values are reported; “Supported” indicates .
H1: (DA → PC): E = 0.272, C.R. = 3.587, p < 0.05; H2: (PEOU → PC): E = 0.228, C.R. = 3.029, p < 0.05. This finding is consistent with many other studies. Yoon and Kim (2006) [] and Chang et al. (2013) [] indicate that PEOU positively affects PC; H3: (PIM → PU): E = 0.436, C.R. = 5.382, p < 0.05; H4: (IQ → PU): E = 0.337, C.R. = 4.673, p < 0.05. This finding aligns with several other studies; for example, research by Zhang et al. (2019) shows that IQ significantly positively affects PU and PEOU among Chinese students using mobile libraries []. Additionally, Ali and Warraich (2024), as well as Tao (2008), also provide evidence for the significant impact of IQ on PU [,]; H5: (PC → AU): E = 0.179, C.R. = 2.784, p < 0.05. This finding is consistent with other studies that report PC as an important antecedent of AU, and that PEOU positively influences PC []. Wang et al. (2022) also support the significant impact of PC on AU []; H6: (PU → PI): E = 0.426, C.R. = 5.698, p < 0.05. This finding matches other studies, such as Gefen et al. (2003), which indicate that direct experience with a website leads to more informed and confident assessments of information technology’s effectiveness in meeting customer needs [], thus strengthening the relationship between PU and PI [,]; H7: (PC → PI): E = 0.331, C.R. = 4.635, p < 0.05. Other studies corroborate this finding; for example, ref. [] shows that savings, convenience, and hedonic value enhance consumers’ online purchase intentions; H8: (PU → AU): E = 0.569, C.R. = 7.300, p < 0.05. When people find something useful, they tend to develop a positive attitude toward it and use the system to gain benefits. Many researchers have confirmed this relationship [], although some (e.g., []) have not; H9: (AU → SAT): E = 0.175, C.R. = 2.552, p < 0.05. This aligns with research indicating that consumers’ attitudes, based on market experiences, significantly affect satisfaction []. Chan et al. (2004) similarly found that attitudes toward marketing-mix variables in transitional economies impact satisfaction []; H10: (PI → SAT): E = 0.299, C.R. = 4.088, p < 0.05. This finding is consistent with studies showing that the convenience and efficiency brought by technology enhance consumer satisfaction and promote consumption [], as validated by Yin & Qiu (2021) []; H11: (MTM → SAT): E = 0.426, C.R. = 5.695, p < 0.05. Yu & Yu (2010) [] found that e-learners adopt systems when their technological capabilities match their needs, a concept further supported by Kim et al. (2013) []. Yüce et al. (2019) also confirmed MTM’s significant impact on satisfaction []. H12: (MTM → PTTF): E = 0.665, C.R. = 8.304, p < 0.05; H13: (MTM → TTF): E = 0.659, C.R. = 8.606, p < 0.05. These findings are consistent with previous research. All hypotheses are valid and confirmed.
Practical Meaning by Supported Hypothesis (H1–H13). H1 (DA → PC): PC is increased by stronger DA; perceptual fluency and navigational clarity are improved, shortening time-to-task and supporting routine continued use; H2 (PEOU → PC): PC is increased by greater PEOU; effort costs are lowered, stabilizing regular use; H3 (PIM → PU): PU is increased by better PIM, speed, stability, reliability, encouraging repeated use for production tasks; H4 (IQ → PU): PU is increased by higher IQ, including complete metadata and clear provenance/rights, reducing reuse risk and supporting ongoing engagement; H5 (PC → AU): AU is improved by PC, facilitating continued platform preference; H6 (PU → PI): PI is increased by PU, enabling conversion behaviors and follow-on use; H7 (PC → PI): PI is increased by PC, shortening the path from discovery to acquisition and supporting conversion; H8 (PU → AU): AU is improved by PU, reinforcing positive evaluations across sessions and supporting continued use; H9 (AU → SAT): SAT is increased by favorable AU, promoting continued use and lower drop-off; H10 (PI → SAT): SAT is increased by PI, signaling perceived value and supporting revisits; H11 (MTM → SAT): SAT is increased by closer MTM, as workflow alignment supports longer-term participation; H12 (MTM → PTTF): PTTF is increased by MTM, making tasks feel easier and better aligned to the tool, aiding sustained use; H13 (MTM → TTF): Overall TTF is increased when MTM system-level alignment of capabilities with task requirements is higher.
In the structural model, MTM exhibits the largest direct effect on SAT (). By contrast, in the ANN sensitivity analysis for SAT (Model E), PI attains the highest normalized importance (100%) relative to AU (42.45%), indicating that PI is the dominant behavioral antecedent among the direct inputs to that model. This pattern aligns with the model structure: PI aggregates upstream evaluations transmitted through PU (PU → PI) and PC (PC → PI), and the ANN captures their nonlinear and mediated accumulation. Operationally, prioritizing changes that raise PU (reliable, fast, stable delivery), PC (streamlined search/filter/batch; clear controls), and information quality (complete metadata, explicit provenance/rights) is expected to lift PI and, through PI, translate pre-use judgments into post-use satisfaction, thereby supporting sustained, repeated engagement with cultural-heritage platforms.
4.4. ANN Results
4.4.1. Model Building
The ANN stage is positioned not as a mere statistical enhancer but as the predictive phase of a mixed-methods analytical framework. The SEM stage provides explanatory validity by testing hypothesized causal paths derived from TAM and TTF, whereas the ANN stage provides predictive validity by identifying nonlinear relationships and ranking the relative importance of predictors. This two-stage integration of SEM (explanatory) and ANN (predictive) thus constitutes a complementary mixed-methods design, enabling both theory-driven explanation and data-driven prediction, which together deepen the understanding of satisfaction formation in digital heritage platforms.
As the SEM assumes linear and compensatory relationships between structures [], the accuracy of SEM analysis has been challenged in recent years. This assumption overly simplifies the complex multi-factor decision-making process. Therefore, an ANN analysis was adopted to complement the noncompensatory and nonlinear relationships among variables, aiming to improve the model’s predictive accuracy. This study adopts the hybrid SEM–ANN approach proposed by Aghaei et al. (2023) [], where a structural equation model is first estimated to examine and validate the relationships among latent constructs (Table 6 and Figure 6). Subsequently, a multilayer perceptron (MLP) neural network is employed to capture nonlinear patterns and evaluate the relative importance of predictors []. Following an outcome-specific modeling strategy, five separate ANN models (Figure 2) are developed to predict PC, PU, AU, PI, and SAT.
4.4.2. Validation of ANN
In this study, 90% of the dataset was used for training and 10% for testing the neural network model. To evaluate the ANN’s predictive performance, the mean root mean square error (RMSE) was calculated. To reduce the risk of overfitting, 10-fold cross-validation was used during testing. The results show that the RMSE values for ANN models A, B, C, D, and E ranged from 0.009 to 0.123 in both the training and testing sets. Overall, the RMSE values were relatively low (Table 7), indicating that the ANN models constructed in this study have good predictive accuracy.
Table 7.
Predictive performance of ANN models A–E: RMSE on training and testing sets. Note: each row (ANN1–ANN10) reports RMSE for one cross-validation fold under the training and testing partitions. Models A–E predict, respectively, A—PCa (inputs: DAa, PEOUa); B-PUa (inputs: PIMa, IQa); C-AUa (inputs: PCa, PUa); D-PIa (inputs: PCa, PUa); E-SATa (inputs: AUa, PIa). Means and SDs are computed across the 10 folds. The suffix ‘a’ denotes the variable values at the ANN analysis stage.
The coefficient of determination () was calculated using formulas (3) and (4) to assess the goodness of fit of the model. The ANN model constructed in this study predicts the variance for perceived convenience, perceived usefulness, usage attitude, purchase intention, and satisfaction as follows:
In Equation (3), MSE represents the mean squared error, SSE represents the sum of squared errors, and n denotes the sample size for both the training and testing sets.
4.4.3. Sensitivity Analysis
Sensitivity analysis was conducted in this study using the permutation method to determine the importance of each factor in the models []. As shown in Table 8, the importance ranking of the predictor variables in ANN Model A is DAa (100%) and PEOUa (75.747%). The importance ranking of the predictor variables in ANN Model B is PIMa (100%) and IQa (72.117%). The importance ranking of the predictor variables in ANN Model C is PUa (100%) and PCa (12.740%). The importance ranking of the predictor variables in ANN Model D is PUa (100%) and PCa (81.341%). The importance ranking of the predictor variables in ANN Model E is PIa (100%) and AUa (42.450%) (Figure 7).
Table 8.
Sensitivity analysis of ANN models A–E: relative (RI) and normalized importance (NI%) of predictors. Note: ANN1–ANN10 are the 10 cross-validation runs. Columns report predictor importance for each target model, A (output:PCa)(DAa, PEOUa); B (output:PUa) (PIMa, IQa); C (output:AUa) (PCa, PUa); D (output:PIa) (PCa, PUa); E (output:SATa) (AUa, PIa). RI is the mean relative importance across the 10 runs; NI% is RI-normalized to 100% within each model. The suffix ‘a’ denotes the variable values at the ANN analysis stage.
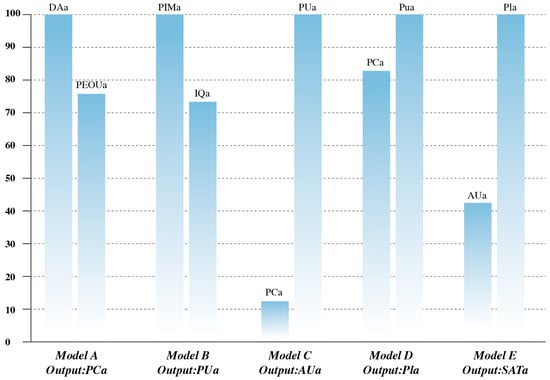
Figure 7.
ANN results visualization analysis.
To compare the results of the two methods, an ordinal comparison was further conducted, comparing the path coefficients in the SEM and the normalized relative importance in the ANN (Table 9). The results indicate that in Models A, B, D, and E, the SEM and ANN results are consistent; however, in Model C, differences exist between the two. Overall, ANN demonstrates strong predictive ability and validates the explanatory power of SEM results for endogenous variables.
Table 9.
Ordinal comparison of SEM path coefficients and ANN-normalized importance. Note: SEM columns report path coefficients. ANN columns report normalized relative importance (NI%), scaled to 100% within each model. “Ranking” columns give the within-model ordinal order of predictors; “Match” indicates identical ordering between SEM and ANN. The suffix ‘a’ denotes the variable values at the ANN analysis stage.
5. Discussion and Implications
5.1. Discussion
This study employs the TAM and the TTF model to explore designer users’ engagement with the WenZang database. Additionally, ANN analysis is incorporated to evaluate and validate the model’s predictive performance, thereby enhancing its explanatory accuracy. The results provide strong empirical support for the causal relationships among the variables in the TAM+TTF model, as shown in Figure 6. Therefore, this study confirms the TAM+TTF model’s effectiveness in explaining designer users’ satisfaction with the use of digital patterns in the WenZang database. Beyond empirical validation, this finding advances theoretical understanding by demonstrating how integrating task–technology alignment and individual acceptance dynamics can better explain engagement behaviors in creative digital heritage contexts. This synthesis bridges the gap between cognitive acceptance theory and design-oriented technology fit, highlighting that user satisfaction arises not only from functionality but also from cultural and aesthetic resonance.
These mechanisms align with sustainability-oriented digital heritage policy: long-term accessibility and safe, lawful reuse. The UNESCO Charter on the Preservation of the Digital Heritage (2003) frames preservation around continued accessibility, while the UNESCO 2015 Museum Recommendation links access to sustainable development and creative industry roles. Applying the FAIR principles, Findable, Accessible, Interoperable, Reusable, via complete metadata, durable/interoperable formats, and transparent rights supports professional reuse and sustained engagement. These design and data-quality levers are consistent with international digital-heritage policy trajectories that link access, lawful reuse, and creative-economy development []. Given the SEM/ANN results, PI is positioned as a conversion-proximal behavioral indicator. In the ANN model for SAT, PI shows the highest normalized importance among the direct behavioral inputs (relative to AU). When reuse/licensing frictions are reduced—through clear rights and provenance, reliable performance, and complete metadata, PI is expected to increase and, through PI, access is translated into sustained, responsible engagement with cultural-heritage assets by professional designers. Additionally, the WenZang database promotes user engagement and interaction through social media. This strategy significantly empowers users’ roles in cultural production and consumption, facilitating compliant reuse and derivative creation by professional users.
At the theoretical level, we found that DA and PEOU have a significant impact on PC. Previous research has shown that PEOU significantly affects both PU and PC []. Based on this, it was found that design aesthetics play a key role in the digitalization of cultural heritage, influencing users’ first impressions and their willingness to continue using the system. Perceived ease of use directly affects users’ perceived convenience, which refers to how easy users find the system. Additionally, perceived convenience influences users’ attitudes toward using the system and is directly related to their PI. Our research results confirm previous studies, indicating that DA and PEOU have a significant impact on the PC. This emphasizes a design-driven pathway within the TAM, suggesting that aesthetic perception functions as an affective bridge between usability and perceived value. By connecting visual appeal with cognitive efficiency, the results underscore that heritage interfaces should be treated as aesthetic experience systems rather than mere information utilities.
Consistent with prior research, PIM and IQ are found to significantly increase PU. In a digital pattern repository should be operationalized using indicators oriented to design tasks. PIM is evidenced by smooth, deep zoom and rendering of vector graphics, responsive, semantic search and filtering, and stable and seamless interoperability with design tools for batch export. IQ comprises the degree of vectorization and line fidelity, color accuracy, complete and accurate metadata for elements, subjects, and provenance, and clear licensing that reduces uncertainty for reuse. Within the TAM framework, PIM and IQ have been validated as robust antecedents of PU [,,]. In GLAM reuse contexts, rights status and metadata quality are critical to safe, legal creative reuse and downstream reuse []. In related digital resource settings, the positive effects of PIM and IQ on PU have been empirically validated [,]. Accordingly, effective improvements to WenZang should focus on IIIF based deep tiling for smooth magnification, lossless vector downloads, element-level segmentation and palette extraction, and immediate display of licensing badges on results pages, so as to shorten the sequence from search to evaluation to reuse, and thereby increase PU [,,].
At the practical level (model-based), PC significantly influences AU and PI, which is consistent with previous research. PC is considered a key determinant of technology acceptance in mobile e-commerce [,]. Perceived convenience is a significant antecedent of attitude, and perceived ease of use positively affects perceived convenience []. This study indicates that when the WenZang database and digital patterns are simple and convenient to operate, designer users exhibit more positive usage attitudes and stronger purchase intentions, highlighting that perceived convenience is key to improving user SAT and PI. At the theoretical level, PU significantly influences AU and PI, which is consistent with previous research. Specifically, PU has a significant impact on individuals’ technology AU [,,,]. Furthermore, Faqih (2016) clearly indicates that PU is a crucial factor influencing nonshoppers’ intentions to adopt online shopping behavior []. Rehman et al. (2019) explain that PU has a positive and significant impact on consumers’ purchase intentions []. From a design perspective, platforms should optimize system functionality to meet user needs and enhance users’ perception of the system’s usefulness.
At the practical level, AU and PI significantly affect SAT, which is consistent with previous research []. The WenZang database’s aesthetic design, user-friendly interface, and rich interactive features significantly enhanced users’ AU, thereby increasing SAT. PI also significantly affects SAT, and MTM has a positive impact on SAT, PTTF, and TTF. According to previous studies, SAT formation emphasizes aligning TTF with the system platform [,].
The ANN analysis revealed the importance ranking of PC, PU, AU, PI, and SAT. Integrating ANN insights with the SEM pathway analysis enables a deeper inference: while traditional SEM confirms linear causality, the ANN highlights nonlinear interdependencies among aesthetic perception, convenience, and behavioral intention. This suggests that user satisfaction in digital heritage systems is influenced by synergistic dynamics among emotion, cognition, and system design, a multidimensional perspective that is rarely captured in conventional acceptance models. The ANN analysis aims to address the limitations of SEM analysis, providing a more comprehensive understanding of user SAT digital cultural heritage usage []. PI is the most significant factor in user satisfaction, while design aesthetics and system performance, as key experiential factors, indirectly contribute to satisfaction by enhancing perceived convenience and perceived usefulness. Finally, beyond the case of WenZang, these findings provide transferable implications for other digital heritage and cultural-technology platforms such as virtual museums and AI-based cultural archives. The integrated SEM–ANN approach demonstrates that while SEM validates the causal structure among perceived usefulness, convenience, and satisfaction, the ANN identifies nonlinear effects and priority factors (e.g., purchase intention, design aesthetics). Practically, this complementary insight guides designers of other platforms in enhancing user engagement and sustainability by optimizing aesthetic experiences, system reliability, and personalized interactions.
5.2. Implications
The study integrates the TAM+TTF model and an ANN approach to examine and extend the mechanisms underlying designers’ SAT in the WenZang database context. The results indicate that AU, PI, and MTM have a positive influence on SAT. ANN analysis further indicates that PI exerts the largest effect on SAT. Additionally, DA and PIM indirectly affect AU and PI through PC and PU, thereby increasing SAT. These findings offer a complementary perspective to traditional linear modeling.
At the platform-optimization level, increasing PI should be prioritized, with PU and PC leveraged as the primary mechanisms. To enhance PU, platforms should implement (1) faster search and batch processing; (2) improved system responsiveness; (3) high-resolution assets with structured metadata; and (4) clear licensing on item pages—all reducing decision costs. Concurrently, shortening key task flows, optimizing visual hierarchy and style consistency, and offering reusable templates for high-frequency scenarios (e.g., logos, packaging, pattern extensions) can increase convenience and thus PC. At the conversion stage, watermarked “try-before-buy” exports, theme-based authorization bundles, and post-purchase exposure (e.g., homepage recommendations) can directly increase PI and, in turn, raise SAT.
With respect to TTF, platform capabilities should be tightly aligned with real design workflows so that assets move from merely viewable to genuinely usable. Accordingly, element-level segmentation, vector reconstruction, palette extraction, semantic search with taboo prompts, deep zoom, and multi-format export should be provided to support the end-to-end pipeline from retrieval and selection to production. Furthermore, establishing task–recommended asset–specification chains for high-frequency tasks can shorten the cycle from search to final output and strengthen the pathway from MTM to SAT. In addition, plug-ins and lightweight scripts for mainstream design software, a developer ecosystem, and supporting services (data cleaning and vectorization, style-consistency checks, prototyping, and small-batch production) can further enhance TTF and stabilize SAT.
To consolidate the AU pathway, a co-creation, curation, and learning strategy should be adopted to sustain positive experiences. On the one hand, designer-oriented “ready-to-apply” pattern libraries should be structured by task scenarios and ethnic motifs, and should be accompanied by expert annotations and curated topics to reduce uncertainty and deepen understanding. On the other hand, task-based tutorials and case walkthroughs covering search, authorization, and application should be provided to accelerate the transition from familiarization to practical outputs for novices. Operationally, regular small-scale events and challenges themed “Ethnic Patterns and Modern Applications” should be organized to encourage the submission and listing of designer works derived from platform assets, thereby forming an asset–creation–application–feedback cycle that improves item quality and usability and, through case exposure and community effects, elevates AU and PI, indirectly enhancing SAT.
The study also emphasizes a user-centered integration of digitization, artistic creation, and design. The model variables offer operational levers for this integration: PU for perceived usefulness, PC for workflow fluency, and TTF for technical fit. Systematic improvements in PU, PC, and TTF enable digital cultural heritage resources to be embedded more effectively into design scenarios, increasing the practical fit and utility across tools, processes, and outputs, and thereby promoting higher levels of adoption and reuse.
Regarding sustainability, closed-loop governance and continuous improvement should guide platform design, with a “digital preservation layer” and a “design reuse layer” built in tandem to maintain the long-term vitality and quality of pattern resources and knowledge. The preservation layer should focus on standardized capture and processing, ownership and provenance records, versioning, and persistent identifiers, as well as cultural annotations, thereby establishing a long-term data-to-knowledge accumulation layer for long-term preservation and reuse. The reuse layer should employ contribution-back and application-feedback mechanisms to write back empirical information—print fidelity, process feasibility, and usage contexts—to item records, continually shifting entries from “viewable” to “usable”. Process evaluations should track update cadence, annotation coverage, the quantity of actionable feedback, and reuse rates to improve preservation–access–reuse capabilities steadily. Meanwhile, transparent authorization workflows and clear licensing labels reduce uncertainty and build ecosystem trust; in deployment, such practices are expected to elevate PC and PU, thereby indirectly promoting PI and SAT.
At the policy and governance level, priority should be given to instruments that are directly aligned with validated pathways. Baseline metrics and evaluation mechanisms for information quality and service performance should be established to systematically enhance PU, thereby increasing PI, AU, and SAT. Usability and interface aesthetics guidelines for public platforms should be issued to improve PC, thereby indirectly increasing PI and AU. Task-specific feature development and evaluation should be supported through targeted funding to strengthen the direct pathway from MTM to SAT.
In sum, introducing ANN substantially enhances the explanatory power of the TAM+TTF model, enabling a multi-path framework that links attitude, fit, and conversion and supports variable-aligned, user-centered, and sustainability-aware optimization proposals. This provides actionable implications for platform and system designers to understand and improve SAT and establishes methodological and practical foundations for the fit and long-term application of digital cultural heritage in art and design.
6. Conclusions
This study investigated the determinants of designer satisfaction with the WenZang database using an integrated TAM+TTF framework, with SEM for hypothesis testing and ANN to capture nonlinear importance. Together, the two methods mitigate each other’s limitations. The integration of TAM+TTF model theoretical perspectives proved effective in explaining user satisfaction within the specialized context of digital cultural heritage repositories designed for creative professionals.
6.1. Principal Findings
The empirical analysis identified multiple pathways through which platform characteristics influence designer satisfaction. Visual and functional platform attributes shape users’ perceptions of convenience and usefulness, which, in turn, determine attitudes and behavioral intentions toward the platform. These psychological and behavioral responses collectively drive overall satisfaction levels. Our analysis further demonstrated that MTM directly raises SAT and operates upstream by increasing PTTF and overall TTF. ANN sensitivity analysis indicated that PI showed the highest normalized importance for SAT among the behavioral antecedents. These indirect pathways may be underestimated in conventional linear models. For the WenZang database platform, these findings suggest that enriching the digital pattern collection, optimizing interface aesthetics, streamlining search and retrieval workflows, and ensuring high-resolution image quality and comprehensive metadata can enhance designer experiences. Practically, future digital-heritage projects can use this model as an actionable loop: (1) map features to DA/PEOU/PC/PIM/IQ and document rights/metadata to support FAIR-aligned reuse; (2) validate paths with SEM; (3) rank nonlinear importance with ANN; (4) prioritize interventions that raise PU/PC → AU/PI and MTM → (PTTF/TTF/SAT); and (5) re-measure after release for sustainable engagement.
6.2. Limitations
Our study focuses on designer users in the Chinese professional context, examining their acceptance and satisfaction with digital cultural heritage platforms using the TAM+TTF model. While this approach enables a detailed understanding of designer-specific factors and provides actionable insights for platforms serving creative professionals, it necessarily limits generalizability across geographical and cultural contexts. Notably, the constructs, including DA, PEOU, PC, PIM, IQ, PU, AU, PI, SAT, and TTF, may carry different interpretations and relative weights across cultural contexts; as cross-cultural measurement invariance was not tested, the stability of paths across countries remains to be established.
This research employs online questionnaires to capture designer perceptions and behavioral intentions, a method that facilitates efficient access to geographically dispersed professional populations and enables standardized measurement across respondents. While this approach successfully gathered substantial quantitative data (n = 267), self-report instruments inherently capture stated preferences rather than observed behaviors. Complementary behavioral analytics, usability testing, and qualitative inquiry would reveal situated practices. The structured survey format, by design, elicits responses to predetermined constructs and cannot surface unanticipated user needs or contextual factors that emerge organically during authentic design work. Future research incorporating behavioral analytics, usability testing, and qualitative inquiry would complement these survey findings by revealing the situated practices through which designers actually engage with digital heritage resources.
Additionally, several methodological and contextual limitations should be acknowledged. (1) As the data were collected via self-reported questionnaires, participants’ responses may be influenced by subjective bias, social desirability, or recall bias. (2) The study employed a cross-sectional design, which limits the ability to infer causal relationships among variables; future research using longitudinal or experimental designs could verify the temporal dynamics of user satisfaction. (3) The sample was drawn from Chinese professional designers, and thus reflects cultural and contextual factors specific to China’s digital heritage environment. (4) The sample exhibits a bias toward younger designers, with 85.8% of participants aged 18–30 (Table 2). This concentration of early-career professionals may limit the representativeness of our findings, as the perspectives of older or more experienced designers are underrepresented. Future studies could therefore incorporate more age-diverse cohorts and consider cross-cultural or longitudinal designs to determine whether the observed relationships hold across broader demographic groups and over time. Consequently, caution should be exercised when generalizing these findings to designers in other cultural or institutional contexts.
Given that the platform also serves researchers, educators, conservation professionals, and the public, stakeholder-specific reassessment and comparative evaluations are warranted. The present findings provide an evidence base for optimizing platform functions that are critical for designer users; further cross-national validation and multi-stakeholder studies would assess external validity across diverse cultural and institutional contexts and help ensure that improvements do not privilege one constituency at the expense of others.
6.3. Future Research Directions
Future work should be forward-looking and application-oriented. Longitudinal designs tracking the same designer cohort across multiple time points would reveal how satisfaction, usage patterns, and feature preferences evolve as users transition from initial adoption to sustained platform integration. Such temporal analysis could identify critical junctures at which designers choose to continue using or migrate to alternative resources, thereby informing retention strategies and onboarding optimization. Cross-national cohorts can test whether the relative importance of constructs such as DA, PU, and TTF remains stable over time. Comparative studies across museum collections, archives, and design libraries—and across regions—should pair measurement-invariance checks with SEM/ANN to assess path stability and predictor importance under different institutional and policy contexts. Beyond quantitative extensions, qualitative process research examining how designers actually work with digital heritage resources during authentic creative projects would complement the survey-based findings reported here. Ethnographic observation, including shadowing designers through complete project cycles, think-aloud protocols during active search sessions, and design diaries maintained across multiple projects, could document when and why designers access heritage platforms, what triggers database switching, and how retrieved patterns undergo creative transformation. Such work will surface workflow frictions and inform culturally adaptive features and interfaces. Finally, multi-stakeholder re-estimation (designers, researchers, educators, conservators, and the public) should be used to derive stakeholder-appropriate optimizations and avoid one-group bias, providing actionable guidance for future digital-heritage projects.
Author Contributions
W.G.: writing—review and editing, writing—original draft, visualization, validation, software, resources, project administration, methodology, investigation, funding acquisition, formal analysis, data curation, conceptualization. Q.B.: writing—review and editing, writing—original draft, visualization, validation, software, resources, project administration, methodology, investigation, funding acquisition, formal analysis, data curation, conceptualization. M.G.: writing—review and editing, supervision, methodology. K.Y.L.: writing—review and editing, supervision, methodology. All authors have read and agreed to the published version of the manuscript.
Funding
This research was funded by the Project for Enhancing the Scientific Research Basic Capabilities of Young and Middle-aged Teachers in Guangxi’s Higher Education in 2025, grant number 2025KY1426.
Institutional Review Board Statement
The study was conducted in accordance with the Declaration of Helsinki, and approved by the Ethics Review Committee of Harbin Institute of Technology, HIT-2025006, 17 February 2025.
Informed Consent Statement
The studies involving humans were approved by the Ethical Committee of Harbin Institute of Technology. The studies were conducted in accordance with the local legislation and institutional requirements. The participants provided their written informed consent to participate in this study.
Data Availability Statement
The original contributions presented in this study are included in the article. Further inquiries can be directed to the corresponding author.
Conflicts of Interest
The authors declare that the research was conducted in the absence of any commercial or financial relationships that could be construed as a potential conflict of interest.
References
- Owens, T. Digital cultural heritage and the crowd. Curator Mus. J. 2013, 56, 121–130. [Google Scholar] [CrossRef]
- Khan, I.U.; Hameed, Z.; Yu, Y.; Islam, T.; Sheikh, Z.; Khan, S.U. Predicting the acceptance of MOOCs in a developing country: Application of task-technology fit model, social motivation, and self-determination theory. Telemat. Inform. 2017, 35, 964–978. [Google Scholar] [CrossRef]
- UNESCO World Heritage Centre. World Heritage List. 2025. Available online: https://whc.unesco.org/en/list/ (accessed on 17 March 2025).
- Comes, R.; Buna, Z.; Badiu, I. Creation and preservation of digital cultural heritage. J. Anc. Hist. Archeol. 2014, 1, 50–56. [Google Scholar] [CrossRef]
- Baca, M. Practical issues in applying metadata schemas and controlled vocabularies to cultural heritage information. Cat. Classif. Q. 2003, 36, 47–55. [Google Scholar] [CrossRef]
- Francioni, F. Beyond State Sovereignty: The Protection of Cultural Heritage as a Shared Interest of Humanity. In Globalization and Common Responsibilities of States; Routledge: London, UK, 2017; pp. 375–394. [Google Scholar] [CrossRef]
- Musée du Louvre. Louvre Collections Database. 2025. Available online: https://collections.louvre.fr/en/ (accessed on 17 March 2025).
- X News. 2023. Available online: https://www.britishmuseum.org/collection (accessed on 17 March 2025).
- Ministry of Science and Technology of the People’s Republic of China. Notice on the “13th Five-Year Plan” for Cultural Heritage Protection and Public Cultural Service Technology Innovation. 2016. Available online: https://most.gov.cn/xxgk/xinxifenlei/fdzdgknr/fgzc/gfxwj/gfxwj2016/201612/t20161221_129720.html (accessed on 17 March 2025).
- Wagner, A.; De Clippele, M.S. Safeguarding cultural heritage in the digital era—A critical challenge. Int. J. Semiot. Law-Rev. Int. Semiot. Jurid. 2023, 36, 1915–1923. [Google Scholar] [CrossRef]
- World Pattern Database. Pattern Database Activity Content Page. 2025. Available online: https://www.wenzang.cn/ (accessed on 17 March 2025).
- Terras, M.; Coleman, S.; Drost, S.; Elsden, C.; Helgason, I.; Lechelt, S.; Osborne, N.; Panneels, I.; Pegado, B.; Schafer, B.; et al. The value of mass-digitised cultural heritage content in creative contexts. Big Data Soc. 2021, 8, 20539517211006165. [Google Scholar] [CrossRef]
- Ajala, S.B.; Ayojimi, W.; Hájek, M. The role of communication channels in promoting sustainable wood waste management in the Czech Republic. Sustainability 2025, 17, 8261. [Google Scholar] [CrossRef]
- Simbirtseva, N.A.; Kruglikova, G.A.; Plaksina, E.B. Cultural and educational practices in the museum environment: Transmission of cultural heritage. Chang. Soc. Personal. 2020, 4, 492–507. [Google Scholar] [CrossRef]
- Cinquepalmi, F.; Tiburcio, V.A. Sustainable Restoration of Cultural Heritage in the digital era. VITRUVIO-Int. J. Archit. Technol. Sustain. 2023, 8, 76–87. [Google Scholar] [CrossRef]
- Zhang, L.; Fu, D.; Zhao, J. An empirical study on the digital display design of intangible cultural heritages based on audience satisfaction. Discret. Dyn. Nat. Soc. 2022, 2022, 9501415. [Google Scholar] [CrossRef]
- Mason, M.; Vavoula, G. Digital Cultural Heritage Design Practice: A Conceptual Framework. Des. J. 2021, 24, 405–424. [Google Scholar] [CrossRef]
- Doukianou, S.; Daylamani-Zad, D.; Paraskevopoulos, I. Beyond virtual museums: Adopting serious games and extended reality (XR) for User-Centred cultural experiences. In Springer Series on Cultural Computing; Springer: Berlin/Heidelberg, Germany, 2020; pp. 283–299. [Google Scholar] [CrossRef]
- Wu, Y.; Jiang, Q.; Liang, H.; Ni, S. What drives users to adopt a digital museum? A case of virtual exhibition Hall of National Costume Museum. SAGE Open 2022, 12, 21582440221082105. [Google Scholar] [CrossRef]
- Davis, F.D. Perceived usefulness, perceived ease of use, and user acceptance of information technology. MIS Q. 1989, 13, 319. [Google Scholar] [CrossRef]
- Goodhue, D.L.; Thompson, R.L. Task-Technology fit and individual performance. MIS Q. 1995, 19, 213. [Google Scholar] [CrossRef]
- Dishaw, M.T.; Strong, D.M. Extending the technology acceptance model with task–technology fit constructs. Inf. Manag. 1999, 36, 9–21. [Google Scholar] [CrossRef]
- Soomro, R.B.; Al-Rahmi, W.M.; Dahri, N.A.; Almuqren, L.; Al-Mogren, A.S.; Aldaijy, A. A SEM–ANN analysis to examine impact of artificial intelligence technologies on sustainable performance of SMEs. Sci. Rep. 2025, 15, 5438. [Google Scholar] [CrossRef]
- Aghaei, S.; Shahbazi, Y.; Pirbabaei, M.; Beyti, H. A hybrid SEM-neural network method for modeling the academic satisfaction factors of architecture students. Comput. Educ. Artif. Intell. 2023, 4, 100122. [Google Scholar] [CrossRef]
- Adams, D.A.; Nelson, R.R.; Todd, P.A. Perceived usefulness, ease of use, and usage of information technology: A replication. MIS Q. 1992, 16, 227. [Google Scholar] [CrossRef]
- Kim, K.J.; Shin, D.H. An acceptance model for smart watches. Internet Res. 2015, 25, 527–541. [Google Scholar] [CrossRef]
- King, W.R.; He, J. A meta-analysis of the technology acceptance model. Inf. Manag. 2006, 43, 740–755. [Google Scholar] [CrossRef]
- Feng, G.C.; Su, X.; Lin, Z.; He, Y.; Luo, N.; Zhang, Y. Determinants of Technology Acceptance: Two Model-Based Meta-Analytic Reviews. Journal. Mass Commun. Q. 2020, 98, 83–104. [Google Scholar] [CrossRef]
- Yan, H.; Zhang, H.; Su, S.; Lam, J.F.I.; Wei, X. Exploring the Online Gamified Learning Intentions of College Students: A Technology-Learning Behavior Acceptance Model. Appl. Sci. 2022, 12, 12966. [Google Scholar] [CrossRef]
- Na, S.; Heo, S.; Han, S.; Shin, Y.; Roh, Y. Acceptance Model of Artificial Intelligence (AI)-Based Technologies in Construction Firms: Applying the Technology Acceptance Model (TAM) in Combination with the Technology–Organisation–Environment (TOE) Framework. Buildings 2022, 12, 90. [Google Scholar] [CrossRef]
- Chatterjee, S.; Rana, N.P.; Dwivedi, Y.K.; Baabdullah, A.M. Understanding AI adoption in manufacturing and production firms using an integrated TAM-TOE model. Technol. Forecast. Soc. Chang. 2021, 170, 120880. [Google Scholar] [CrossRef]
- Wang, J.; Zhao, S.; Zhang, W.; Evans, R. Why people adopt smart transportation services: An integrated model of TAM, trust and perceived risk. Transp. Plan. Technol. 2021, 44, 629–646. [Google Scholar] [CrossRef]
- Lin, C.Y.; Xu, N. Extended TAM model to explore the factors that affect intention to use AI robotic architects for architectural design. Technol. Anal. Strateg. Manag. 2021, 34, 349–362. [Google Scholar] [CrossRef]
- Li, X.Z.; Chen, C.C.; Kang, X.; Kang, J. Research on relevant Dimensions of tourism Experience of Intangible Cultural Heritage Lantern Festival: Integrating generic learning outcomes with the Technology Acceptance Model. Front. Psychol. 2022, 13, 943277. [Google Scholar] [CrossRef]
- Kang, X.; Li, X.Z.; Chen, C.C. An acceptance model of digital education in intangible cultural heritage based on cultural awareness. Digit. Creat. 2023, 34, 331–346. [Google Scholar] [CrossRef]
- De Caro, L.; Sibillano, T.; Lassandro, R.; Giannini, C.; Fanti, G. X-ray dating of a Turin Shroud’s linen sample. Heritage 2022, 5, 860–870. [Google Scholar] [CrossRef]
- Wang, W.T.; Sari, M.K. Examining the effect of the Task-Technology fit of game mechanisms on learning outcomes in online gamification platforms. J. Educ. Comput. Res. 2023, 61, 1568–1595. [Google Scholar] [CrossRef]
- Isaac, O.; Aldholay, A.; Abdullah, Z.; Ramayah, T. Online learning usage within Yemeni higher education: The role of compatibility and task-technology fit as mediating variables in the IS success model. Comput. Educ. 2019, 136, 113–129. [Google Scholar] [CrossRef]
- Lin, C.L.; Jin, Y.Q.; Zhao, Q.; Yu, S.W.; Su, Y.S. Factors Influence Students’ Switching Behavior to Online Learning under COVID-19 Pandemic: A Push–Pull–Mooring Model Perspective. Asia-Pac. Educ. Res. 2021, 30, 229–245. [Google Scholar] [CrossRef]
- Omotayo, F.O.; Haliru, A. Perception of task-technology fit of digital library among undergraduates in selected universities in Nigeria. J. Acad. Librariansh. 2019, 46, 102097. [Google Scholar] [CrossRef]
- Rai, R.S.; Selnes, F. Conceptualizing task-technology fit and the effect on adoption—A case study of a digital textbook service. Inf. Manag. 2019, 56, 103161. [Google Scholar] [CrossRef]
- Wang, H.; Tao, D.; Yu, N.; Qu, X. Understanding consumer acceptance of healthcare wearable devices: An integrated model of UTAUT and TTF. Int. J. Med. Inform. 2020, 139, 104156. [Google Scholar] [CrossRef]
- Park, J.; Gunn, F.; Lee, Y.; Shim, S. Consumer acceptance of a revolutionary technology-driven product: The role of adoption in the industrial design development. J. Retail. Consum. Serv. 2015, 26, 115–124. [Google Scholar] [CrossRef]
- Kline, R.B. Principles and Practice of Structural Equation Modeling; Guilford Publications: New York, NY, USA, 2011. [Google Scholar]
- Leguina, A. A Primer on Partial Least Squares Structural Equation Modeling (PLS-SEM); Sage: Thousand Oaks, CA, USA, 2015; Volume 38, pp. 220–221. [Google Scholar] [CrossRef]
- Shmueli, G.; Sarstedt, M.; Hair, J.F.; Cheah, J.H.; Ting, H.; Vaithilingam, S.; Ringle, C.M. Predictive model assessment in PLS-SEM: Guidelines for using PLSpredict. Eur. J. Mark. 2019, 53, 2322–2347. [Google Scholar] [CrossRef]
- Xu, S.; Wang, Y.; Luo, W. Hybrid SEM-ANN model for predicting undergraduates’ e-learning continuance intention based on perceived educational and emotional support. PLoS ONE 2024, 19, e0308630. [Google Scholar] [CrossRef]
- Cyr, D.; Head, M.; Ivanov, A. Design aesthetics leading to m-loyalty in mobile commerce. Inf. Manag. 2006, 43, 950–963. [Google Scholar] [CrossRef]
- Van Der Heijden, H. Factors influencing the usage of websites: The case of a generic portal in The Netherlands. Inf. Manag. 2003, 40, 541–549. [Google Scholar] [CrossRef]
- Dion, K.; Berscheid, E.; Walster, E. What is beautiful is good. J. Personal. Soc. Psychol. 1972, 24, 285–290. [Google Scholar] [CrossRef] [PubMed]
- Eagly, A.H.; Ashmore, R.D.; Makhijani, M.G.; Longo, L.C. What is beautiful is good, but…: A meta-analytic review of research on the physical attractiveness stereotype. Psychol. Bull. 1991, 110, 109. [Google Scholar] [CrossRef]
- Tractinsky, N.; Katz, A.; Ikar, D. What is beautiful is usable. Interact. Comput. 2000, 13, 127–145. [Google Scholar] [CrossRef]
- Chang, H.H.; Chen, S.W. Consumer perception of interface quality, security, and loyalty in electronic commerce. Inf. Manag. 2009, 46, 411–417. [Google Scholar] [CrossRef]
- Sun, Y.; Lyu, Y.; Lin, P.H.; Lin, R. Comparison of Cognitive Differences of Artworks between Artist and Artistic Style Transfer. Appl. Sci. 2022, 12, 5525. [Google Scholar] [CrossRef]
- Goodhue, D. The model underlying the measurement of the impacts of the IIC on the end-users. J. Am. Soc. Inf. Sci. 1997, 48, 449–453. [Google Scholar] [CrossRef]
- McGill, T.; Hobbs, V. How students and instructors using a virtual learning environment perceive the fit between technology and task. J. Comput. Assist. Learn. 2007, 24, 191–202. [Google Scholar] [CrossRef]
- Yi, Y.J.; You, S.; Bae, B.J. The influence of smartphones on academic performance. Libr. Tech 2016, 34, 480–499. [Google Scholar] [CrossRef]
- Cho, Y. A consumer satisfaction model based on the integration of EDT and TAM. Asia Pac. J. Mark. Logist. 2017, 29, 978–993. [Google Scholar] [CrossRef]
- Delone, W.H.; McLean, E.R. The DeLone and McLean Model of Information Systems Success: A Ten-Year Update. J. Manag. Inf. Syst. 2003, 19, 9–30. [Google Scholar] [CrossRef]
- Cheng, Y. Effects of quality antecedents on e-learning acceptance. Internet Res. 2012, 22, 361–390. [Google Scholar] [CrossRef]
- Lin, J.C.C.; Lu, H. Towards an understanding of the behavioural intention to use a web site. Int. J. Inf. Manag. 2000, 20, 197–208. [Google Scholar] [CrossRef]
- Motaghian, H.; Hassanzadeh, A.; Moghadam, D.K. Factors affecting university instructors’ adoption of web-based learning systems: Case study of Iran. Comput. Educ. 2012, 61, 158–167. [Google Scholar] [CrossRef]
- Salloum, S.A.; Alhamad, A.Q.M.; Al-Emran, M.; Monem, A.A.; Shaalan, K. Exploring students’ acceptance of E-Learning through the development of a comprehensive technology acceptance model. IEEE Access 2019, 7, 128445–128462. [Google Scholar] [CrossRef]
- Brown, L.G. The strategic and tactical implications of convenience in consumer product marketing. J. Consum. Mark. 1989, 6, 13–19. [Google Scholar] [CrossRef]
- Seiders, K.; Voss, G.B.; Godfrey, A.L.; Grewal, D. SERVCON: Development and validation of a multidimensional service convenience scale. J. Acad. Mark. Sci. 2007, 35, 144–156. [Google Scholar] [CrossRef]
- Berry, L.L.; Seiders, K.; Grewal, D. Understanding service convenience. J. Mark. 2002, 66, 1–17. [Google Scholar] [CrossRef]
- Calonge, D.S.; Shah, M.A.; Riggs, K.; Connor, M.; Wang, S. MOOCs and upskilling in Australia: A qualitative literature study. Cogent Educ. 2019, 6, 1687392. [Google Scholar] [CrossRef]
- Yeo, V.C.S.; Goh, S.K.; Rezaei, S. Consumer experiences, attitude and behavioral intention toward online food delivery (OFD) services. J. Retail. Consum. Serv. 2016, 35, 150–162. [Google Scholar] [CrossRef]
- Chowdhury, R. Impact of perceived convenience, service quality and security on consumers’ behavioural intention towards online food delivery services: The role of attitude as mediator. SN Bus. Econ. 2023, 3, 29. [Google Scholar] [CrossRef]
- Wang, C.; Liu, T.; Zhu, Y.; Wang, H.; Wang, X.; Zhao, S. The influence of consumer perception on purchase intention: Evidence from cross-border E-commerce platforms. Heliyon 2023, 9, e21617. [Google Scholar] [CrossRef]
- Jebarajakirthy, C.; Shankar, A. Impact of online convenience on mobile banking adoption intention: A moderated mediation approach. J. Retail. Consum. Serv. 2020, 58, 102323. [Google Scholar] [CrossRef]
- Duarte, P.; Silva, S.C.E.; Ferreira, M.B. How convenient is it? Delivering online shopping convenience to enhance customer satisfaction and encourage e-WOM. J. Retail. Consum. Serv. 2018, 44, 161–169. [Google Scholar] [CrossRef]
- Chang, Y.W.; Polonsky, M.J. The influence of multiple types of service convenience on behavioral intentions: The mediating role of consumer satisfaction in a Taiwanese leisure setting. Int. J. Hosp. Manag. 2011, 31, 107–118. [Google Scholar] [CrossRef]
- Al-Khaldi, M.A.; Wallace, R.O. The influence of attitudes on personal computer utilization among knowledge workers: The case of Saudi Arabia. Inf. Manag. 1999, 36, 185–204. [Google Scholar] [CrossRef]
- Oh, S.H.; Kim, Y.M.; Lee, C.W.; Shim, G.Y.; Park, M.S.; Jung, H.S. Consumer adoption of virtual stores in Korea: Focusing on the role of trust and playfulness. Psychol. Mark. 2009, 26, 652–668. [Google Scholar] [CrossRef]
- Fazio, R.H.; Zanna, M.P. Direct experience and Attitude-Behavior consistency. In Advances in Experimental Social Psychology; Elsevier: Amsterdam, The Netherlands, 1981; pp. 161–202. [Google Scholar] [CrossRef]
- Kanthawongs, P.; Kanthawongs, P. Individual and social factors affecting student’s usage intention in using learning management system. Procedia-Soc. Behav. Sci. 2013, 88, 89–95. [Google Scholar] [CrossRef]
- Althunibat, A. Determining the factors influencing students’ intention to use m-learning in Jordan higher education. Comput. Hum. Behav. 2015, 52, 65–71. [Google Scholar] [CrossRef]
- Mohammadi, H. Social and individual antecedents of m-learning adoption in Iran. Comput. Hum. Behav. 2015, 49, 191–207. [Google Scholar] [CrossRef]
- Park, S.Y.; Nam, M.; Cha, S. University students’ behavioral intention to use mobile learning: Evaluating the technology acceptance model. Br. J. Educ. Technol. 2011, 43, 592–605. [Google Scholar] [CrossRef]
- Nguyen, V.K.L.; Le, T.M.H.; Duong, T.N.M.; Nguyen, T.S.; Le, T.T.H.; Nguyen, T.T.H. Assessing Student’s adoption of E-Learning: An integration of TAM and TPB framework. J. Inf. Technol. Educ. Res. 2022, 21, 297–335. [Google Scholar] [CrossRef]
- Aydin, G. Adoption of gamified systems: A study on a social media gamification website. Int. J. Online Mark. (IJOM) 2015, 5, 18–37. [Google Scholar] [CrossRef]
- Batra, R.; Ahtola, O.T. Measuring the hedonic and utilitarian sources of consumer attitudes. Mark. Lett. 1991, 2, 159–170. [Google Scholar] [CrossRef]
- Zhu, H.; Wang, Q.; Yan, L.; Wu, G. Are consumers what they consume?—Linking lifestyle segmentation to product attributes: An exploratory study of the Chinese mobile phone market. J. Mark. Manag. 2009, 25, 295–314. [Google Scholar] [CrossRef]
- Yin, J.; Qiu, X. AI technology and online purchase intention: Structural equation model based on perceived value. Sustainability 2021, 13, 5671. [Google Scholar] [CrossRef]
- Lim, W.M.; Gupta, G.; Biswas, B.; Gupta, R. Collaborative consumption continuance: A mixed-methods analysis of the service quality-loyalty relationship in ride-sharing services. Electron. Mark. 2021, 32, 1463–1484. [Google Scholar] [CrossRef]
- Khan, N.A. Digitization of Cultural Heritage: Global Initiatives, Opportunities and Challenges; IGI Global: Hershey, PA, USA, 2018. [Google Scholar]
- Kim, R.; Song, H.D. Examining the influence of teaching presence and Task-Technology fit on continuance intention to use MOOCs. Asia-Pac. Educ. Res. 2021, 31, 395–408. [Google Scholar] [CrossRef]
- Wu, B.; Chen, X. Continuance intention to use MOOCs: Integrating the technology acceptance model (TAM) and task technology fit (TTF) model. Comput. Hum. Behav. 2016, 67, 221–232. [Google Scholar] [CrossRef]
- Navarro, M.M.; Prasetyo, Y.T.; Young, M.N.; Nadlifatin, R.; Redi, A.A.N.P. The Perceived Satisfaction in Utilizing Learning Management System among Engineering Students during the COVID-19 Pandemic: Integrating Task Technology Fit and Extended Technology Acceptance Model. Sustainability 2021, 13, 10669. [Google Scholar] [CrossRef]
- Yu, T.; Yu, T. Modelling the factors that affect individuals’ utilisation of online learning systems: An empirical study combining the task technology fit model with the theory of planned behaviour. Br. J. Educ. Technol. 2010, 41, 1003–1017. [Google Scholar] [CrossRef]
- Kim, M.J.; Chung, N.; Lee, C.K.; Preis, M.W. Motivations and use context in Mobile Tourism Shopping: Applying contingency and Task-Technology fit theories. Int. J. Tour. Res. 2013, 17, 13–24. [Google Scholar] [CrossRef]
- Whyte, G.; Bytheway, A.; Edwards, C. Understanding user perceptions of information systems success. J. Strateg. Inf. Syst. 1997, 6, 35–68. [Google Scholar] [CrossRef]
- Yuce, A.; Abubakar, A.M.; Ilkan, M. Intelligent tutoring systems and learning performance. Online Inf. Rev. 2019, 43, 600–616. [Google Scholar] [CrossRef]
- Li, J.; Zheng, X.; Watanabe, I.; Ochiai, Y. A systematic review of digital transformation technologies in museum exhibition. Comput. Hum. Behav. 2024, 161, 108407. [Google Scholar] [CrossRef]
- Capece, S.; Chivăran, C.; Giugliano, G.; Laudante, E.; Nappi, M.L.; Buono, M. Advanced systems and technologies for the enhancement of user experience in cultural spaces: An overview. Herit. Sci. 2024, 12, 71. [Google Scholar] [CrossRef]
- Mishra, M.; Lourenço, P.B. Artificial intelligence-assisted visual inspection for cultural heritage: State-of-the-art review. J. Cult. Herit. 2024, 66, 536–550. [Google Scholar] [CrossRef]
- Gong, Q.; Zou, N.; Yang, W.; Zheng, Q.; Chen, P. User experience model and design strategies for virtual reality-based cultural heritage exhibition. Virtual Real. 2024, 28, 69. [Google Scholar] [CrossRef]
- Zheng, F.; Wu, S.; Liu, R.; Bai, Y. What influences user continuous intention of digital museum: Integrating task-technology fit (TTF) and unified theory of acceptance and usage of technology (UTAUT) models. Herit. Sci. 2024, 12, 253. [Google Scholar] [CrossRef]
- Tyupa, S. A theoretical framework for Back-Translation as a quality assessment tool. New Voices Transl. Stud. 2011, 7, 35–46. [Google Scholar]
- Yoon, S.B.; Cho, E. Convergence adoption model (CAM) in the context of a smart car service. Comput. Hum. Behav. 2016, 60, 500–507. [Google Scholar] [CrossRef]
- Alwabel, A.S.A.; Al-Gahtani, S.S.; Talab, A. Factors Influencing the use of smartphones for programing: A structural equation modeling approach. Int. J. Innov. Technol. Manag. 2020, 17, 2050032. [Google Scholar] [CrossRef]
- Huang, Y.; Pan, L.; Wang, Y.; Yan, Z.; Chen, Y.; Hao, X.; Xia, T. Exploring the user acceptance of online interactive mechanisms for Live-Streamed teaching in Higher Education institutions. Sustainability 2023, 15, 13529. [Google Scholar] [CrossRef]
- Liu, M.; Wang, C.; Hu, J. Older adults’ intention to use voice assistants: Usability and emotional needs. Heliyon 2023, 9, e21932. [Google Scholar] [CrossRef] [PubMed]
- Rafique, H.; Almagrabi, A.O.; Shamim, A.; Anwar, F.; Bashir, A.K. Investigating the Acceptance of Mobile Library Applications with an Extended Technology Acceptance Model (TAM). Comput. Educ. 2019, 145, 103732. [Google Scholar] [CrossRef]
- Jung, T.; Bae, S.; Moorhouse, N.; Kwon, O. The effects of Experience-Technology Fit (ETF) on consumption behavior: Extended Reality (XR) visitor experience. Inf. Technol. People 2023, 37, 2006–2034. [Google Scholar] [CrossRef]
- Fu, Y.; Liang, H. Sinicized exploration of sustainable digital fashion: Chinese game players’ intention to purchase traditional costume skins. Sustainability 2022, 14, 7877. [Google Scholar] [CrossRef]
- Cheng, Y.M. How does task-technology fit influence cloud-based e-learning continuance and impact? Educ. Train. 2019, 61, 480–499. [Google Scholar] [CrossRef]
- Martins, P.; Picoto, W.N.; Bélanger, F. The effects of digital nativity on nonvolitional routine and innovative usage. Inf. Technol. People 2022, 36, 2804–2825. [Google Scholar] [CrossRef]
- Barrett, P. Structural equation modelling: Adjudging model fit. Personal. Individ. Differ. 2006, 42, 815–824. [Google Scholar] [CrossRef]
- Nunnally, J.C.; Bernstein, I.H. Psychometric Theory; McGraw-Hill Humanities/Social Sciences/Languages: Columbus, OH, USA, 1994. [Google Scholar]
- Fornell, C.; Larcker, D.F. Evaluating Structural Equation Models with Unobservable Variables and Measurement Error. J. Mark. Res. 1981, 18, 39–50. [Google Scholar] [CrossRef]
- Yoon, C.; Kim, S. Convenience and TAM in a ubiquitous computing environment: The case of wireless LAN. Electron. Commer. Res. Appl. 2006, 6, 102–112. [Google Scholar] [CrossRef]
- Chang, C.C.; Tseng, K.H.; Liang, C.; Yan, C.F. The influence of perceived convenience and curiosity on continuance intention in mobile English learning for high school students using PDAs. Technol. Pedagog. Educ. 2013, 22, 373–386. [Google Scholar] [CrossRef]
- Zhang, M.; Chen, M.; Chen, X. The Influence Factors of User Adoption Intention to University Mobile Library in China. In Proceedings of the 2019 3rd International Conference on Management Engineering, Software Engineering and Service Sciences, Wuhan, China, 12–14 January 2019; pp. 268–272. [Google Scholar] [CrossRef]
- Ali, I.; Warraich, N.F. Meta-analysis of technology acceptance for mobile and digital libraries in academic settings using technology acceptance model (TAM). Glob. Knowl. Mem. Commun. 2024. [Google Scholar] [CrossRef]
- Tao, D. Understanding intention to use electronic information resources: A theoretical extension of the technology acceptance model (TAM). AMIA Annu. Symp. Proc. 2008, 2008, 717–721. [Google Scholar]
- Ozturk, A.B.; Bilgihan, A.; Nusair, K.; Okumus, F. What keeps the mobile hotel booking users loyal? Investigating the roles of self-efficacy, compatibility, perceived ease of use, and perceived convenience. Int. J. Inf. Manag. 2016, 36, 1350–1359. [Google Scholar] [CrossRef]
- Wang, H.; Zhang, J.; Luximon, Y.; Qin, M.; Geng, P.; Tao, D. The Determinants of User Acceptance of Mobile Medical Platforms: An investigation integrating the TPB, TAM, and Patient-Centered Factors. Int. J. Environ. Res. Public Health 2022, 19, 10758. [Google Scholar] [CrossRef]
- Gefen, D.; Karahanna, E.; Straub, D. Inexperience and experience with online stores: The importance of TAM and trust. IEEE Trans. Eng. Manag. 2003, 50, 307–321. [Google Scholar] [CrossRef]
- Fazio, R.H.; Chen, J.M.; McDonel, E.C.; Sherman, S.J. Attitude accessibility, attitude-behavior consistency, and the strength of the object-evaluation association. J. Exp. Soc. Psychol. 1982, 18, 339–357. [Google Scholar] [CrossRef]
- Wu, J.F.; Chang, Y.P. Multichannel integration quality, online perceived value and online purchase intention. Internet Res. 2016, 26, 1228–1248. [Google Scholar] [CrossRef]
- Hsu, C.L.; Lu, H.P. Why do people play on-line games? An extended TAM with social influences and flow experience. Inf. Manag. 2003, 41, 853–868. [Google Scholar] [CrossRef]
- Ferdous, A.S.; Towfique, B. Consumer sentiment towards marketing in Bangladesh. Mark. Intell. Plan. 2008, 26, 481–495. [Google Scholar] [CrossRef]
- Chan, T.; Cui, G. Consumer attitudes toward marketing in a transitional economy: A replication and extension. J. Consum. Mark. 2004, 21, 10–26. [Google Scholar] [CrossRef]
- Aggarwal, D.; Sharma, D.; Saxena, A.B. Enhancing the Online Shopping Experience of Consumers through Artificial Intelligence. Int. J. Inf. Technol. Comput. Eng. 2024, 4, 1–5. [Google Scholar] [CrossRef]
- Anwar, R.; Sudarbi, M.H. Review of artificial neural networks and structural equation modeling marketing and consumer research applications. Struct. Equ. Model. Multidiscip. J. 2023, 30, 686–689. [Google Scholar] [CrossRef]
- Gu, J.; Lee, E. Evaluating packaging design relative feature importance using an artificial neural network (ANN). Appl. Sci. 2025, 15, 3261. [Google Scholar] [CrossRef]
- Valtysson, B. From policy to platform: The digitization of Danish Cultural Heritage. Int. J. Cult. Policy 2015, 23, 545–561. [Google Scholar] [CrossRef]
- Cheng, Y.M. Quality antecedents and performance outcome of cloud-based hospital information system continuance intention. J. Enterp. Inf. Manag. 2020, 33, 654–683. [Google Scholar] [CrossRef]
- Benhamou, Y.; Ferland, J. Digitization of GLAM Collections and Copyright: Policy Paper. GRUR Int. 2022, 71, 403–421. [Google Scholar] [CrossRef]
- Wang, G.; Men, D. Understanding continued use intention of digital intangible cultural heritage games through the SOR model. NPJ Herit. Sci. 2025, 13, 322. [Google Scholar] [CrossRef]
- Cheng, A.; Ma, D.; Pan, Y.; Qian, H. Enhancing museum visiting experience: Investigating the relationships between augmented reality quality, immersion, and TAM using PLS-SEM. Int. J. Hum.-Comput. Interact. 2023, 40, 4521–4532. [Google Scholar] [CrossRef]
- Wixom, B.H.; Todd, P.A. A theoretical integration of user satisfaction and technology acceptance. Inf. Syst. Res. 2005, 16, 85–102. [Google Scholar] [CrossRef]
- Okazaki, S.; Mendez, F. Exploring convenience in mobile commerce: Moderating effects of gender. Comput. Hum. Behav. 2012, 29, 1234–1242. [Google Scholar] [CrossRef]
- Tao, D.; Shao, F.; Wang, H.; Yan, M.; Qu, X. Integrating usability and social cognitive theories with the technology acceptance model to understand young users’ acceptance of a health information portal. Health Inform. J. 2019, 26, 1347–1362. [Google Scholar] [CrossRef] [PubMed]
- Chen, X.; Tao, D.; Zhou, Z. Factors affecting reposting behaviour using a mobile phone-based user-generated-content online community application among Chinese young adults. Behav. Inf. Technol. 2018, 38, 120–131. [Google Scholar] [CrossRef]
- Tao, D.; Yuan, J.; Shao, F.; Li, D.; Zhou, Q.; Qu, X. Factors affecting consumer acceptance of an online health information portal among young internet users. CIN Comput. Inform. Nurs. 2018, 36, 530–539. [Google Scholar] [CrossRef] [PubMed]
- Faqih, K.M. An empirical analysis of factors predicting the behavioral intention to adopt Internet shopping technology among non-shoppers in a developing country context: Does gender matter? J. Retail. Consum. Serv. 2016, 30, 140–164. [Google Scholar] [CrossRef]
- Rehman, S.U.; Bhatti, A.; Mohamed, R.; Ayoup, H. The moderating role of trust and commitment between consumer purchase intention and online shopping behavior in the context of Pakistan. J. Glob. Entrep. Res. 2019, 9, 43. [Google Scholar] [CrossRef]
- Talantis, S.; Shin, Y.H.; Severt, K. Conference mobile application: Participant acceptance and the correlation with overall event satisfaction utilizing the technology acceptance model (TAM). J. Conv. Event Tour. 2020, 21, 100–122. [Google Scholar] [CrossRef]
- Lin, W.S.; Wang, C.H. Antecedences to continued intentions of adopting e-learning system in blended learning instruction: A contingency framework based on models of information system success and task-technology fit. Comput. Educ. 2011, 58, 88–99. [Google Scholar] [CrossRef]
- Jiang, S.; Zhang, Z.; Xu, H.; Pan, Y. What influences users’ continuous behavioral intention in cultural heritage virtual tourism: Integrating experience economy theory and Stimulus–Organism–Response (SOR) model. Sustainability 2024, 16, 10231. [Google Scholar] [CrossRef]
Disclaimer/Publisher’s Note: The statements, opinions and data contained in all publications are solely those of the individual author(s) and contributor(s) and not of MDPI and/or the editor(s). MDPI and/or the editor(s) disclaim responsibility for any injury to people or property resulting from any ideas, methods, instructions or products referred to in the content. |
© 2025 by the authors. Licensee MDPI, Basel, Switzerland. This article is an open access article distributed under the terms and conditions of the Creative Commons Attribution (CC BY) license (https://creativecommons.org/licenses/by/4.0/).